
Abstract
Confounding any genome-scale analysis of gene expression after cerebral ischemia is massive suppression of protein synthesis. This inefficient translation questions the utility of examining profiles of total transcripts. Our approach to such postischemic gene profiling in the mouse by microarray analysis was to concentrate on those mRNAs bound to polyribosomes. In our proof-of-principle study, polysomally bound and unbound mRNAs were subjected to microarray analysis: of the 1,161 transcripts that we found to increase after ischemia, only 36% were bound to polyribosomes. In addition to the expected increases in heat-shock proteins and metallothioneins, increases in several other bound transcripts involved in the promotion of cell survival or antiinflammatory behavior were noted, such as CD63 (Lamp3), Lcn2 (lipocalin-2), Msn (moesin), and UCP2 (uncoupling protein 2), all of which showed increases in cognate protein by Western blotting. The list of heretofore nonfunctionally annotated transcripts (RIKEN clones/ESTs) that increased appeared to be novel. How some transcripts are selected in ischemic brain for translation into protein, while others are rejected, is not clear. The length of the 5′-UTR in the ischemically induced transcripts that occur in the NCBI RefSeq database did not indicate any general tendency to be more than 200 nt, nor to be longer than the 5′-UTRs of the unbound transcripts. Thus, the presence of a complex 5′-UTR region with internal ribosome entry sites (IRES) or polypyrimidine tracts (TOP) does not appear to be the basis of selection for translation in ischemic brain.
Keywords
Confounding any genome-scale analysis of gene expression after cerebral ischemia is the fact that such an insult causes massive suppression of protein synthesis (Hossmann, 1993; Degracia et al., 2002; Paschen, 2003). A profound decrease in amino-acid incorporation into protein has been documented that may be only temporary after mild transient focal cerebral ischemia (Hermann et al., 2001), but can continue for many hours after more severe ischemia (Althausen et al., 2001). After global cerebral ischemia, persistent inhibition of protein synthesis is regarded as an indicator of cells doomed to die (Hossmann, 1993; Degracia et al., 2002; Paschen, 2003). The decreased synthetic capacity appears to result from an inhibition of cap-dependent translation (Degracia et al., 2002; Paschen, 2003) accompanied by dissociation of polyribosomes in ischemic brain (Cooper et al., 1977; Morimoto and Yanagihara, 1981; Martín de la Vega et al., 2001). This context of suppressed translation leaves in question the utility of examining profiles of ischemically induced changes in total transcripts where such increased mRNAs may not subsequently be productively translated. Numerous reports of genome-wide profiling of transcripts have appeared that indicate changes in several hundred mRNAs, principally after focal cerebral ischemia in the rat, (Soriano et al., 2000; Bates et al., 2001; Keyvani et al., 2002; Kim et al., 2002; Rao et al., 2002; Tang et al., 2002; Vemuganti et al., 2002; Lu et al., 2003; Roth et al., 2003; Schmidt-Kastner et al., 2003) but also after global ischemia (Jin et al., 2001). Despite the recent popularity of the mouse in the experimental stroke field, there have been relatively few reports on gene profiling in ischemic mouse brain (Trendelenburg et al., 2002; Hayashi et al., 2003). Whether all of these rodent mRNAs are translated is unknown, but unlikely due to phosphorylation and degradation of initiation factors in the translation apparatus. This is perhaps caused by an ischemically induced perturbation of the endoplasmic reticulum called the unfolded protein response (Althausen et al., 2001; Kumar et al., 2001; Martín de la Vega et al., 2001; Degracia et al., 2002; Paschen, 2003).
In our approach to such postischemic gene profiling by microarray analysis, we wished to focus our attention on those transcripts that were being translated, therefore we concentrated on those mRNAs bound to polyribosomes in ischemic brain. Such an approach is termed translation-state analysis and may be regarded as better portraying the functional outcome of increased gene expression (Zong et al., 1999; Pradet-Balade et al., 2001). Such an approach has been used in other situations of stress-induced inhibition of protein synthesis such as viral infection (Johannes et al., 1999) and tumor-suppressor overexpression (Galban et al., 2003), and also to study drug-induced inhibition of translation (Grolleau et al., 2002). For the first time we used the National Institutes of Aging (USA) mouse 15K-clone set in a microarray study on ischemic mouse brain and found that only 30% to 40% of the transcripts that increased in the ischemic hemisphere after middle cerebral artery occlusion were associated with polyribosomes.
MATERIALS AND METHODS
A local committee of the Canadian Council on Animal Care approved all procedures using mice. The C57B mice were purchased from Charles River Canada (St-Constant, PQ). Under temporary isoflurane anesthesia, the mice (20 to 23 g) were subjected to occlusion of the left middle cerebral artery using an intraluminal filament as previously described (MacManus et al., 1999). After 1 hour of ischemia, the animals were briefly reanesthetized, the filament was withdrawn, and wounds were sutured. Regional blood flow in the ischemic hemisphere was shown to be restored to normal by laser Doppler flowmetry.
Preparation of Homogenates and Polyribosome Fractionation
Our isolation of polyribosomes from mouse brain was based on Meyuhas et al. (1996). After 20 hours of reperfusion, mice were briefly anesthetized with isoflurane, and the brain was rapidly excised and dissected on ice. Contralateral and ischemic hemispheres from one mouse were manually homogenized with 5 strokes using a 2-mL Wheaton mortar and pestle in 3 vol/wt of cold lysis buffer (340 mmol/L sucrose, 50 mmol/L Tris-HCl, pH 7.4, 25 mmol/L NaCl, 5 mmol/L MgCl2, 100 μg/mL cycloheximide, 1 mmol/L DTT, 80 U/mL rRNasin (Promega, Madison, WI, U.S.A.), 1% (vol/vol) Triton X-100, 1% (wt/vol) sodium deoxycholate). This was followed by another five strokes with a power stirrer at 1200 rpm. The crude homogenate was centrifuged 10 minutes at 1,000 g, and the supernatant (S1) was retained on ice. The pellet was resuspended in another 3 vol/wt of lysis buffer and again homogenized with five strokes at 1,200 rpm. The homogenate was centrifuged for 10 minutes at 1,000 g to sediment cell debris. The supernatant (S2) was added to S1 and the pooled mixture was centrifuged at 10,000 g for 10 minutes to sediment mitochondria. The postmitochondrial supernatant (PMS) was then centrifuged at 30,000 g for 10 minutes to remove detergent-insoluble high molecular weight material. The clarified PMS was retained on ice before being loaded onto sucrose gradients.
Fifteen A254 units of the clarified PMS were layered onto a 15% to 55% wt/vol linear sucrose gradient (50 mmol/L Tris-g/mL HCl, pH 7.4, 25 mmol/L NaCl, 2 mmol/L MgCl2, 100 μ cycloheximide, 1 mmol/L DTT, 80 U/mL RNasin) and centrifuged at 218,000 g for 3 hours at 4°C in a swing-out rotor (Beckman L8-70 ultracentrifuge, Beckman Coulter, Mississauga, ON, Canada). After centrifugation, the A254 of the gradients was monitored continuously (one reading/second) from the tube-top and 1-mL fractions were collected using an Auto-Densi Flow gradient fractionator (Labconco) connected to a flow cell and a Beckman DU-600 spectrophotometer.
RNA Isolation
RNA from each 1-mL gradient fraction was isolated using Tri-Reagent LS (Sigma-Aldrich Canada, Oakville, ON, Canada) following the manufacturer's protocol, which included the substitution of chloroform for 1-bromo-3-chloropropane in order to minimize the possibility of DNA contamination. Equal volumes (2 μL) of RNA from each fraction were carried forward for reverse transcriptase-polymerase chain reaction (RT-PCR) analysis and the remaining RNA from fractions 1 to 5 (unbound mRNA) and 6 to 10 (polyribosome-bound mRNA) was pooled and ethanol precipitated. A260/280 readings were generally between 2.0 and 2.1, indicating high RNA purity. To monitor the absence of RNA degradation, RNA from individual (equal volumes) or pooled fractions (1 μg) was subjected to formaldehyde gel electrophoresis. RNA was then passively transferred to a positively charged nylon membrane (Hybond N+, Amersham Biosciences, Baie d’Urfé, PQ, Canada), ultraviolet cross-linked and stained with methylene blue. DNA contamination was undetectable by PCR using primers designed to span the intron of the β-actin gene.
RT-PCR
Equal volumes (2 μL) of RNA from each gradient fraction were reverse transcribed (First Strand cDNA synthesis kit, Amersham Biosciences) and equal volumes (1–2 μL) of cDNA from each fraction were amplified by standard PCR using mouse-specific primers (5′ to 3′ forward and reverse) for β-actin (AACACCCCAGCCATGTACGTAG and GTGTTG-GCATAGAGGTCTTTACGG), Hsp68 (ATCACCATCAC-CAACGACAA and GGCCTCTAATCCACCTCCTC).
Microarray Analysis
Array experiments were performed on three different biological samples in duplicate with dye-flip using equal amounts of RNA (5 μg). A laboratory reference total RNA (isolated by Tri-Reagent, Sigma-Aldrich) was purified from 20 pooled brains of normal C57B mice. RNA from individual polyribosome density gradient fractions was also isolated by Tri-Reagent. Fractions were collected from 3 to 4 individual gradients (equivalent to 3 to 4 mice) and fractions 1 to 5 (unbound) and fractions 6 to 10 (bound) were pooled and ethanol-precipitated to obtain 4 RNA populations: unbound contralateral, unbound ischemic, bound contralateral (bCT), and bound ischemic (bIS). RNA was quantitated by spectrophotometry and integrity was assessed by agarose gel electrophoresis and RT-PCR. The RNA was reverse transcribed and labeled with Cy3 or Cy5 dye (Amersham Biosciences) using an indirect labeling protocol. Briefly, RNA (5 μg) from reference or either bound or unbound fractions was spiked with Arabidopsis thaliana internal control RNA (5 ng) and reverse transcribed at 42°C for 2 hours using 150 pmol of anchored oligo(dT) primer (5′ -T20VN), 400 U of SuperScriptII reverse transcriptase (Invitrogen), rRNAsin (Promega), 20 mmol/L dNTP(–dTTP), 2 mmol/L dTTP, and 2 mmol/L of amino allyl-dUTP (Sigma-Aldrich). mRNA template was then hydrolyzed with 1N NaOH. The solution was neutralized with HEPES and the amino allyl-modified cDNA was purified using a Microcon-30 centrifugal filter (Millipore). Sodium bicarbonate (pH 9.0) was then added to the purified cDNA along with an excess of NHS-Cy3/5 dye. The reaction between the NHS-ester moiety of the cyanine dye and the amino allyl-dUTP incorporated into the cDNA was allowed to proceed in the dark at room temperature for 1 hour. Unreacted dye was then removed using QiaQuick glass-wool spin columns (Qiagen, Mississauga, ON, Canada). Labeling efficiency was assessed by electrophoresis and spectrophotometry (1% to 2% Cy3/5 incorporation). The eluted Cy3/5-labeled cDNA was precipitated with isopropanol, and the resulting pellet was washed in 75% ethanol and air-dried. The labeled cDNA was resuspended in DIG easyHYB hybridization buffer (Roche Diagnostics, Laval, PQ, Canada) containing tRNA and COT-1 salmon sperm DNA as blocking agents. The samples were hybridized to a 15K NIA/NIH mouse cDNA clone microarray (purchased from the Ontario Cancer Institute, Toronto, Canada) and incubated 18 to 20 hours at 37°C with gentle agitation. Slides were washed, dried, and scanned using a ScanArray slide scanner (Perkin-Elmer). Spot intensities were quantitated using QuantArray (Perkin-Elmer) and the dataset was exported to an Excel (Microsoft Corp.) spreadsheet.
Data Processing
Normalization and filtering of array data were achieved using an in-house Microsoft Excel macro (Normaliser v11.3 © NRC 2001). Flagged datapoints (e.g., low/high spot intensity, low signal/background, poor spot quality) were rejected before subarray normalization using a linear regression algorithm. Ratios of unflagged, normalized datapoints with changes compared to the reference RNA were used in subsequent data analyses. Duplicate spots were averaged and subsequently treated as single data points. Ratio combinations of four different RNA populations, i.e., bound and unbound from contra-lateral (CT) or ischemic (IS) hemispheres, were obtained by subtraction of the experimental log2 ratios where the reference RNA (R) was the common denominator [e.g., log2(bIS/R) − log2(bCT/R) = log2(bIS/bCT))], where log2(bIS/bCT) represents the fold-change of bound transcripts after ischemia. The ratio combinations calculated in Excel were tested by the t-statistic for (1) significant deviation of log2(X/R) from zero, where X is any of the four RNA populations (i.e., no difference in concentration or expression between reference and the four RNA populations); and (2) significant deviation between two ratios for any given element/gene (e.g., between log2(bIS/R)and log2(bCT/R)). Lists of transcripts that both increased or decreased with a P < 0.05 and by 1.75-fold were assembled, then annotated using the NIA clone ID and the database at Stanford (source.stanford.edu), and the transcript description was cross-checked with the mouse UniCode build 126 (Sep 2003: ncbi.nlm.nih.gov) and with the database for functional annotation of RIKEN clones (fantom2.gsc.riken.go.jp).
Validation by Q-RT-PCR
Real-time quantitative PCR was performed using the ABI GeneAmp 5700 Sequence Detection System as described by the manufacturer (Applied Biosystems, Foster City, CA, U.S.A.). RNA was extracted from polyribosomes (fractions 6 to 10, Fig. 1) of individual ischemic animals using the Trizol reagent (Invitrogen, Burlington, ON, Canada), and pools from the ischemic and contralateral hemispheres of 3 to 4 animals were assembled. A Superscript First-Strand Synthesis System for RT-PCR (Invitrogen) kit was used for cDNA synthesis according to the manufacturer's protocol with 1 μg of RNA, and the cDNA concentration measured with a ss-DNA Oli-Green kit (Molecular Probes). The primers (5′ to 3′ forward and reverse) were designed using Primer Express software version 2.0 (Applied Biosystems): β-actin (GGCCAACCGT-GAAAAGATGA and CACAGCCTGGATGGCTACGTA); CD63 (GCTTCTAACTACACAGACTGGGAAAA and TTATGTTGATGCAGCAAGAATCG); Hsp25 (TGAAC-CACTGCGACCACTCA and GAACCATTCCGGGACTGG-TAC); Lcn2 (CAAGCAATACTTCAAAATTACCCTGTA and GCAAAGCGGGTGAAACGTT); Msn (CGAGCTGC-GGGCTGAT and CTTCTGCACACGCTCATTCTTC); Spp1 (TCTAAGGAGTCCCTCGATGTCATC and CCTTTCCGTT-GTTGTCCTGATC); Ucp2 (GCTTCTGCACCACCGTCAT and GGCCCAAGGCAGAGTTCAT). The uniqueness of the primers was verified by Blast-analysis against the mouse genome (ncbi.nlm.nih.gov). A series of PCR reactions were performed on RNA isolated from the contralateral and ischemic brain hemispheres of C57 mice in 25 μL using 2-ng input cDNA in 10 μL, 3.75 pmoles of primers (2.5 μL) and the SYBR Green PCR Master mix (12.5 μL) from QuantiTect SYBR Green PCR kit (Qiagen, Mississauga, ON, Canada). The PCR was for 40 to 45 amplification cycles with uracil removal (2 minutes at 50°C) and polymerase activation (15 minutes at 95°C). Each 2-step PCR cycle contained denaturation (15 seconds at 95°C) annealing and extension (1 minute at 60°C). To quantitate the transcript of interest, a standard curve for each primer set was generated using a twofold dilution series of cDNA generated from RNA of normal mouse brain. Triplicate data points were used for relative quantification of the specific mRNA in ischemic and contralateral hemispheres using β-actin as the endogenous normalization control.
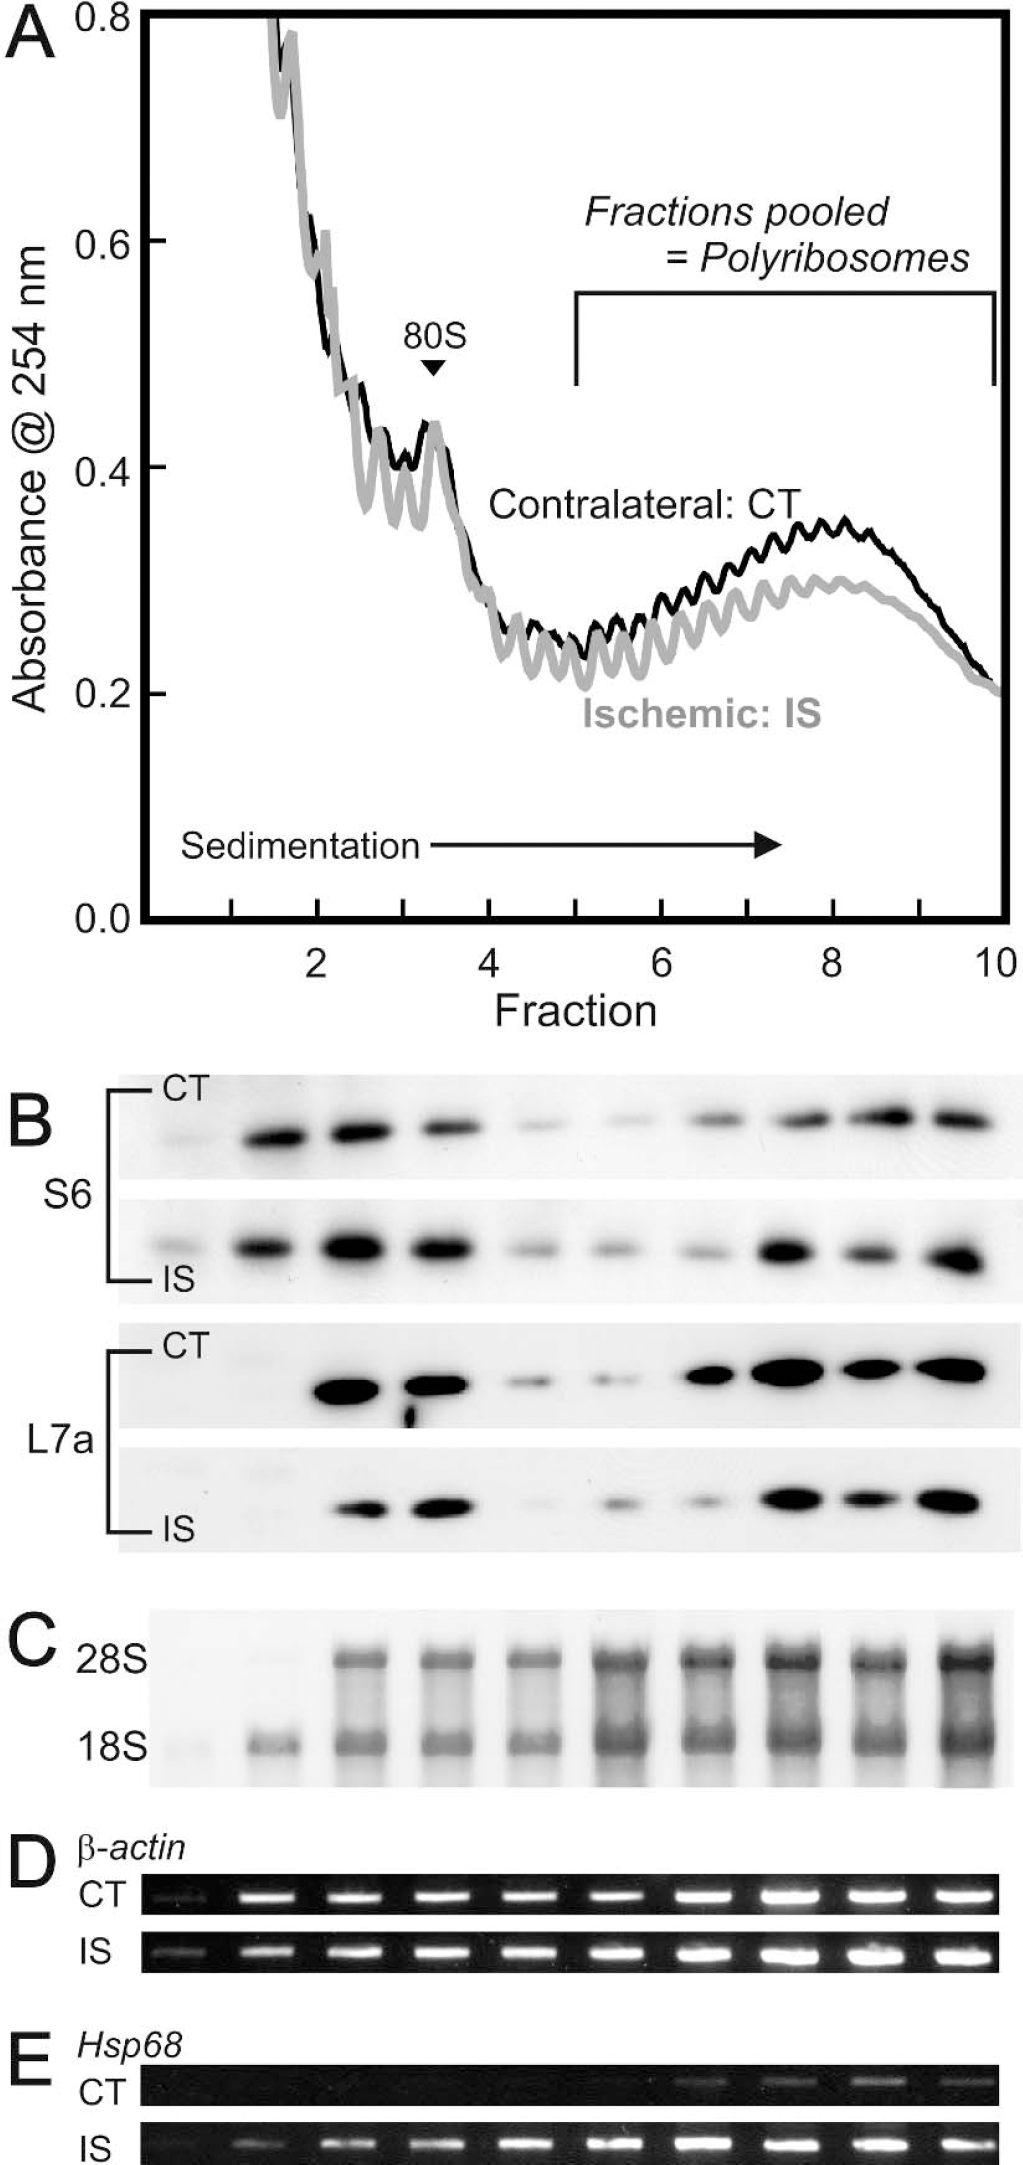
Density gradient fractionation of polyribosomes from ischemic and contralateral hemispheres of mouse brain.
Protein Detection by Western Blot
Equal volumes (25 μL) from each fraction obtained from a sucrose gradient were solubilized in sample buffer (68 mmol/L Tris-HCl pH 9, 2% sodium dodecyl sulfate, 2% B-mercaptoethanol, 0.01% bromophenol blue, and 15% glycerol) and heat denatured, followed by sodium dodecyl sulfate-polyacrylamide gel electrophoresis (12%). The immunoblots of sucrose gradient fractions for ribosomal proteins were carried out using a 1:1,000 dilution of anti-S6 (Cell Signaling, Beverley, MA, U.S.A.) or 1:15,000 anti-L7a (a gift from Dr. A Ziemiecki, University of Bern) with incubation overnight at 4°C, followed by three washes of 5 minutes each in PBS-T (0.2%). Blots were incubated with 1:5,000 goat anti-rabbit IgG:HRP conjugate (Jackson ImmunoResearch) as a secondary antibody for 1 hour at room temperature. For analysis of protein expression, equal amounts (0.25 or 0.5 A280 units) of PMS, or total homogenate in the case of UCP2, were solubilized in sample buffer and separated by sodium dodecyl sulfate-polyacrylamide gel electrophoresis (8 or 12%) (nonreducing for CD63). Proteins were transferred to a 0.45-μm nitrocellulose membrane (BioRad, Mississauga, ON, Canada) by wet transfer (100 V, 1 hour); blots examined for the presence of CD63 or Spp-1 were transferred using a 0.2-μm PVDF membrane (BioRad). All membranes were blocked in phosphate-buffered saline containing 0.2% Tween and 5% nonfat dry milk for 1 hour. Immunoblots of PMS from the hemispheres of individual ischemic mice were probed with diluted antisera against either Hsp25 (1: 10,000, Stressgen Biotechnologies, BC, Canada), lipocalin/24p3 (1:2500, Chu et al., 2000), moesin (1:7,500 Jeon et al., 2002) or UCP2 (1: 2,000, Horvath et al., 1999), using 1:5,000 of goat anti-rabbit IgG:HRP (Jackson ImmunoResearch) as a secondary antibody. Alternatively, immunoblots were performed for Spp-1/osteopontin (1:1,000, R&D Systems Inc., Minneapolis, MN, USA) with 1:5,000 of donkey anti-goat IgG:HRP (Jackson ImmunoResearch) as a secondary antibody; or for CD63 (1:5000, PharMingen Clone AD1, BD Biosciences, ON, Canada) with use of 1:15,000 of goat anti-mouse IgG:HRP (Jackson ImmunoResearch). Reblotting of membranes with anti-β-actin (1:15,000) (ICN Biomedicals, Aurora, ON, Canada), or with anti-Hsp 60 (1:5,000) (Stressgen) in the case of UCP2 was used to ensure equal loading of cytoplasmic or mitochondrial extracts. Chemiluminescent detection was performed using the ECL plus kit (Amersham). Blots were exposed to film and scanned using a densitometer (Molecular Probes, model 300A). Band densities were quantified using ImageQuant software (Amersham Biosciences Corp.).
RESULTS AND DISCUSSION
The result of a typical isolation of polyribosomes by density gradient centrifugation from the contralateral and ischemic mouse brain hemispheres at 20 hours of reperfusion is shown in Fig. 1A. Individual fractions were monitored by Western blotting and the fractions 6 to 10 containing the heaviest particles were shown to contain the small and large ribosomal subunit proteins S6 and L7a, respectively (Fig. 1B), and also both 18S and 28S ribosomal RNA (Fig. 1C). We have confirmed the finding of profound dissociation of polyribosomes at 3 hours of reperfusion (not shown) (Cooper et al., 1977; Morimoto and Yanagihara, 1981), and although there was a tendency for there to be less polyribosomal material in the ischemic hemisphere at 20 hours of reperfusion, the majority of polyribosomes appeared to have reassembled by this time. As a final validation of our separation method, the presence of several mRNAs in fractions 6 to 10 was shown by RT-PCR; for example β-actin showed no significant change in transcript distribution after ischemia (Fig. 1D), whereas the well-known ischemically induced Hsp68 showed a large increase in the heavier fractions from the ischemic hemisphere (Fig. 1E). For all of our subsequent studies on gene expression, we designated mRNAs assayed in fractions 6 to 10 as bound to polyribosomes, and mRNA's in fractions 1 to 5 as unbound.
Microarray Analysis
At 20 hours of reperfusion, analysis of our 6 replicate measurements using equal amounts of RNA from ischemic and contralateral hemispheres showed that of the 15,600 clones on the NIA mouse cDNA microarray, close to 2,100 changed (up and down in combined bound and unbound fractions) significantly (P < 0.05) in the ischemic compared to the contralateral hemisphere. Of the 1,161 bound and unbound transcripts that we found to increase after ischemia, only 36% were bound to polyribosomes. This confirmed our suspicion that many ischemically induced transcripts were not efficiently translated. The public databases UniGene, LocusLink, and Homologene (NCBI) were queried using the NIA clone ID via Source (source.stanford.edu), and those clones with unique UniGene IDs (build 126, Sep ‘03) were further divided into two groups, those with descriptive/functional annotation and those with RIKEN/EST clone annotation. There were several circumstances that reduced the numbers of interesting polyribosome-bound transcripts in the 387 that were found to increase: many spots contained different transcripts such as several clones overlapping the same transcript, which was at least useful additional replication of data, but many other clones remained unannotatable using the current database information. Because we were interested in translated transcripts, we focused on the ischemically induced polyribosome-bound unique mRNAs and list in Tables 1 and 2 the reduced dataset of those with a 1.75-fold increase compared to the nonischemic hemisphere. This list contains 71 individual genes consisting of 41 transcripts with functional description (Table 1) and 30 annotated as RIKEN clones or ESTs (Table 2). Please note the use of the convention log2(fold increase) of ischemic versus contralateral hemisphere in Tables 1 and 2.
Increased polyribosome-bound functionally annotated transcripts at 20 hours of reperfusion
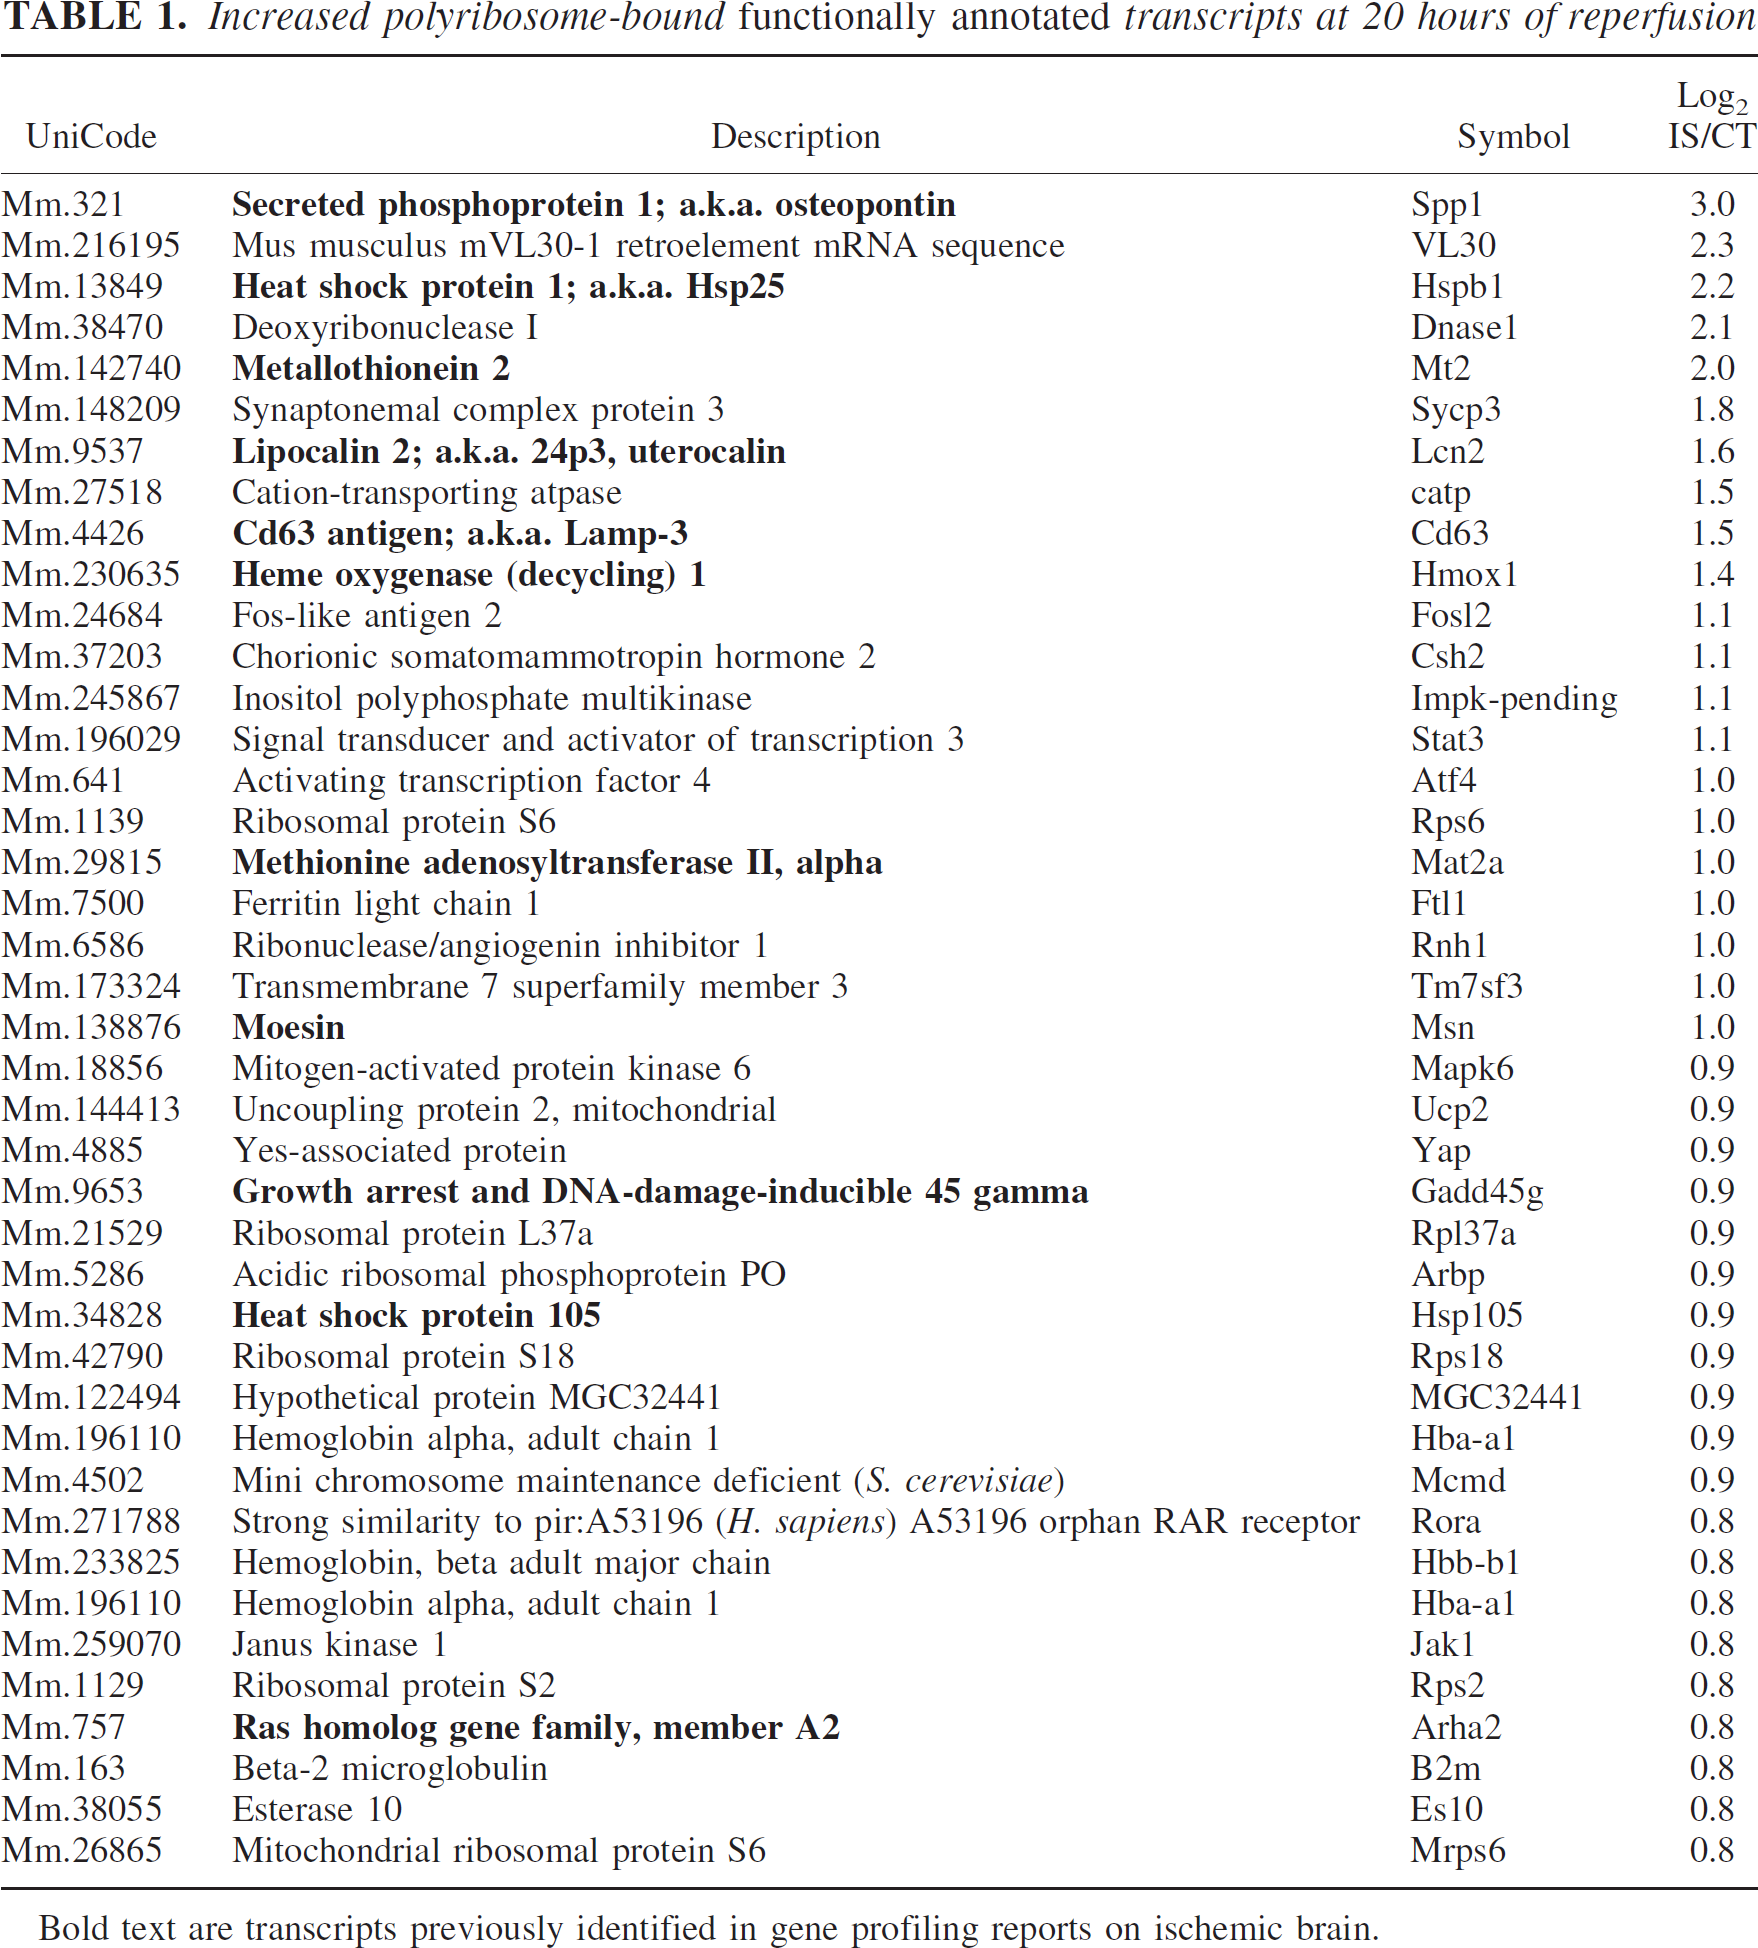
Bold text are transcripts previously identified in gene profiling reports on ischemic brain.
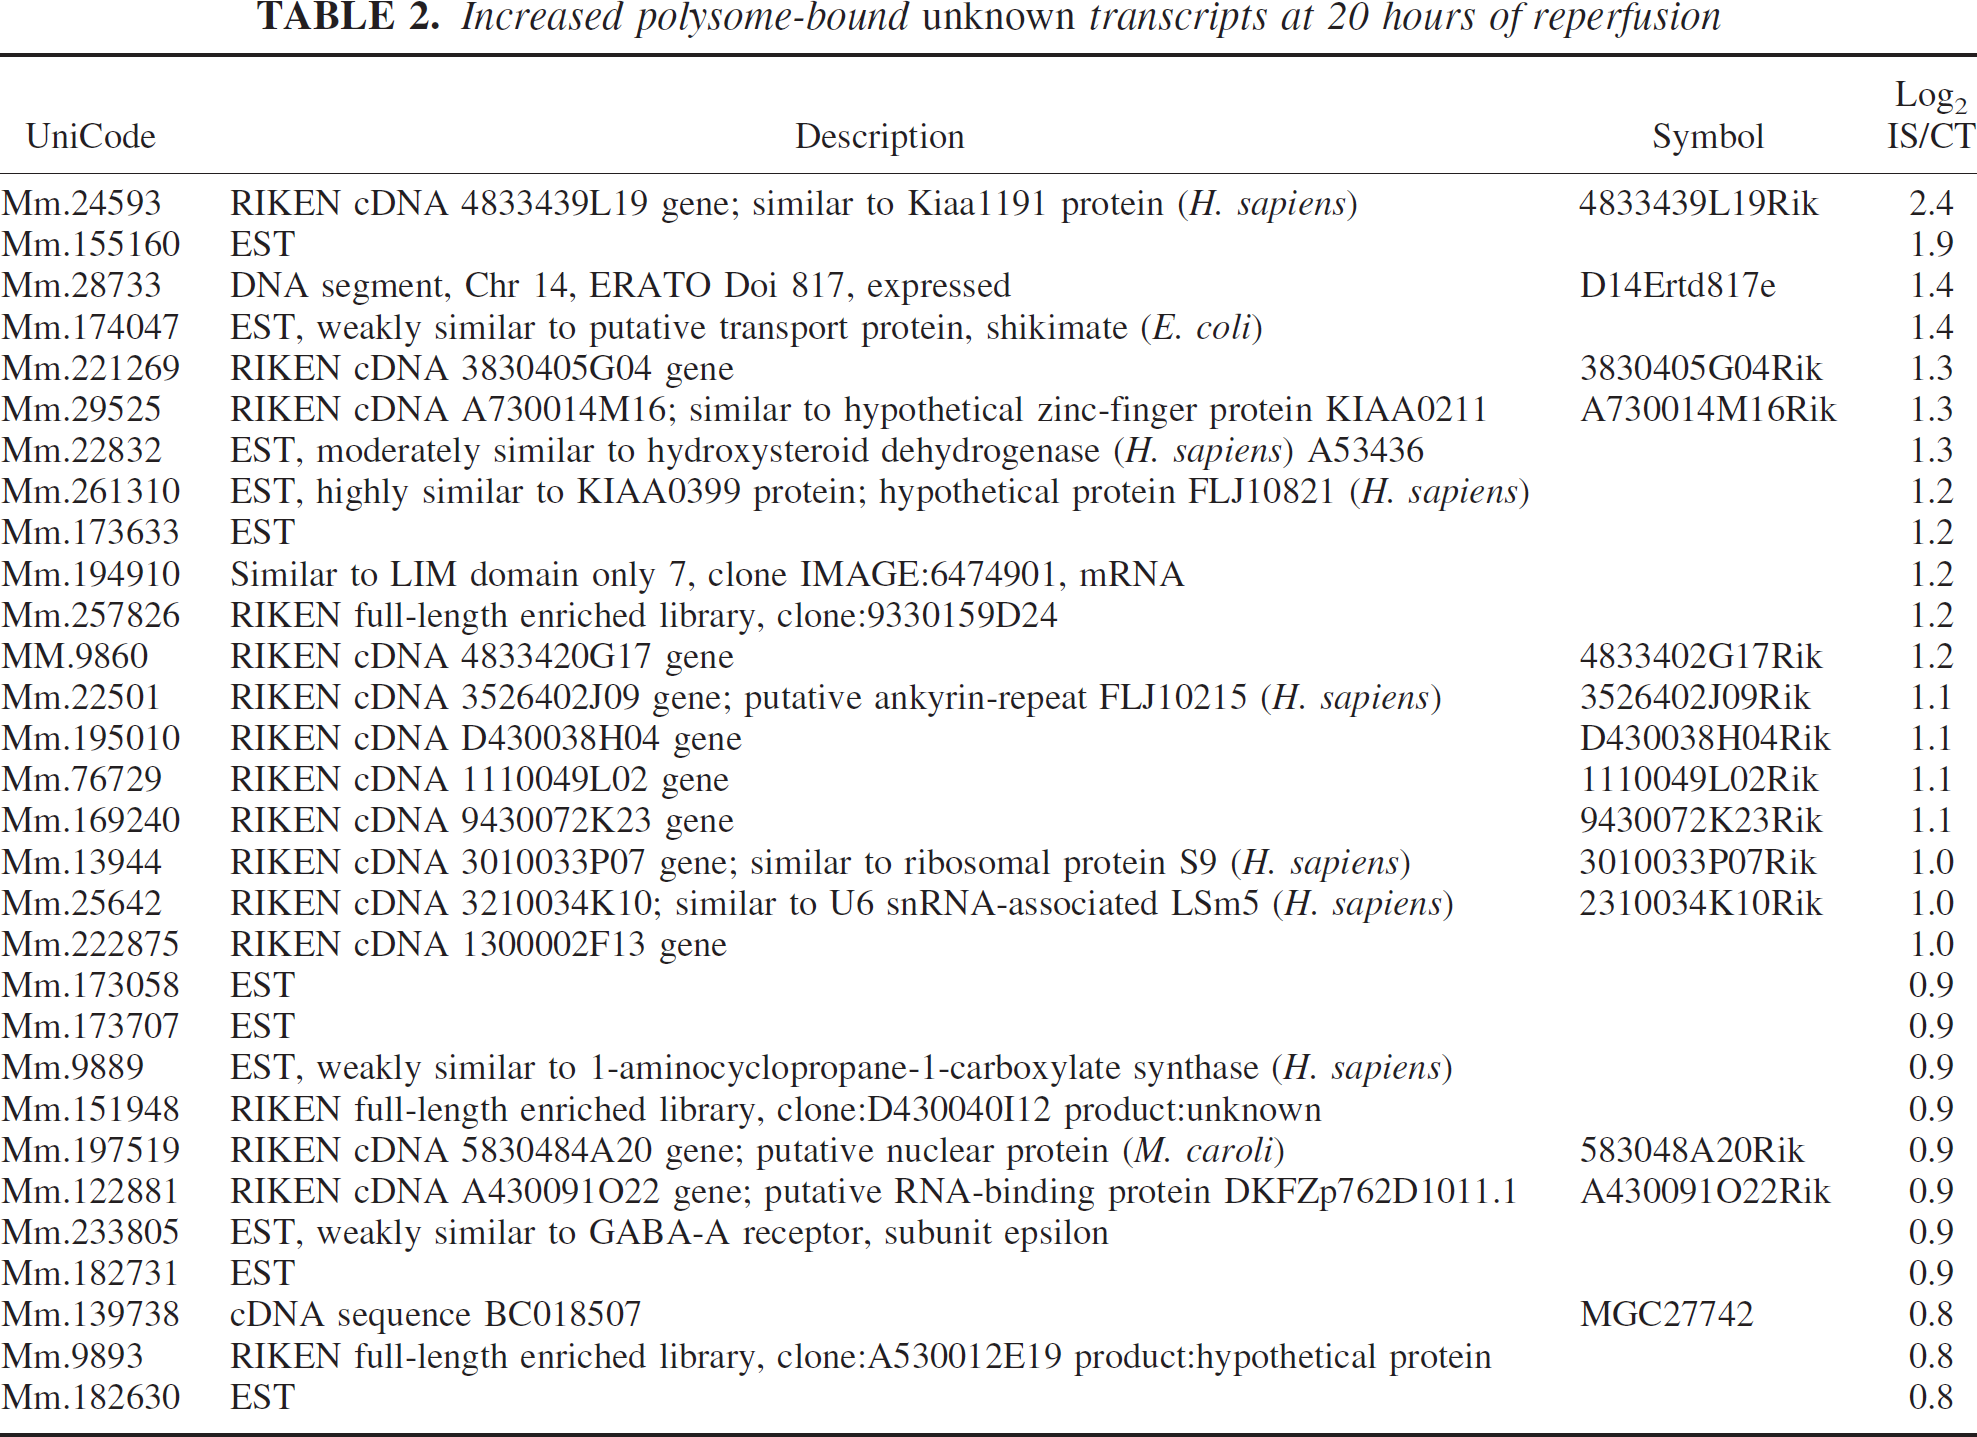
Increased polysome-bound unknown transcripts at 20 hours of reperfusion
At first glance, it was reassuring to see that of the functionally described transcripts, Spp1 (800% increase), Hsp25 and Mt2 (400% increase), Lcn2, CD63, and Hmox1 (300% increase), Mat2a, Msn, Gadd45g, Hsp105, and Arha2 (200% increase) have been noted to increase in several other genome-wide expression-profiling studies of focally ischemic rodent brain (Bates et al., 2001; Rao et al., 2002; Tang et al., 2002; Trendelenburg et al., 2002; Vemuganti et al., 2002; Hayashi et al., 2003; Lu et al., 2003; Roth et al., 2003; Schmidt-Kastner et al., 2003). In addition to increased mRNA levels, further validation from the experimental-stroke literature of increases are presented in Table 1. These results are from detailed studies on individual genes, such as the heat-shock proteins Hsp1 (also known as Hsp25) (Plumier et al., 1997; Currie et al., 2000), Hmox1 (also known as Hsp-32) (Koistinaho et al., 1996; Nimura et al., 1996) and Hsp105 (Yagita et al., 2001); Gadd45 (Jin et al., 1996; Hou et al., 1997; Charriaut-Marlangue et al., 1999); Jak1 and Stat3 (Justicia et al., 2000; Takagi et al., 2002); Mt2 (Trendelenburg et al., 2002); and Spp1 (also known as osteopontin) (Wang et al., 1998).
In Table 1, we add to the list of heat-shock proteins and metallothioneins several other postischemic transcripts that are also known to be involved in stress responses, the promotion of cell survival, or antiinflammatory behavior. First, the mouse Lcn2 transcript encodes lipocalin-2, a member of a lipid and ion transport protein family, which has many synonyms in mouse: 24p3, SIP24, uterocalin; in rat: α2-microglobulin-related protein; and human, neutrophil gelatinase-associated lipocalin (NGAL) (reviewed in Yang et al., 2003). Lipocalin-2 is considered to have antiinflammatory properties in involuting or damaged tissues found in conditions such as postpartum uterus and postweaning mammary gland (Ryon et al., 2002), or experimental glomerulonephritis (Pawluczyk et al., 2003). Second, the mouse CD63 transcript encodes a universally expressed tetraspanin membrane glycoprotein, also known as Lamp-3 (lysosomal-associated membrane protein), whose function remains unknown (reviewed in Berditchevski, 2001). CD63 is expressed in cytoplasmic granules or lysosomes of resting platelets, basophils, eosinophils, macrophages, and neutrophils, and moves to the surface to be linked to integrins after cellular activation. Increased CD63 has been found on the surface of human endothelial cells and apoptotic neutrophils (Beinert et al., 2000; Kobayashi et al., 2000). Taken as a marker of platelet activation in stroke patients, persistent elevation of CD63 in blood was suggested to be a good predictor for stroke recurrence (Marquardt et al., 2002). Third, the mouse transcript Msn encodes moesin, an ERM (exrinradixinmoesin) protein that is considered to be a structural linker and signal transducer involved in formation of actin-rich surface structures such as microvilli and filopodia (reviewed in Louvet-Vallée 2000). Moesin modulates neuritic growth cone formation and neuronal polarity (Paglini et al., 1998), and is phosphorylated by Rho kinase in response to glutamate (Jeon et al., 2002). Although already listed as increased after cerebral ischemia, the Lcn2, CD63 (Trendelenburg et al., 2002), and Msn (Tang et al., 2002; Trendelenburg et al., 2002) transcripts had not been validated in the previous studies. We therefore undertook further analysis by Q-PCR and obtained antisera to perform Western blotting (see below). Also of interest to us was the increase in the mouse Ucp2 transcript, which encodes a member of the mitochondrial uncoupling protein family responsible for controlling proton energy gradients and consequent generation of reactive oxygen species (reviewed in Argilés et al., 2002). Increases in Ucp2 have been reported in neuronal injury after transection of the perforant pathway in an inverse relationship with activation of the apoptotic cascade (Bechmann et al., 2002), and to be involved in neuroprotection after focal ischemia (Mattiasson et al., 2003).
In contrast to the massive injury response listed above that involves increased translation of heat-shock and antioxidant proteins, antiinflammatory agents, and kinase signaling systems, we found surprisingly few transcripts that were clearly associated with increased cell death. However, we did find postischemic increases in previously unreported pro-death transcripts such as DNAse I, Yap, and B2m (Table 1). Yap encodes the Yes-associated protein, which is involved in the transcriptional machinery of the proapoptotic p53 and p73 proteins (Basu et al., 2003). B2m encodes β2-microglobulin, a member of the immunoglobulin superfamily with proapoptotic properties in a wide variety of cells (e.g., Wu et al., 2002; Gordon et al., 2003), and its transcript has been shown to increase in a brain trauma model (Morrison et al., 2000).
In examining the heretofore nonfunctionally annotated, i.e., unknown transcripts (RIKEN clones/ESTs) that increased after ischemia (Table 2), we were surprised to find that the entire list appeared to be novel. Despite the opportunity for discovery of novel postis-chemic gene expression, most published studies in ischemic brain do not report such nonfunctionally annotated transcripts, with the noted exception of two reports (Trendelenburg et al., 2002; Lu et al., 2003); however, there was no overlap with our list of unknowns. Those interested in novel gene discovery in ischemic brain should find our list of value because there is every indication that these polyribosome-bound transcripts would be translated and therefore functionally active in the ischemic brain. Furthermore, there are some expression data available on several RIKEN clones indicating that Mm.24593, 261310, 257826, and 22501 have already been found to be expressed in brain (fantom2.gsc.riken.go.jp). Hopefully in the coming few years, complete annotation of the mouse genome will push such transcripts from Table 2 into functionally annotated lists similar to Table 1.
An obvious criticism of this report is the use of only one sample time, i.e., 20 hours of reperfusion. The study is regarded as a proof-of-principle of the utility of translation-state analysis in stroke models, and therefore one time point was considered valid. As indicated above, we did confirm the massive dissociation of polyribosomes at 6 hours of reperfusion as first described many years ago (Cooper et al., 1977; Morimoto and Yanagihara, 1981). Our choice of 20 hours of reperfusion for our screen was made as being the earliest convenient time when recovery in the protein synthesis machinery occurred. In order to fully describe postischemic modulation of protein translation, a study such as ours would need to be done at several other times from 6 hours of reperfusion and indeed past our sample time of 20 hours. Most genome scale screens of ischemic brain cited in this report have, like ours, used a single sample time with the notable exception of the reports that utilized either 6 and 24 hours (Vemuganti et al., 2002); or 1 hour, 24 hours, and 21 days (Hayashi et al., 2003). In addition, a singularly thorough and comprehensive industrial scale study sampled at 1, 3, 6, and 24 hours in three separate brain areas (Roth et al., 2003). These studies show that clusters of genes are transcribed early, with other clusters increasing later. It is not suggested, nor can it be implied, that a transcript that we found unbound at our single time point of 20 hours had been and remained untranslated during the full course of ischemic injury. Until there are such comprehensive data sets on the temporal profile of mRNAs chosen for translation in ischemic brain, there is no benefit in accumulating negative data on unbound transcripts for failure to be translated at any one time point.
Gene Ontology (www.geneontology.org) is widely accepted as the standard for further annotation by provision of GO terms, which describe the cognate biological process, molecular function, and cellular location for gene products. Further annotation of the data in Tables 1 and 2 using GO terms did not add any valuable specific conclusions and is not shown for brevity. All that was concluded was that a wide variety of cellular processes are perturbed by the ischemic insult, a conclusion that has already been forwarded after other gene profiling studies of ischemic brain (Lu et al., 2003; Roth et al., 2003). Indeed, the idea of many conflicting injurious and protective pathways being activated in a life and death struggle after an ischemic insult has been promoted in several recent reviews (Hou and MacManus, 2002; Ferrer and Planas, 2003; Paschen, 2003).
Validation by Q-RT-PCR and Western Blotting
As described above, we undertook further experimental validation of the change in the polyribosome-bound transcripts CD63, Hsp25, Lcn2, Msn, Spp1, and Ucp2 by real-time quantitative PCR. The fold-change in these transcripts spanned the range 1.75- to 8-fold that we saw in Table 1. The PCR results in Fig. 2 show that all the transcripts increased significantly in the ischemic hemisphere in good agreement with the corresponding micro-array data in Table 1 over a range of fold-change. Of more practical relevance, all of these increased polyribosome-bound transcripts were translated as shown by increases by Western blotting of the cognate proteins CD63, heat-shock protein 25, lipocalin 2, moesin, osteopontin (also known as secreted phosphoprotein 1) and uncoupling protein 2 in the ischemic hemisphere (Fig. 3). The demonstration of increases at the protein level in ischemic mouse brain for CD63, lipocalin 2, moesin, and UCP2 is novel.
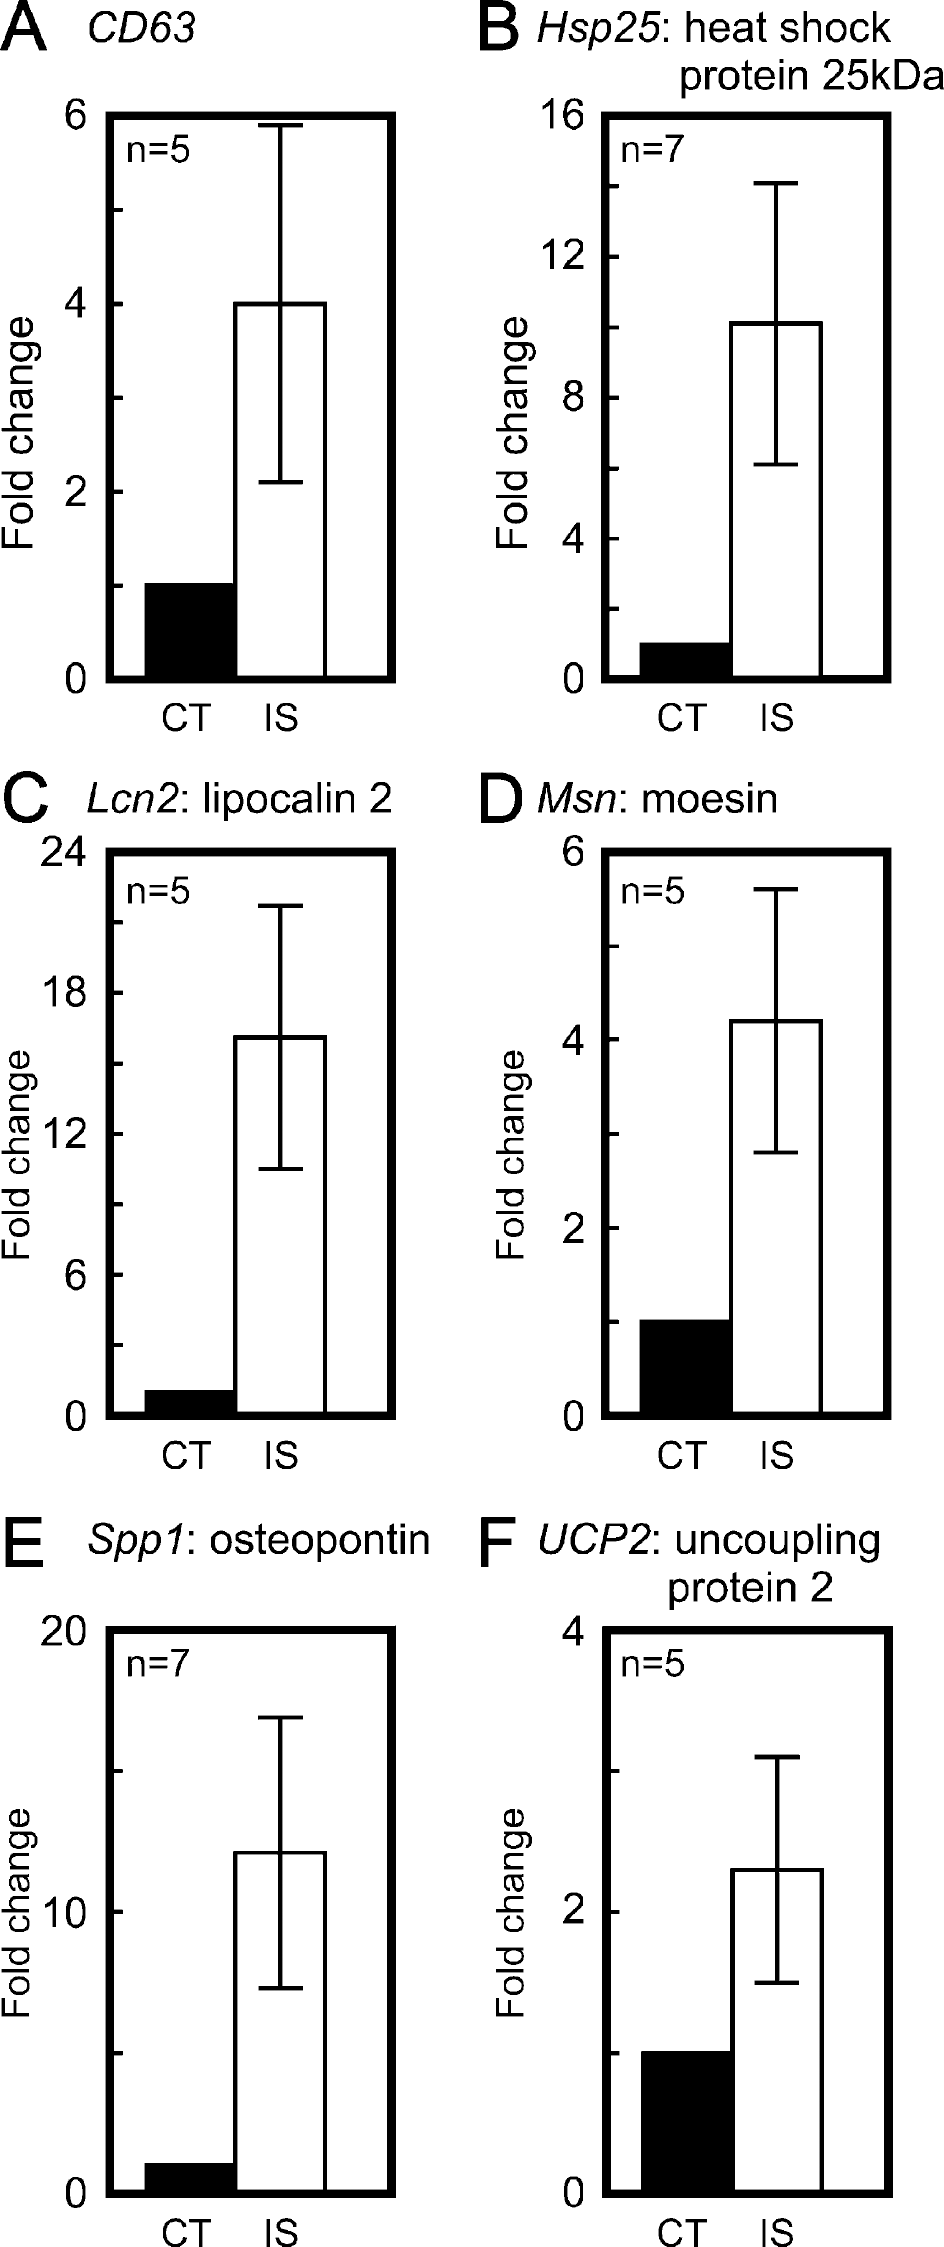
Validation of selected increased transcripts bound to polyribosomes by quantitative reverse transcriptase-polymerase chain reaction using the relative standard curve method. After 1 hour of middle cerebral artery occlusion and 20 hours of reperfusion, RNA was isolated from the polyribosome fractions of sucrose gradients as shown in Fig. 1. For each individual transcript, the fold increase in the ischemic hemisphere is indicated with respect to the contralateral hemisphere as mean ± SD with n = 5–7 of separate RNA isolates as shown in the individual panels. The increases were statistically significant in all cases (at least P < 0.01).
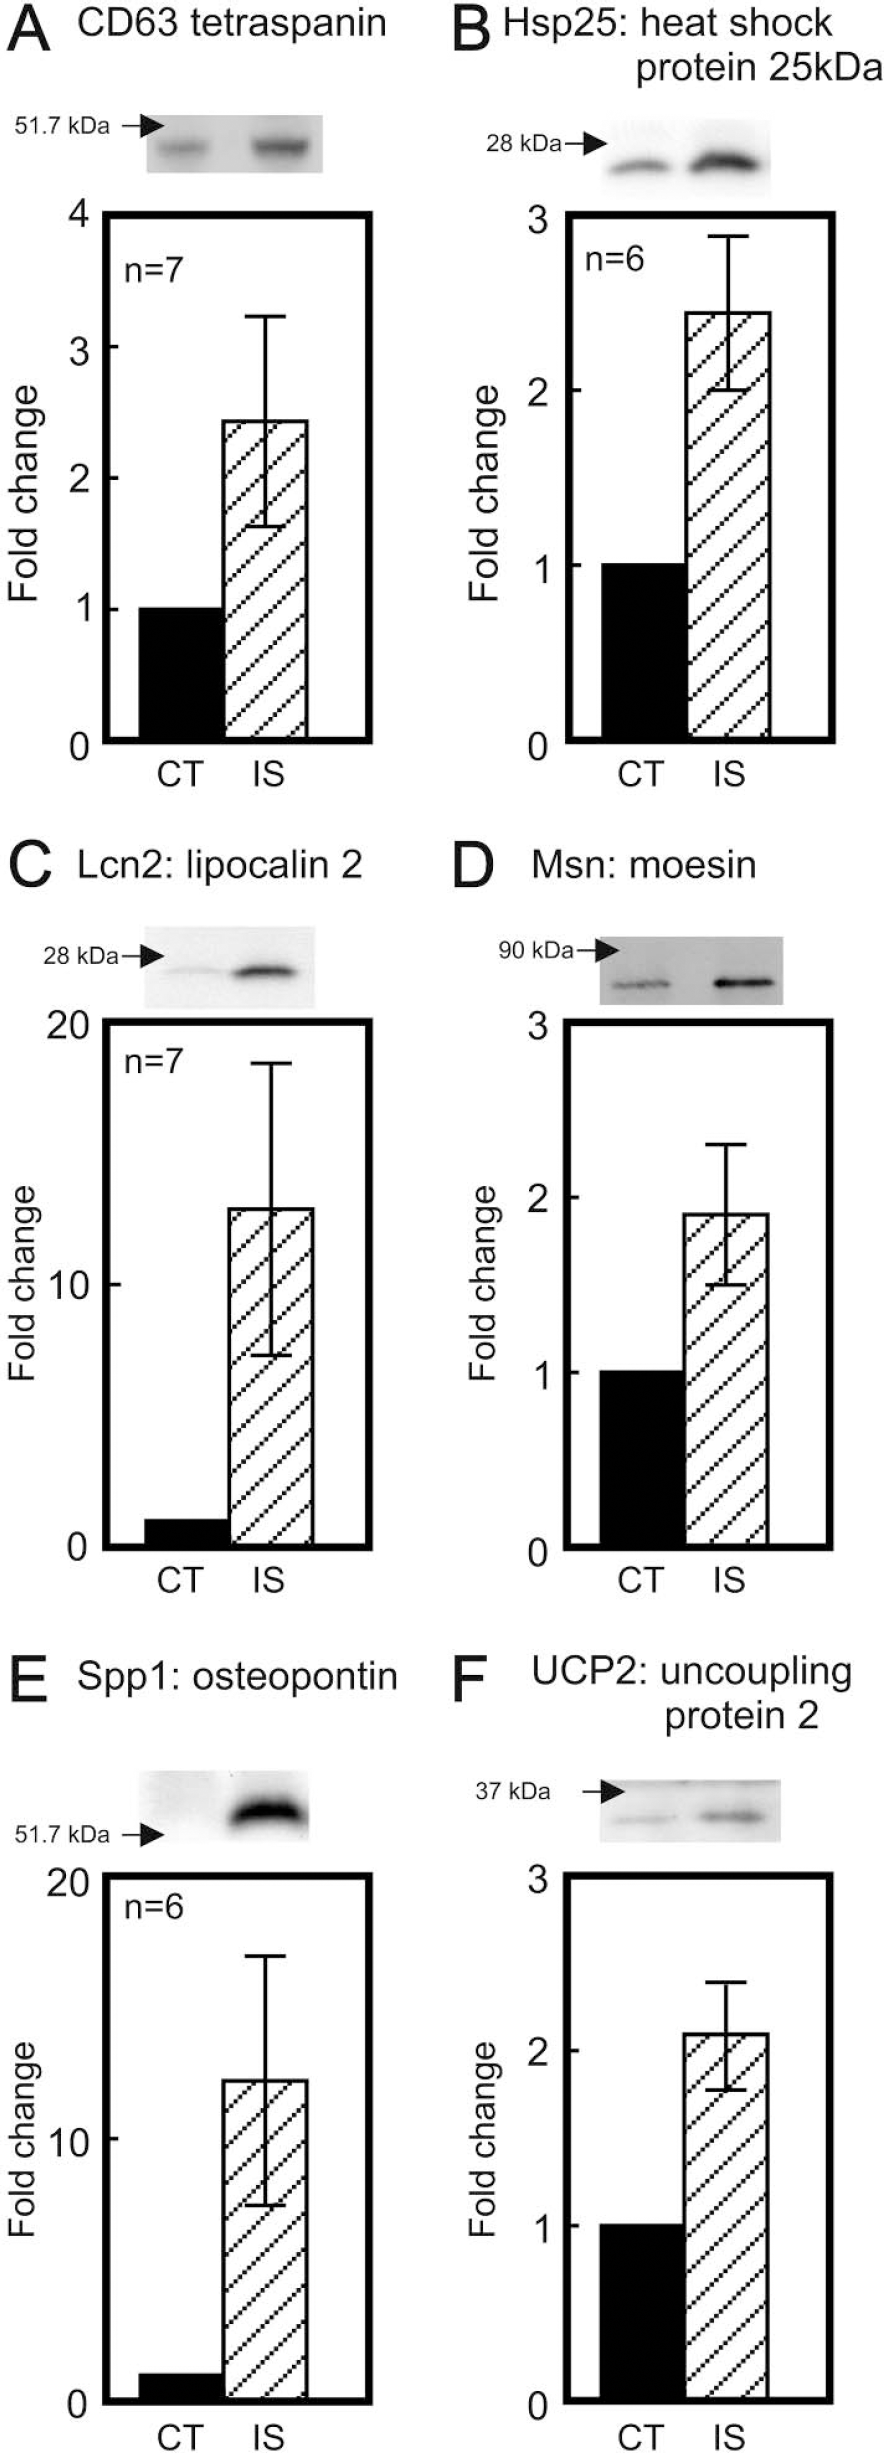
Demonstration of increased protein expression by Western blotting. After 1 hour of middle cerebral artery occlusion and 20 hours of reperfusion, proteins from the postmitochondrial supernatant (or whole homogenate for UCP2) were subjected to gel electrophoresis. For each individual protein in each panel, a typical Western blot is shown with the closest mass standard indicated with an arrow (blotting for β-actin was used to ensure equal sample loading with the exception of UCP2, where mitochondrial Hsp60 blotting was used). The densitometrically determined fold increase in the ischemic hemisphere with respect to the contra-lateral hemisphere is given as mean ± SD with n = 5–7 of separate brain homogenates as shown in the individual panels. The increases were statistically significant in all cases (at least P < 0.01).
Translational Control
An overarching question of our study is how the transcripts that end up on polyribosomes after ischemia are selected for translation. Current answers to this question in other stressful conditions invoke the structure of the 5′-upstream sequence, where lengths of more than 200 nt are found in mRNAs involved in control of cell proliferation and survival (van der Velden and Thomas, 1999; Hellen and Sarnow, 2001). Such complex 5′-UTRs can promote translation of mRNAs by several interdependent mechanisms, for example, by the presence of polypyrimidine tracts (TOP sequences), or internal ribosome entry sites (IRES) and other enhancer elements, all of which bind trans-acting RNA binding proteins to form multiprotein complexes that promote interaction with the ribosome. There are examples of such transcripts that were increased in Table 1: e.g., several ribosomal transcripts (Rps6, Rpl37a, Arbp, Rps18, Rps2, Mrps6) that generally contain TOP sequences (van der Velden and Thomas, 1999). There are approximately 50 transcripts that contain a defined cellular IRES sequence in the maintained IRES database (rangueil.inserm.fr/iresdatabase), but none of them appear in Table 1, although several IRES-containing transcripts have been shown to increase after cerebral ischemia, e.g., Arc, Hif1 (Sharp et al., 2001; Soriano et al., 2000). However, we did note (and have validated by PCR: unpublished) a postischemic increase in a VL30 retrotransposon transcript (Table 1), one of which does contain an IRES (López-Lastra et al., 1999). Finally, the well-documented ischemically induced transcript Hsp68/Hsp70 contains either a non-IRES enhancer element that promotes its translation under stressful conditions (Vivinus et al., 2001) or a most uncommon dimensional IRES (Rubtsova et al., 2003). However, an analysis of the length of the 5′-UTR in the transcripts in Table 1 that occur in the RefSeq database (ncbi.nlm.nih.gov/RefSeq) did not indicate any general tendency to be more than 200 nt, nor to be longer than the 5′-UTR length of the unbound transcripts in our study. Much further work is therefore anticipated to reach an understanding of how the ischemic brain selects transcripts for loading onto rate-limiting polyribosomes and subsequent translation into functional proteins.
CONCLUSIONS
Debate is vigorous concerning whether levels of mRNA always dictate increased levels of the encoded protein (Gygi et al., 1999; Lian et al., 2002). This is of particular concern in stress situations like cerebral ischemia, where a profound inhibition of protein synthesis has been documented (Degracia et al., 2002; Paschen, 2003). The approach used in our study to concentrate on the mRNA subset being translated on polyribosomes goes some way to meeting such concerns. We have found that a minority of transcripts that were changed after transient focal cerebral ischemia actually resided on polyribosomes. We confirmed increased productive translation of several previously reported transcripts such as heat-shock proteins and metallothionein, but also added several novel ischemically increased transcripts such as CD63/Lamp-3, lipocalin 2, moesin, and uncoupling protein 2 (Table 1), which we confirmed as being increased by Q-RT-PCR and Western blotting. Why such transcripts are selected for binding to polyribosomes while others are rejected is not clear from an analysis of the 5′-upstream sequence of such mRNAs. There is no clear evidence of complex 5′-untranslated regions including internal ribosome entry sites (IRES) or polypyrimidine tracts (TOP).
Footnotes
Acknowledgements
We thank Jack Daoust and the animal care team for provision of mice. The assistance of our colleagues in the Institute's genomics core facility was instrumental in completion of our analysis, particularly Qing Liu, Melanie Lehman, and Roy Walker. We thank Dao Ly and Marilena Ribecco for guidance in performance of Q-PCR analysis, and Erin Yoshida for help with statistical analysis. The kind gifts of antisera from Drs. S. T. Chu (lipocalin), Academica Sinica, Taiwan; T. Horvath (UCP2), Yale University; J. Park (moesin), Sungkyunkwan University, Korea; and A. Ziemiecki (L7a), University of Bern, Switzerland are gratefully acknowledged. We appreciate the discussions on occurrence of IRES and analysis of 5′-UTR length with our colleagues Martin Holcik and Stephen Baird at the University of Ottawa.