
Abstract
Understanding transcriptional changes in brain after ischemia may provide therapeutic targets for treating stroke and promoting recovery. To study these changes on a genomic scale, oligonucleotide arrays were used to assess RNA samples from periinfarction cortex of adult Sprague-Dawley rats 24 h after permanent middle cerebral artery occlusions. Of the 328 regulated transcripts in ischemia compared with sham-operated animals, 264 were upregulated, 64 were downregulated, and 163 (49.7%) had not been reported in stroke. Of the functional groups modulated by ischemia: G-protein–related genes were the least reported; and cytokines, chemokines, stress proteins, and cell adhesion and immune molecules were the most highly expressed. Quantitative reverse transcription polymerase chain reaction of 20 selected genes at 2, 4, and 24 h after ischemia showed early upregulated genes (2 h) including Narp, Rad, G33A, HYCP2, Pim-3, Cpg21, JAK2, CELF, Tenascin, and DAF. Late upregulated genes (24 h) included Cathepsin C, Cip-26, Cystatin B, PHAS-I, TBFII, Spr, PRG1, and LPS-binding protein. Glycerol 3-phosphate dehydrogenase, which is involved in mitochondrial reoxidation of glycolysis derived NADH, was regulated more than 60-fold. Plasticity-related transcripts were regulated, including Narp, agrin, and Cpg21. A newly reported lung pathway was also regulated in ischemic brain: C/EBP induction of Egr-1 (NGFI-A) with downstream induction of PAI-1, VEGF, ICAM, IL1, and MIP1. Genes regulated acutely after stroke may modulate cell survival and death; also, late regulated genes may be related to tissue repair and functional recovery.
Recent clinical trials of neuroprotective drugs for the acute treatment of stroke have failed. These included trials of sodium and calcium channel antagonists, N-methyl-D-aspartate receptor antagonists, γ-amino-butyric acid agonists, free radical scavengers, nitric oxide pathway modulators, blockers of adhesion molecules, and other drug classes (De Keyser et al., 1999; Barber et al., 2001; Albers et al., 2001; Fisher and Schaebitz, 2000). In spite of these failures, there is still optimism that pharmacologic approaches can be developed to treat acute stroke or enhance recovery (White et al., 2000). One new approach to search for targets is to perform genomic studies at different times after stroke to try to identify time-specific gene pathways or gene clusters related to specific injury or recovery processes after stroke.
DNA microarrays can assay thousands of transcripts in a single sample (Noordewier and Warren, 2001). The first brain ischemia study used custom-designed 750 gene arrays to examine RNA changes in cortex and striatum 3 h after focal ischemia (Soriano et al., 2000). Of the 24 genes regulated more than twofold, most were immediate early genes such as c-fos, NGFI-A, NGFI-C, Krox-20, and Arc (Soriano et al., 2000). Subsequent studies used oligodeoxynucleotide-based or complementary DNA (cDNA) microarrays to study RNA expression in hippocampus of rats subjected to transient global ischemia (Jin et al., 2001) and in cortex of rats at 6 h or 10 days after focal ischemia (Kim et al., 2002; Keyvani et al., 2002). A recent study combined cDNA array analysis of 74 genes with brain metabolic status studied using positron emission tomography scanning in a baboon focal cerebral ischemia model. A change in the pattern of gene expression when the cerebral metabolic rate for oxygen was reduced by 48% to 66% was suggested to serve as a molecular definition of the penumbra (Chuquet et al., 2002).
The present study used rat Affymetrix U34A oligonucleotide arrays to assess 8,740 transcripts in the periinfarction cerebral cortex at 24 h after permanent middle cerebral artery (MCA) occlusions in adult rats. Using very strict criteria, less than 4% of these transcripts were regulated, and 49.7% of these had not been reported previously. Real time reverse transcription polymerase chain reaction (RT-PCR) confirmed the expression of 20 of these genes and showed two general classes: those induced by 2 h, and hence might be targets for acute stroke therapy; and those induced at later times that could be targets for tissue repair and plasticity.
MATERIALS AND METHODS
Animal protocols were approved by the University of Cincinnati animal care committee and conform to the National Institutes of Health Guide for Care and Use of Laboratory Animals. Male Sprague-Dawley rats weighed approximately 300 g to 350 g, had unrestricted access to food and water, and were housed two per cage with a 12-h light–dark cycle.
Stroke model
The left MCA was occluded using the intraluminal filament technique (Rajdev et al., 2000; Schwarz et al., 2002). Adult Sprague-Dawley rats (n = 3) were anesthetized with isoflurane. During anesthesia, rectal temperature was monitored and body temperature was maintained at 37 ± 0.2°C with a heating blanket. The left common carotid artery, external carotid artery, and internal carotid artery were isolated via a ventral midline incision. To occlude the MCA, a 3–0 monofilament nylon suture was inserted into the external carotid artery and advanced into the internal carotid artery approximately 20 mm from the carotid bifurcation until mild resistance was felt. The wound was closed. Once animals recovered, they were returned to their home cages with food and water available ad libitum. One day later (24 h), rats were reanesthetized and killed. Sham-operated animals (n = 3) were treated like ischemic animals except that no suture was inserted into the carotid.
RNA preparation
At 24 h after cerebral ischemia, rats were reanesthetized with ketamine (100 mg/kg) and xylazine (20 mg/kg) and killed. The periinfarction cortex was dissected according to a published method in rat filament model of unilateral proximal MCA occlusion (Ashwal et al., 1998; Schwarz et al., 2002; see these articles for diagram of dissected brain region). The brain was quickly removed and cut coronally into three slices beginning 3 mm from the anterior tip of the frontal lobe in a brain matrix in a cold room. A longitudinal cut approximately 2 mm from the midline through left hemisphere in the sections was made to avoid medial hemispheric structures, which are supplied primarily by the anterior cerebral artery. Then, a transverse diagonal cut was made at approximately the “2 o'clock” position—avoiding obvious areas of infarction. The left parietal, periinfarction cortex was dissected. The parietal cerebral cortexes in ischemic 2- or 4-h rats from the same location were also dissected. The dissected brain tissues were homogenized in a Teflon–glass homogenizer with TRIzol Total RNA Isolation Reagent (Life Technology, Rockville, MD, U.S.A.). Total RNA was isolated according the manufacturer's instructions. Briefly, the brain homogenate was treated with chloroform; RNA was precipitated using isopropyl alcohol and cleaned using a RNAeasy mini kit (Qiagen Inc., Valencia, CA, U.S.A.).
GeneChip expression analysis and database search
GeneChip expression analysis was performed according to the Affymetrix expression analysis technical manual. Briefly, double-stranded cDNA was synthesized from total RNA with a high-performance liquid chromatography–purified oligo-dT primer. Biotin-labeled complementary RNA (cRNA) was synthesized from cDNA using T7 RNA polymerase and biotin-labeled ribonucleotides. The quality of the cRNA was assessed using gel electrophoresis. The cRNA was hybridized to Affymetrix U34A rat arrays (Affymetrix, Santa Clara, CA, U.S.A.). The U34A microarray was scanned with the GeneChip scanner.
The data were analyzed using Affymetrix GeneChip expression analysis software according to the Affymetrix GeneChip Analysis Suite (Tang et al., 2001). An absolute analysis reported the hybridization intensity data (average difference) and whether transcripts were present, absent, or marginal in the target from each probe array. Then, a comparison analysis was run. The patterns of change of the whole probe set were used to make a qualitative call of “Increase,” “Decrease,” “Marginal increase,” “Marginal decrease,” or “No change.” Three chips were used for each group (sham-operation and ischemia). The cross-comparisons were made between sham-operation and ischemia groups. Genes were included in the analysis only if they met all of the following criteria: they were present in all three sham or all three ischemia samples; all three ischemia samples for each gene showed either an “Increase or Decrease” when compared with all three sham samples for each gene; and the fold change in each of the individual comparisons between ischemia and sham had to be at least 1.7-fold (Jin et al., 2001). These are stringent criteria that probably eliminated many genes that were actually regulated by ischemia.
Functional information for the regulated genes was obtained using LocusLink, OMIM, GeneCards, PubMed, and referencing gene ontology (Ashburner et al., 2000). By searching Uni-Gene and doing Blast analyses of the GeneseqN database, we determined the similarity of the expressed sequence tags (ESTs) on the microarrays with known genes. For genes that were represented several times on an array, the alternate gene names are given, and the expression values for that gene were averaged. If the ESTs represented known or at least highly homologous genes, the known gene name is provided in the tables in the unigene/blast columns (Tables 1–14). Sometimes one EST may blast to short fragments of genes or blast to several genes, making these ESTs more difficult to interpret. A draft rat genome covering more than 90% of the rat genome is available. Most of the ESTs had known homologues (Butler, 2002).
Enzymes and inhibitors
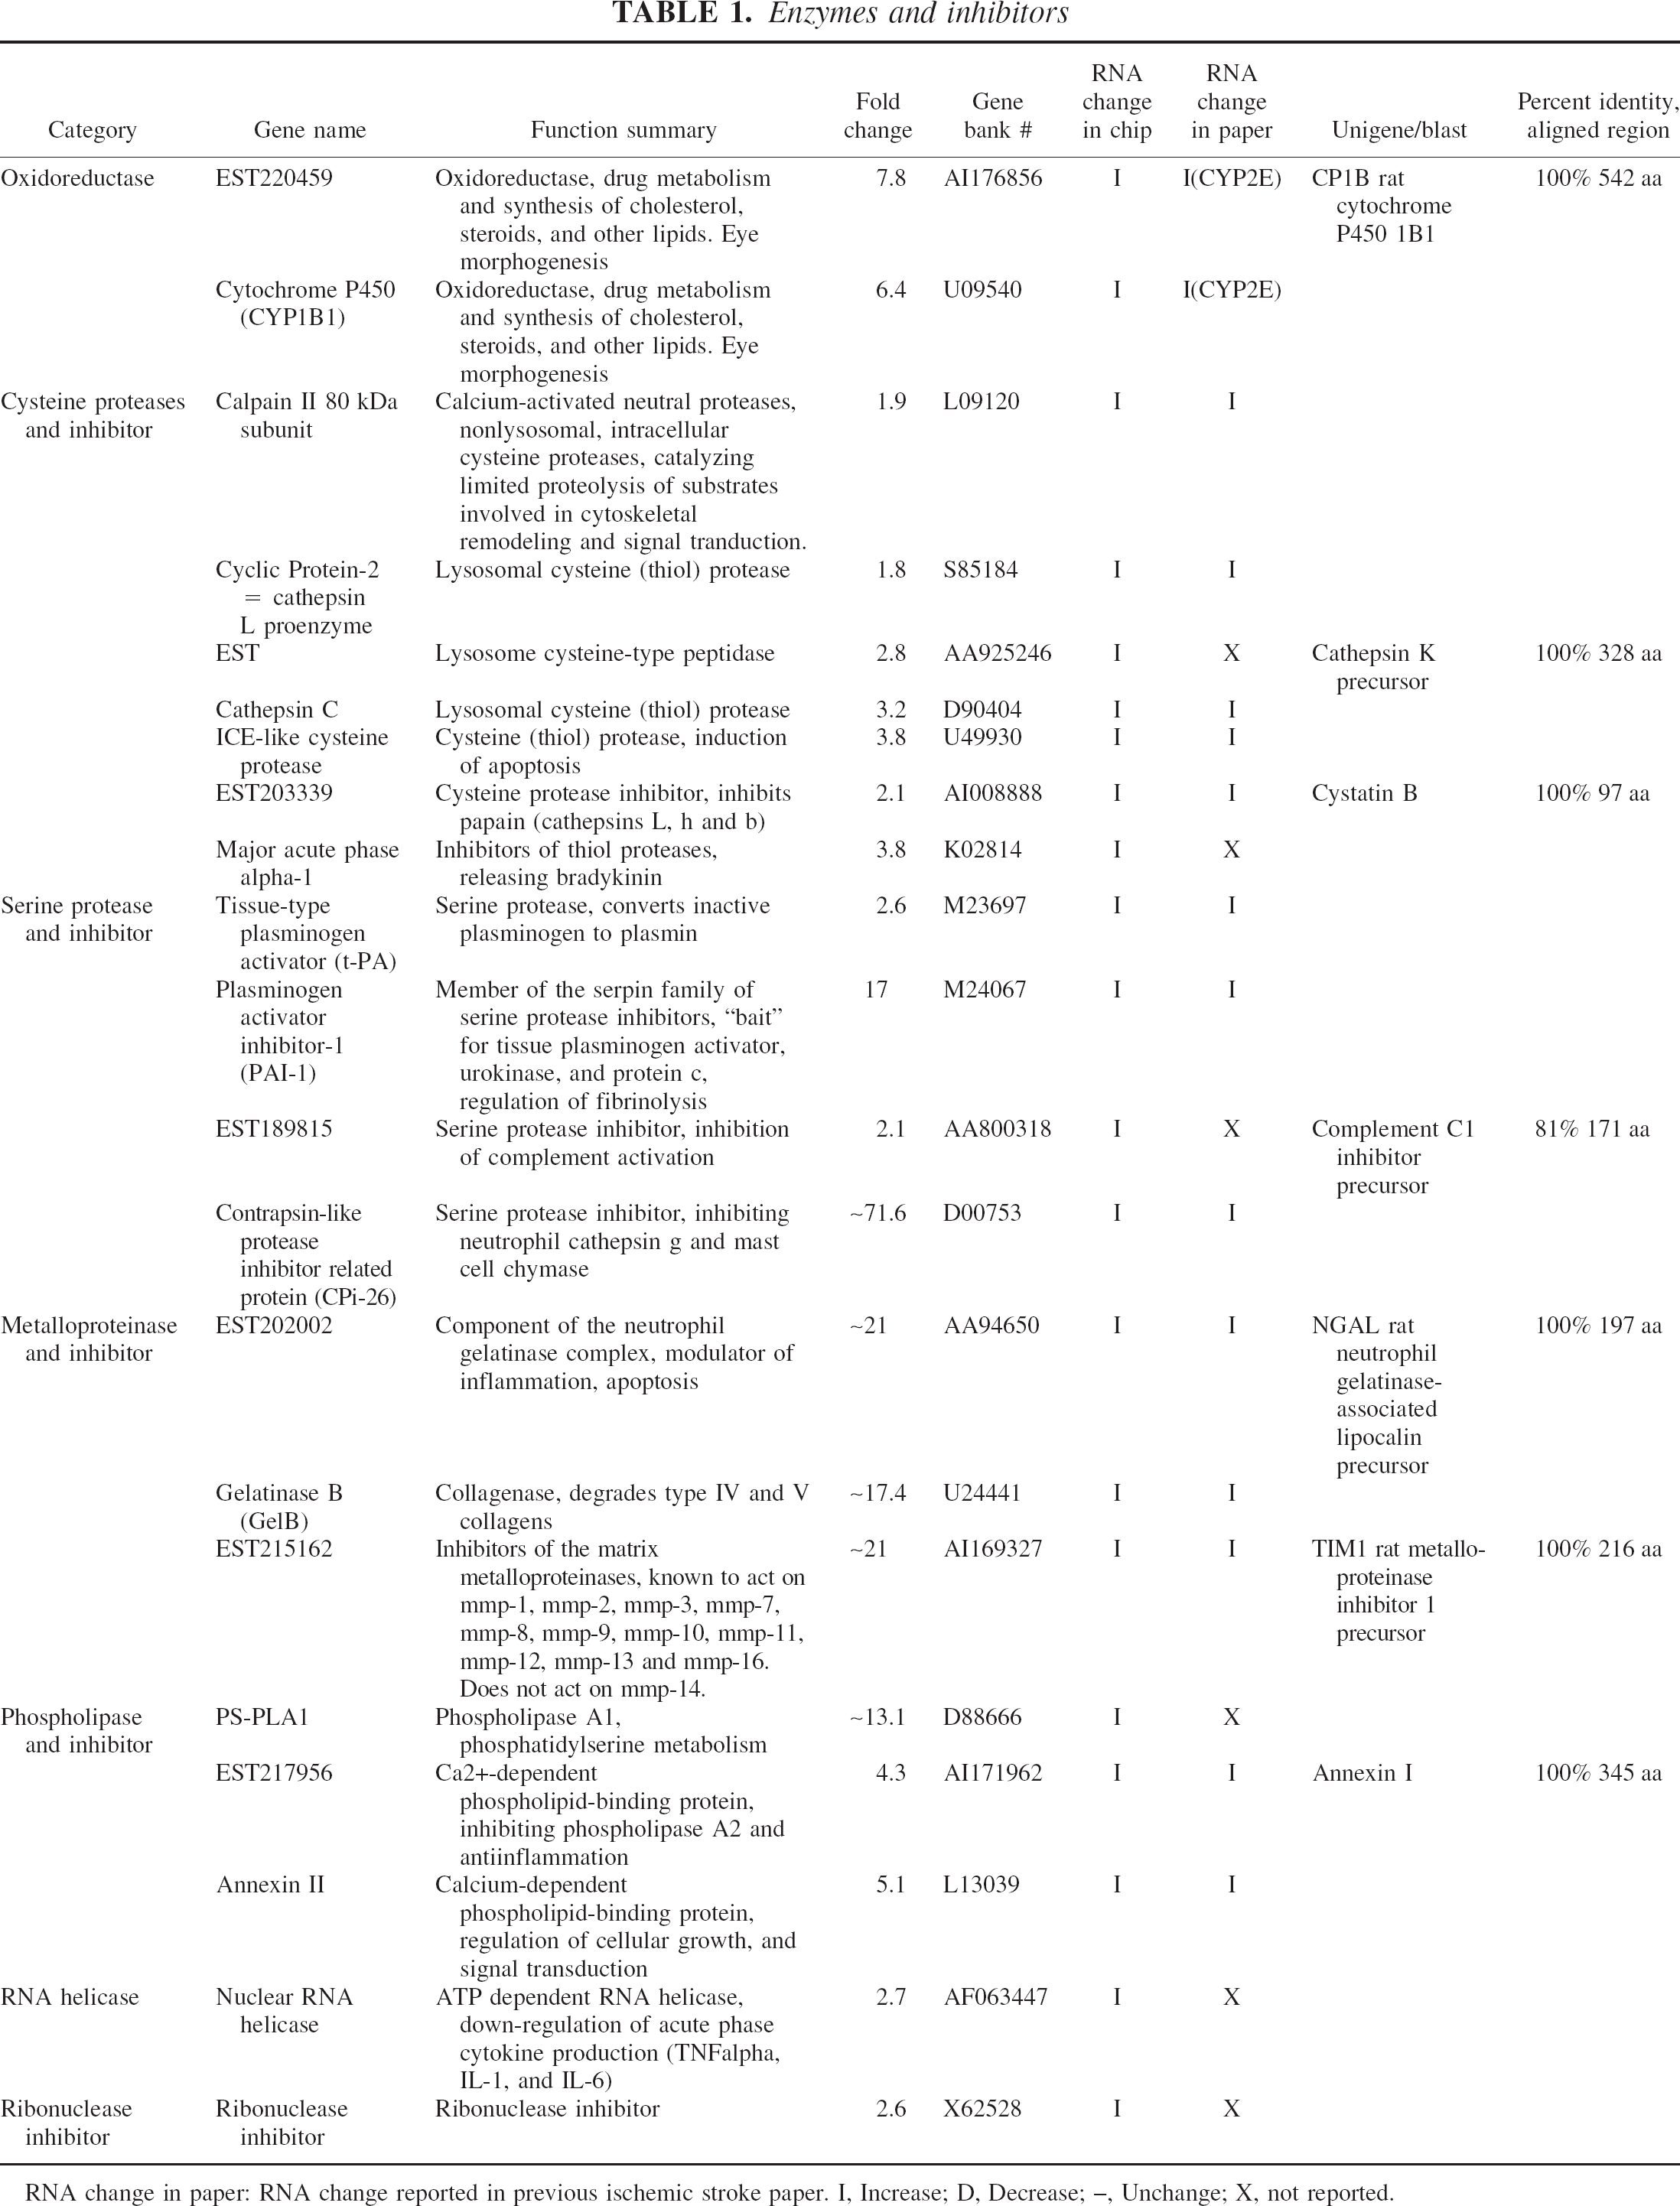
RNA change in paper: RNA change reported in previous ischemic stroke paper. I, Increase; D, Decrease; –, Unchange; X, not reported.
Genes related to metabolism 1
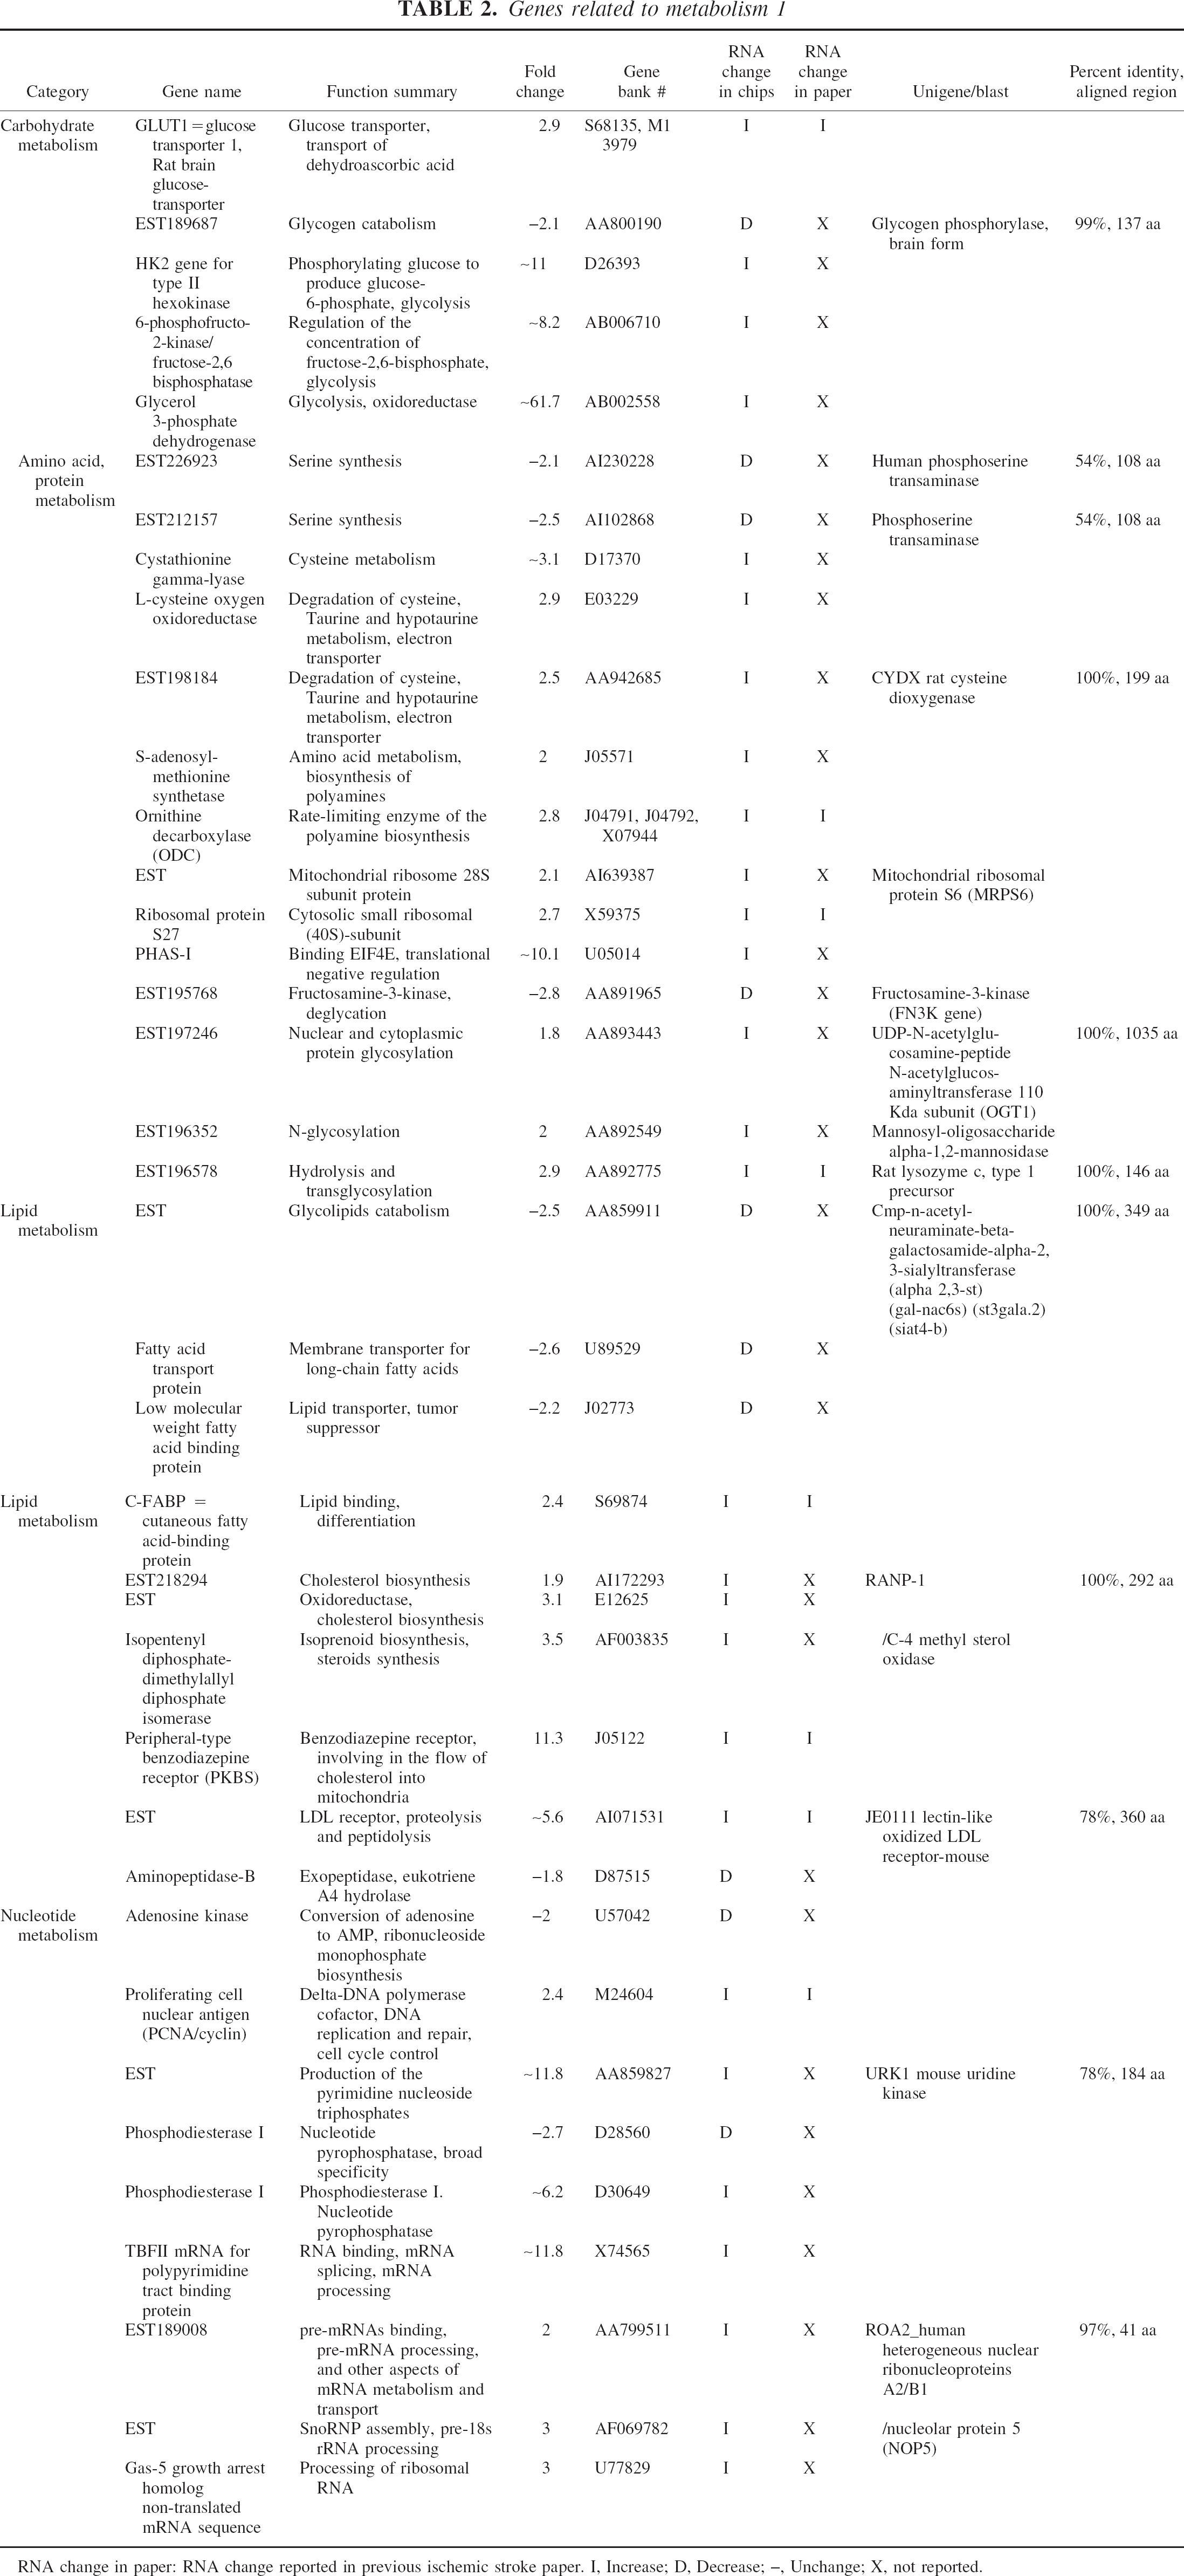
RNA change in paper: RNA change reported in previous ischemic stroke paper. I, Increase; D, Decrease; –, Unchange; X, not reported.
Stress response genes
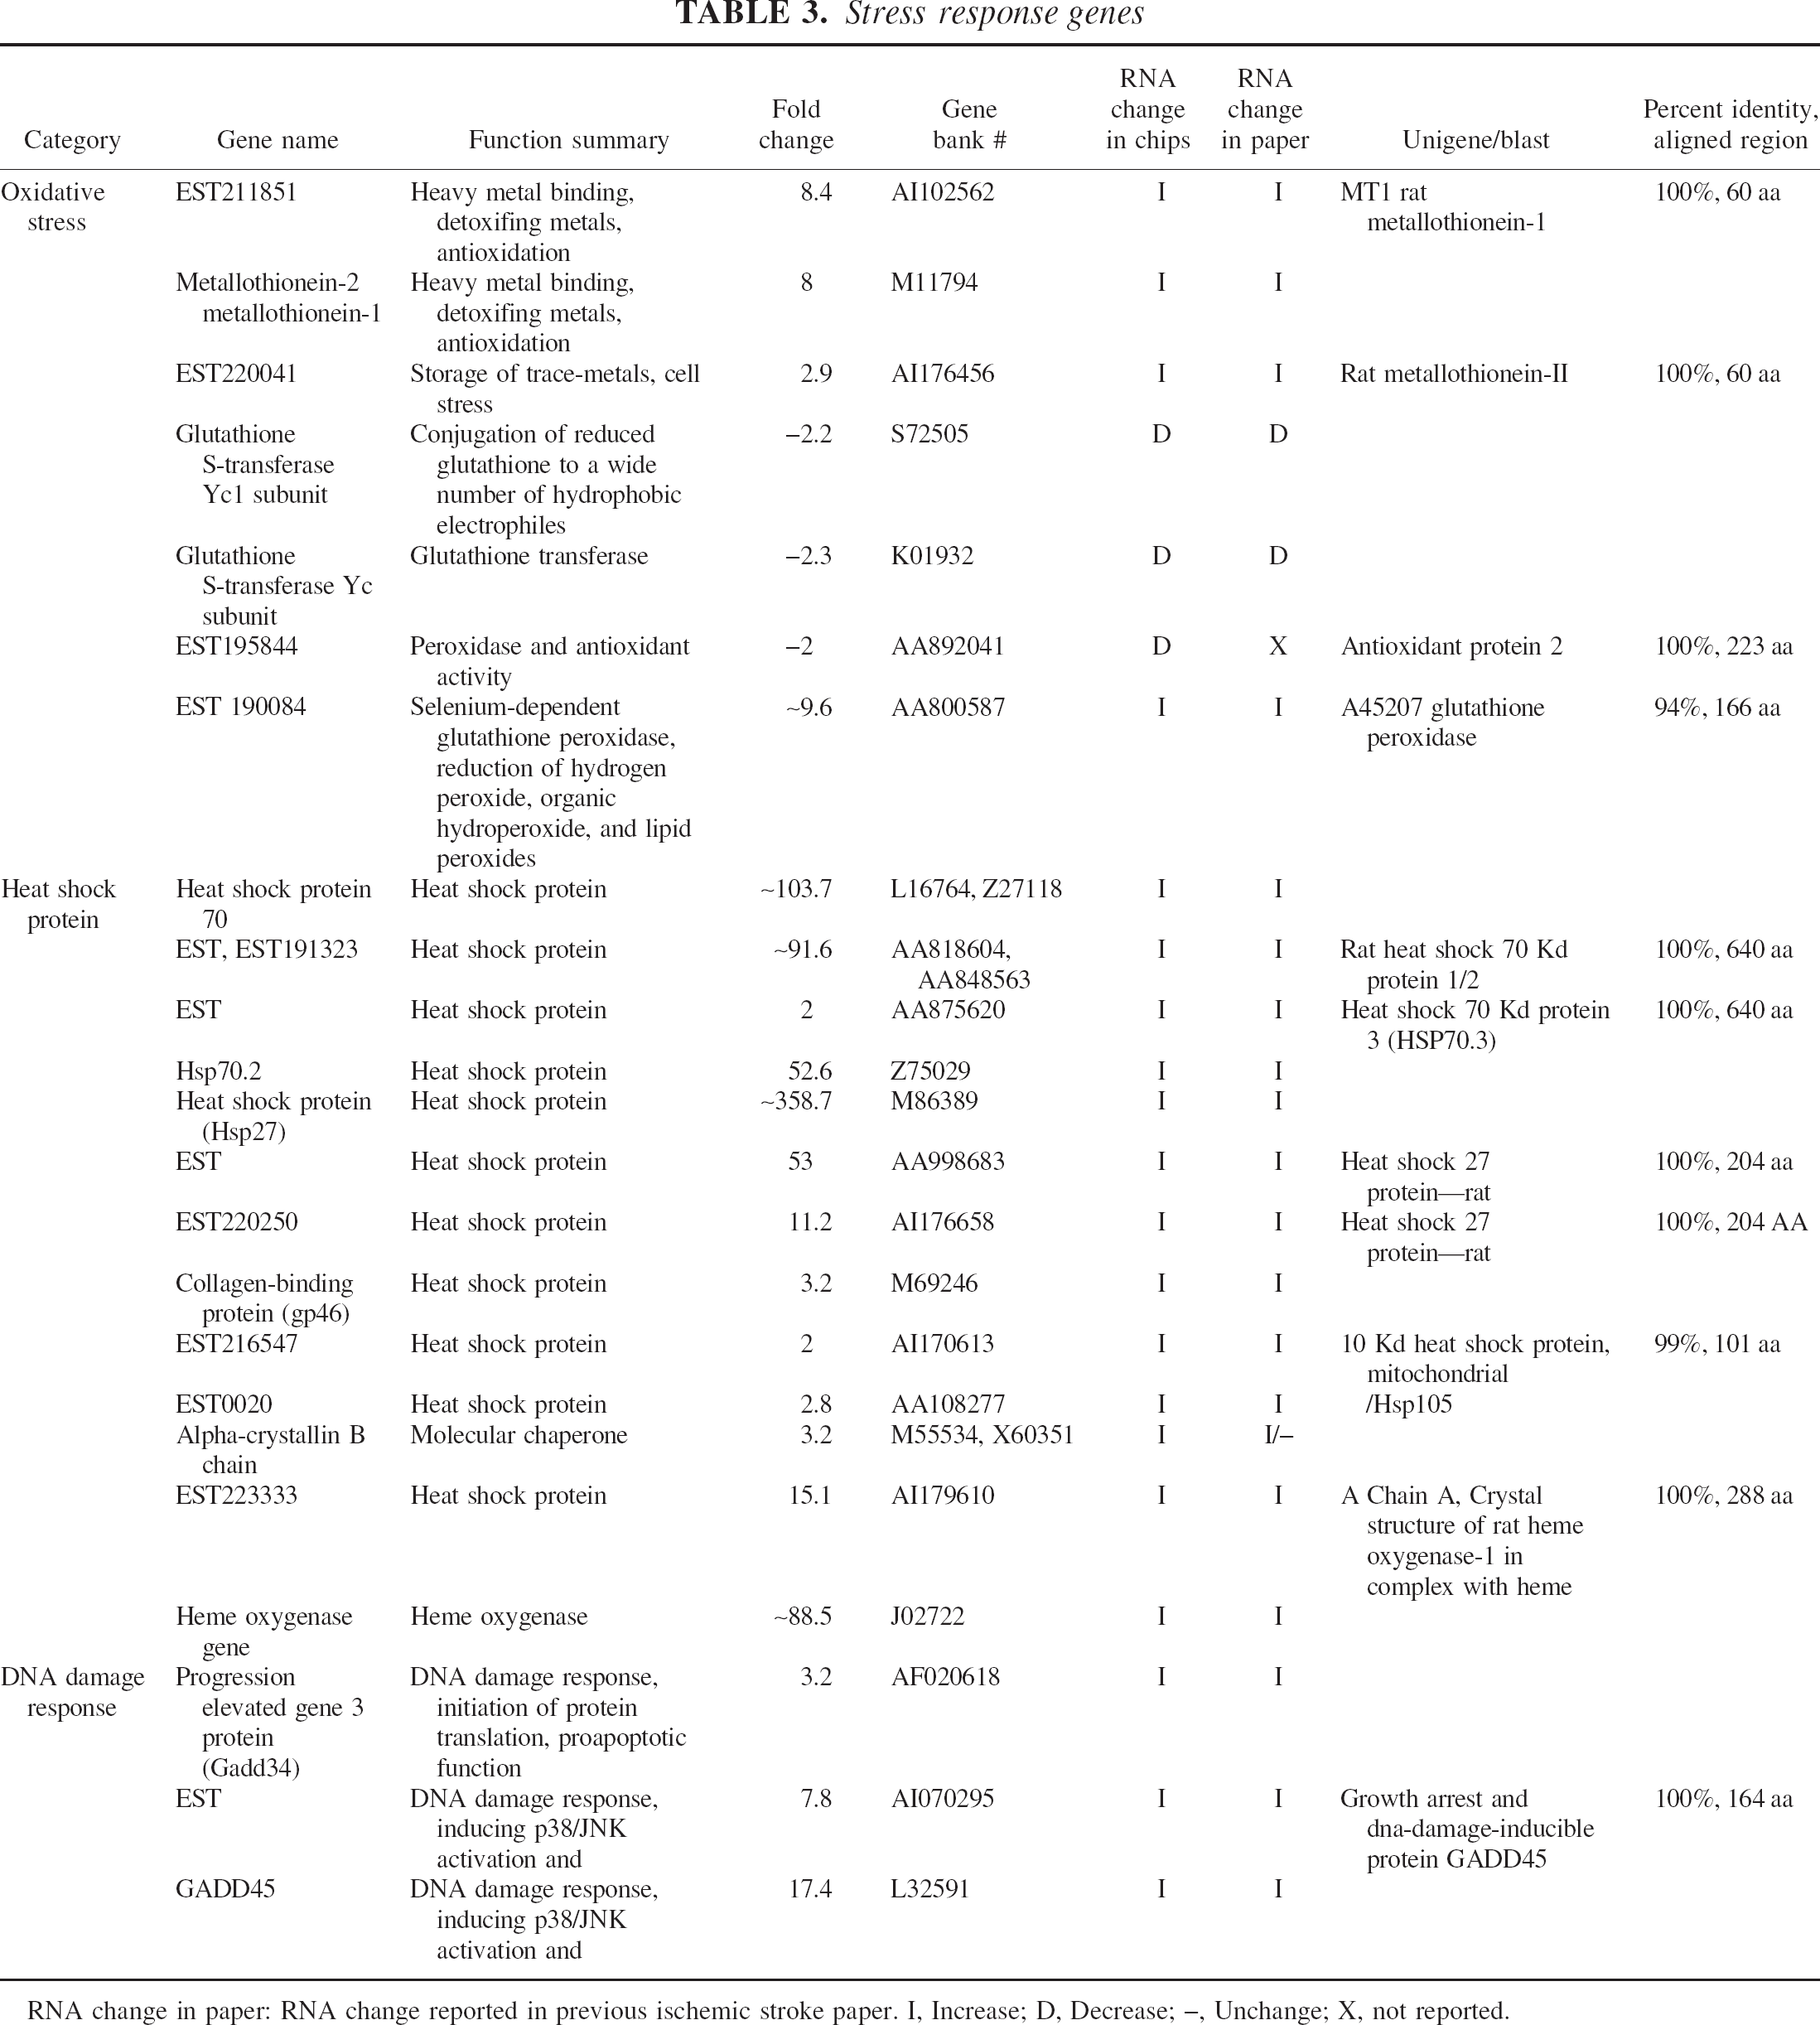
RNA change in paper: RNA change reported in previous ischemic stroke paper. I, Increase; D, Decrease; –, Unchange; X, not reported.
Neurotransmitter and hormone-related genes
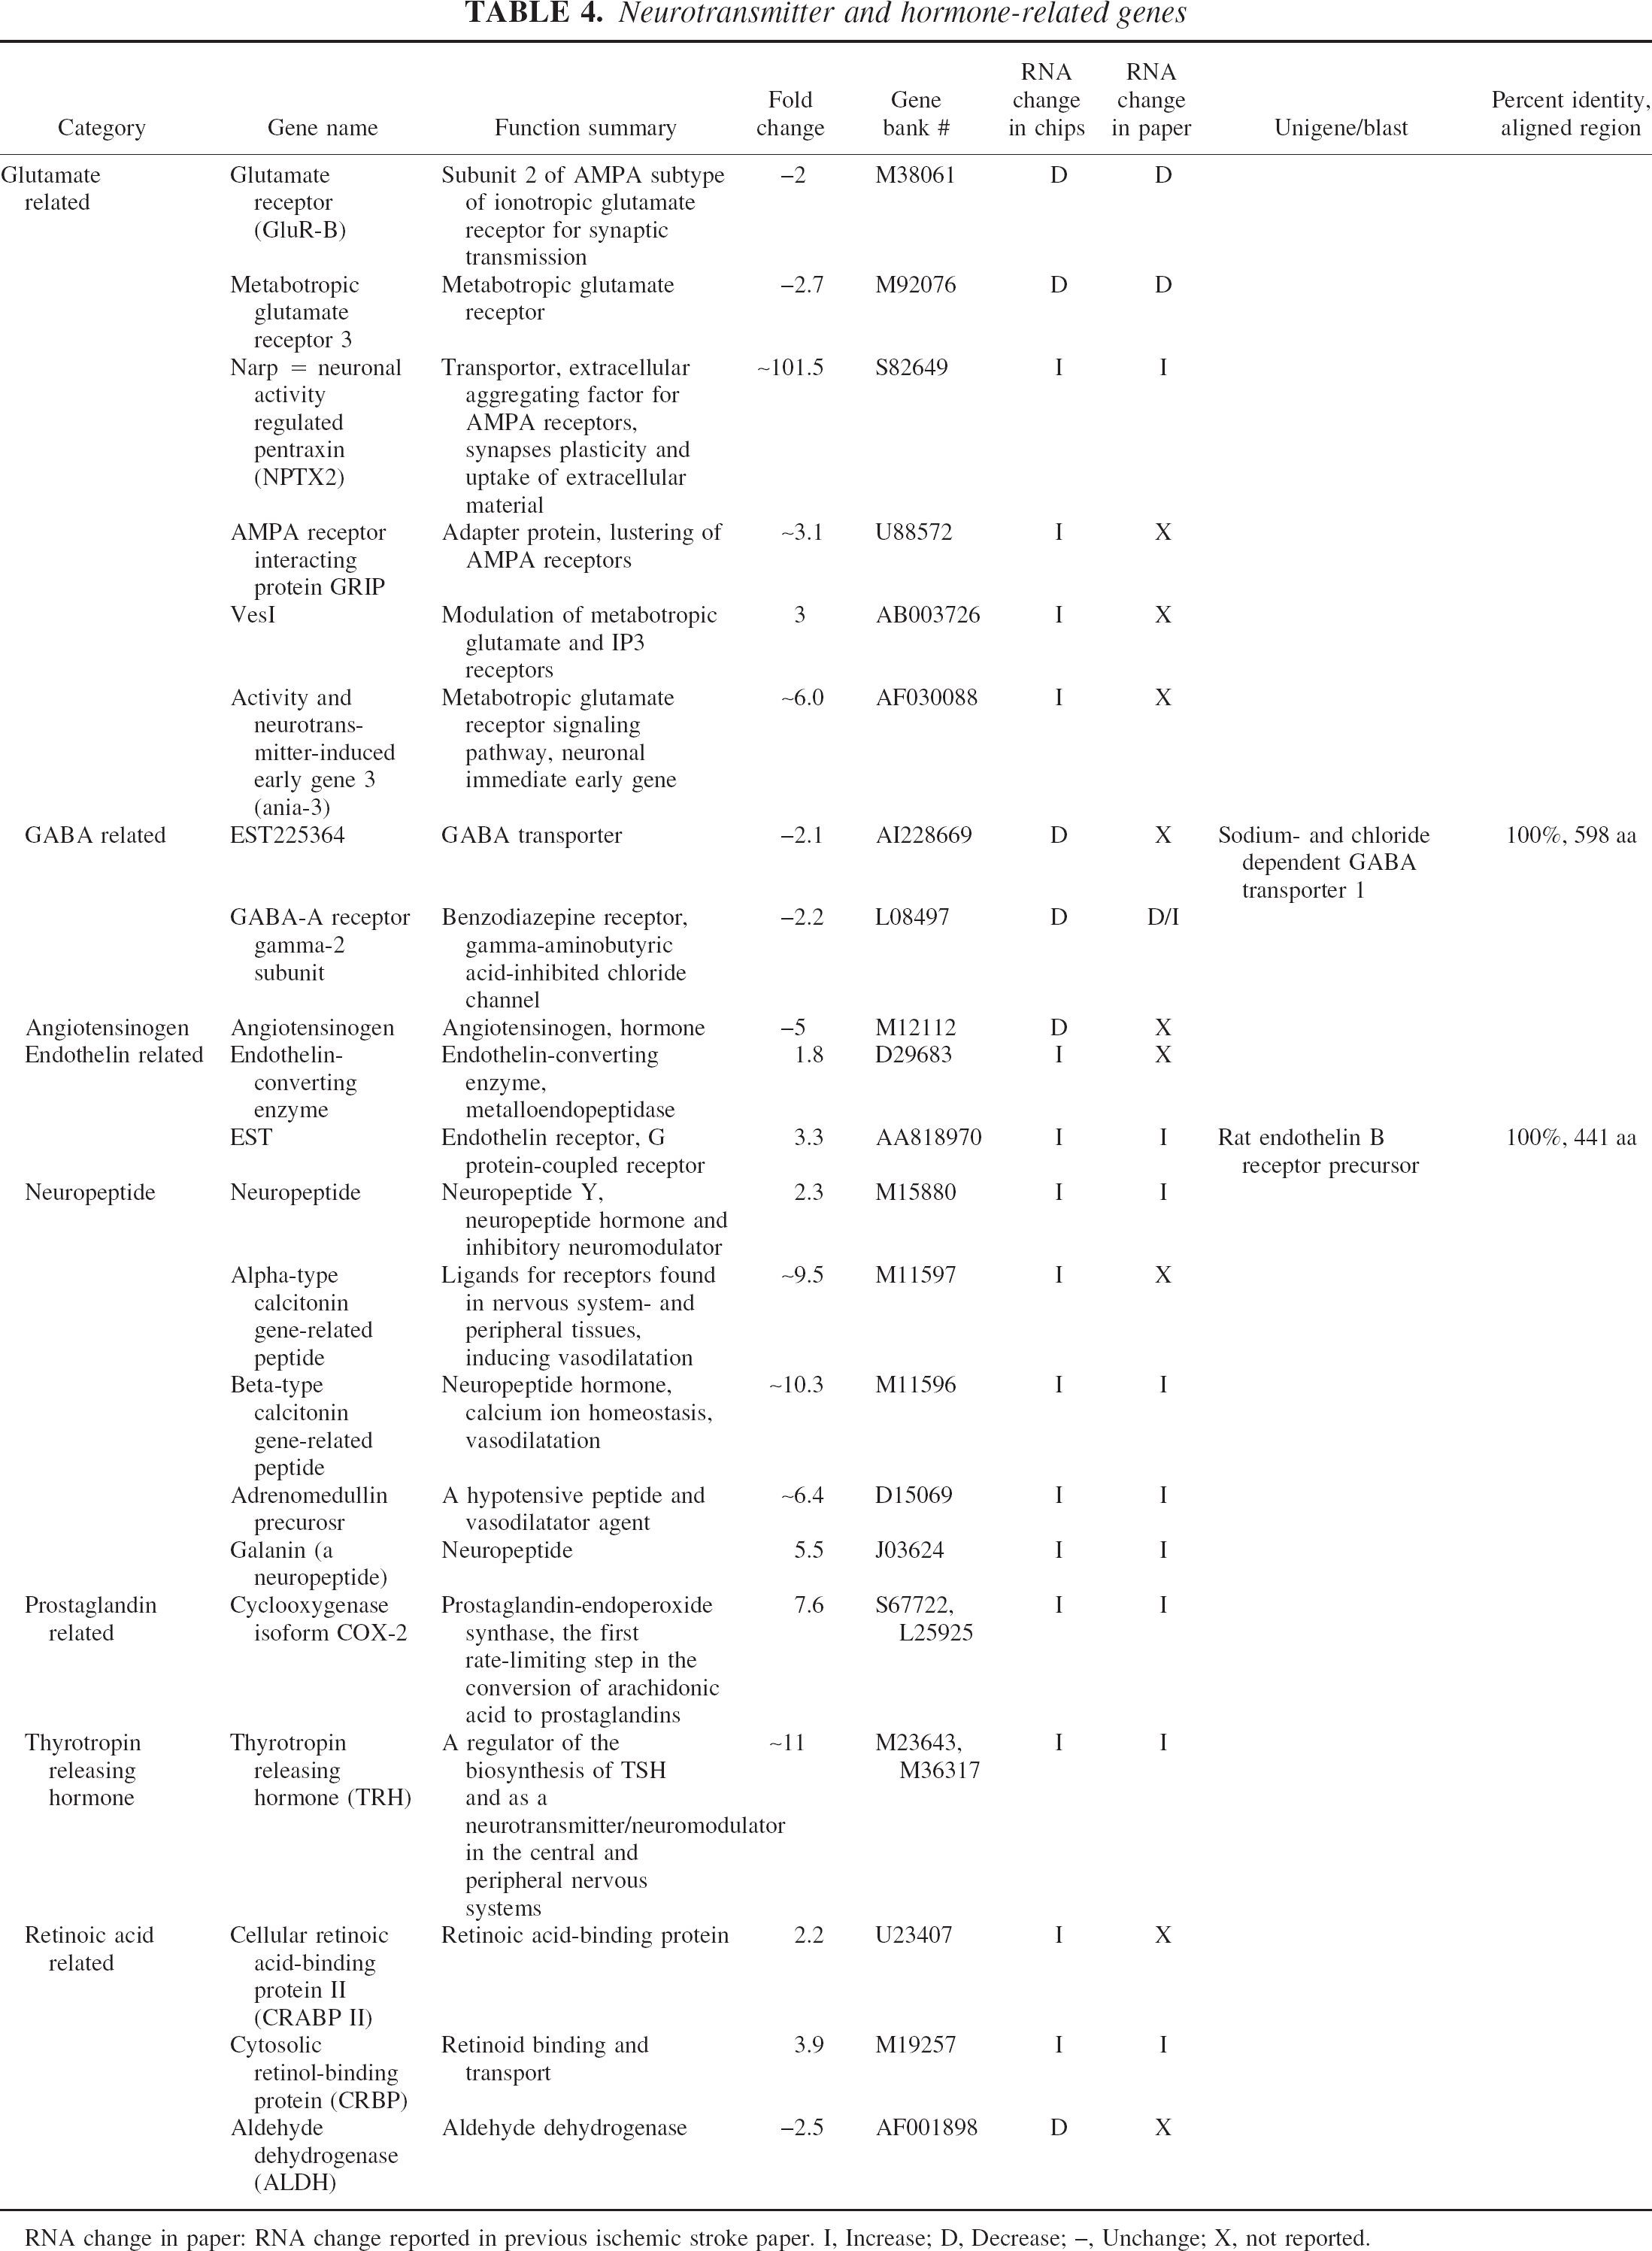
RNA change in paper: RNA change reported in previous ischemic stroke paper. I, Increase; D, Decrease; –, Unchange; X, not reported.
Growth factor-related genes
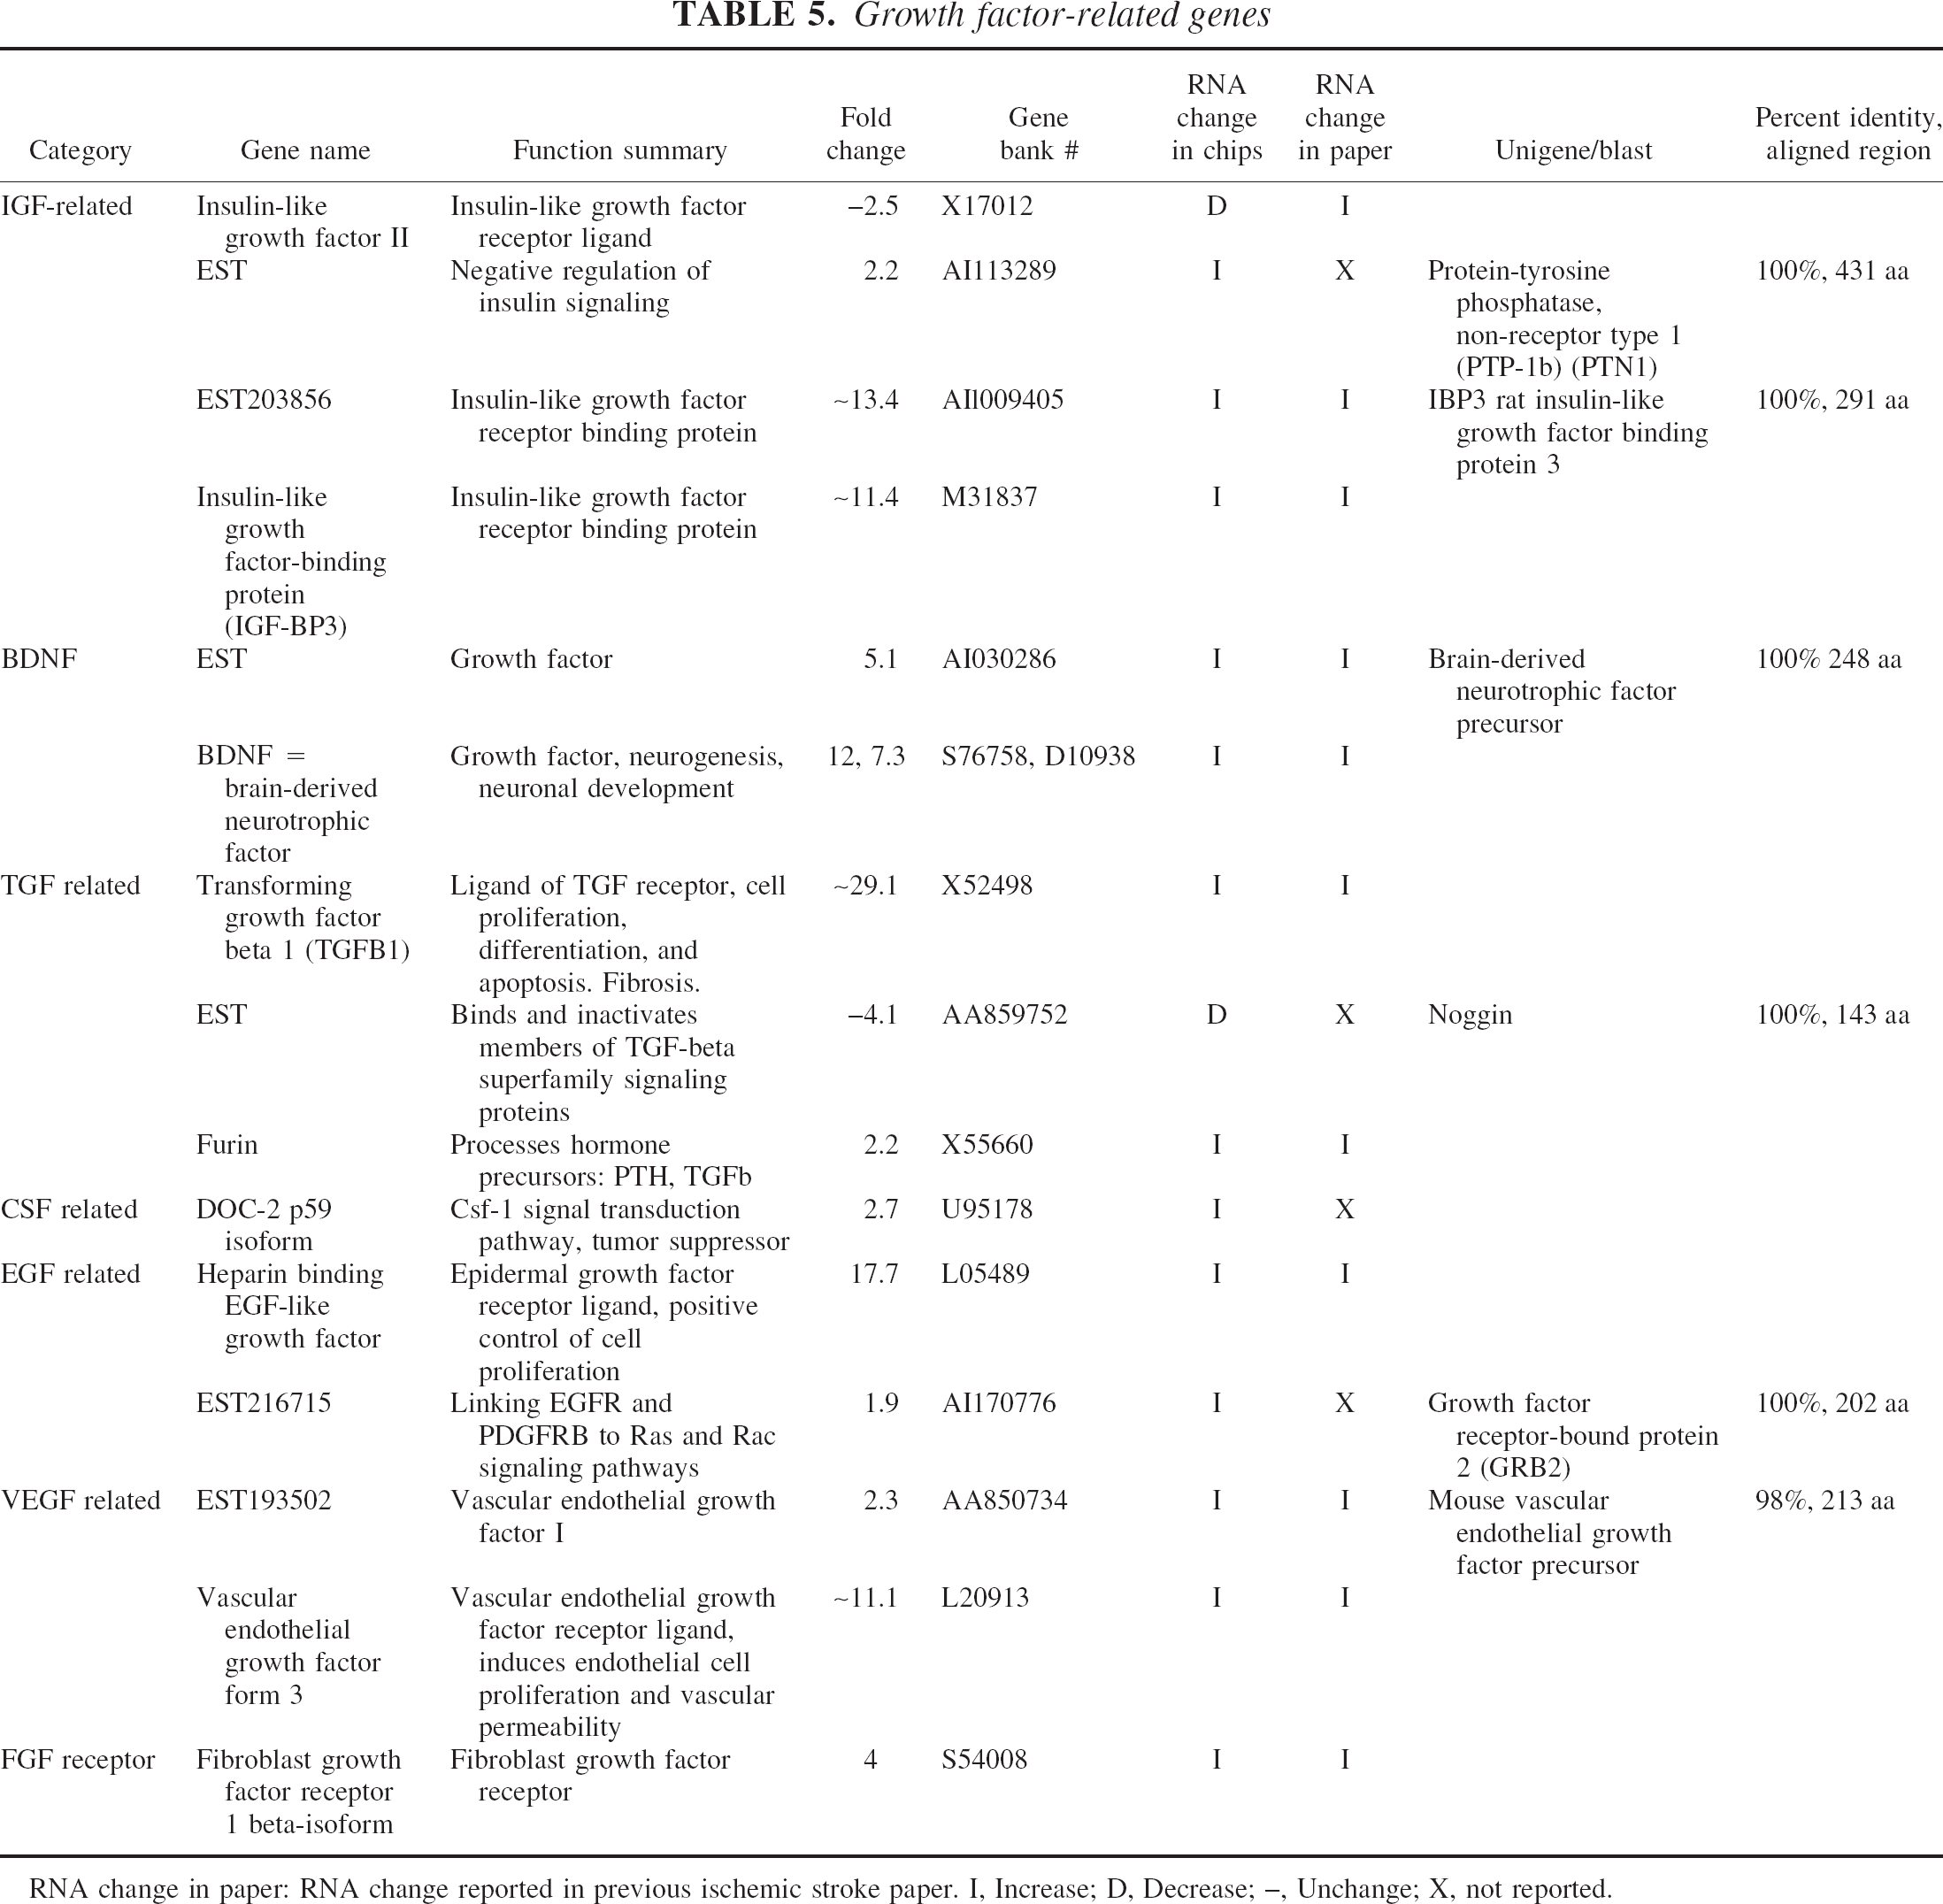
RNA change in paper: RNA change reported in previous ischemic stroke paper. I, Increase; D, Decrease; –, Unchange; X, not reported.
Genes related to cytokines and chemokines
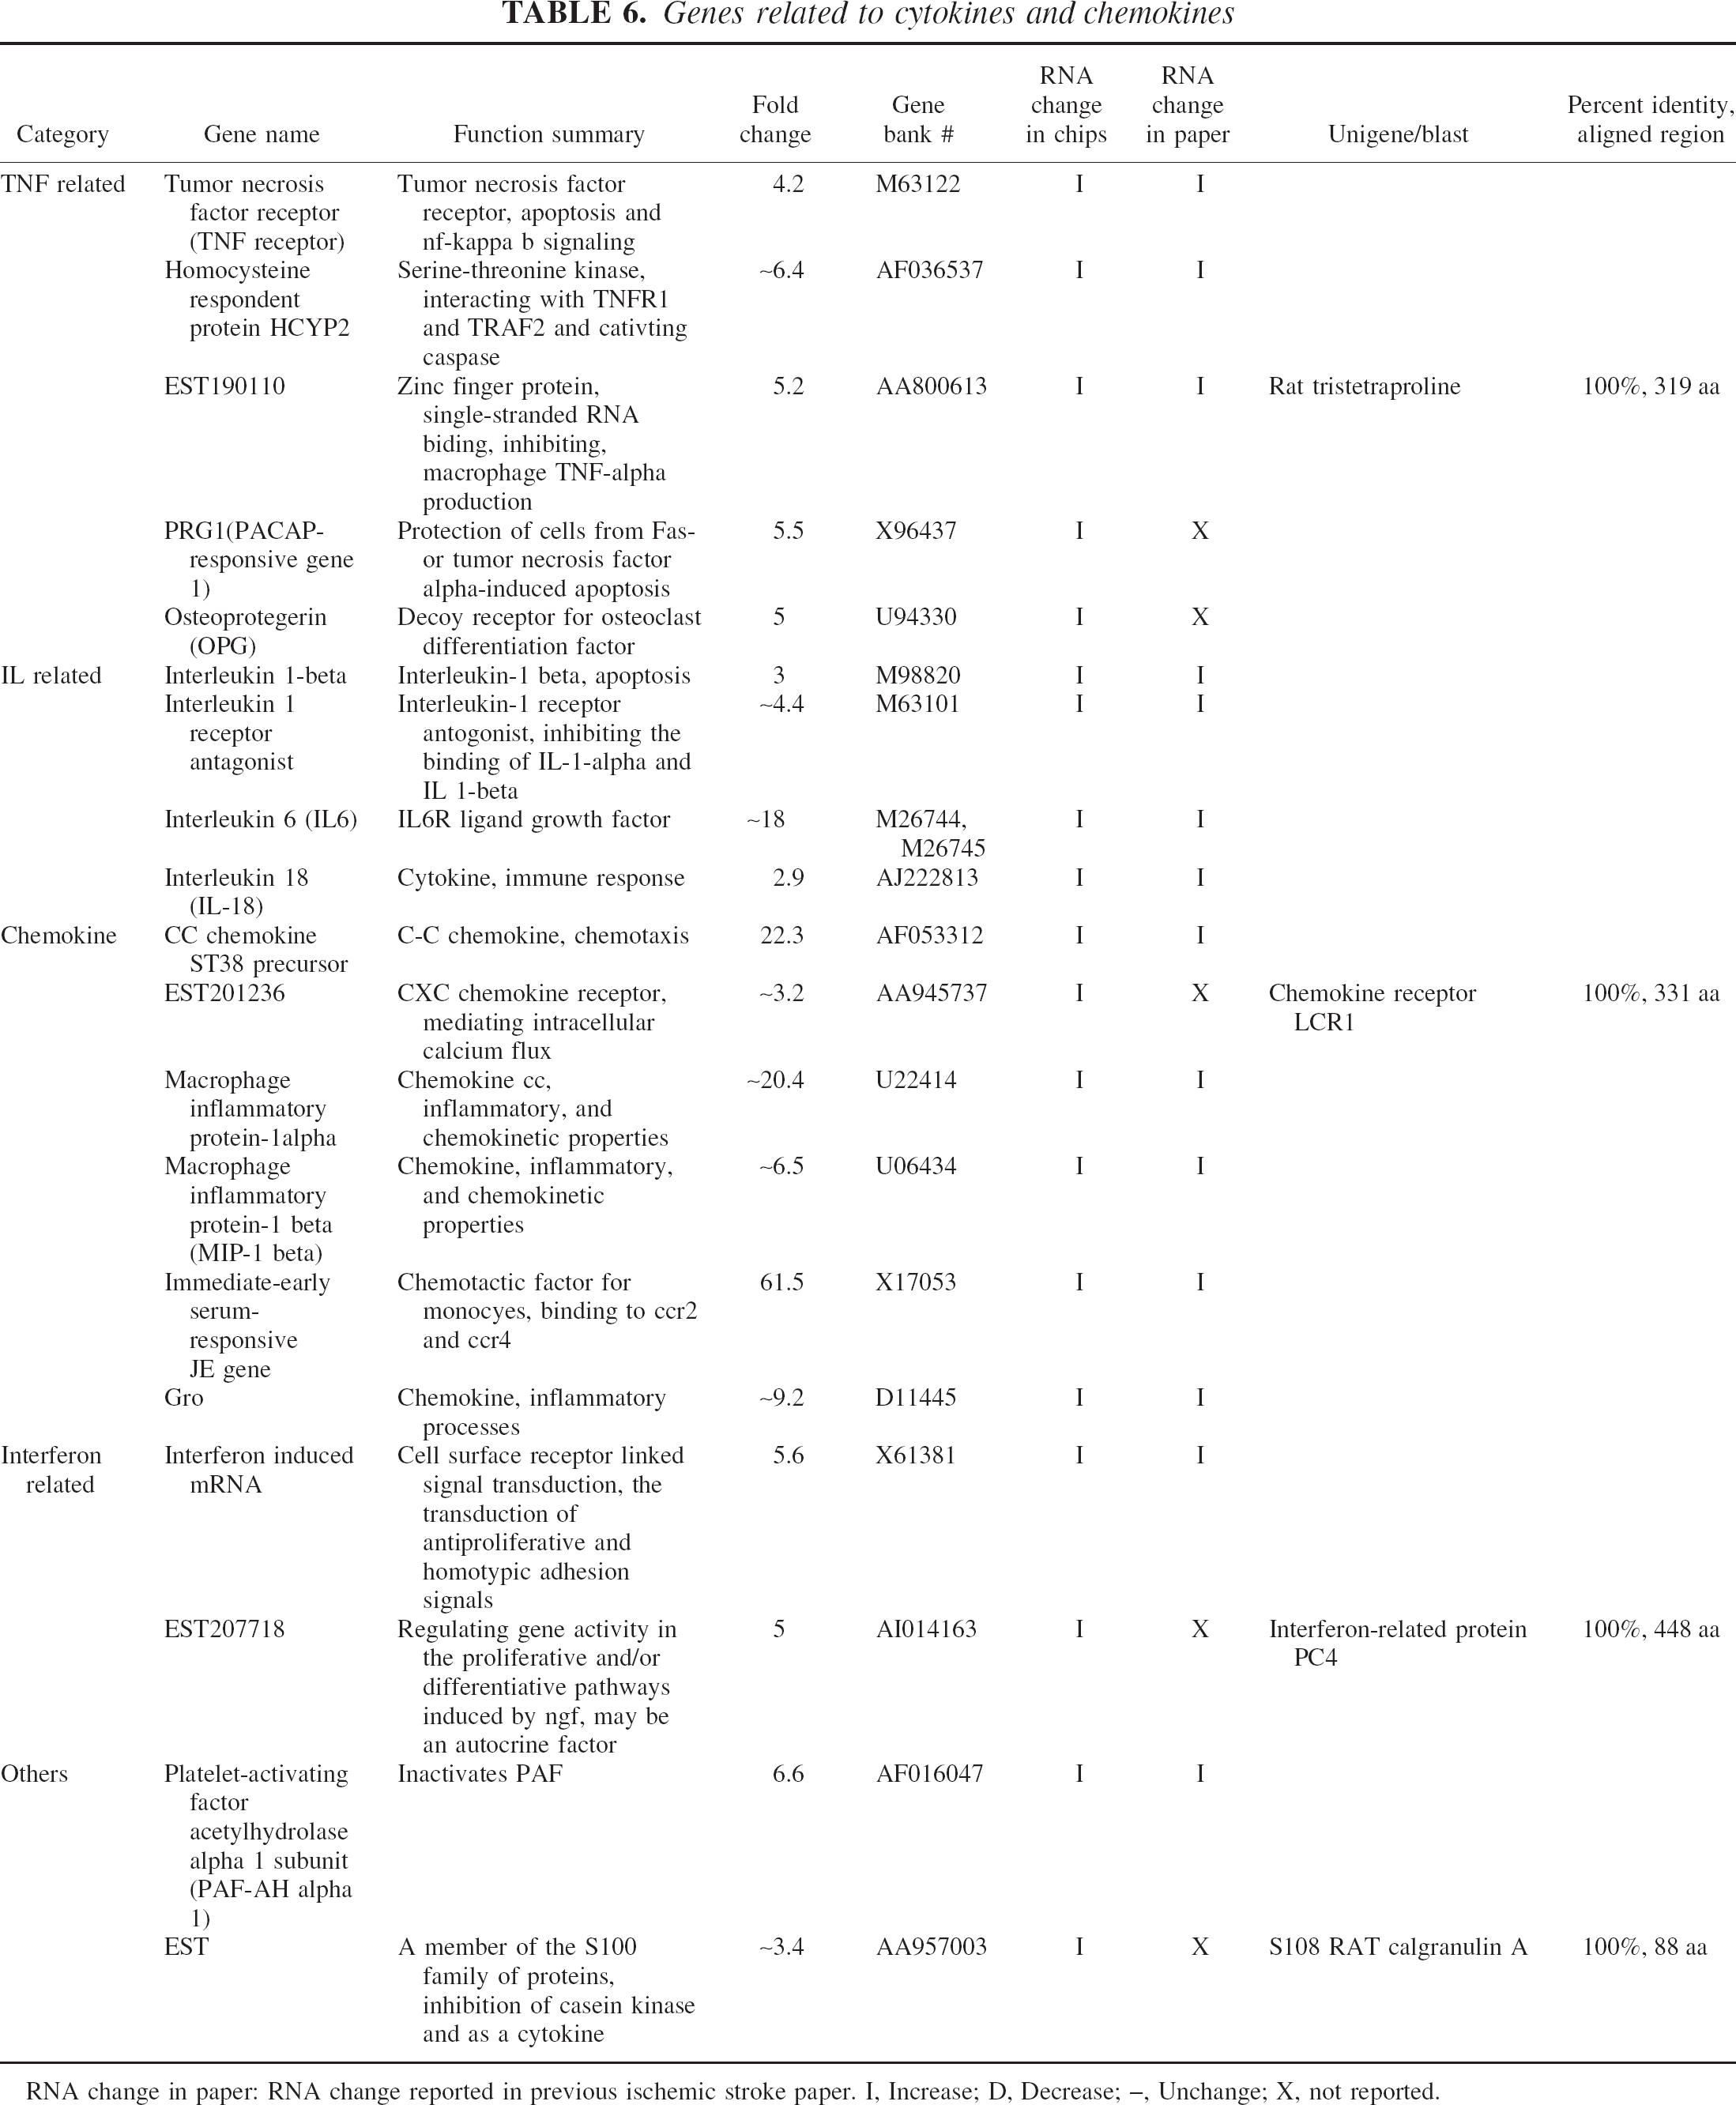
RNA change in paper: RNA change reported in previous ischemic stroke paper. I, Increase; D, Decrease; –, Unchange; X, not reported.
Genes related to signal transduction 1
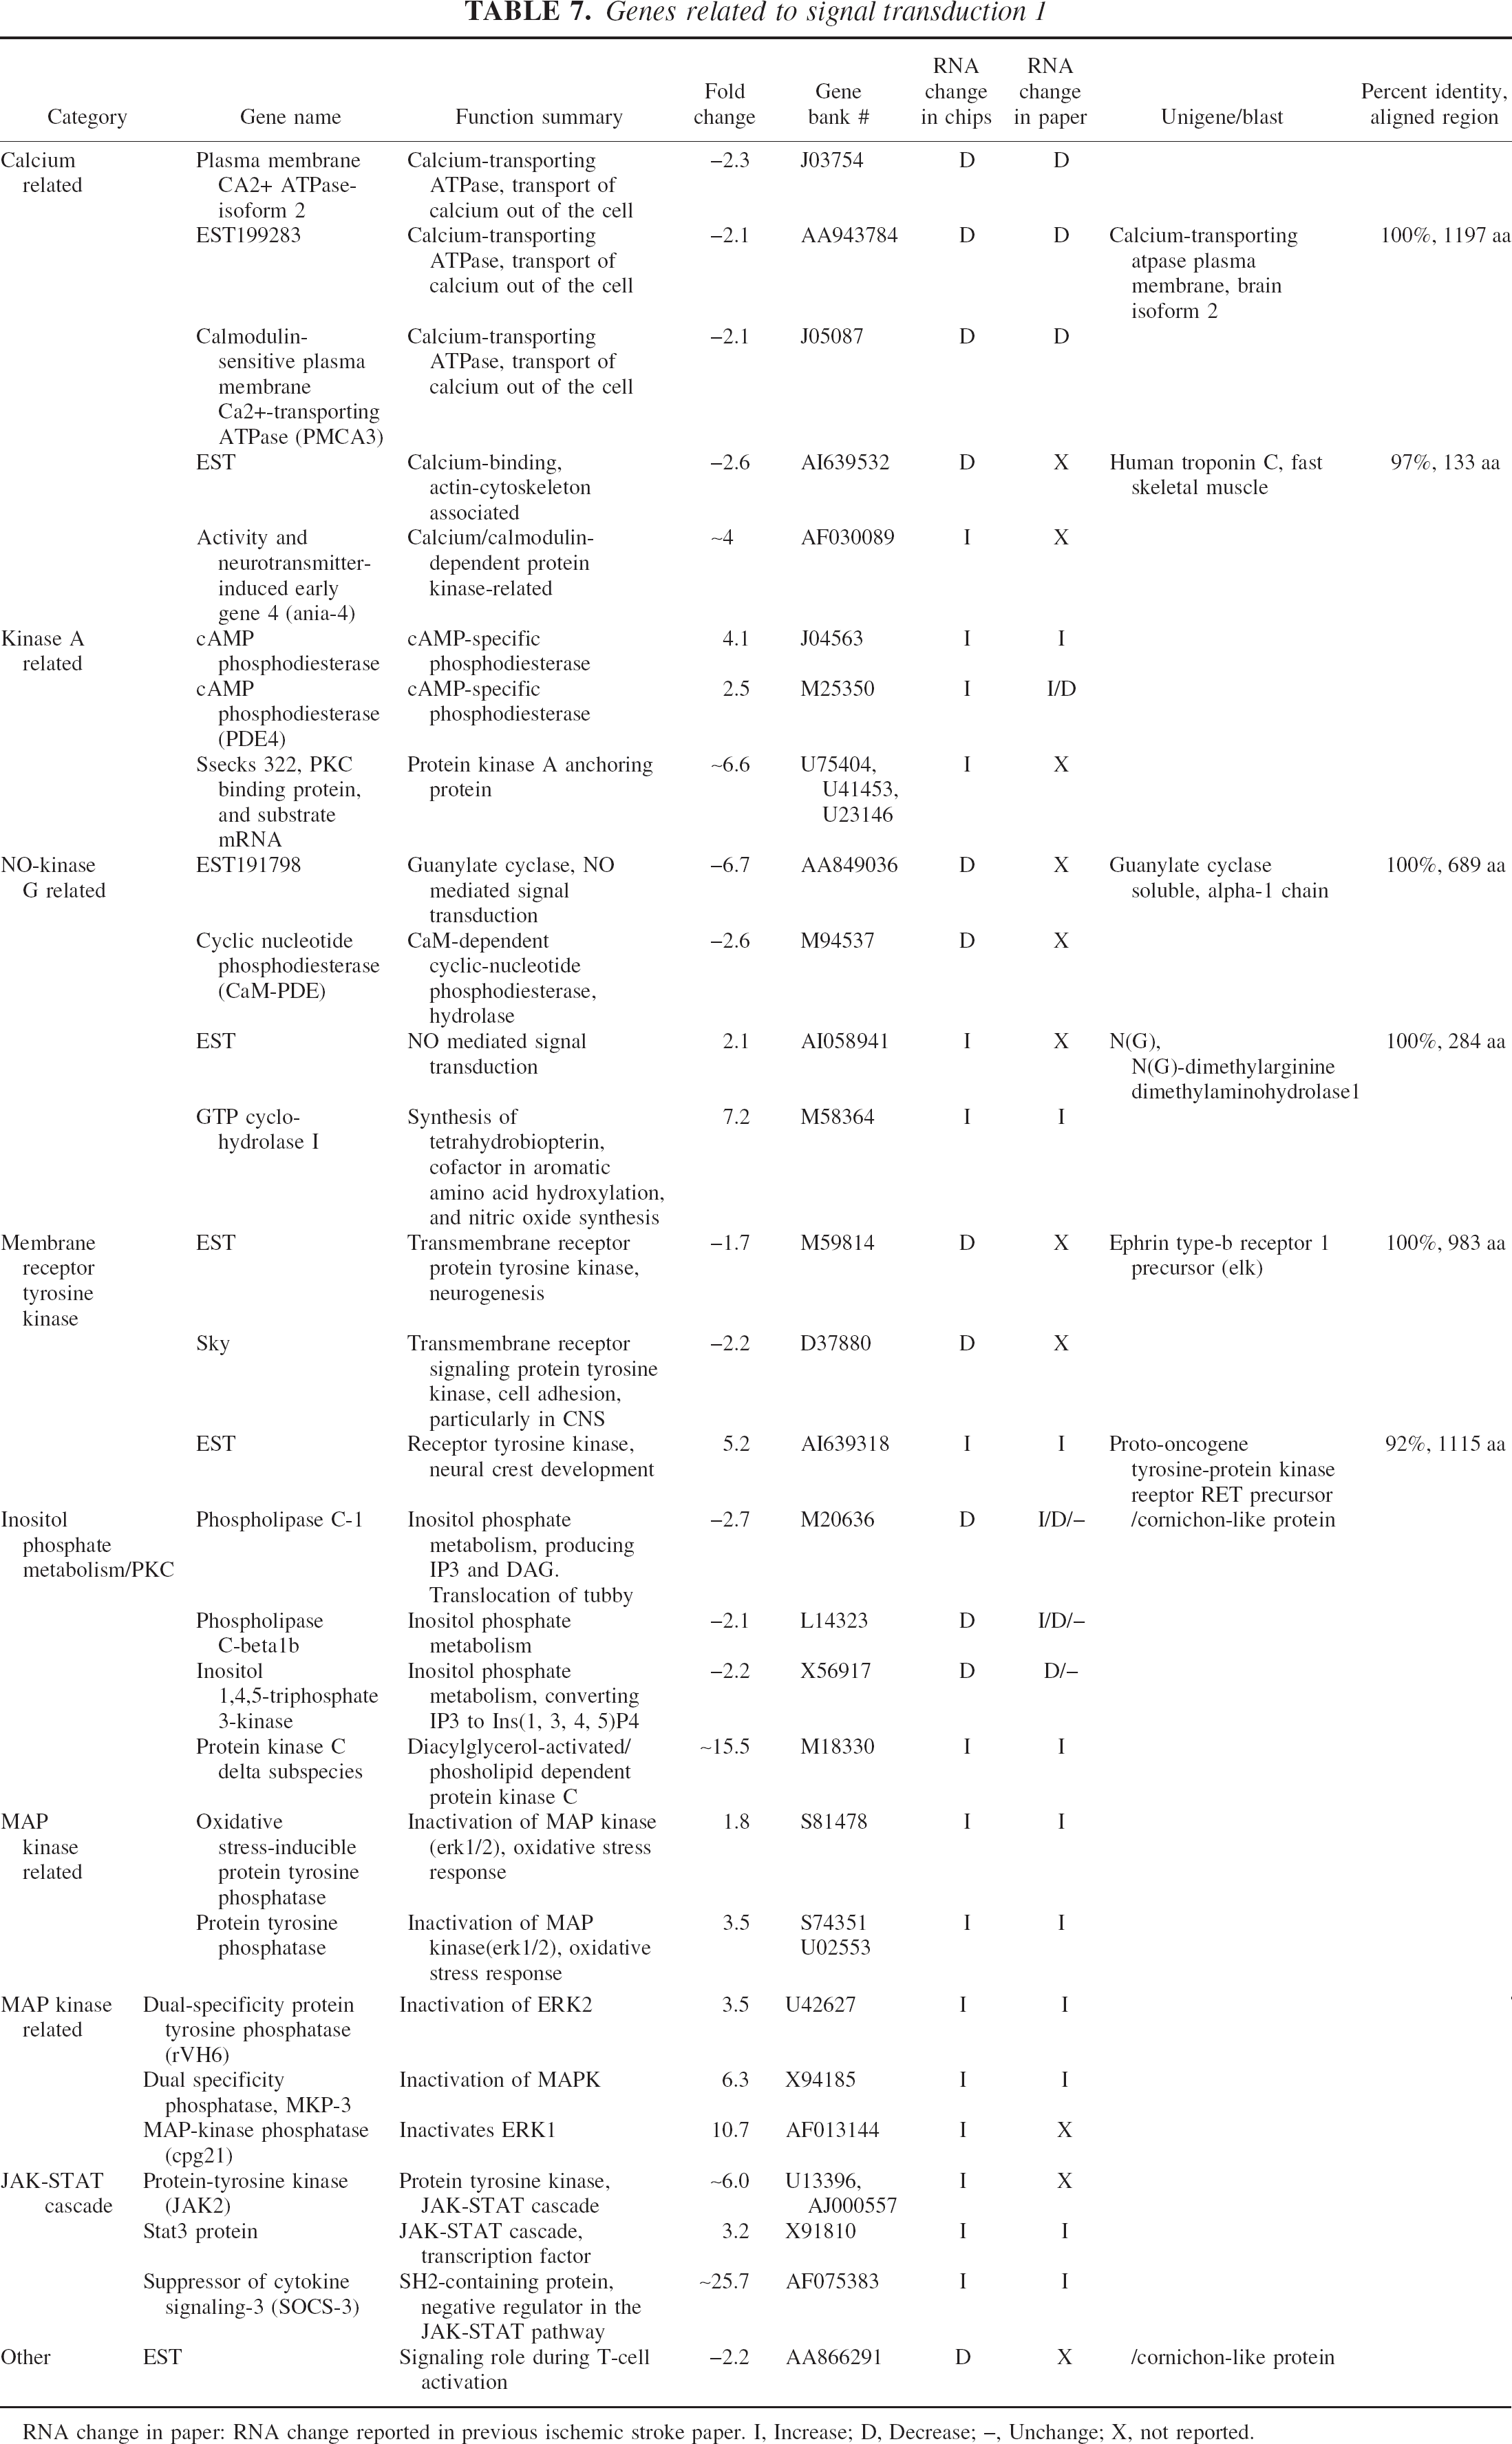
RNA change in paper: RNA change reported in previous ischemic stroke paper. I, Increase; D, Decrease; –, Unchange; X, not reported.
G protein-related genes
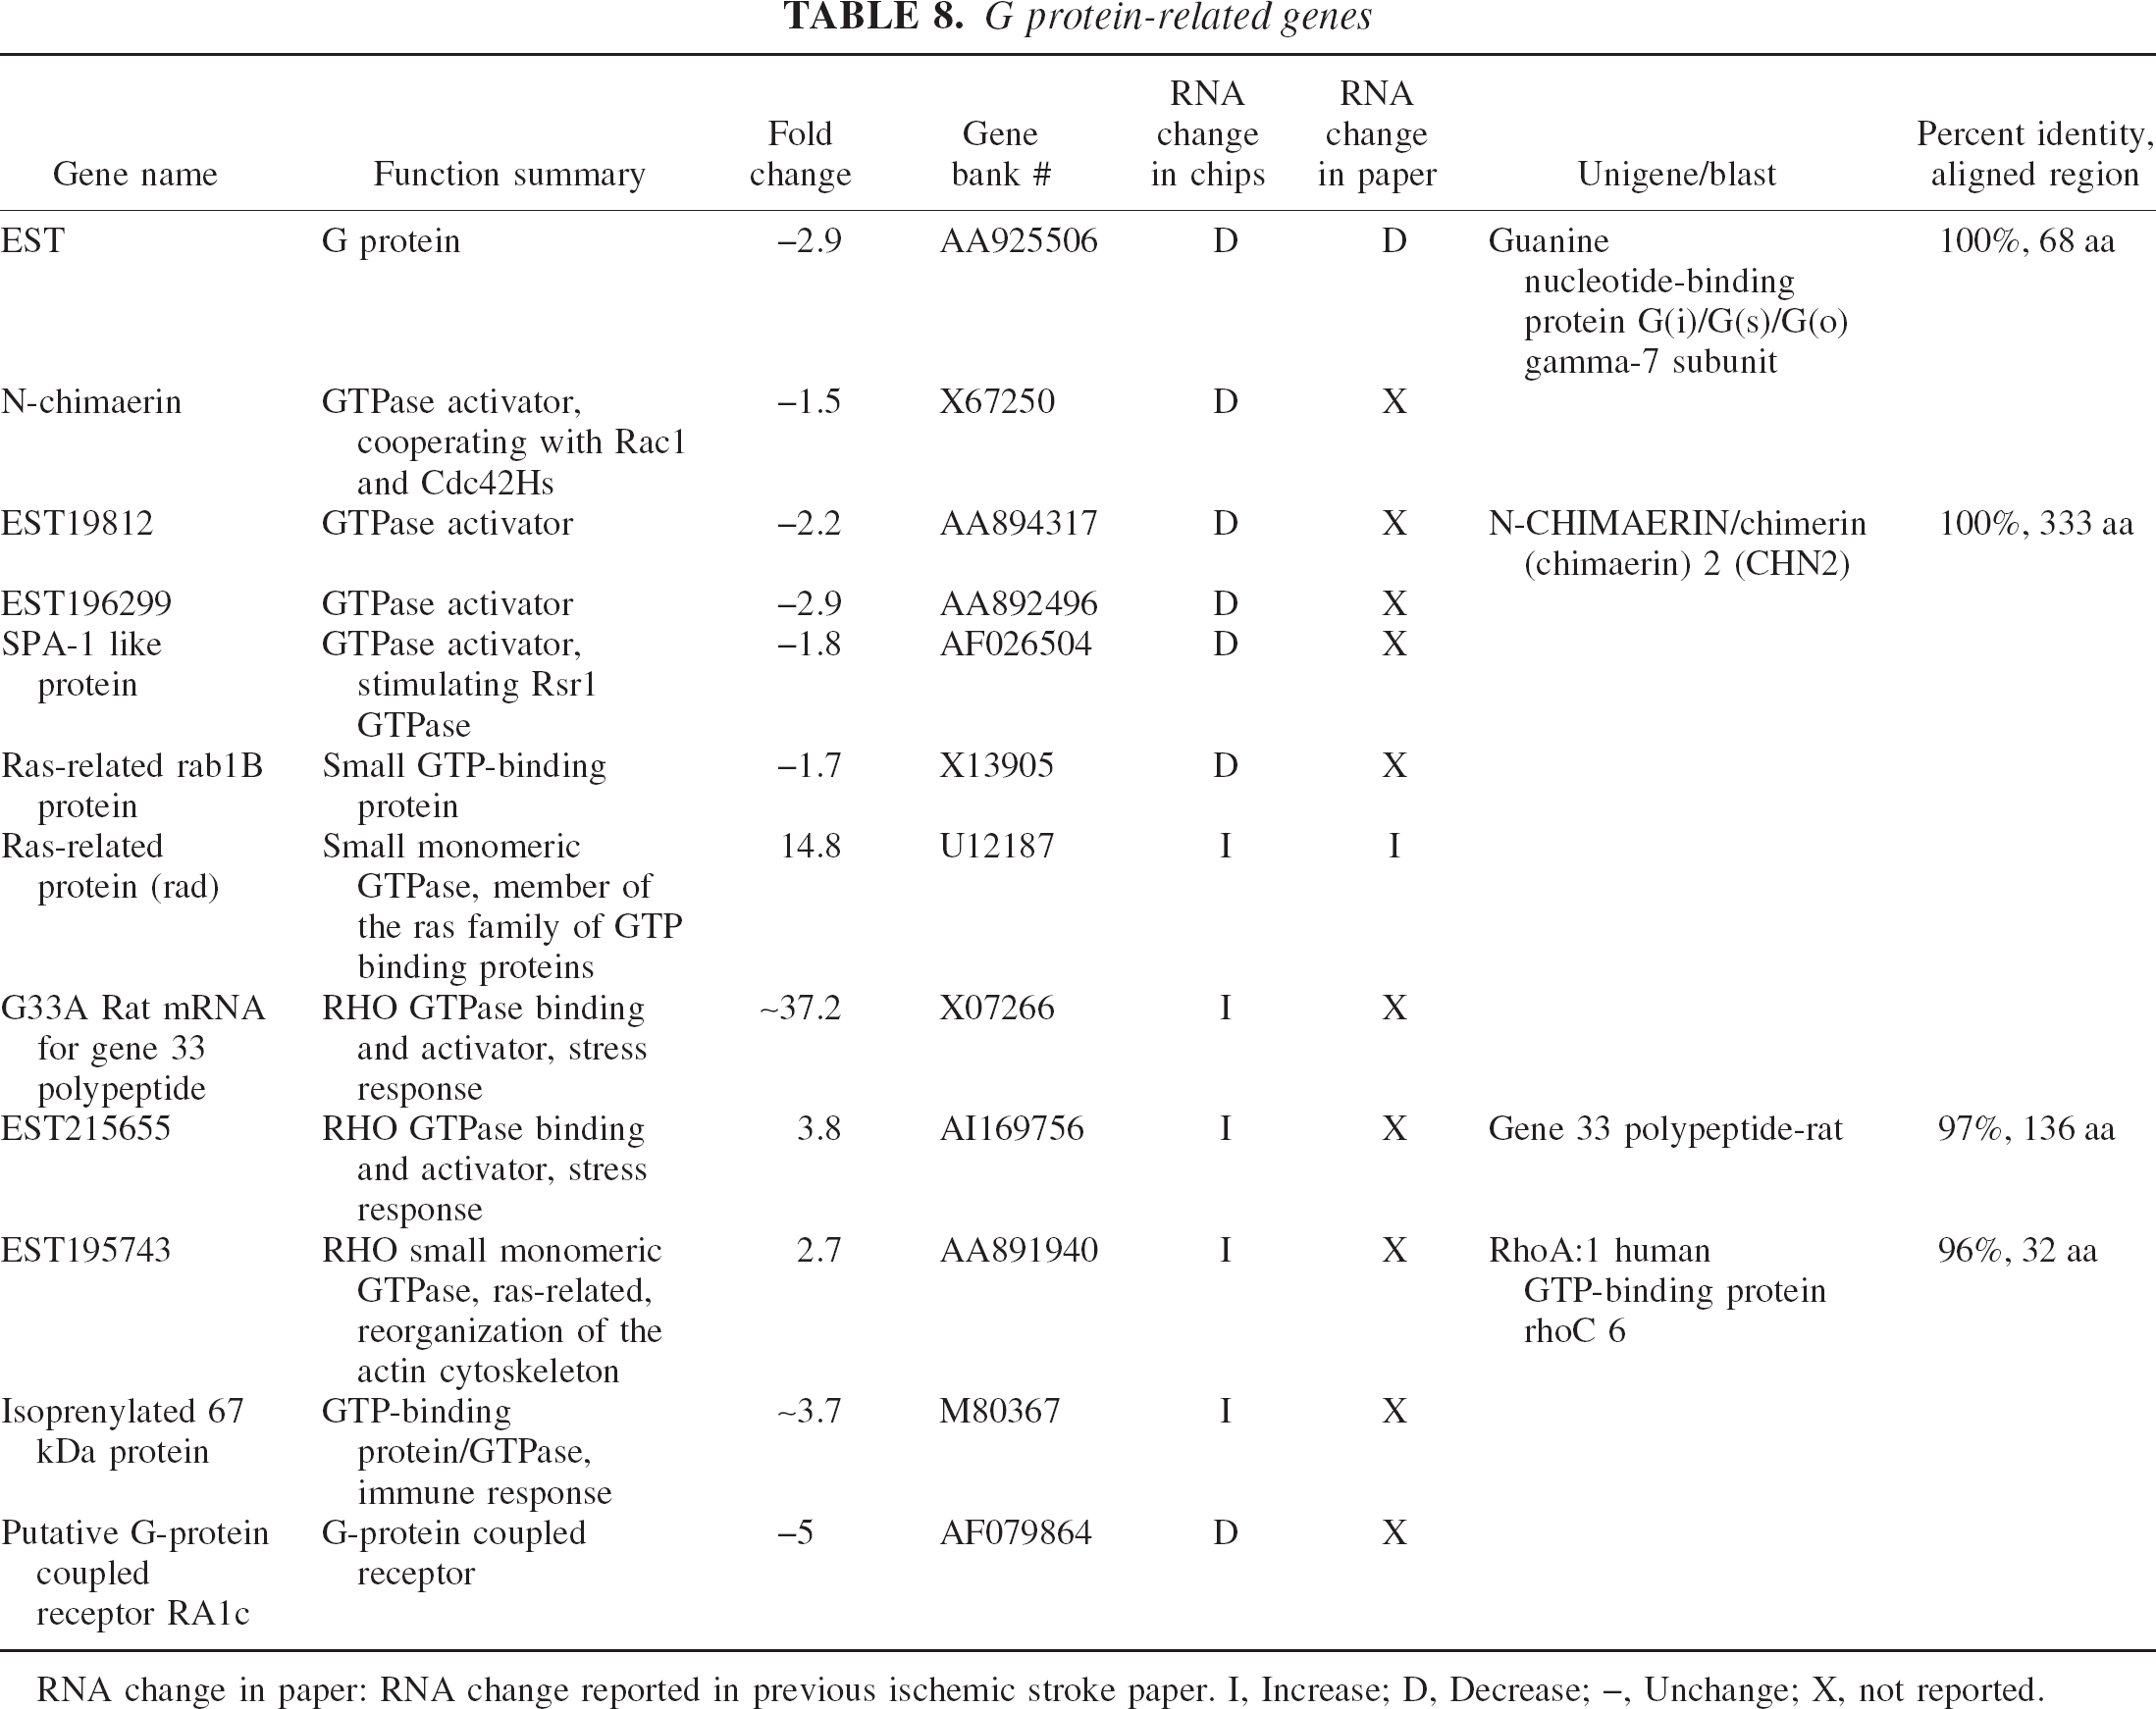
RNA change in paper: RNA change reported in previous ischemic stroke paper. I, Increase; D, Decrease; –, Unchange; X, not reported.
Transcriptional Regulation 1
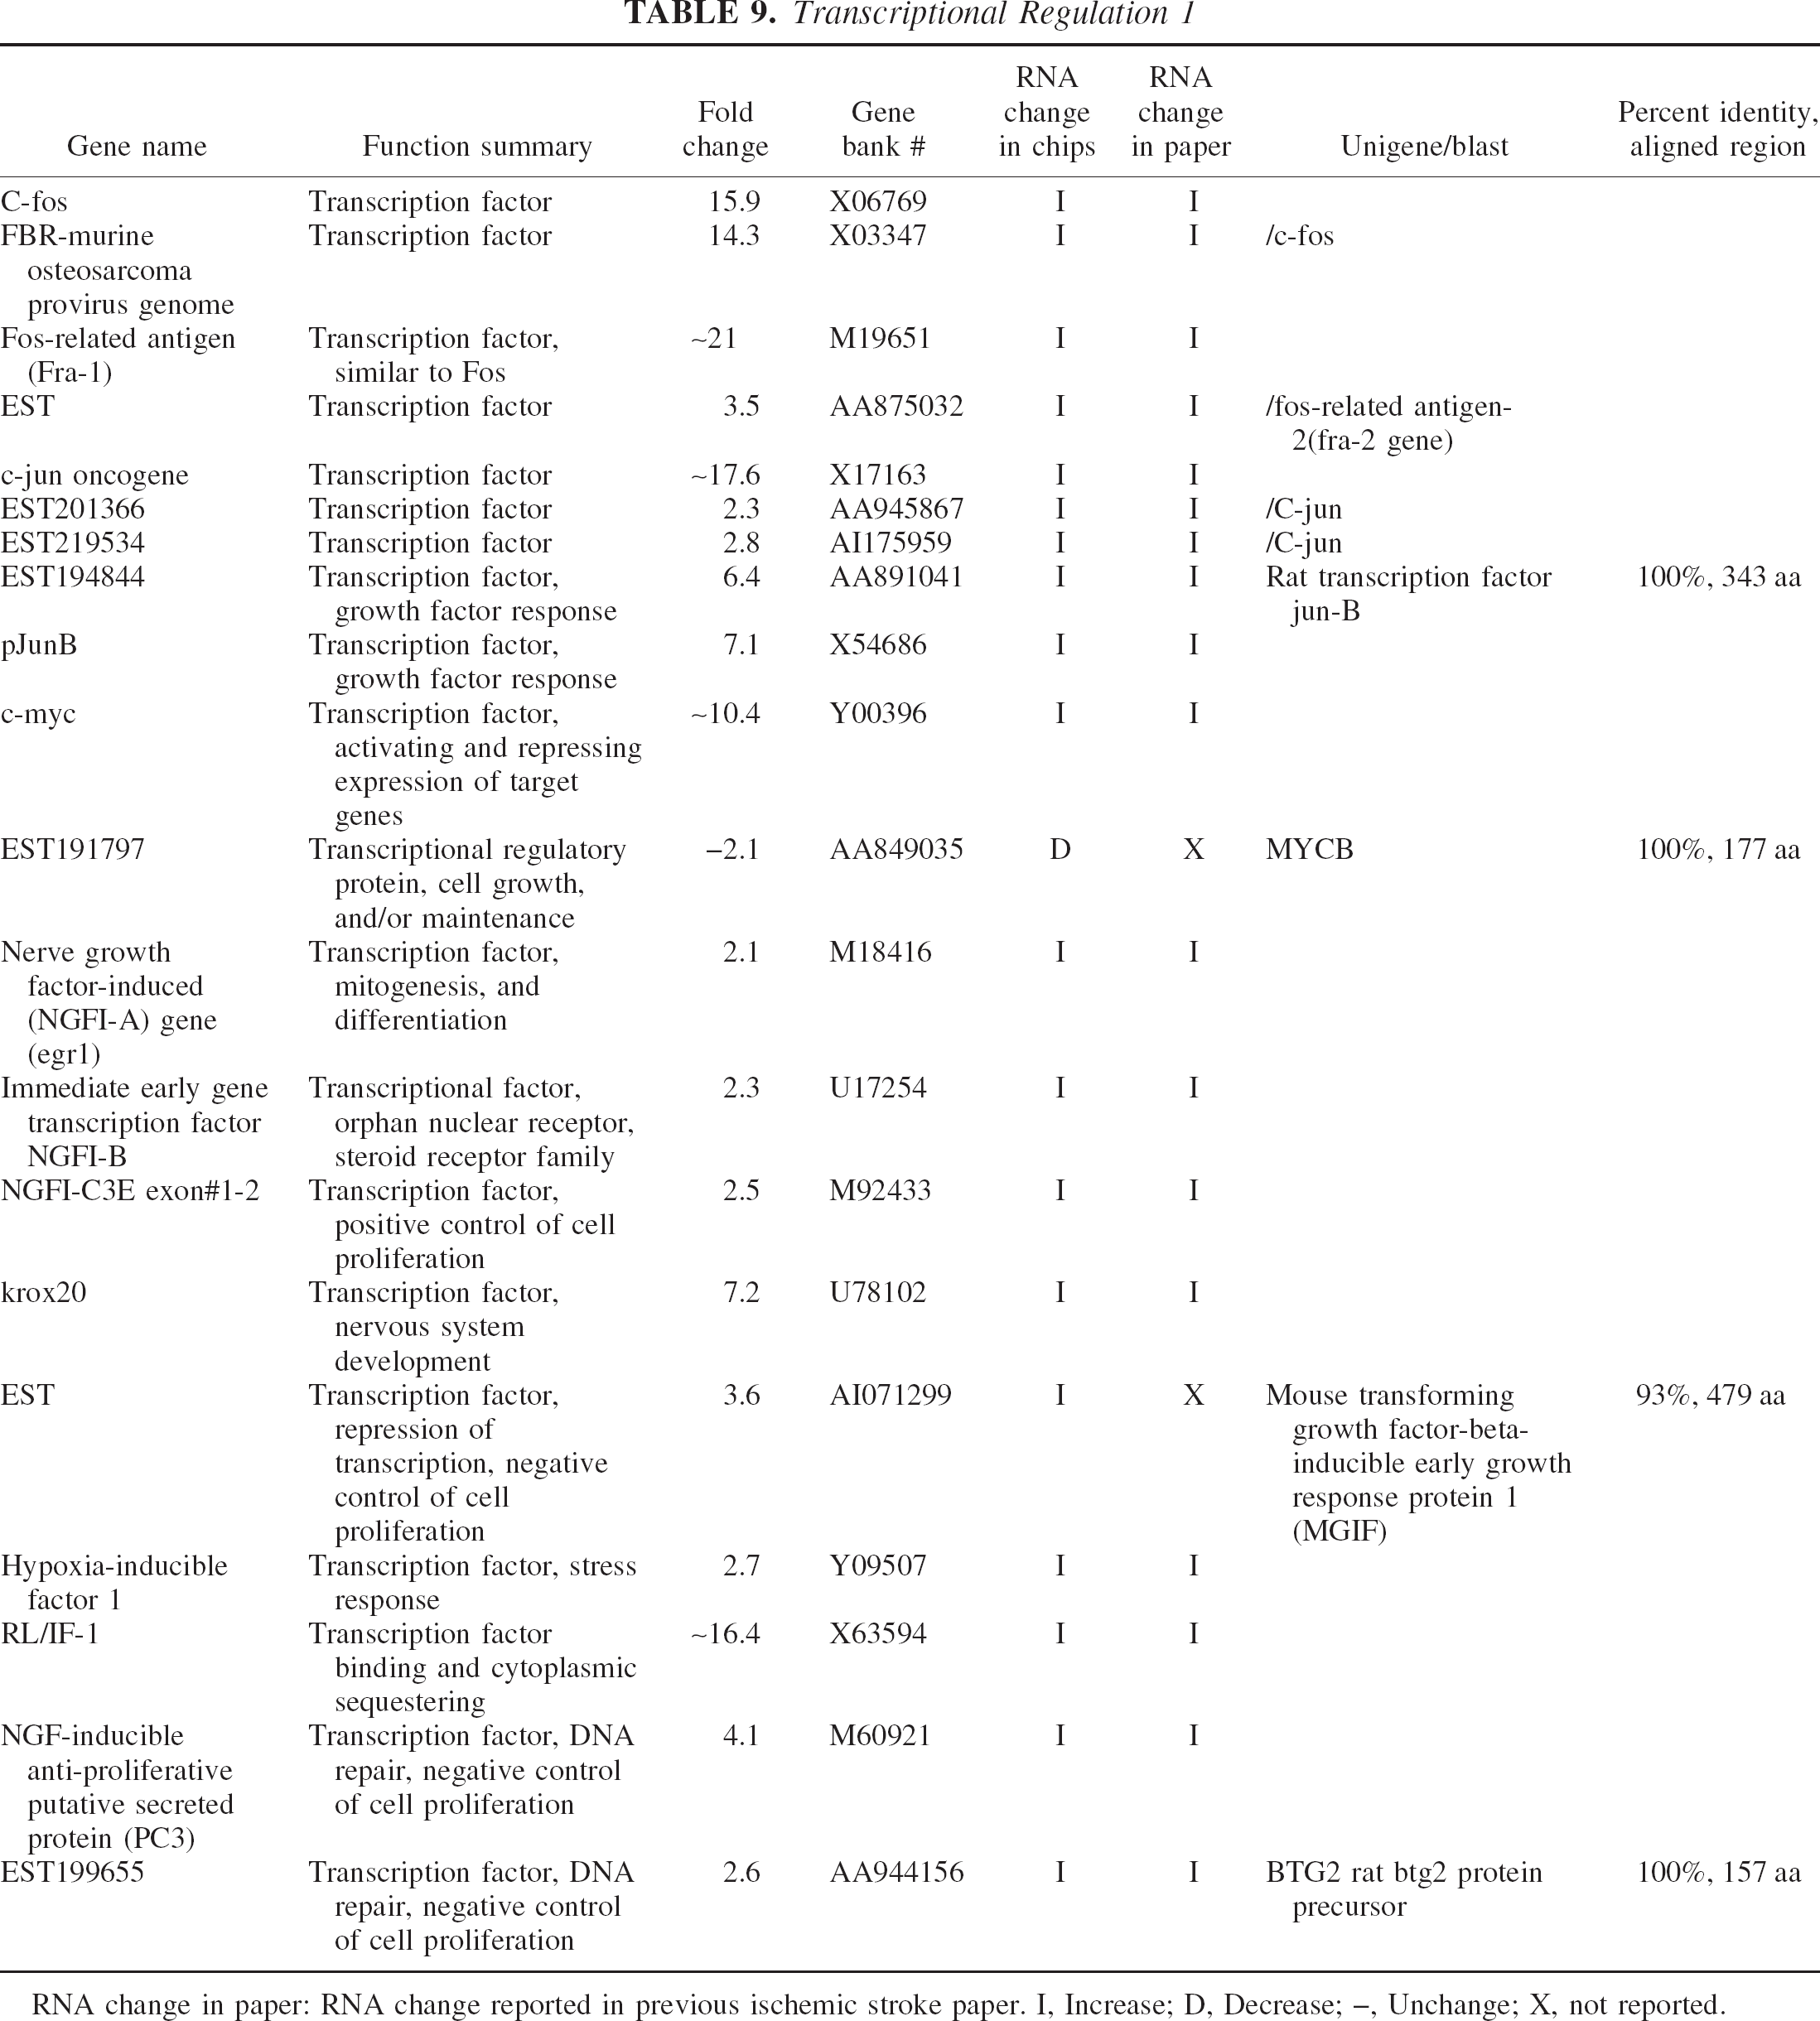
RNA change in paper: RNA change reported in previous ischemic stroke paper. I, Increase; D, Decrease; –, Unchange; X, not reported.
Trancriptional Regulation 2
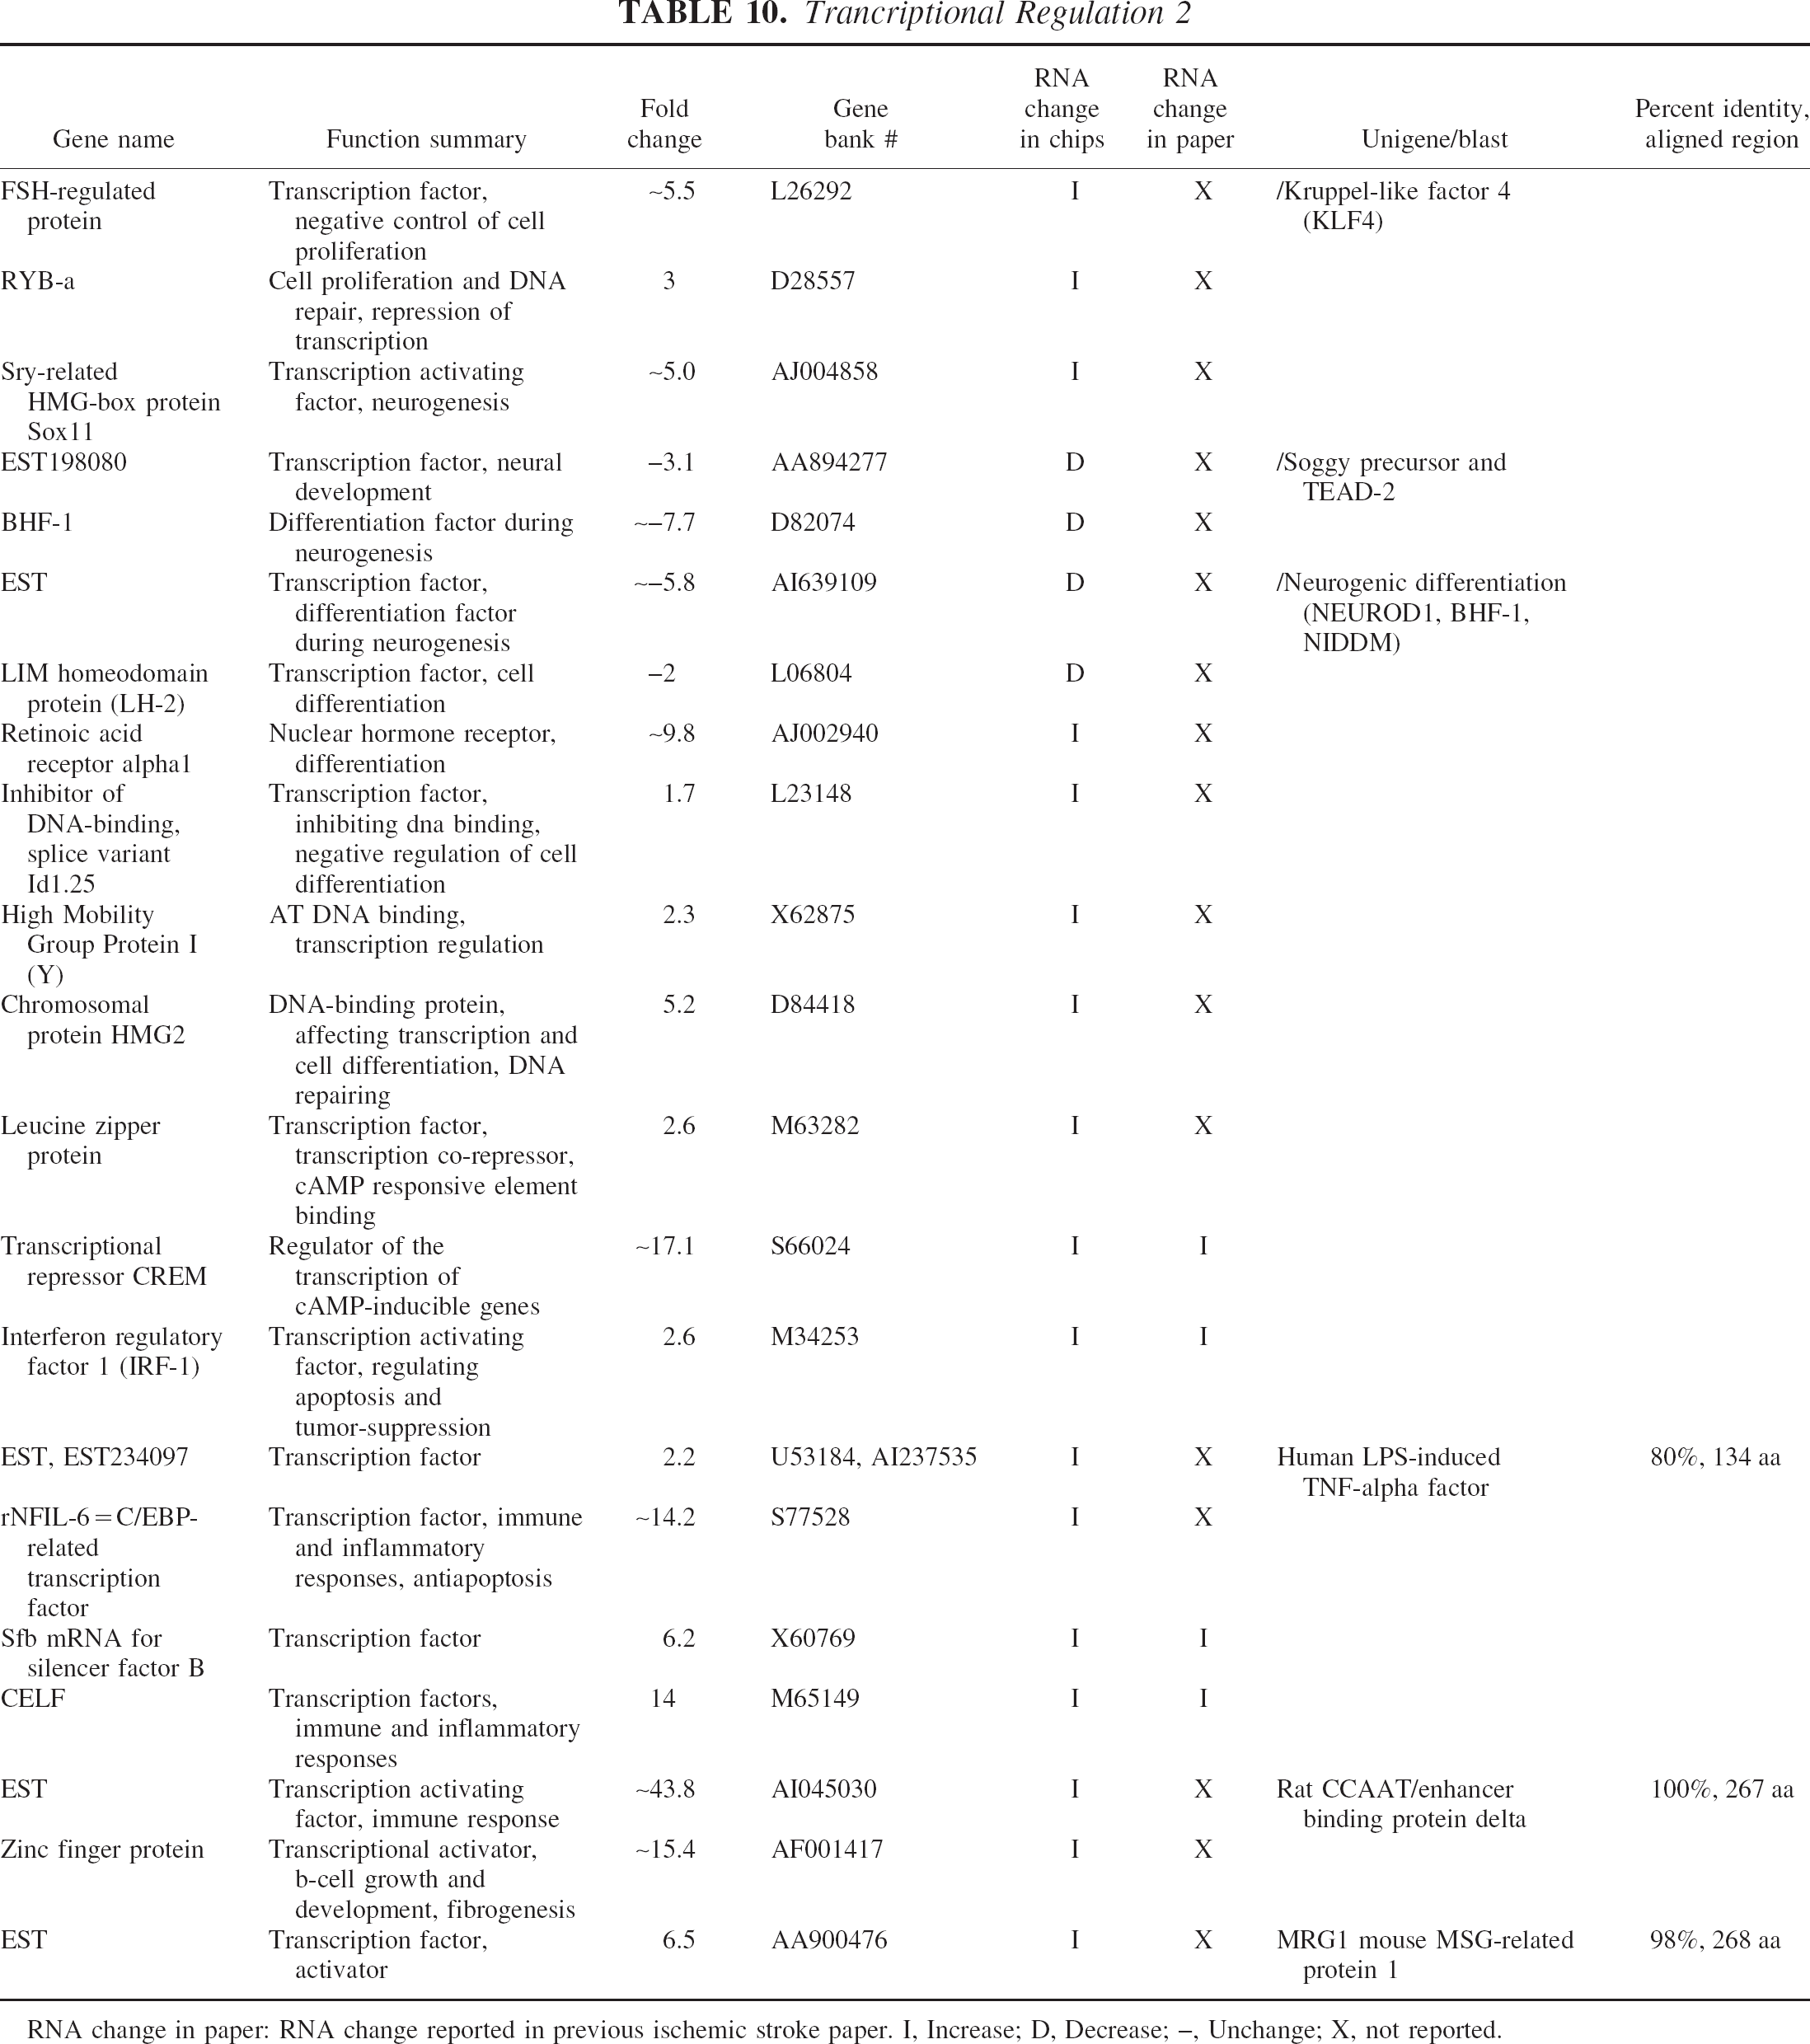
RNA change in paper: RNA change reported in previous ischemic stroke paper. I, Increase; D, Decrease; –, Unchange; X, not reported.
Extracellular matrix-related genes
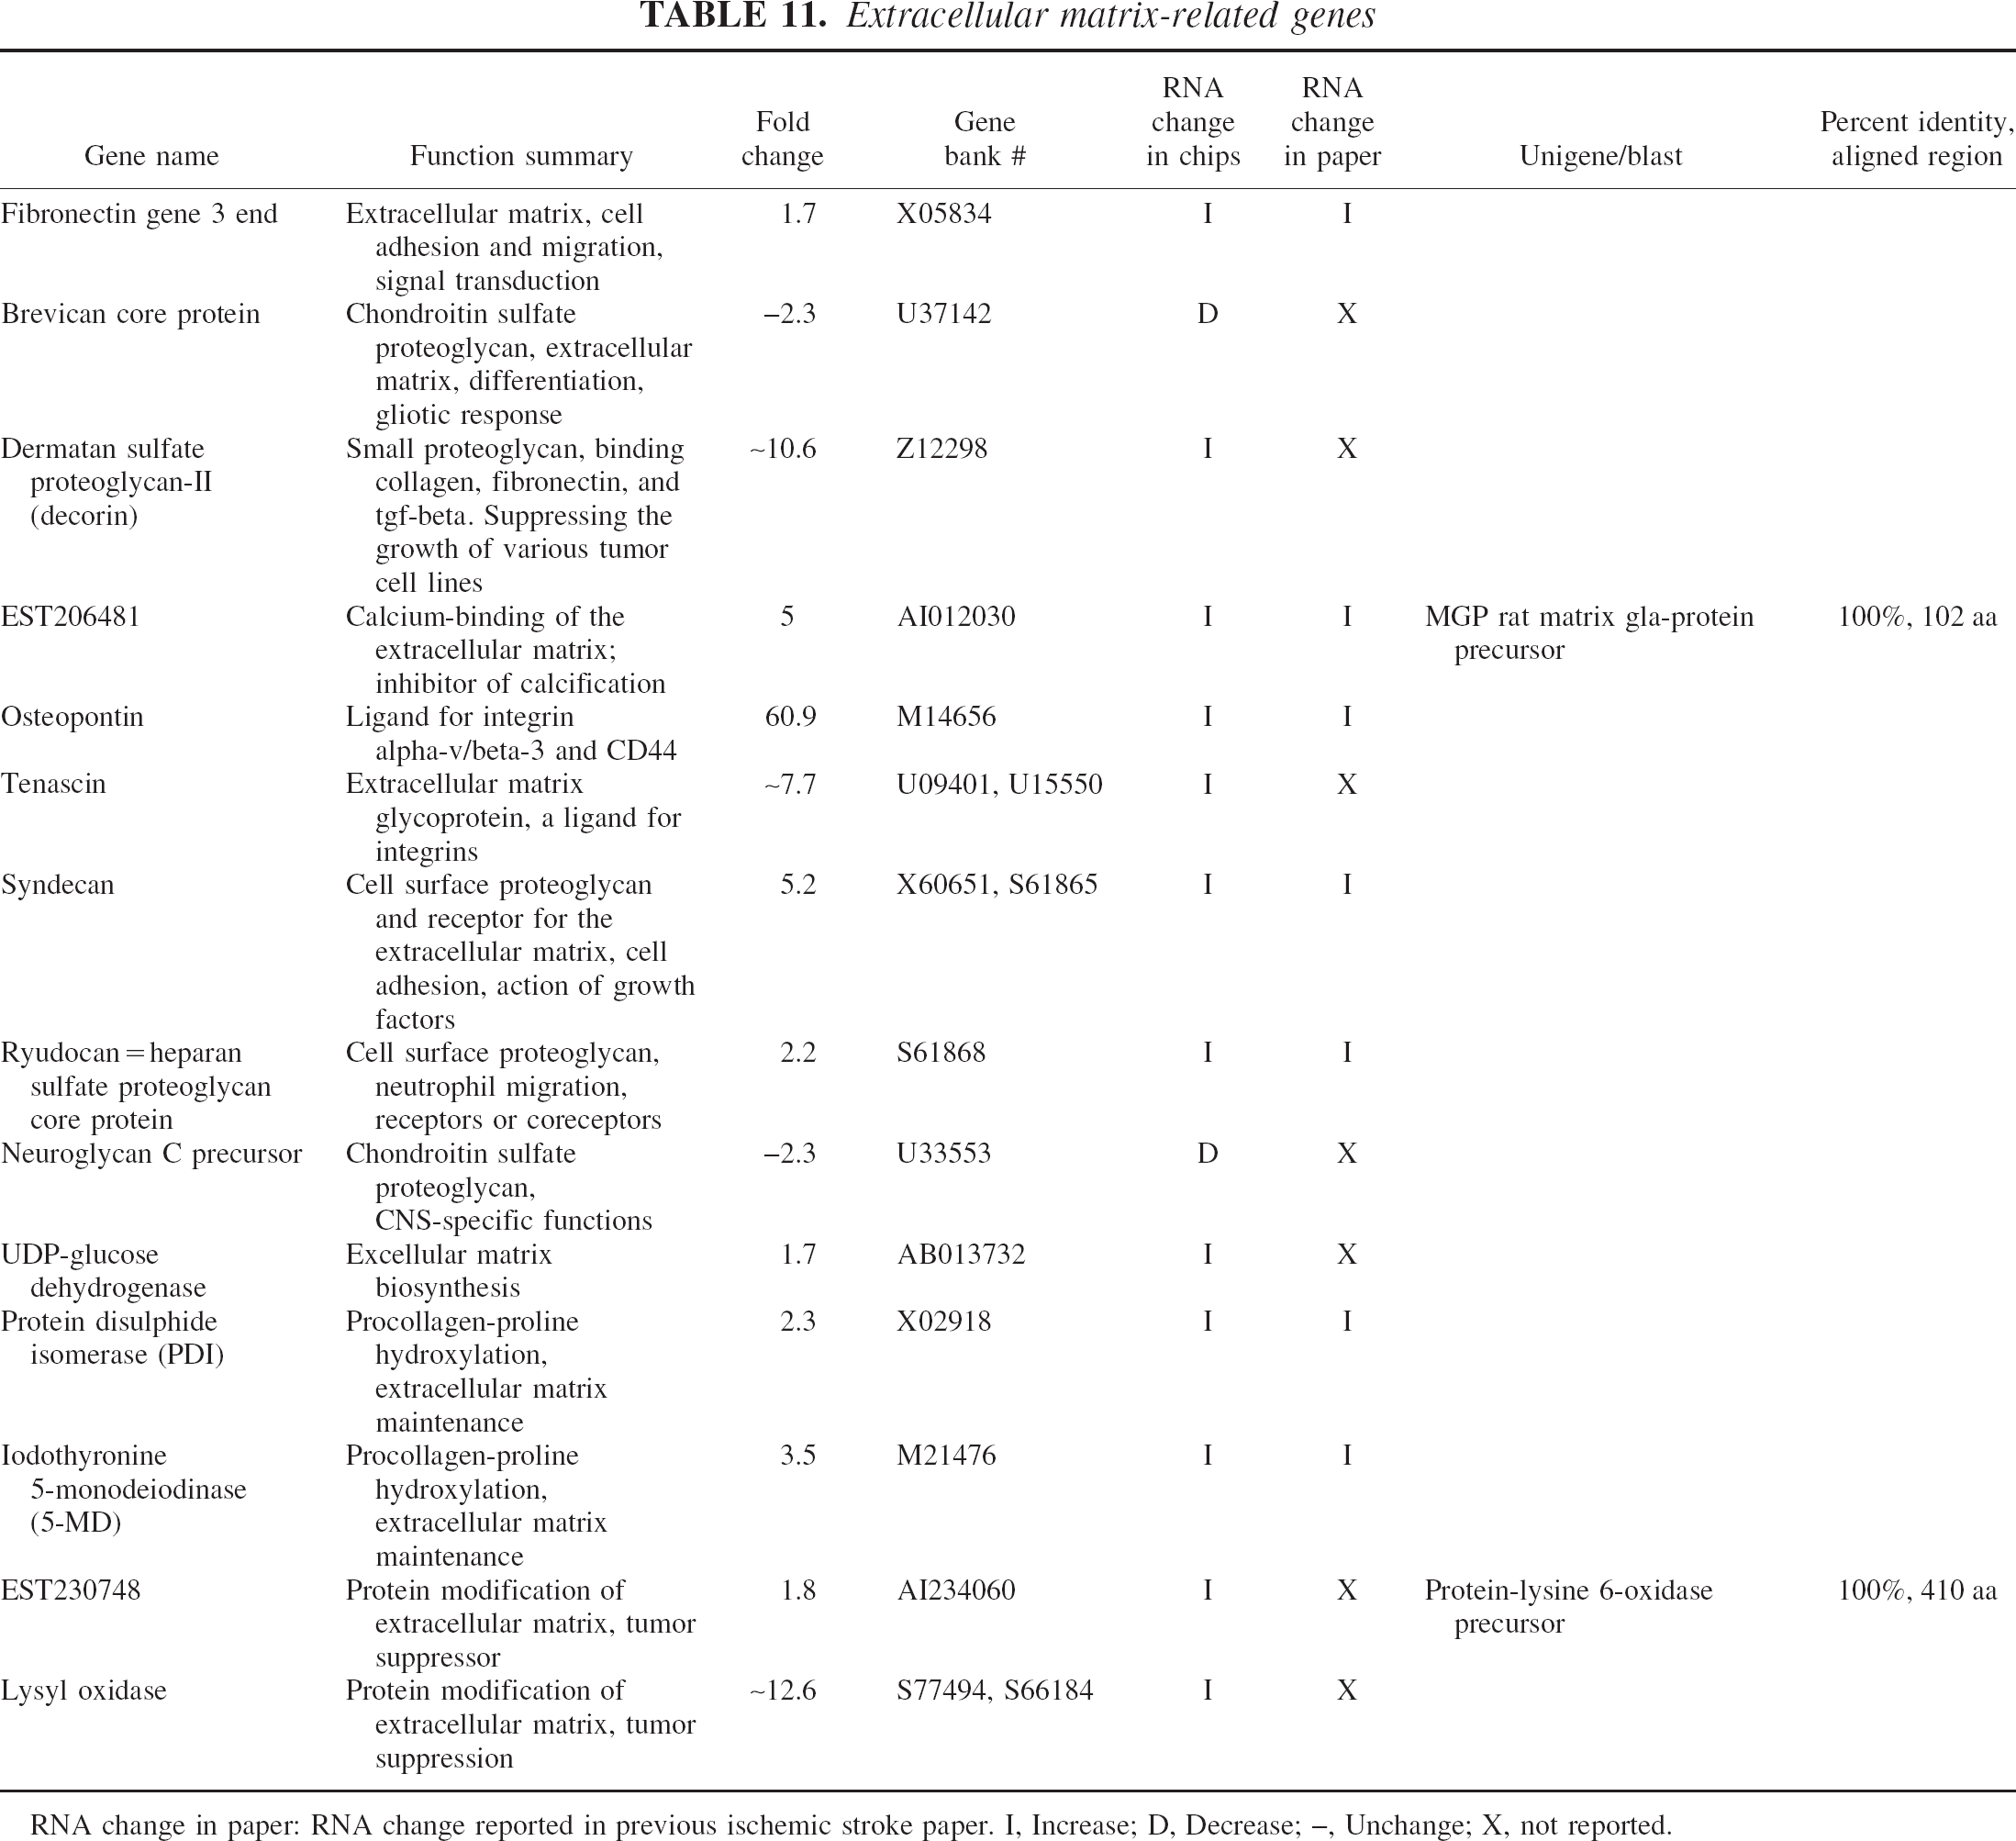
RNA change in paper: RNA change reported in previous ischemic stroke paper. I, Increase; D, Decrease; –, Unchange; X, not reported.
Genes related to cytoskeletal proteins
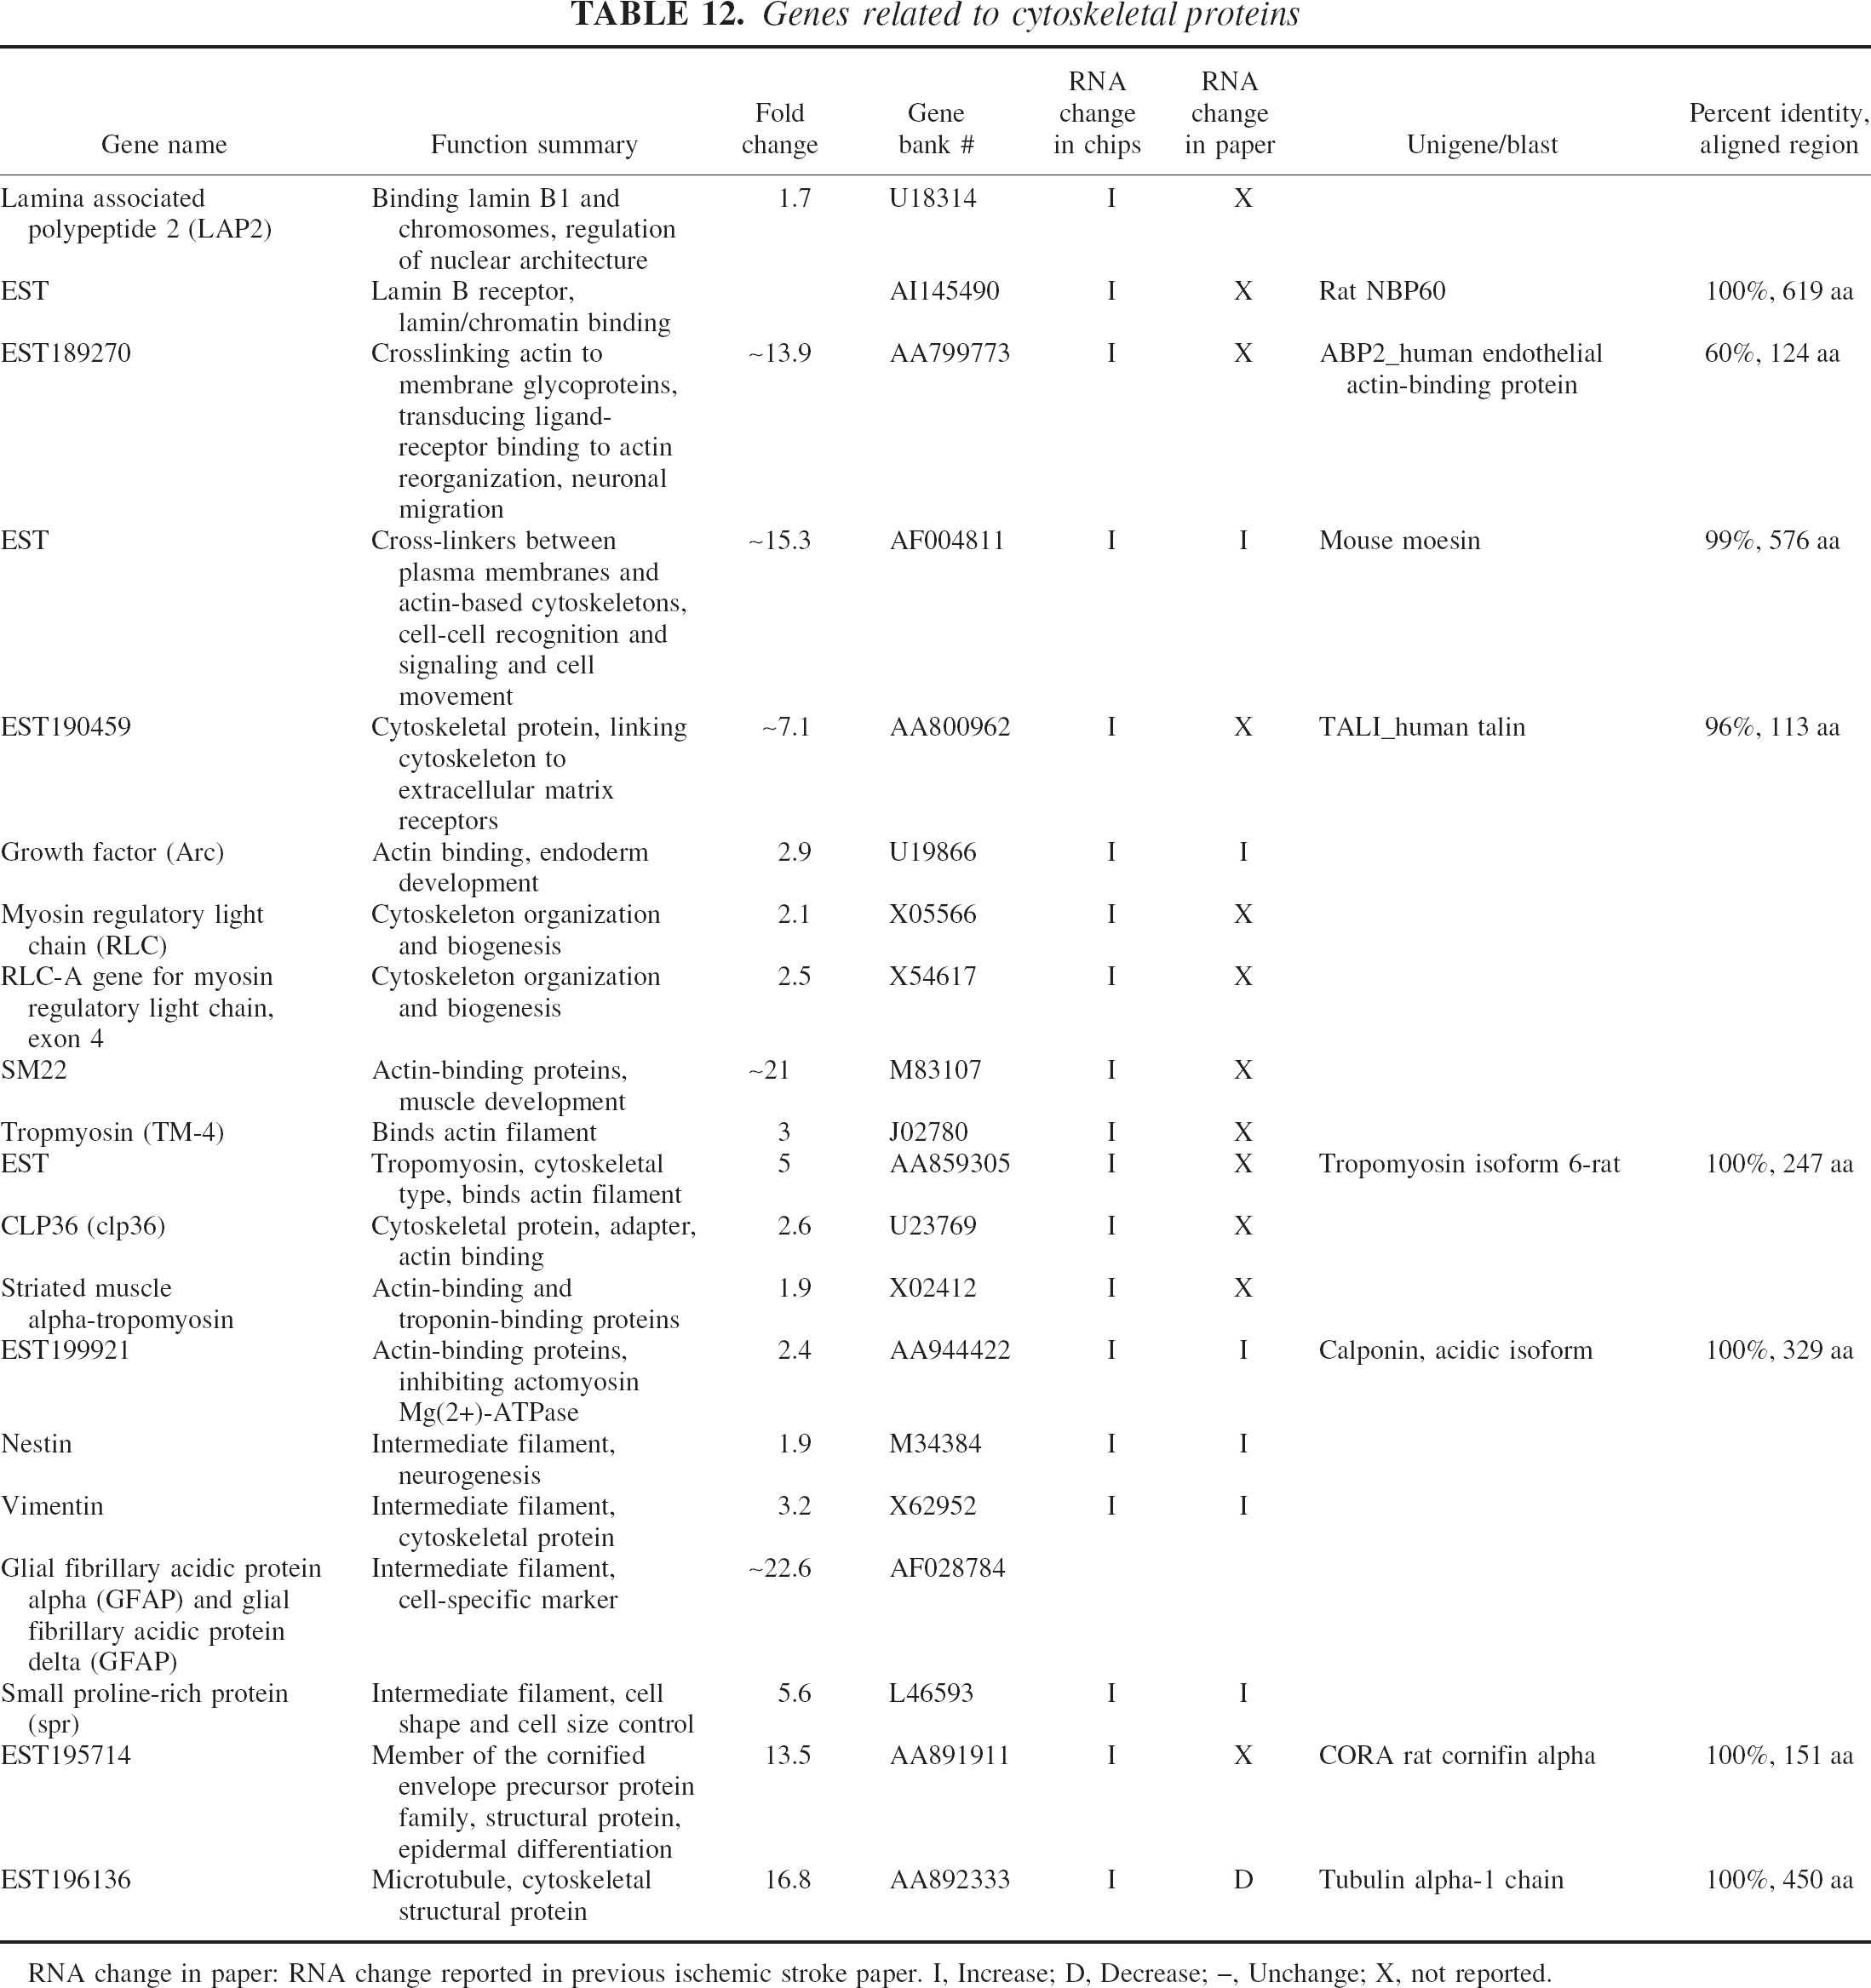
RNA change in paper: RNA change reported in previous ischemic stroke paper. I, Increase; D, Decrease; –, Unchange; X, not reported.
Ion, vesicular transport, and synaptic transmission
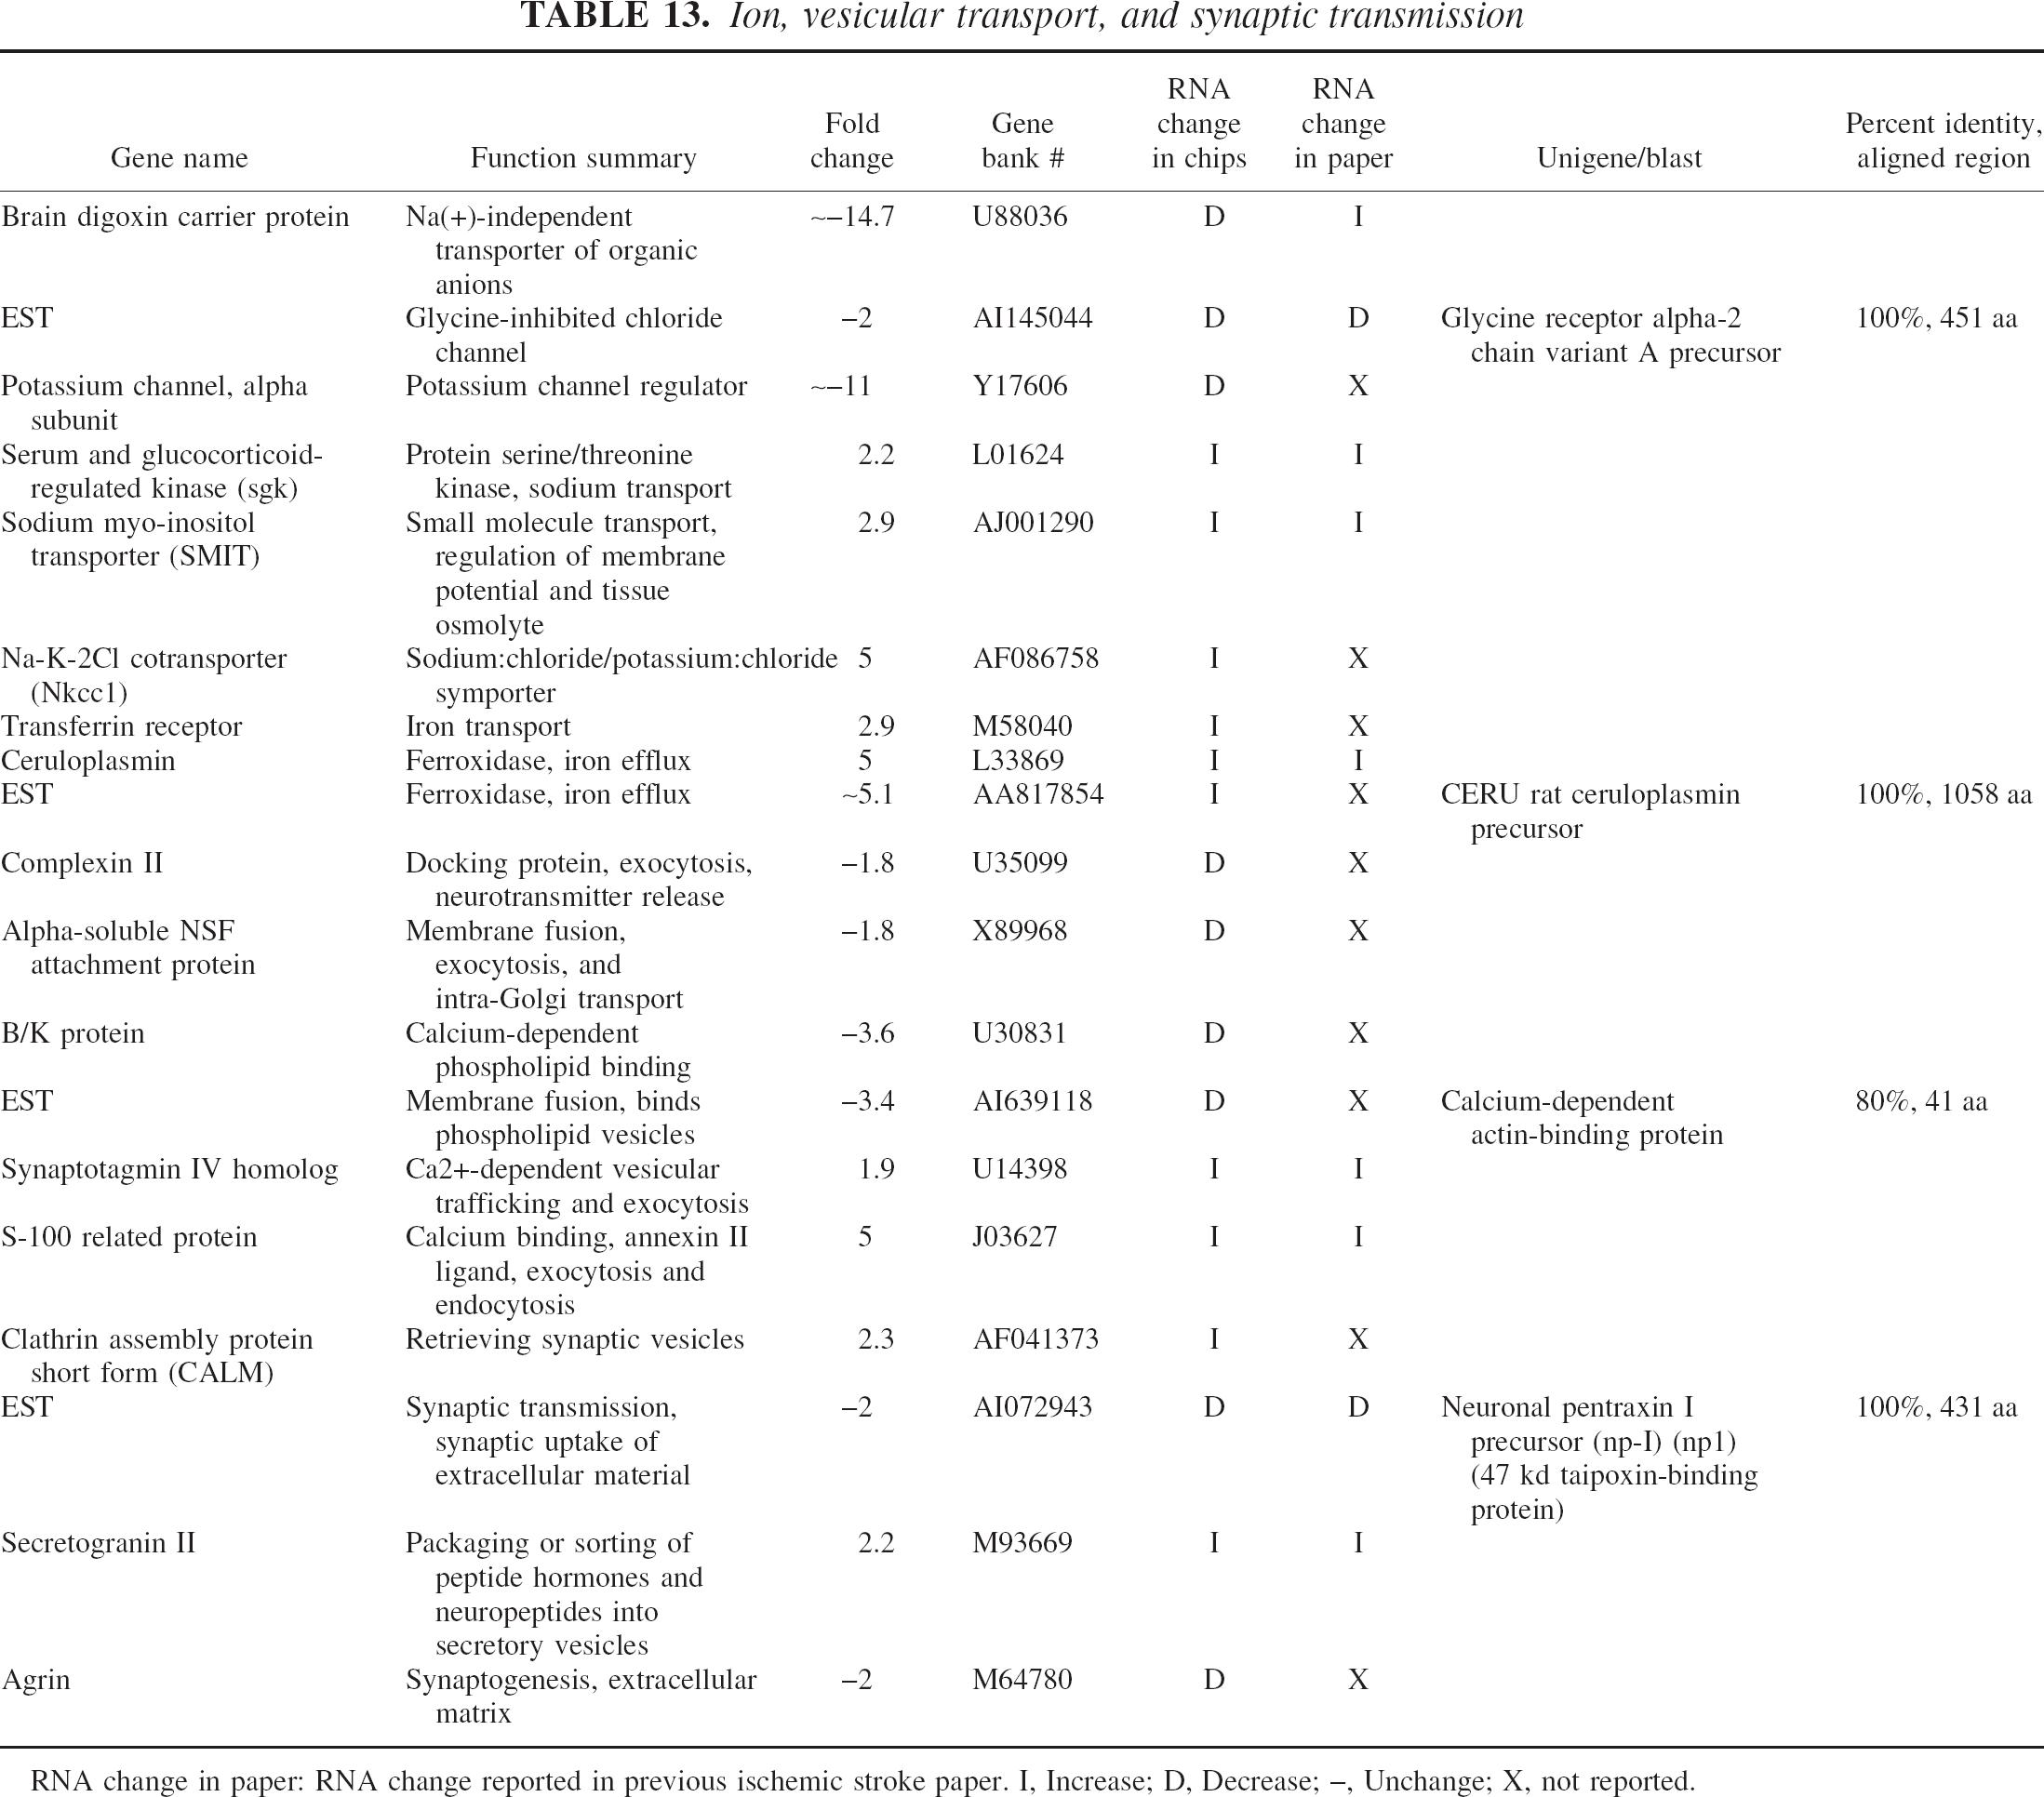
RNA change in paper: RNA change reported in previous ischemic stroke paper. I, Increase; D, Decrease; –, Unchange; X, not reported.
Genes related to cell adhesion, motility, and immune responses
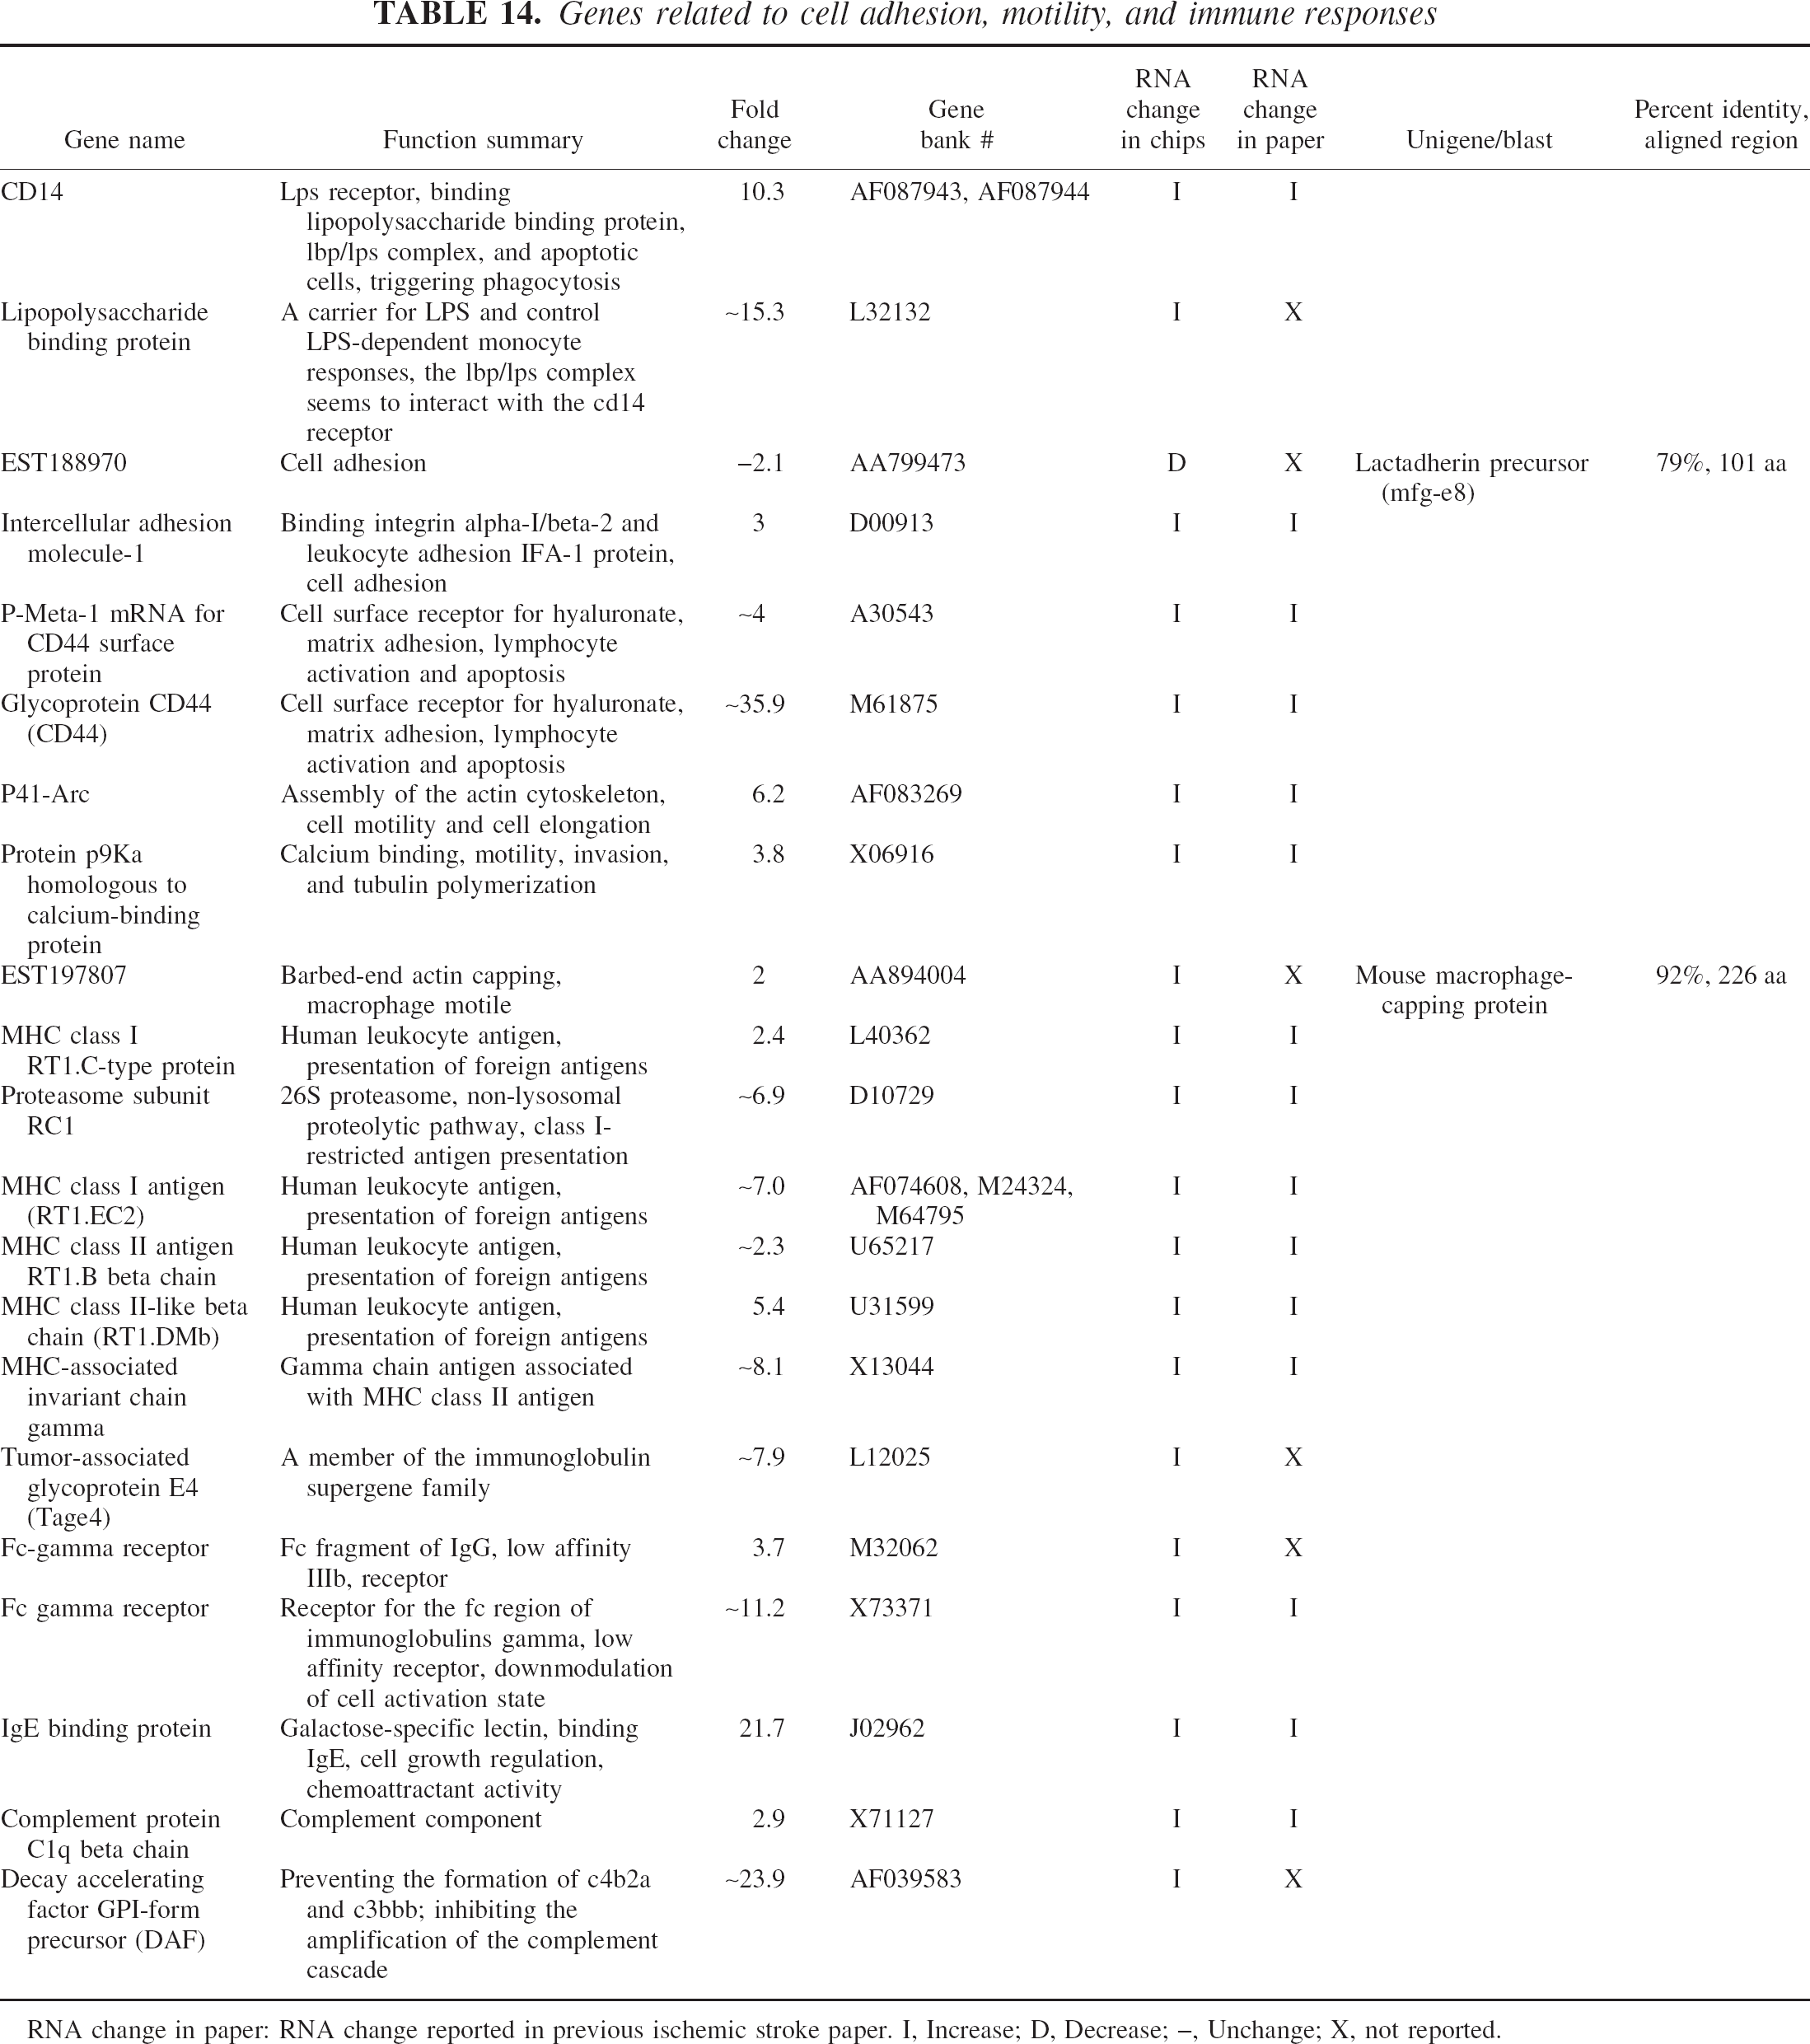
RNA change in paper: RNA change reported in previous ischemic stroke paper. I, Increase; D, Decrease; –, Unchange; X, not reported.
Real-time quantitative RT-PCR
Twenty genes were selected for RT-PCR based on whether they had important functions in cell death, were previously unreported, and had relatively high-fold changes on the microarrays. Real-time quantitative RT-PCR was performed on these genes (n = 3) using the ABI Prism 5700 Sequence Detection system (Applied Biosystems, Foster City, CA, U.S.A.) (Tang et al., 2001). Primer and probe sequences were selected from coding regions of each of the genes with the aid of Primer Express 2.0 (Applied Biosystems). All primers and probes were synthesized using PE Oligofactory (Applied Biosystems). Each probe was labeled at the 5′-end with the reporter dye VIC and at the 3′-end with quencher dye TAMRA (6-carboxytetramethyl-rhodamine) and was phosphate blocked at the 3′-end to prevent extension by AmpliTaq Gold DNA polymerase. One-step RT-PCR was performed according to the Taqman One-Step RT-PCR Master Mix Reagent kit protocol (Applied Biosystems). Fifty to 100-ng total RNA, 900-nmol/L primer and 250-nmol/L probe were added for the selected genes. Thermal cycling was carried out as follows. Reverse transcription: 48°C for 30 minutes; activation of hot started AmpliTaq Gold DNA polymerase: 95°C for 10 minutes; thermal cycling: 95°C for 15 seconds, and 60°C for 1 minute for 40 cycles. The amplified transcripts were quantified with the relative standard curve method and using GAPDH as a loading control.
RESULTS
Total number of regulated genes
A significant number of genes were regulated at 24 h after permanent focal ischemia (Figs. 1 and 2; Tables 1–15). Of the 328 transcripts (from 8,740 on the microarrays) that differed from the sham-operation group using the criteria above (all present and fold change >1.7 for all comparisons), 264 genes and ESTs were upregulated, and 64 genes and ESTs were downregulated. Figure 1 shows a scatter plot of increased expression (brown and red) and decreased expression (green) of transcripts in the 24-h ischemic samples compared with sham-operation controls. It is notable that many genes showed greater than 10-fold increases of expression. Figure 2 shows that the 328 regulated genes cluster into two groups: those that increase in animals with stroke and those that decrease in animals with stroke (Fig. 2). This unsupervised cluster also shows the relative consistency of expression of upregulated (red, threefold increase) and downregulated genes (blue, threefold decrease) in the three stroke animals compared to the three sham-operated animals (Fig. 2).
Others
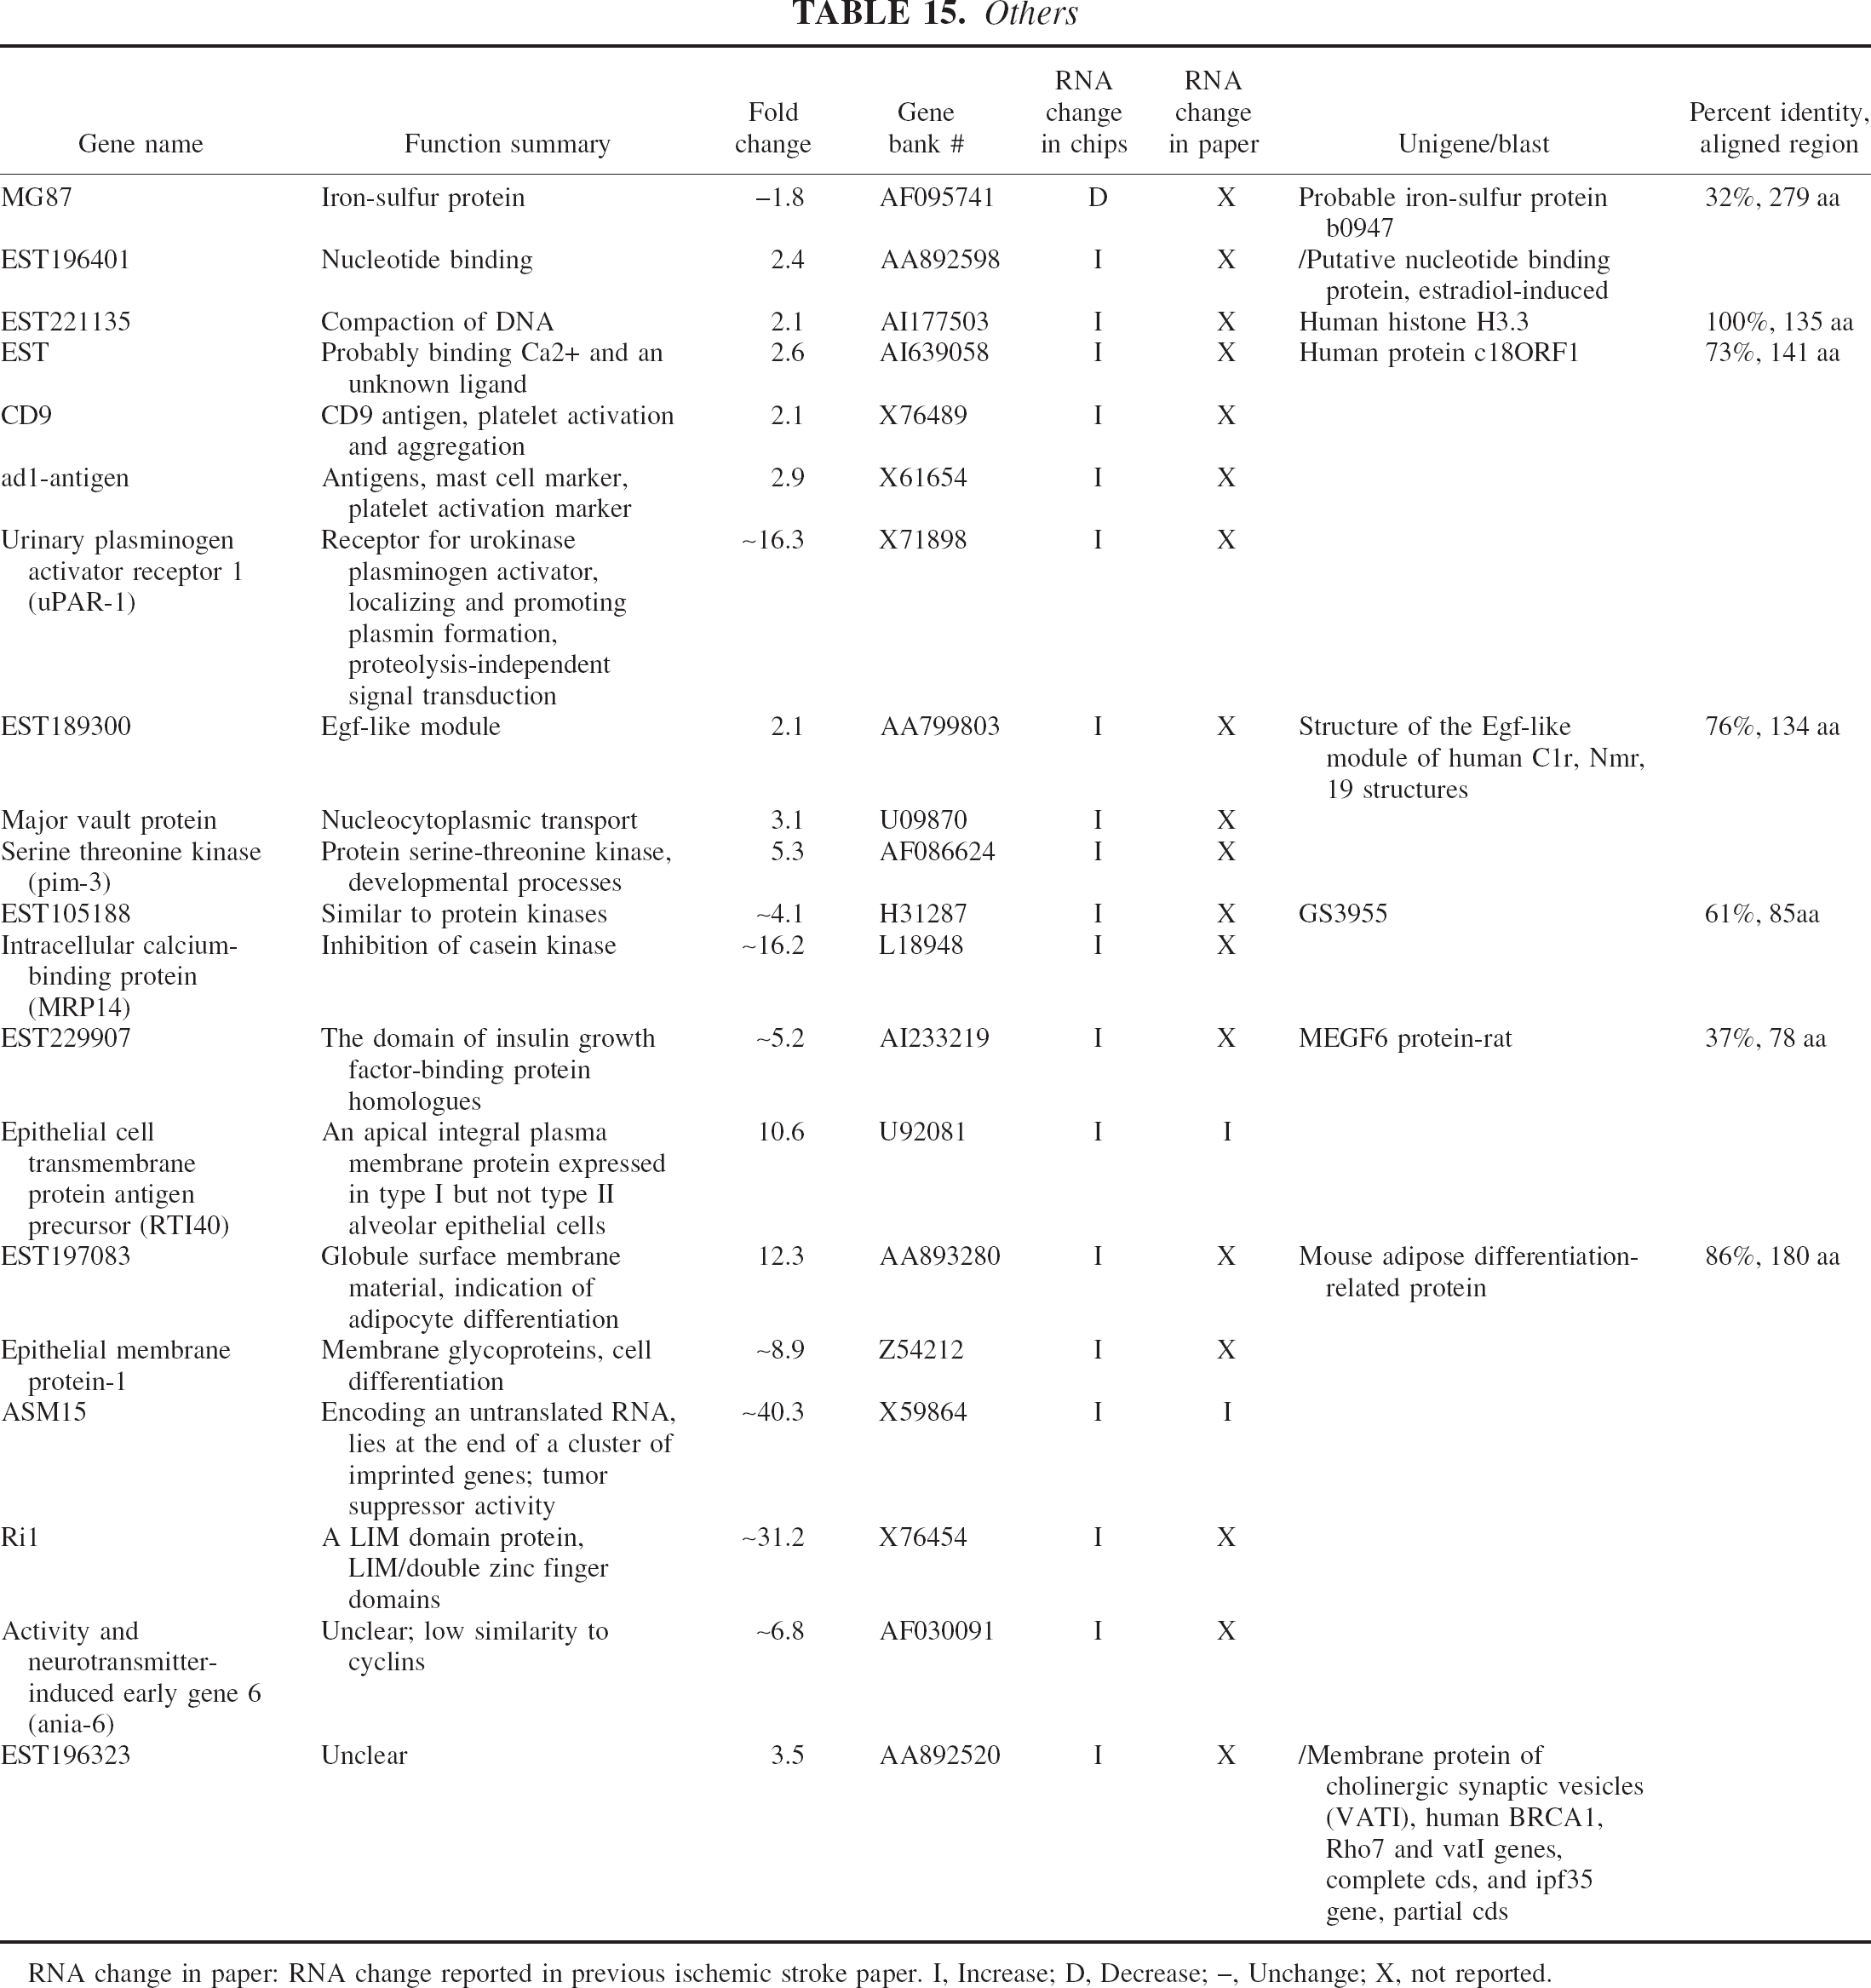
RNA change in paper: RNA change reported in previous ischemic stroke paper. I, Increase; D, Decrease; –, Unchange; X, not reported.
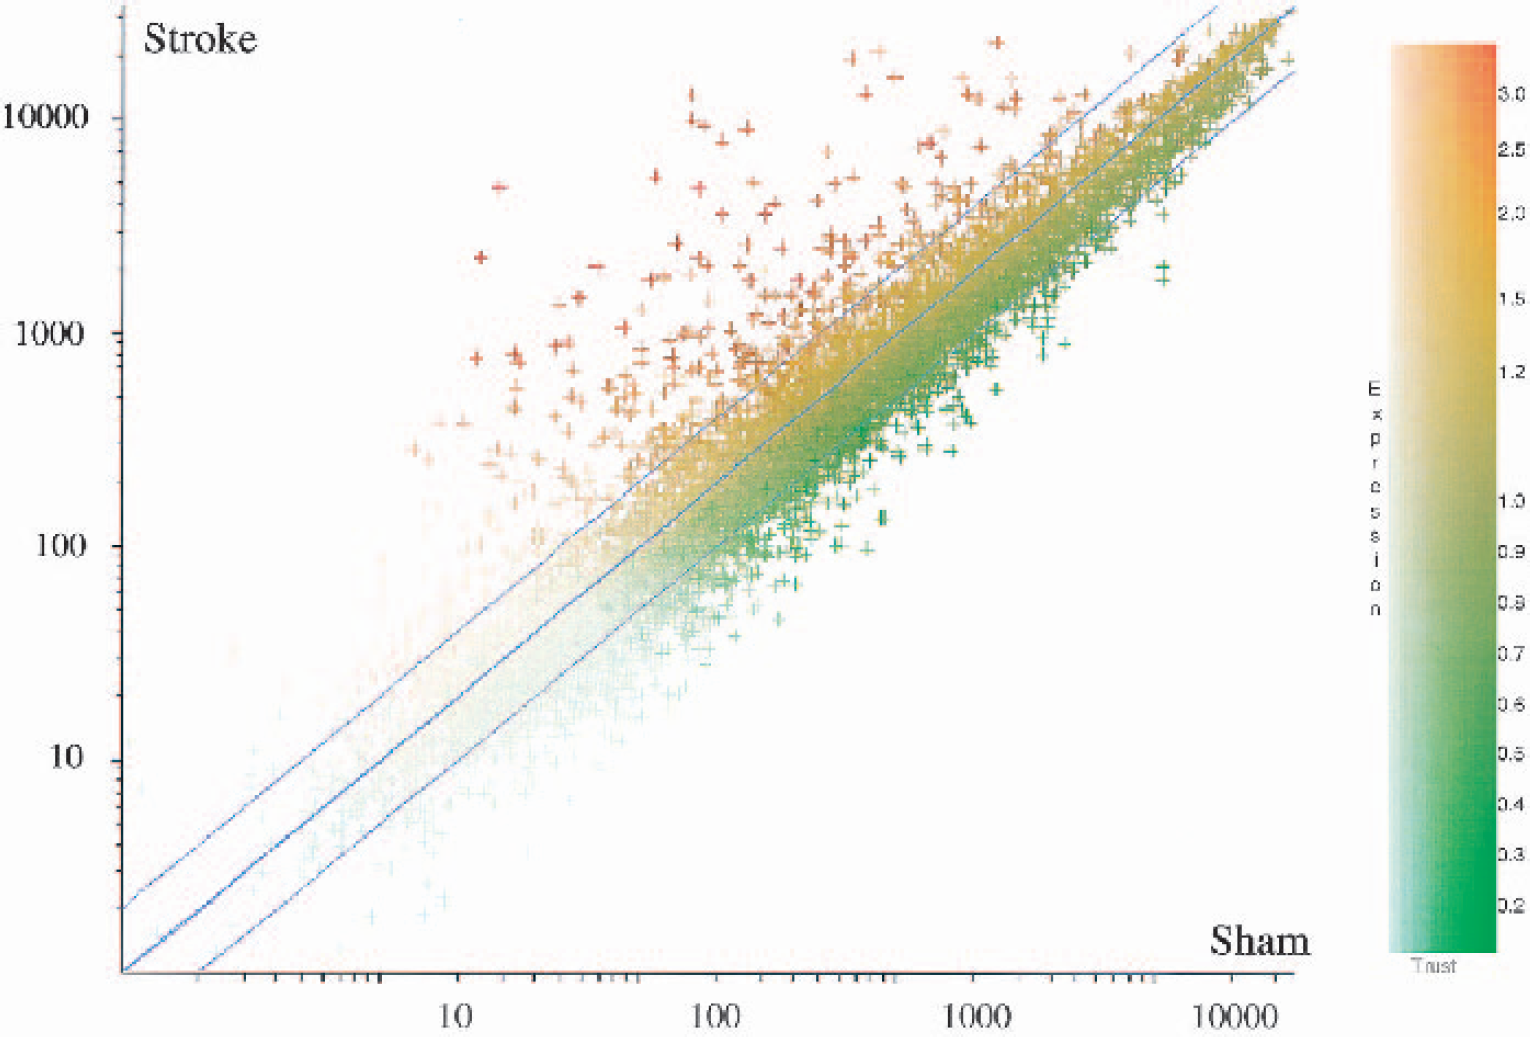
Scatter plot showing the average hybridization signal intensity of the genes in the ischemic (n = 3) compared with the sham surgery (n = 3) group. The diagonal lines indicate twofold change in the ischemic group compared with the sham group (twofold increase, upper line; twofold decrease, lower line). Significantly upregulated transcripts in the ischemic compared with sham groups are shown in red–brown; significantly downregulated transcripts in the ischemic compared to the sham groups are shown in green.
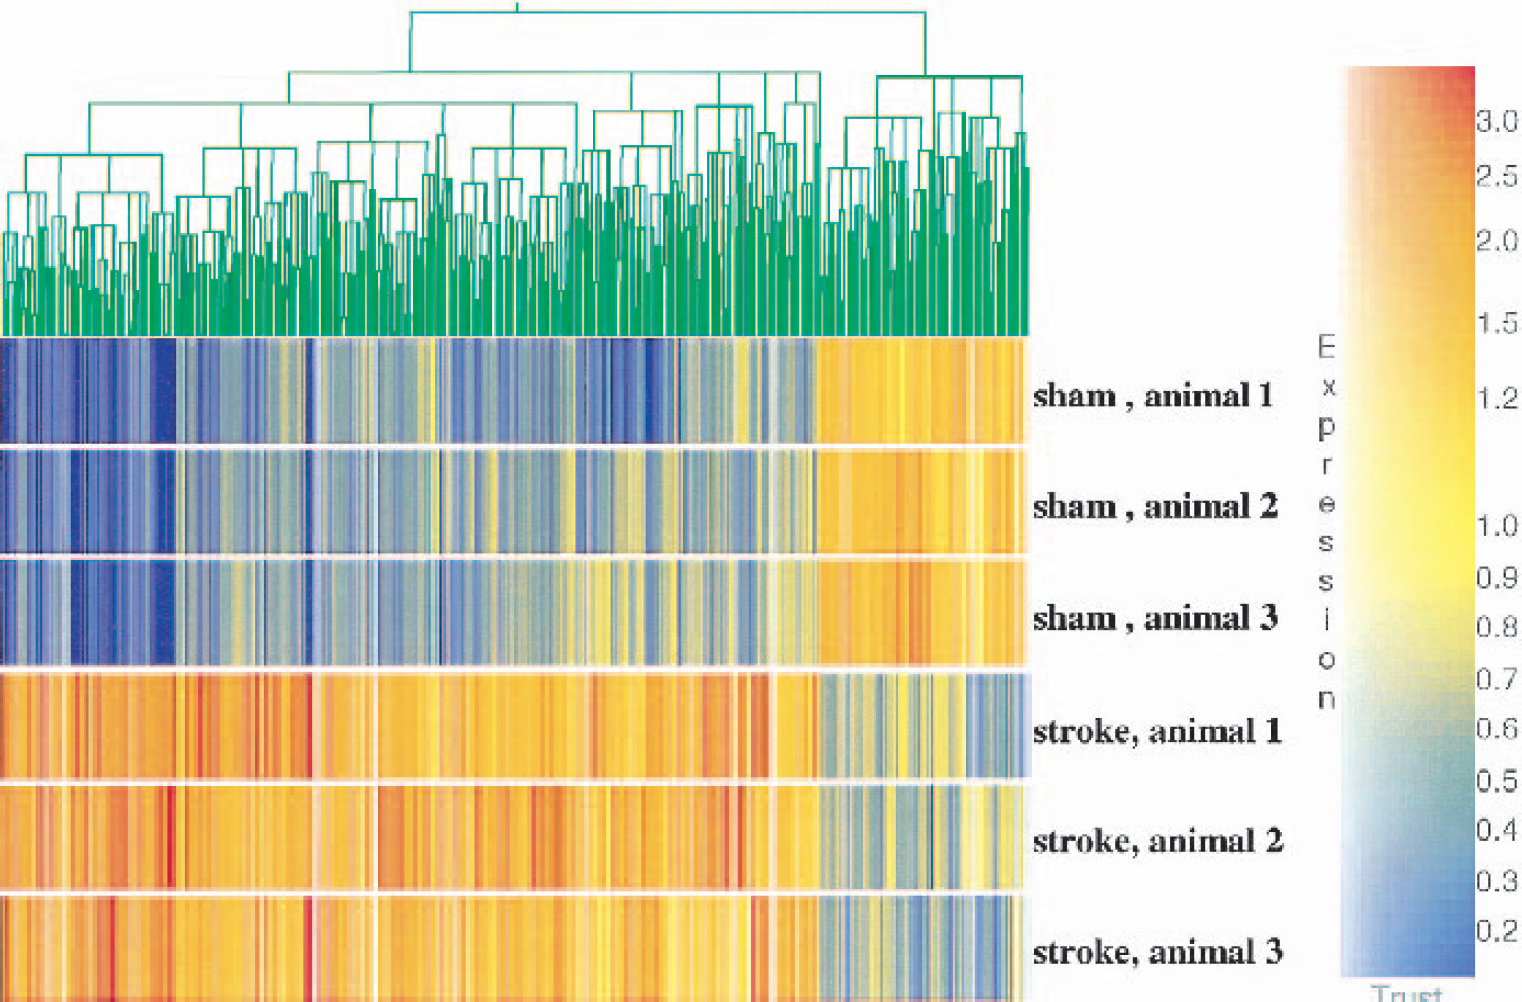
Hierarchical clustering of regulated genes in the ischemic group compared with sham group. Red represents threefold increases of expression compared with the means, and purple–blue indicates threefold decreases of expression compared with the means. The expression of the three sham animals is shown in the top three rows, and the expression of the three ischemic animals is shown in the bottom three rows. The expression of individual genes is shown in thin vertical columns. Note that a great many genes are induced in the three ischemic animals compared with the shams (left three fourths of the cluster), and a smaller set of genes are decreased in the three ischemic animals compared with the shams (right one fourth of the cluster).
By searching PubMed and performing Blast analyses, it was estimated that 165 (50%) of the 328 regulated genes had been reported in previous stroke studies. Of note, 147 known genes (45%) had not been reported to be regulated after stroke or other type of ischemia, and 16 (5%) were unknown ESTs. Thus, half (49.7%) of the transcripts reported in this study have not been reported in previous stroke or ischemia studies (Fig. 3).
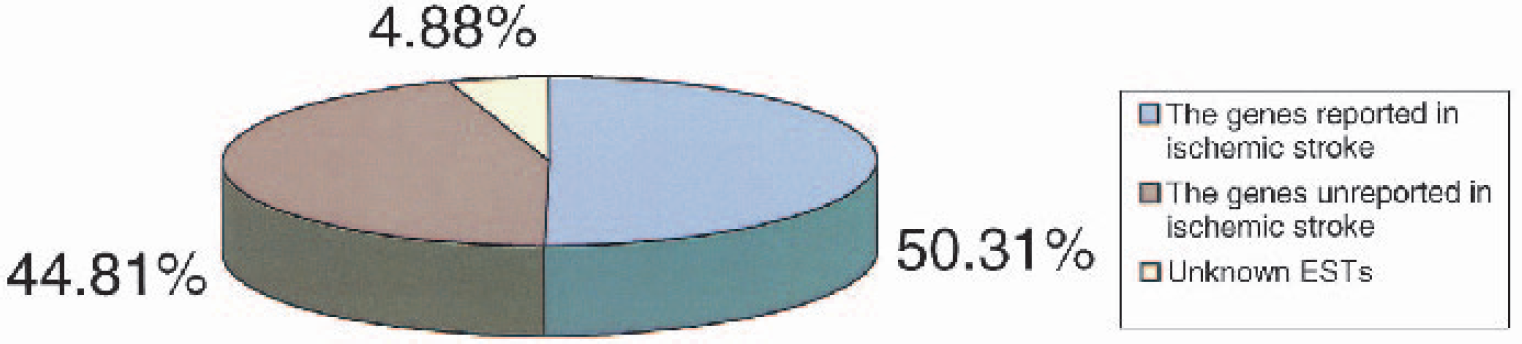
Pie chart showing the percentages of genes identified as regulated by ischemia in the periinfarction cerebral cortex in this study. The proportion of genes reported in previous ischemic stroke studies (blue), not reported in previous ischemic stroke studies (lavender), and the percentages of expressed sequence tags (ESTs) (yellow) are shown.
Functional categories of differential expressed genes
By searching LocusLink, OMIM, GeneCards, and PubMed and reference gene ontology, we divided the regulated genes into 14 different functional categories (Fig. 4, Tables 1–15). Although some of the categories are somewhat artificial because some genes fall into several categories, these categories help in assessing the large amount of data (Figs. 4A–C).
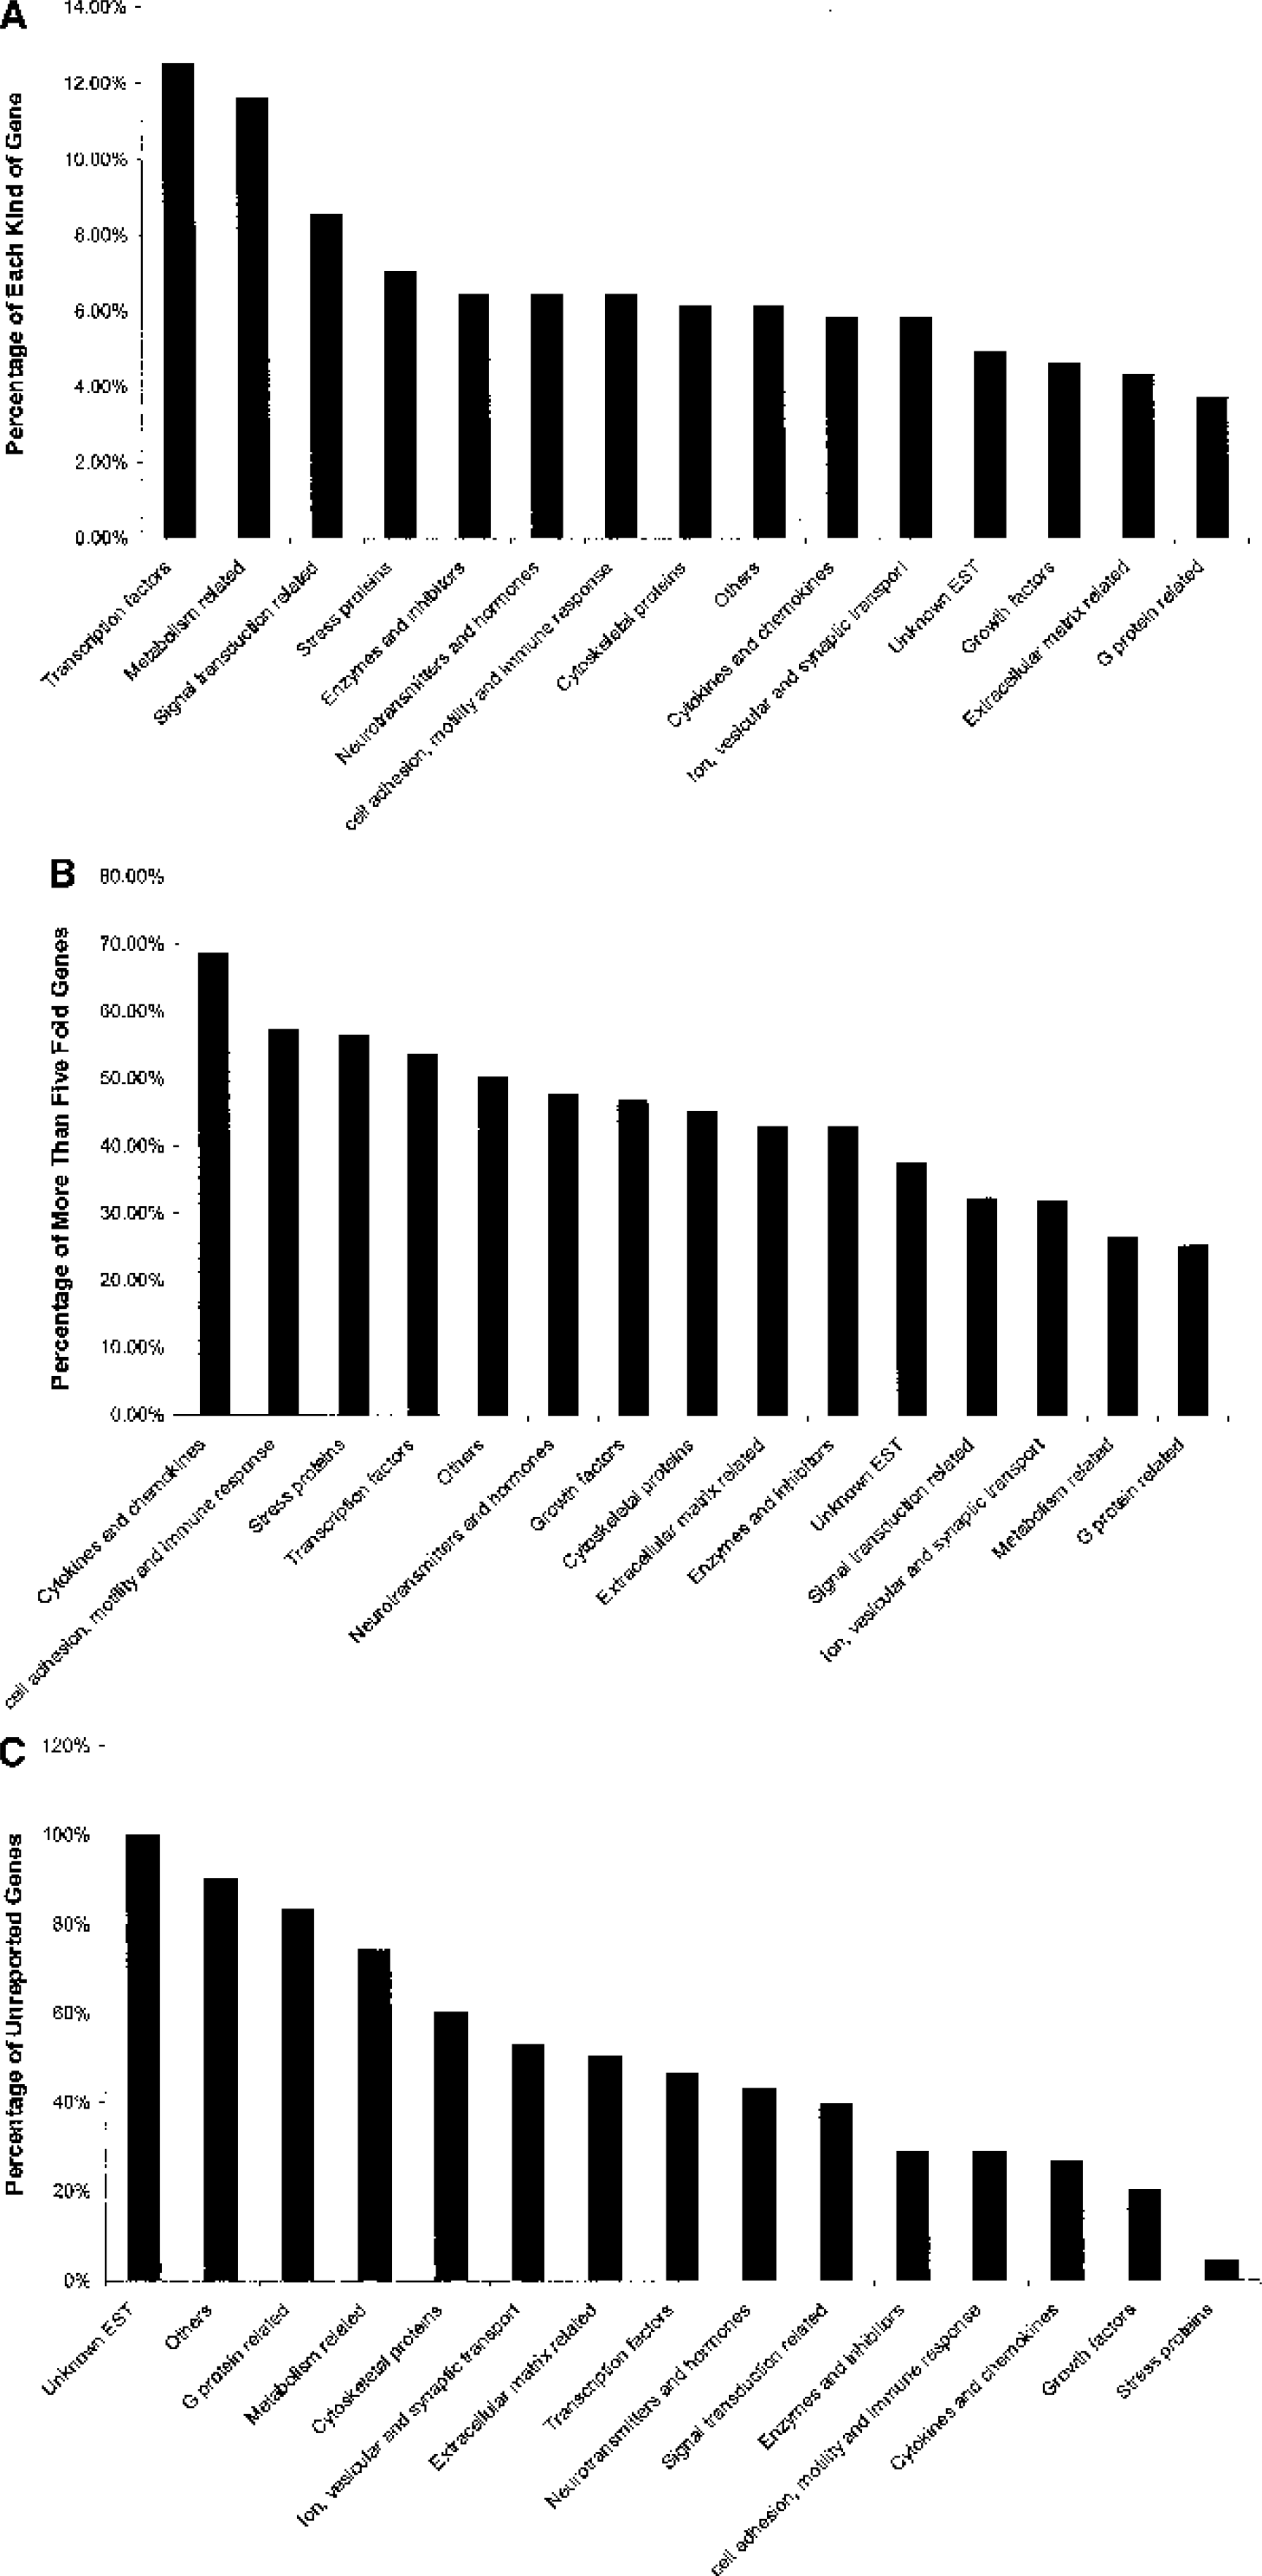
Transcription factors and metabolism- and signal transduction–related categories had the most numbers of regulated transcripts (Fig. 4A). The genes showing the highest fold changes (more than fivefold) included the cytokines and chemokines, cell adhesion, motility and immune response–related genes, stress proteins, and transcriptional factors (Fig. 4B). Stress proteins, growth factors, cytokines and chemokines, cell adhesion, motility and immune response–related genes, and enzymes and enzyme inhibitors had been the most reported, whereas many of the G-protein–related genes and metabolism-related genes shown to be induced by stroke in this study had not been previously reported (Fig. 4C).
Real-time RT-PCR
Real-time RT-PCR was performed on 20 selected genes at 2, 4, and 24 h after ischemia (Fig. 5). The early times were chosen becausethese would be times when acute stroke treatment might be initiated. The 24-h time was chosen because this would be the time when infarct size was nearly stable but tissue repair and plasticity responses would likely have been initiated. The genes were chosen based on their high fold induction or their functions or functional classes.
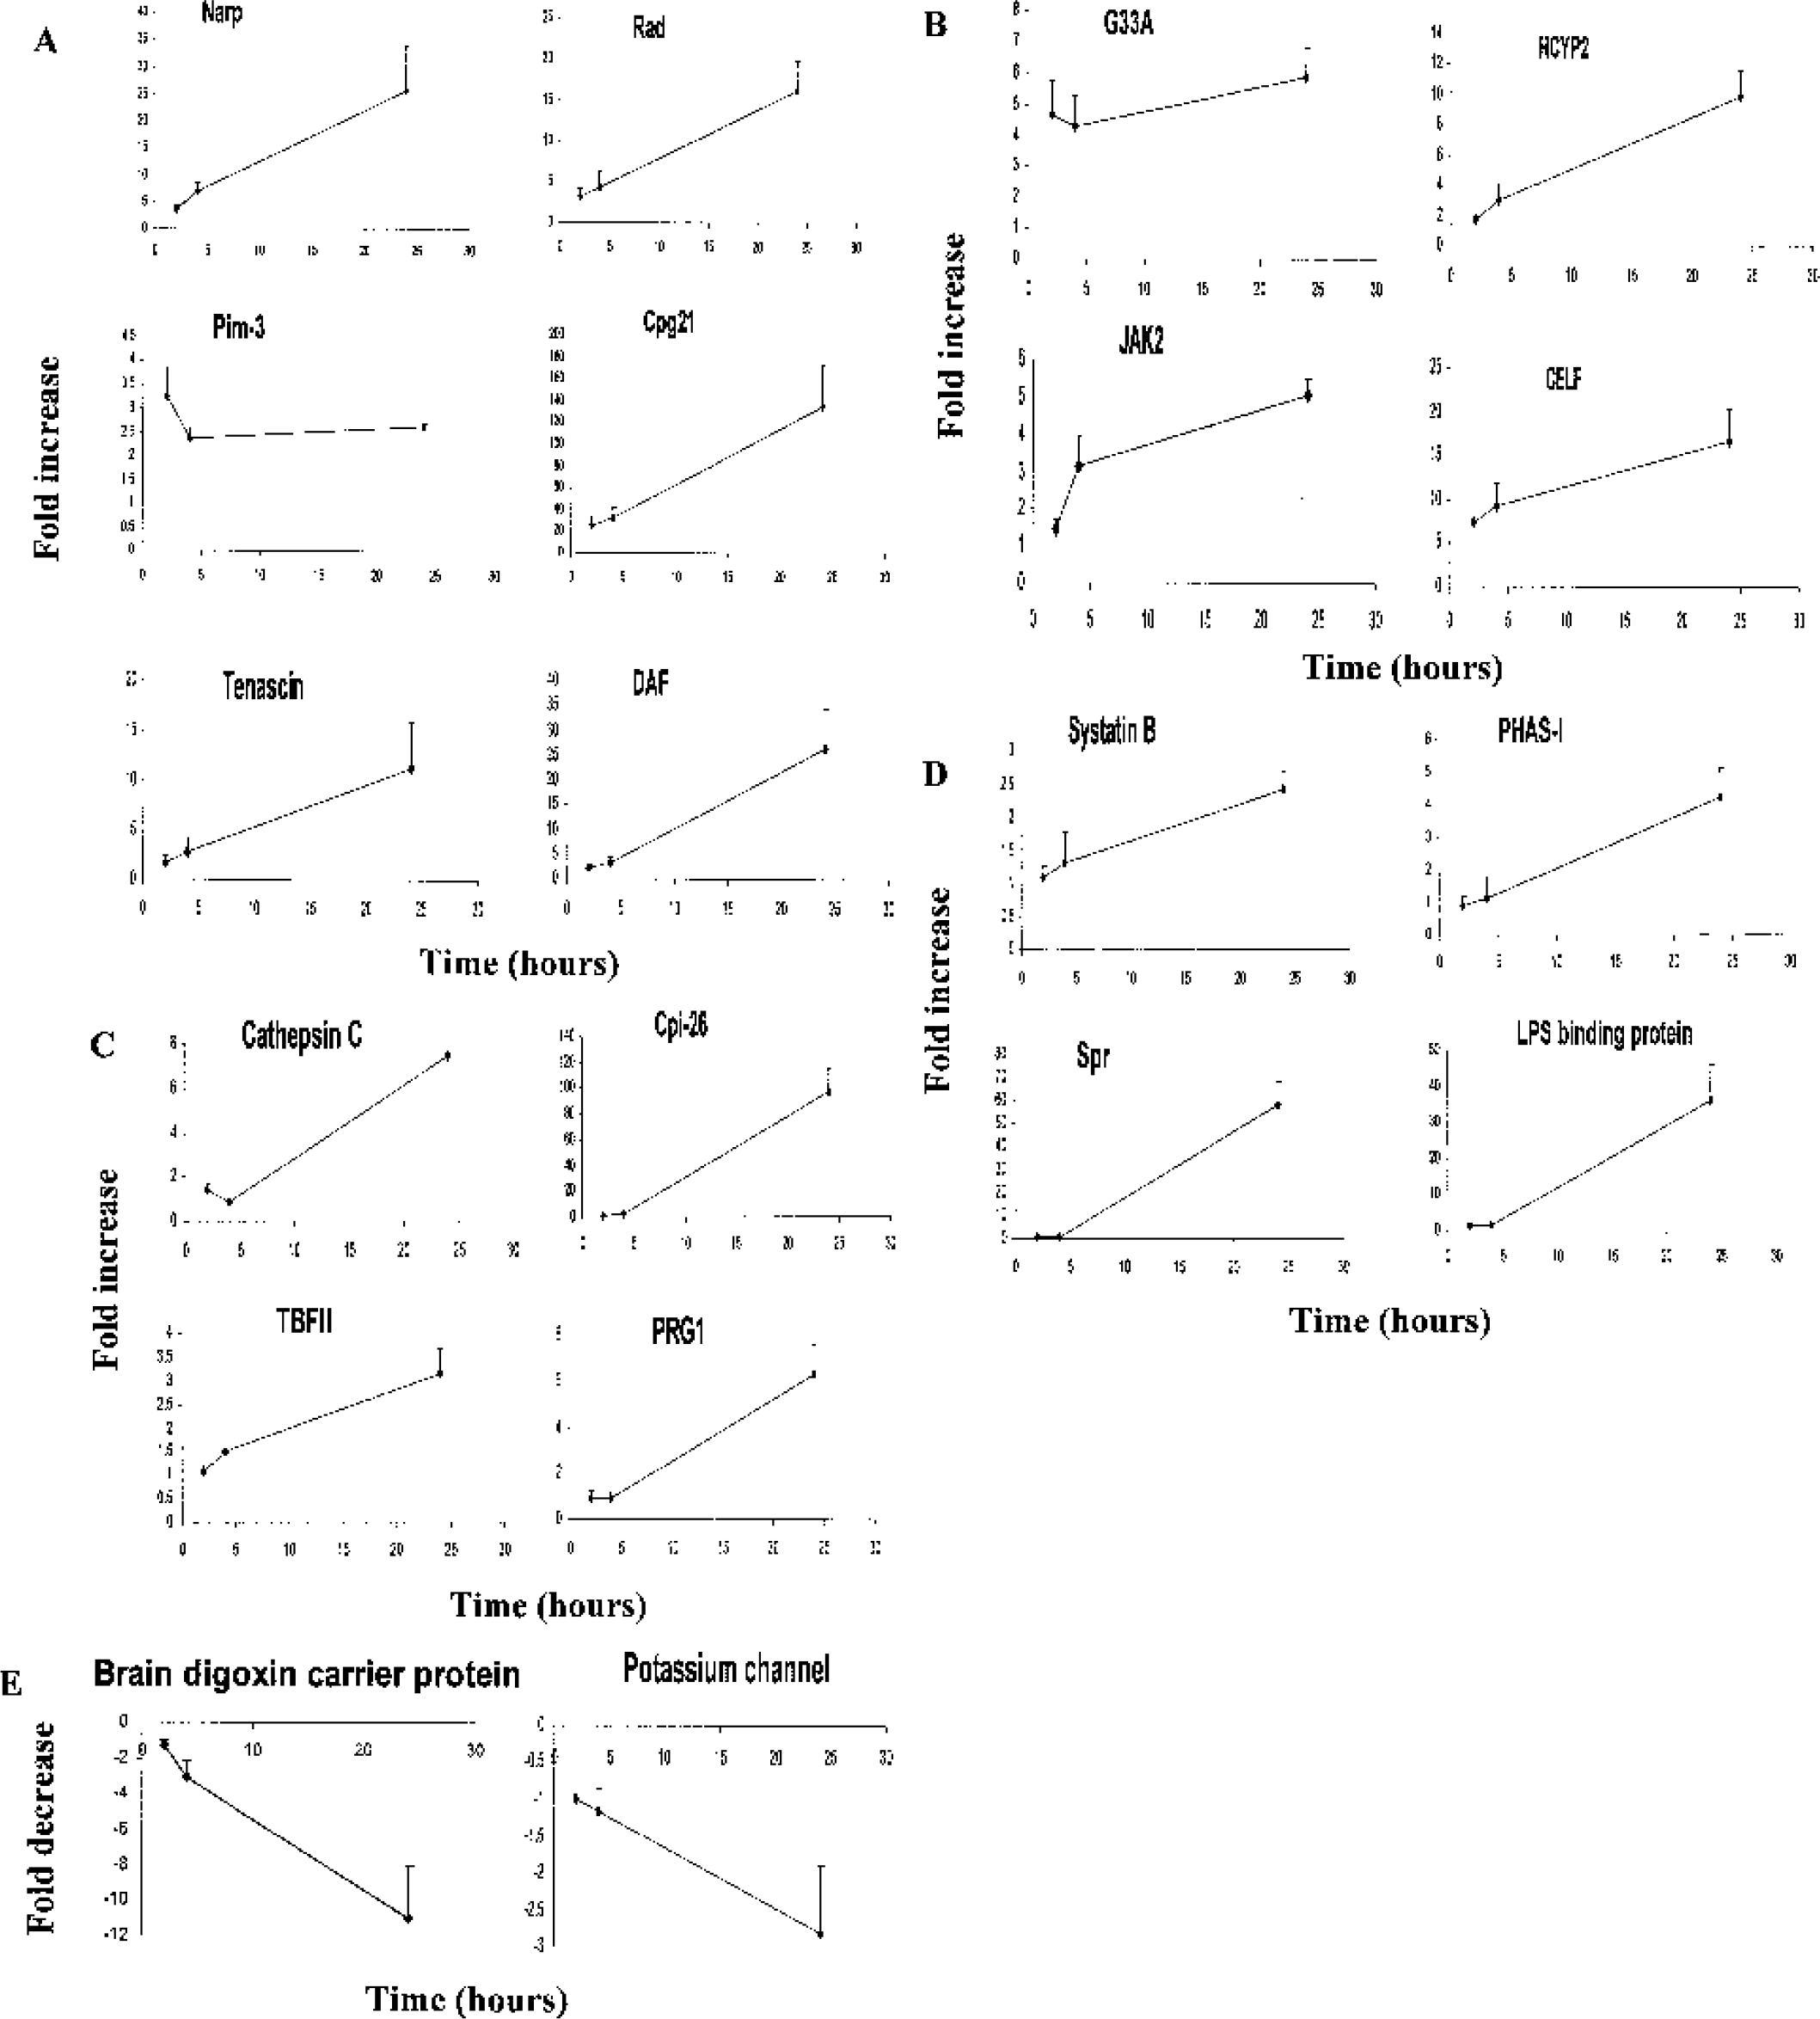
Real-time quantitative reverse transcription polymerase chain reaction showing the expression of selected genes (y-axis) at 2, 4, and 24 h after cerebral ischemia in the periinfarction cerebral cortex.
The PCR results showed good agreement with the corresponding microarray data in terms of increase and decrease of expression. Early upregulated genes included glutamate receptor–related gene (Narp), G-protein–related genes (Rad and G33A), kinases and phosphatases (HYCP2, Pim-3, Cpg21, JAK2), and the transcriptional factor CELF (Figs. 5A and 5B). Two other genes showed modest regulation at early times and greater increases at 24h including the extracellular matrix gene Tenascin and the complement inhibitor, DAF (Fig. 5A). Early upregulated genes might be involved in acute neuronal injury caused by stroke.
Late upregulated transcripts included enzymes and inhibitors (Cathepsin C, Cip-26, Systatin B), metabolism-relatedgenes (PHAS-I, TBFII), cytoskeletal proteins (Spr), and the lipopolysaccharide binding protein (Figs. 5C and 5D). These genes may be related to tissue immune and repair responses or possibly to some aspect of plasticity after the stroke. Several transcripts were also downregulated on the microarrays (Tables 1–15). The expression of two of these transcripts, brain digoxin carrier protein and a potassium channel, was confirmed by RT-PCR (Fig. 5E).
DISCUSSION
Various members of virtually every class of genes throughout the entire genome appear to be regulated in response to cerebral ischemia. The challenge will be to develop strategies for identifying the best targets to treat acute stroke or to promote recovery and repair. Our previous studies identified groups of molecules that were regulated in common by several types of injuries that might provide such targets (Tang et al., 2002). The present study focuses on genes with high expression levels or on groups of genes that appear to signify activation of specific pathways. The multiplicity of genes induced after focal ischemia would suggest that pharmacologic approaches that targeted multiple pathways simultaneously might be more successful than single gene or even single gene pathway approaches. High-throughput drug screening might be designed to detect single compounds that modulated several different but critical injury or recovery pathways.
RNAs for calpain, ICE-like cysteine protease, cathepsin L, cathepsin K, cathepsin C, cystatin B, and contrapsin-like protease inhibitor–related protein (Cpi-26) were all induced after stroke. The ICE-like cysteine protease is homologous to caspase-3 (Juan et al., 1996). Caspase-3, a central executioner in mitochondrial apoptotic pathways (Hengartner, 2000), is induced along with caspase-9 in the penumbra of some (Benchoua et al., 2001; Namura et al., 1998) but not all focal ischemia studies of adult brain (Gill et al., 2002; Loetscher et al., 2001). The present results support the induction of several caspase-like RNAs by focal ischemia (Dirnagl et al., 1999). However, it is likely that regulation of most caspases occurs by cleavage-induced activation of their proteolytic domains rather than being transcriptionally regulated (Phan et al., 2002; Dirnagl et al., 1999).
Calpain is a calcium-activated nonlysosomal, intracellular cysteine protease that is induced and activated during cerebral ischemia (Neumar et al., 2001; Wang, 2000). Calpains can compromise lysosomal membrane integrity and lead to cathepsin B and L activation. During cerebral ischemia and neuronal apoptosis, cathepsin B and L were activated (Islekel et al., 1999; Yoshida et al., 2002). Cathepsin B activates caspase-3 via caspase-11 during liver cell apoptosis, and cathepsin L activates a caspase-3–like protease in liver cells. Calpain can also directly activate caspase-12 and cause endoplasmic reticulum stress. Calpain and caspase-3 cleave several common cytoskeletal, cytosolic, and nuclear protein substrates (Huang and Wang, 2001; Yamashima, 2000; Wang, 2000). It is not known whether caspase-11 or 12 are activated after cerebral ischemia, but it is likely that calpain and some caspase-related proteases are effectors of injury and tissue repair.
Cystatin B is an inhibitor of cathepsins B, H, and L (Cimerman et al., 2001). Cystatin B–deficient mice have increased expression of apoptosis/glial activation genes (Lieuallen et al., 2001), suggesting that Cystatin B may protect. Cathepsin C, a lysosomal cysteine protease, processes granzyme A and B. Granzymes are expressed in the granules of activated cytotoxic lymphocytes, the granules entering target cells via perforin after cytotoxic lymphocytes synapse with the target cells. Granzyme B can act upstream and downstream of caspases. Granzyme A causes apoptosis via a caspase-independent pathway (Podack, 1999). Since lymphocytes infiltrate ischemic brain (Jander et al., 1995), these cells may mediate apoptosis of target ischemic brain cells via these genes. It is not known whether cystatins, cathepsins, and granzymes play a role in neurons or glia after ischemia, although keratinocytes can express both perforin and granzymes (Berthou et al., 1997).
Contrapsin-like protease inhibitor related protein (Cpi-26), a member of the ‘serpins’ subfamily, is homologous to antichymotrypsin (Ohkubo et al., 1991). Antichymotrypsin can inhibit caspase activity and is antiapoptotic (Ikari et al., 2001). If Cpi-26 functions like antichymotrypsin, it may protect against focal cerebral ischemia.
Glycerol 3-phosphate dehydrogenase expression increased more than 60-fold at 1 d after focal ischemia. Glycerol 3-phosphate dehydrogenase is localized to mitochondria and is involved in mitochondrial hydrogen shuttles necessary for the reoxidation of glycolysis-derived NADH. Activated GPDH increases intracellular levels of NADH and increases cellular resistance against H2O2 injury (Hwang et al., 1999). It is possible that GPDH and PARP interact to modulate NADH/NADPH levels and cell survival and death.
Translation-related transcripts, including PHAS-I and polypyrimidine track-binding protein (TBFII), were also induced after focal ischemia. PHAS-I binds eIF4E and negatively regulates translation initiation. It dissociates from eIF4E when phosphorylated. Insulin treatment of adipose cells increased the phosphorylation of 4EBP1 and reduced the interaction of 4EBP1 with eIF4E (Pause et al., 1994). PHAS-I undergoes caspase-dependent cleavage in cells undergoing apoptosis. The N-terminal truncated polypeptide binds to eIF4E and fails to become sufficiently phosphorylated on insulin stimulation to bring about its release from eIF4E (Tee and Proud, 2002). Binding initiation factor eIF4E can rapidly induce apoptosis (Herbert et al., 2000). During global cerebral ischemia, eIF4E and 4E-BP1 were significantly dephosphorylated (Martin de la Vega et al., 2001). PHAS-I levels and phosphorylation state could modulate ischemic brain damage. Overexpression of polypyrimidine track-binding protein stimulates Apaf-1 internal ribosome entry site function (Mitchell et al., 2001). Polypyrimidine track-binding protein also modulates alternative splicing of caspase-2 (Cote et al., 2001), although the role for this gene in ischemic brain injury is unclear.
Narp expression, increased by 2- to 5-fold at 2 to 4 h of ischemia, increased more than 25-fold at 24 h after ischemia. Narp is a secreted immediate-early gene induced by a wide variety of stimuli. Since it is an extracellular aggregating factor for AMPA receptors (O'Brien et al., 1999), it might exacerbate early ischemic excitotoxicity. Agrin, another aggregating factor, was decreased after cerebral ischemia. Agrin is an extracellular heparan sulfate proteoglycan that signals AChR clustering, particularly during the formation of the neuromuscular junction. Agrin is also widely expressed in the central nervous system (Fong and Craig, 1999), although any effects of decreased agrin expression on central acetylcholine neurotransmission after ischemia are uncertain. The chronic changes of Narp and agrin and effects on glutamate and acetylcholine neurotransmission might also play important roles in synaptic plasticity and recovery after stroke.
Brain-derived neurotrophic factor RNA upregulation on the microarrays confirms many previous cerebral ischemia studies. Brain-derived neurotrophic factor may protect against cerebral ischemia in part by phosphorylation of ERK1/2 (Han and Holtzman, 2000; Encinas et al., 1999). Ischemia also induced the MAP-kinase phosphatase (cpg21) that inactivates ERK1 (Ishibashi et al., 1994). This might decrease the protective effects of brain-derived neurotrophic factor. However, ischemia-induced glutamate accumulation activates the P44/42 MAP-kinase pathway. Since inhibition of the MAP-kinase pathways protected neurons against glutamate excitotoxicity (Grant et al., 2001), induction of the cpg21 MAP-kinase phosphatase may also protect against brain ischemia. It is notable that cpg21 is induced more than 20-fold after 2 h of ischemia and more than 120-fold by 24 h of ischemia, suggesting an important but unstudied role for this gene.
Interleukin-6, Jak2, SOCS-3, and Pim-3 RNAs were also regulated by cerebral ischemia. Interleukin-6 induces gp130-homodimerization and activates Jak1, Jak2, Tyk2, STAT1, and STAT3. STAT1 and STAT3 translocate to the nucleus to activate transcription (Heinrich et al., 1998). Interleukin-6 protects the brain against focal and global ischemia (Loddick et al., 1998; Matsuda et al., 1996). SOCS-3 binds all four JAK kinases and inhibits their activity (Chen et al., 2000), possibly suggesting that SOCS-3 might counter the protective effects of IL-6. Co-expression of Pim kinases with Socs-1 results in phosphorylation and stabilization of Socs-1 protein (Chen et al., 2002). Lymphocytes from SOCS-1−/− mice undergo accelerated apoptosis associated with increased Bax, and murine embryonic fibroblasts lacking SOCS-1 are more sensitive to TNF-induced cell death (Chen et al., 2000). Some Pim kinases prolong cell survival and inhibit apoptosis activity (Lilly et al., 1999). Thus, although the role of SOCS-3 is uncertain, IL-6, Pim kinases, and SOCS-1 may protect against cerebral ischemia.
rNFIL-6 (C/EBP β) and CELF (C/EBP δ) were highly induced. C/EBP plays a role in regulating other genes, since Egr-1 (NGFI-A) and MKP-1 mRNA were significantly reduced in liver of C/EBP knockout mice (Greenbaum et al., 1998). Our data show that, after stroke, both Egr-1 and oxidative stress-inducible protein tyrosine phosphatase (MKP-1) RNAs increased. The target genes of Egr-1, including PAI-1, VEGF, ICAM-1, IL1-β, and immediate-early serum-responsive JE gene (MIP-1) were also induced. Recent lung studies show that Egr-1 regulates many downstream genes and could have a central role in the pathogenesis of ischemic lung tissue damage (Yan et al., 2000). The present data support the possibility that C/EBP regulation of Egr-1 (NGFI-A) and its downstream genes including PAI-1, VEGF, ICAM-1, IL-1β, and MIP-1 could be an important signaling pathway in cerebral ischemia as well.
Transcripts for CD14, IgE binding protein (lectin), lectin-like oxidized LDL receptor (LOX-1), complement protein C1q, PS-PLA1 (serine-phospholipid-selective phospholipase A), and lipopolysaccharide binding protein were all increased after cerebral ischemia. CD14, lectin, and LOX-1 are phagocyte transmembrane molecules. CD14 and LOX-1 can bind phosphatidylserine (PtdSer) and other surface molecules to initiate apoptosis. C1q is an adhesive “bridging” molecule between apoptotic cells and phagocytes. These molecules can tether apoptotic cells and shuttle them to the phagocytic machinery (Savill and Fadok, 2000; Oka et al., 1998). PS-PLA1 hydrolyzes a fatty acyl residue at the sn-1 position of lysophosphatidylserine and phosphatidylserine (Sato et al., 1997). Lipopolysaccharide binding protein can bind CD14 (Gutsmann et al., 2001). The increase of the latter molecules can decrease phagocytic recognition of apoptotic cells, which can enhance cell survival when cells are subjected to weak proapoptotic signals (Hoeppner et al., 2001). During cerebral ischemia, microglia–macrophages are markedly activated (Stevens et al., 2002). Although inhibition of microglial activation is reported to protect against global brain ischemia (Yrjanheikki et al., 1998), macrophage and microglial engulfment of apoptotic cells can suppress the secretion of proinflammatory mediators such as tumor necrosis factor-α and suppress the inflammatory response to ischemia (Savill and Fadok, 2000). There seems to be a balance of the detrimental and neuroprotective effects of activated microglia and macrophages that may vary over time and with the severity of injury (Stoll et al., 1998). Exactly how these pathways influence acute injury or recovery after stroke is still unclear.
The focus of this study was to examine the periinfarction cortex at 24 h after a permanent MCA occlusion, at a time well beyond that when any treatment for acute stroke would likely be useful. The changes in many of the 328 transcripts may be related to the onset of tissue repair and the beginning of recovery. As many as two to three times as many molecules may be identified once the entire rat and human genomes are studied as a function of time and area of brain injured after stroke. Future approaches at defining those pathways crucial for recovery might include looking for genes shared with tolerance models, models where recovery is improved or is poor, and other approaches that will help refine the search for clinically important pathways. We have previously reported genes that are induced in common by several types of injury in brain and in blood (Tang et al., 2001, 2002). These common genes may relate to common mechanisms of injury and could represent common targets for a common therapy.
Footnotes
Acknowledgments:
The authors thank Melinda Reilly for excellent technical assistance, and regret the inability to reference all of the publications related to the regulated genes in this study.