
Abstract
enome-wide gene expression analysis of the hippocampal CA1 region was conducted in a rat global ischemia model for delayed neuronal death and induced ischemic tolerance using an oligonucleotide-based DNA microarray containing 8,799 probes. The results showed that expression levels of 246 transcripts were increased and 213 were decreased following ischemia, corresponding to 5.1% of the represented probe sets. These changes were divided into seven expression clusters using hierarchical cluster analysis, each with distinct conditions and time-specific patterns. Ischemic tolerance was associated with transient up-regulation of transcription factors (c-Fos, JunB Egr-1, −2, −4, NGFI-B), Hsp70 and MAP kinase cascade-related genes (MKP-1), which are implicated cell survival. Delayed neuronal death exhibited complex long-lasting changes of expression, such as up-regulation of proapoptotic genes (GADD153, Smad2, Dral, Caspase-2 and −3) and down-regulation of genes implicated in survival signaling (MKK2, and PI4 kinase, DAG/PKC signaling pathways), suggesting an imbalance between death and survival signals. Our study provides a differential gene expression profile between delayed neuronal death and induced ischemic tolerance in a genome-wide analysis, and contributes to further understanding of the complex molecular pathophysiology in cerebral ischemia.
Keywords
Transient cerebral ischemia causes selective and delayed neuronal death in the vulnerable hippocampal CA1 region (Kirino 1982; Pulsinelli et al., 1982). Since this type of neuronal death occurs over several days, suggesting a potentially wide therapeutic window, its pathophysiological mechanisms have been intensively investigated as a model of ischemic neuronal injury. Various studies have provided evidence that cerebral ischemia induces transcriptional activation of a variety of genes (MacManus and Linnik 1997), particularly those related to stress response, cell death or survival (Chen et al., 1996; Chen et al., 1997; Chen et al., 1998; Nowak 1990), suggesting a close relationship with neuronal ischemic vulnerability. Based on these observations, various attempts have been made to identify differentially expressed mRNA by using subtractive hybridization (Wang et al., 2001) and PCR based techniques (Schwarz et al., 2002), which were expected to elucidate the complex molecular events leading to ischemic neuronal death. Despite these efforts, the underlying pathophysiological mechanisms remain unknown.
Recent advances in DNA microarray technology have provided tools to analyze the expression of thousands of genes in a single hybridization experiment (Lockhart and Winzeler 2000). In cerebral ischemia, this approach has been used to uncover key molecular events using a focal ischemia model (Keyvani et al., 2002; Kim et al., 2002; Raghavendra Rao et al., 2002; Soriano et al., 2000), and global ischemia or hypoxic models (Bernaudin et al., 2002; Jin et al., 2001). These studies, however, have limitations in evaluating global and sequential changes in gene expression related to cell death or survival, due to restricted time points, limited and biased transcripts represented on the array, and the nature of the sample analyzed.
Our study was designed to demonstrate global and sequential changes of gene expression during the process of ischemic neuronal death in the hippocampus. For this, we specifically analyzed a microdissected hippocampal CA1 region one to 48 hours after ischemia using an oligonucleotide-based DNA microarray containing approximately 7,000 full-length known or annotated genes and 1,000 EST clusters. We compared these changes with those during the induction of ischemic tolerance. It is widely known that hippocampal neurons can acquire resistance to ischemia when subjected to sublethal ischemia several days prior to lethal ischemia (for review, refer to Kirino, 2002). Comparison of global expression profiles during the process of ischemic cell death and ischemic tolerance, should lead to a better understanding of the molecular pathophysiology of ischemia.
MATERIALS AND METHODS
Animals
The experiments were performed on male Wistar SPF rats (280–320 g, Charles River, Yokohama, Japan). All animal-related procedures were conducted in accordance with guidelines for the care and use of laboratory animals set out by the National Institutes of Health.
Experimental Groups
Four groups of animals were used. In the first experiment (single ischemia experiment), histological assessment of global cerebral ischemia in the hippocampal CA1 sector was performed in rats subjected to sham operation (n=6), two-minute (n=8) or six-minute (n=10) ischemia. In the second experiment (double ischemia experiment), induction of ischemic tolerance by two-minute ischemia was evaluated. In this group, rats were preconditioned by either sham operation with vertebral artery coagulation (n=10) or two-minute ischemia (n=10), and then subjected to six-minute ischemia three days later. The hippocampus was then examined as in the previous experiment. In the third experiment, samples of hippocampal CA1 sector of the animals subjected to sham operation (n=15), two-minute (n=30) or six-minute ischemia (n=30) were analyzed for global mRNA expression (GeneChip experiment). In the final group, rats were subjected to sham, two-minute, or six-minute ischemia, and then sacrificed for in situ hybridization study.
Global Cerebral Ischemia
Global cerebral ischemia was induced by a modification of the four-vessel occlusion method (Pulsinelli et al., 1982). Rats were fixed in a stereotaxic frame under 1% halothane anesthesia. Both vertebral arteries were exposed under a microscope by drilling through the foramina, then coagulated and completely cut using fine-tipped bipolar forceps. Twelve hours later, under fasting conditions, the animals were intubated and put on a rodent respirator (Model 7025, Ugo Basile, Comerio, Italy) under 1.0% halothane anesthesia in a 30% O2/ 70% N2O mixture. The left femoral artery and vein were cannulated for blood pressure (BP) monitoring (Carrier Amplifier AP-601G, Nihon Kohden, Tokyo, Japan) and intravenous drug administration. The right femoral artery was also cannulated for exsanguination. Atropine sulfate (0.25mg/kg, ip) and amikacin (10mg/kg, ip) were administered. Rectal temperature was maintained at 37.5°C using a heating blanket (Animal Blanket Controller, Model ATB-1100, Nihon Kohden) for 30 minutes postischemia. Temporal muscle temperature was monitored with a thermometer (Model BAT-12, Physitemp Instruments, Clifton, NJ, USA) via a needle microprobe (MT-26/2, Physitemp Instruments) and kept at 37°C with a heating lamp. Cerebral ischemia was induced for either 2 or 6 minutes by occluding the bilateral common carotid arteries with clips. During ischemia, BP was lowered to 60 mmHg by exsanguination into a heparinized syringe from the right femoral artery, and electrical silence was confirmed by electroencepalogram (EEG) with needle electrodes connected to an amplifier (Bioelectric Amplifier AB-621G, Nihon Kohden, Tokyo, Japan). Following reperfusion, all physiological parameters were controlled for 30 minutes, and the animals were returned to their cages after extubation. Arterial blood samples were analyzed before, five, and 30 minutes after ischemia using a blood gas analyzer (Model 248, Chiron Diagnostics Ltd., Essex, UK) and a glucose analyzer (Glu-1, TOA Electronics Ltd., Tokyo, Japan). During the procedure, PaO2 was maintained at 120–140 mmHg by adjusting inhaled O2 concentration, and PaCO2 at 35–40 mmHg by changing the respiratory rate. Base excess was corrected by intravenous injection of sodium bicarbonate and kept at −2.0 to 2.0 mEq/L. Sham operated animals were similarly treated except for vertebral artery coagulation and carotid artery clipping. In the double ischemia group (tolerance experiment), vertebral artery coagulation was performed in the sham operation.
Histological Assessment of Ischemic Neuronal Injury
Seven days after ischemia or sham operation, the animals were put under 2% halothane anesthesia and then fixed by transcardiac perfusion with 4% paraformaldehyde in 0.1mol/L phosphate buffer (pH=7.4). The brains were left in situ for three hours, removed, and post-fixed overnight at 4°C, then embedded in paraffin. Coronal sections (4-μm thickness) obtained from the dorsal hippocampus (approximately 3.8 mm from bregma) (Paxinos and Watson 1986) were stained with hematoxylin and eosin, and the number of intact neurons was counted in a blind fashion along the pyramidal layer of the CA1 sector for 1 mm. The neuronal densities obtained (cells/mm) were averaged for each hemisphere and compared. In the first single ischemia group, one-way analysis of variance (ANOVA) with significance set at p<0.05 was used. In the second group (double ischemia), two-tailed unpaired Student's t-test with significance set at p<0.05 was used. All the data was shown as mean ±SD.
Microarray Experiment
Rats were subjected to sham operation, two-minute or six-minute ischemia, then sacrificed by decapitation under deep pentobarbital anesthesia at 1, 3, 12, 24, and 48 hours. The brains were quickly removed, frozen in 2-methylbutane at −20°C, and stored at −80°C. The brains were cut into 2-mm coronal sections and the dorsal hippocampal CA1 sector was dissected, under a microscope, at −20°C. Total RNA was extracted from pooled samples obtained from three rats using Isogen reagent (NipponGene Inc, Toyama, Japan), following the manufacturer's protocols. The quality of total RNA was verified by gel electrophoresis and OD260/280nm ratios.
Five micrograms of total RNA from each sample was used to synthesize biotin-labeled cRNA, which was then hybridized to a high-density oligonucleotide array (GeneChip Rat RG-U34A array; Affymetrix Inc., Santa Clara, CA, USA), following a previously published protocol with minor modifications (Ishii et al., 2000). This array contains 8,799 probe sets derived from full-length or annotated genes (7,000 genes) as well as 1,000 EST clusters, which were selected from the Unigene Build 34, Genbank 110, and the dbEST databases. After washing, arrays were stained with streptavidin-phycoerythrin (Molecular Probes, Inc., Eugene, OR, USA) and analyzed by a Hewlett-Packard Scanner to collect primary data. The GeneChip 3.3 software (Affymetrix) was used to calculate the average difference for each gene probe on the array, which was shown as an intensity value of gene expression, defined by Affymetrix, using the proprietary algorithm. The average difference has been shown to quantitatively reflect the abundance of a particular mRNA molecule in a population (Ishii et al., 2000; Lockhart et al., 1996). To allow comparisons between multiple arrays, the average differences were normalized for each array by assigning the average of overall average difference values to be 100. A value of 20 was assigned to all average differences below 20.
Duplicate measurements were conducted for the two-minute and six-minute ischemia groups at each time point, and for the normal control group. For the sham-operated controls, a single RNA sample was evaluated at each time point. The resultant data was transferred to a database (Filemaker Pro 5, FileMaker, Inc., Santa Clara, CA, USA) and linked to Internet genome databases. To select genes with altered expression patterns, each data array obtained after ischemia was compared with those from the normal, time-matched, sham controls. The criterion of two-fold changes in the average difference for each probe set was used. To further increase the reproducibility, both duplicate samples must have met the two-fold change criteria for the data to be considered. The resultant data was transferred to GeneSpring 4.2 (SiliconGenetics, Redwood City, CA, USA) for hierarchical cluster analysis (Eisen et al., 1998). The most recent information for each transcript was obtained from databases such as Genbank, dbEST, Unigene, and the functional annotation was supplemented by protein database Swiss-Prot.
In Situ Hybridization
Five genes (Egr-2, TIEG, Homer-1C, BTG2, Caspase-2) that showed increased expression levels were chosen for this experiment. Total RNA obtained from normal adult rat brain, as described above, was subjected to RT–PCR using Ready-To-Go T-Primed First-Strand Kit (Amersham Biosciences, Buckinghamshire, UK) and Amplitaq Gold (Applied Biosystems, Foster City, CA, USA) according to the manufacturer's protocols. Sense and antisense PCR primers (22mers) were designed to amplify a fragment of Egr-2 (Accession No: U78102, 1821–2351, 531bp), TIEG (Accession No: U88630, 358–807, 450bp), Homer-1C (Accession No: AF030088, 1852–2332, 480bp), BTG2 (Accession No: M60921, 1861–2294, 434bp), and Caspase-2 (Accession No: U77933, 1641–2163, 470bp). PCR was conducted for 43 cycles (94°C for 30 seconds, 60°C for one minute, 72°C for one minute), and the obtained PCR fragments were subcloned into pPCR-Script Amp SK(+) (Stratagene, La Jolla, CA, USA). Orientation and sequence were verified by direct sequencing. Antisense and sense RNA probes were prepared from each cDNA using RNA labeling kit (Riboprobe Combination System-T3/T7, Promega, Madison, WI, USA) with T7 and T3 RNA polymerases. The probes were labeled by [α-35S]-UTP (Amersham Biosciences) to a specific activity of approximately 1–2 × 10⁶ cpm/ng.
The animals were sacrificed 1, 3, 12, 24, and 48 hours after ischemia under deep anesthesia with 4% halothane, the brains were immediately removed, frozen in powdered dry ice, and cut into 14 μm-thick coronal sections approximately 3.8 mm from bregma (Paxinos and Watson 1986) using a cryostat at −16°C. In situ hybridization was performed as previously described (Kawahara et al., 1999). Briefly, sections postfixed with 4% paraformaldehyde were hybridized with each cRNA probe at 55°C for 16 hours at a concentration of 1.0ϗ104 cpm/μl. The next day, high stringency washes at 55°C were followed by RNase A treatment and dehydration. The sections were exposed, with a radioactive standard strip, to BioMax MR film (Eastman Kodak, Rochester, NY, USA) for 3–7 days.
RESULTS
Delayed Neuronal Death and Induction of Tolerance
In the first experiment, ischemic neuronal injury in the hippocampal CA1 sector was examined (Fig. 1). The CA1 neurons were significantly reduced only in the six-minute ischemia group (9.7 ±2.9% of normal control, p<0.0001 by ANOVA, with Bonferroni's post-hoc test) compared with those in the sham (90.3 ±6.8%) and two-minute (91.3 ±12.6%) groups. This observation indicates that, in our rat global ischemia model, six-minute ischemia is sufficient to induce severe hippocampal neuronal death, whereas two-minute ischemia does not cause any detectable injury. In the double ischemia experiment (Fig. 1), rats were subjected to either sham operation or two-minute ischemia three days prior to six-minute ischemia, and then sacrificed seven days later. Evaluation of hippocampal neuronal injury demonstrated that preconditioning via two-minute ischemia significantly protected CA1 neurons against subsequent six-minute ischemia (27.2 ±17.5% in sham and 80.6 ±8.8% with two-minute preconditioning, p<0.0001 by unpaired t-test), which confirmed the belief that short sublethal ischemia, provided by two-minute ischemia in our model, induced ischemic tolerance at three days.
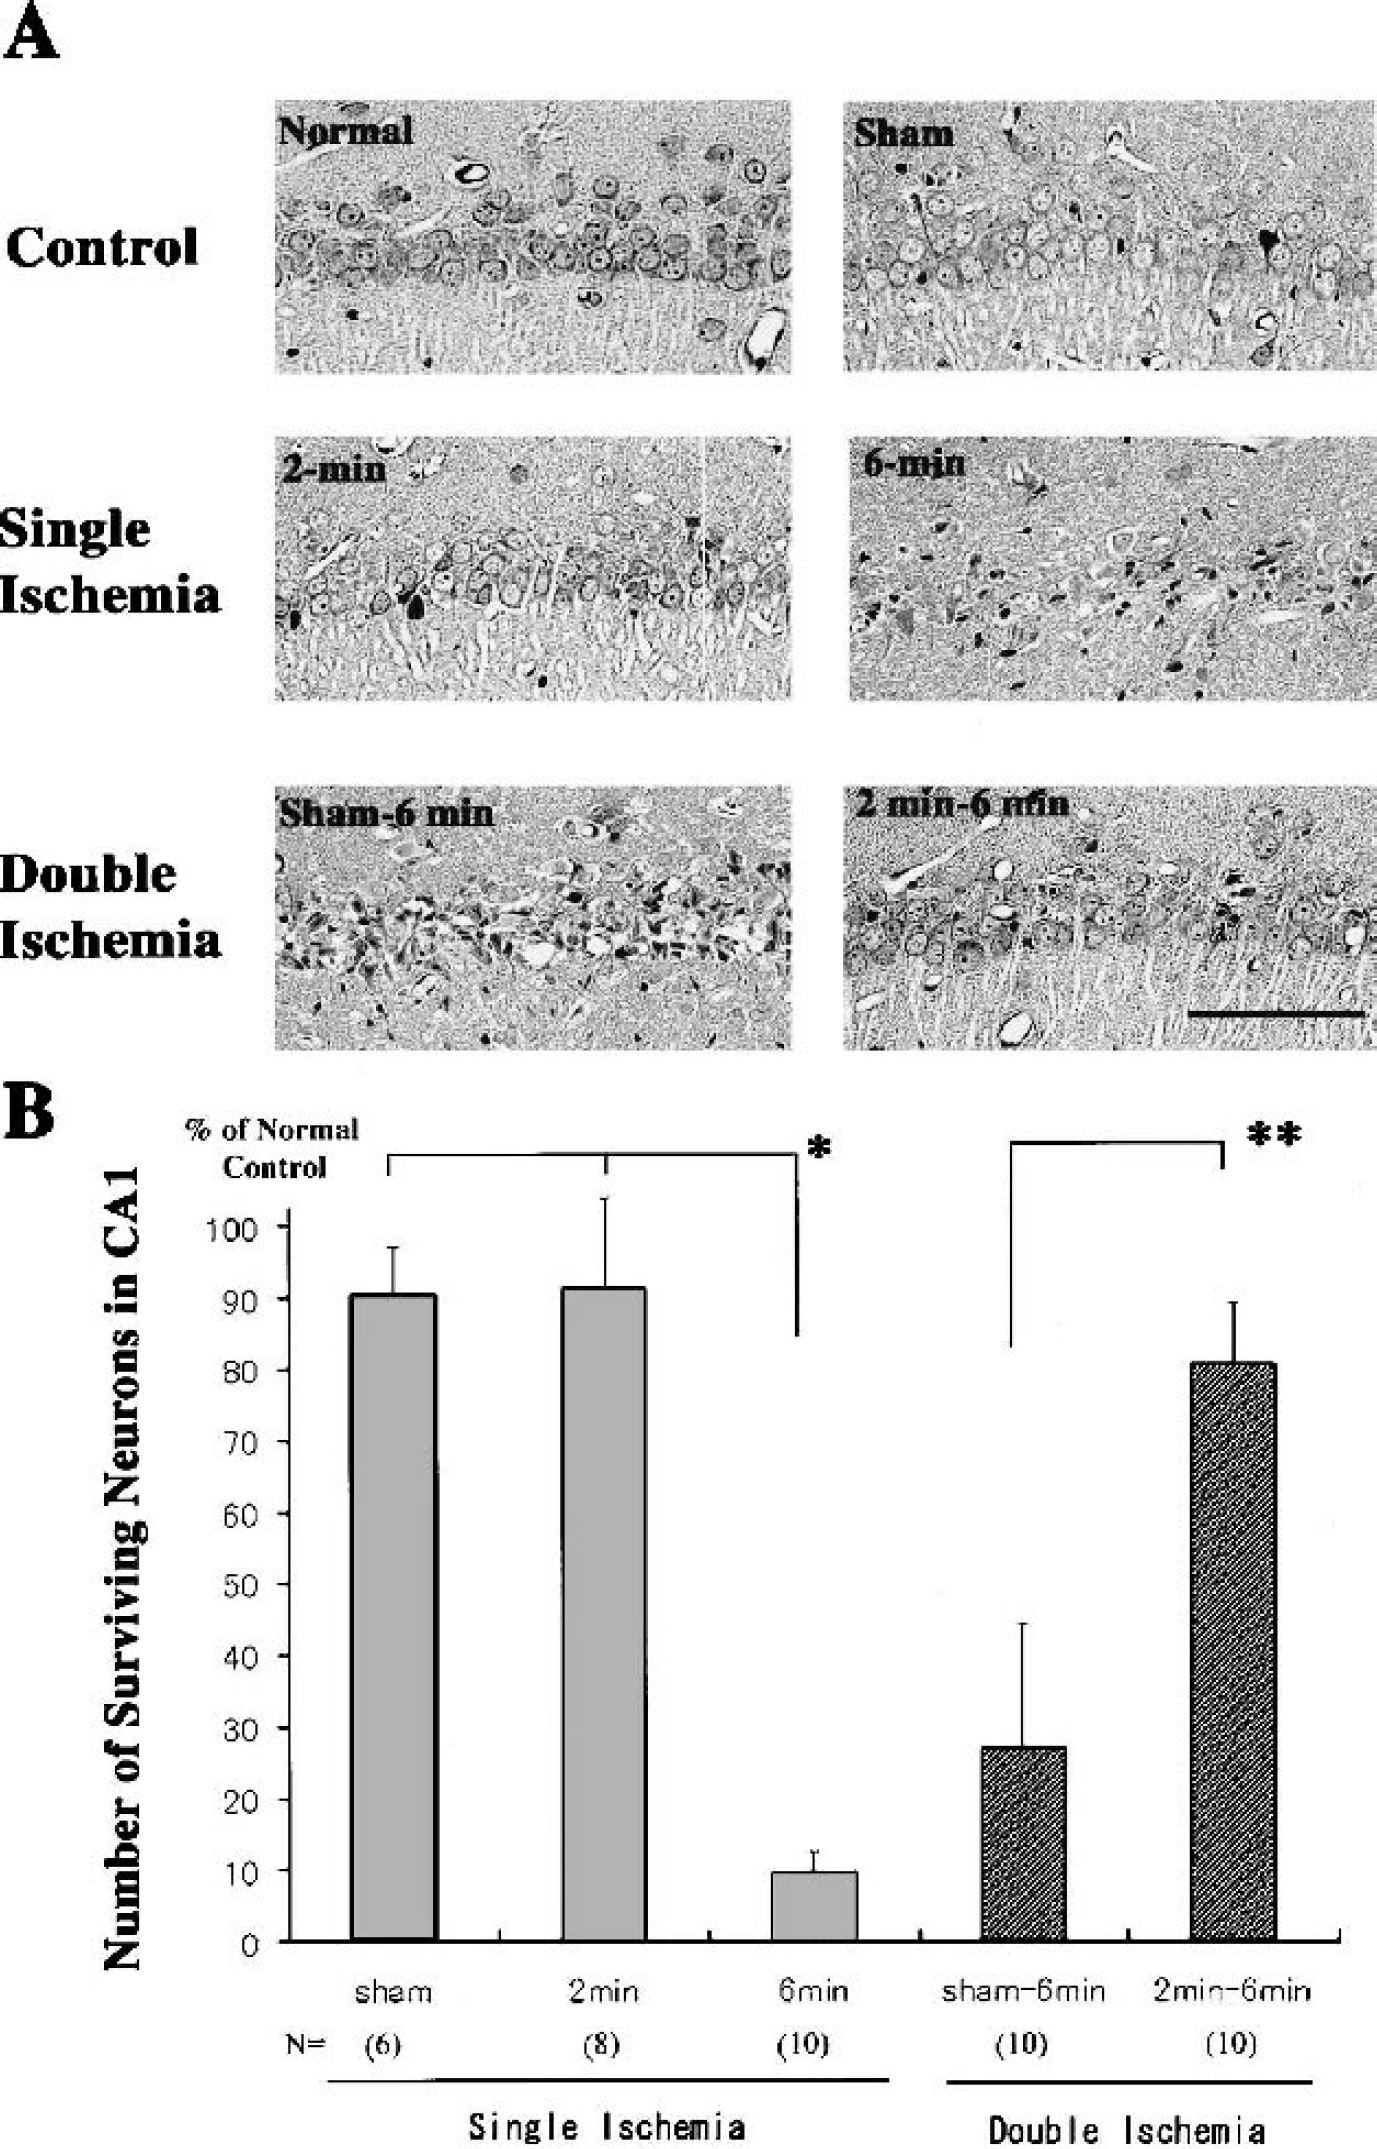
A. Histological outcome in the CA1 sector of the hippocampus after single (two- and six-minute) and double (sham and six-minute, two- and six-minute) ischemia. Single short ischemia (two-minute) did not cause significant cell injury, while longer six-minute ischemia led to uniform severe neuronal death. Prior pretreatment with two-minute ischemia remarkably protected pyramidal neurons against otherwise lethal six-minute ischemia. Hematoxylin and eosin staining. Scale bar: 100 μm. B: Bar graph showing the density of intact neurons in the CA1 sector in each group, presented as % of normal control (mean ±SD).
Global Changes in mRNA Expression following Ischemia
Of 8,799 probe sets represented on the chip, 3,518 transcripts (40%) were considered present in normal controls according to the manufacturer's default computer algorithm. Of these, 238 transcripts, which correspond to 2.7% of the total probe set, were increased after ischemia compared with normal and time-matched sham controls using our current criteria (Fig. 2). In this group, 36 transcripts were increased following two-minute ischemia, and 224 transcripts following six-minute ischemia, while 22 transcripts were increased in both conditions. Similar analysis for decreased expression showed that 205 transcripts were down regulated following ischemia (2.3% of the total probe set), which was similar to the number of increased expression. Eight transcripts showed both up and down-regulation during their time course, giving a total of 451 transcripts (5.1% of the total probe set) that exhibited significant changes following ischemia. These were subjected to further analysis.
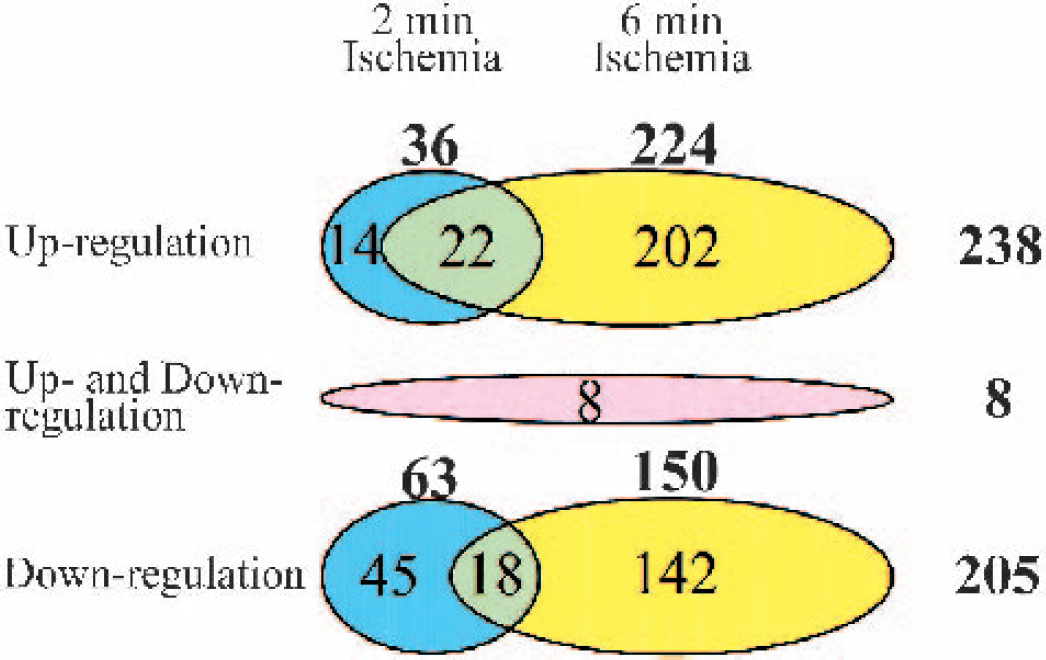
Diagram showing the number of gene transcripts, up or down-regulated, after either two- or six-minute ischemia. Changes after two-minute ischemia are depicted in blue, those after six-minute in yellow, and those with overlapping transcripts in green. The transcripts showing both up and down-regulation during their time course are included in a separate circle in red.
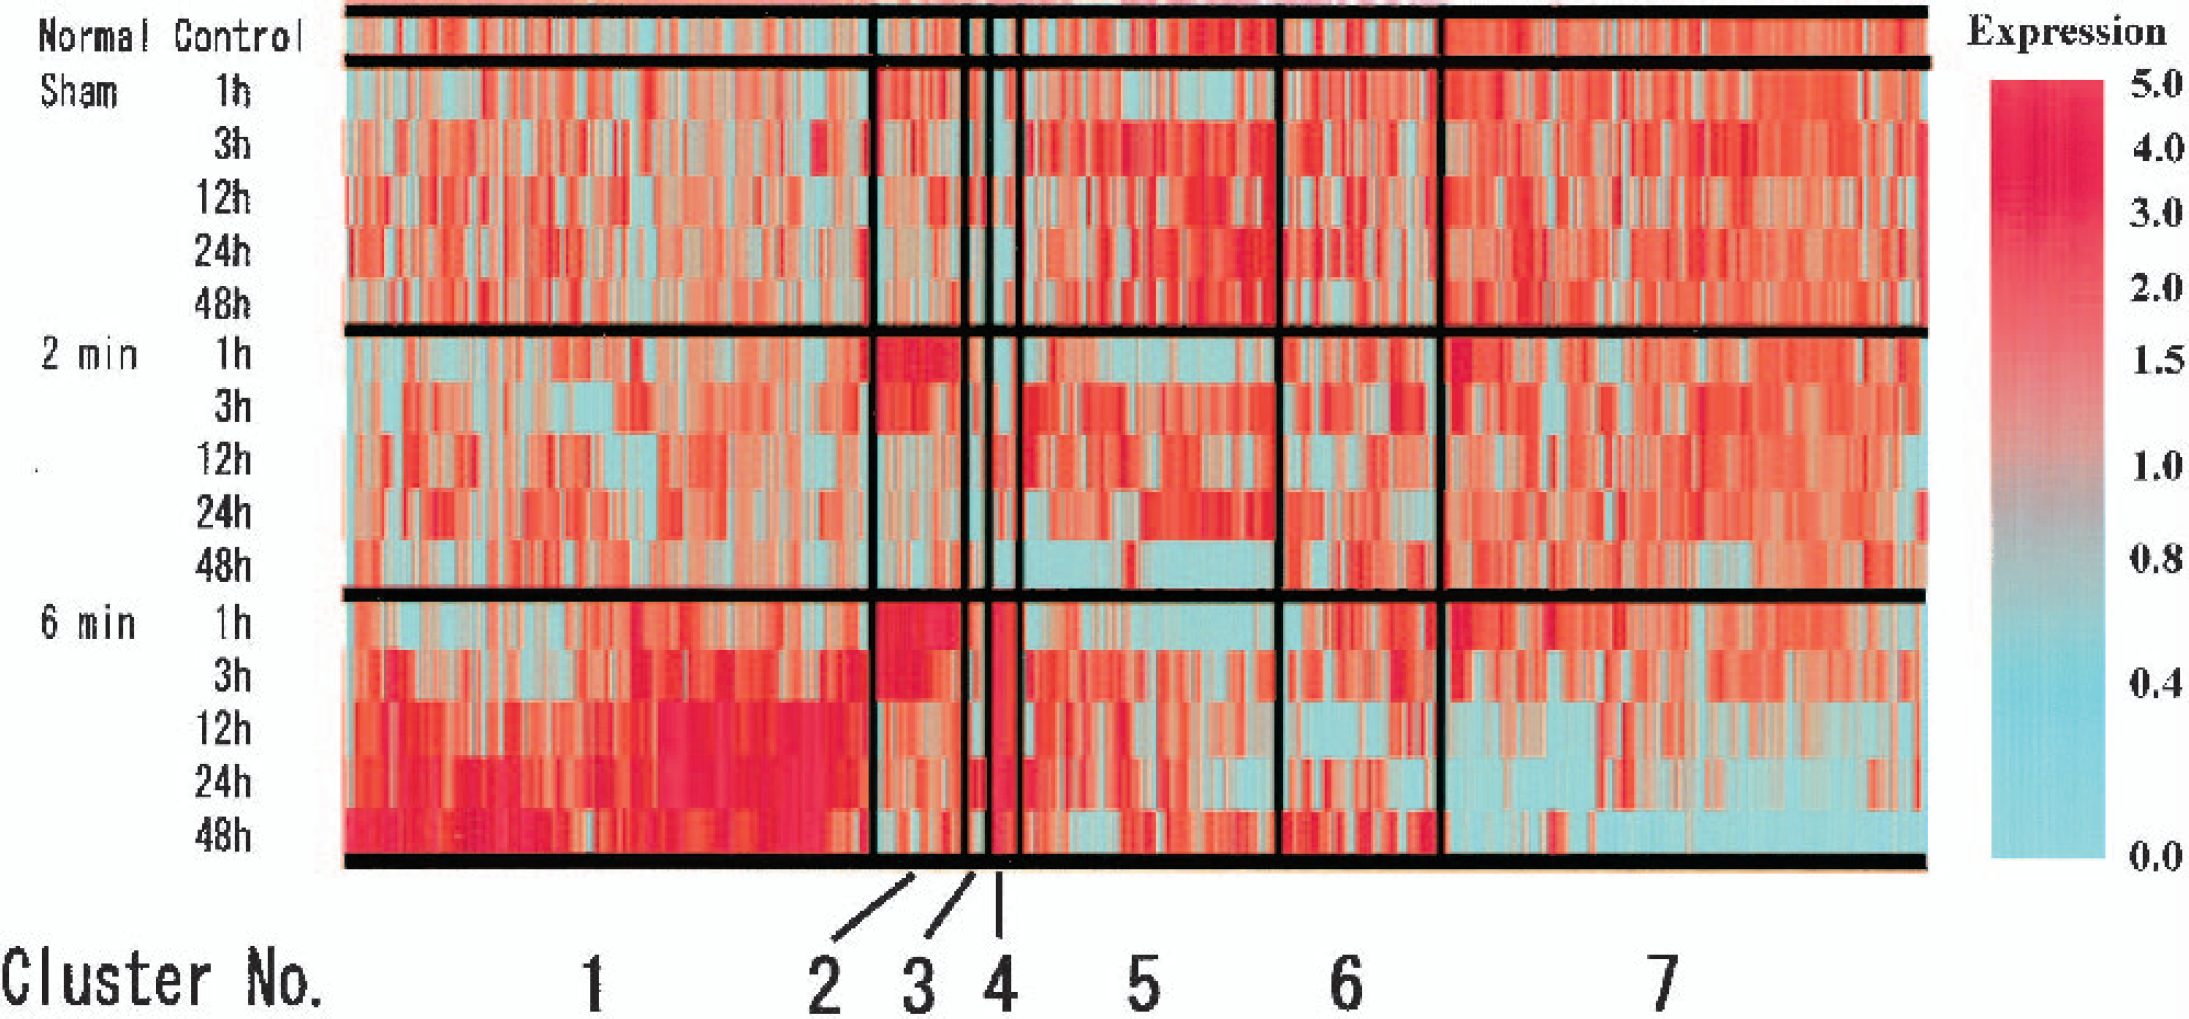
Clustered gene expression patterns of 451 transcripts that displayed differential expression in two- or six-minute ischemia by hierarchical cluster analysis. Each column represents an individual transcript and the row pertains to different data sets collected at different conditions and times as indicated. Genes with similar patterns of changes were grouped into seven clusters with distinct time and condition-specific features.
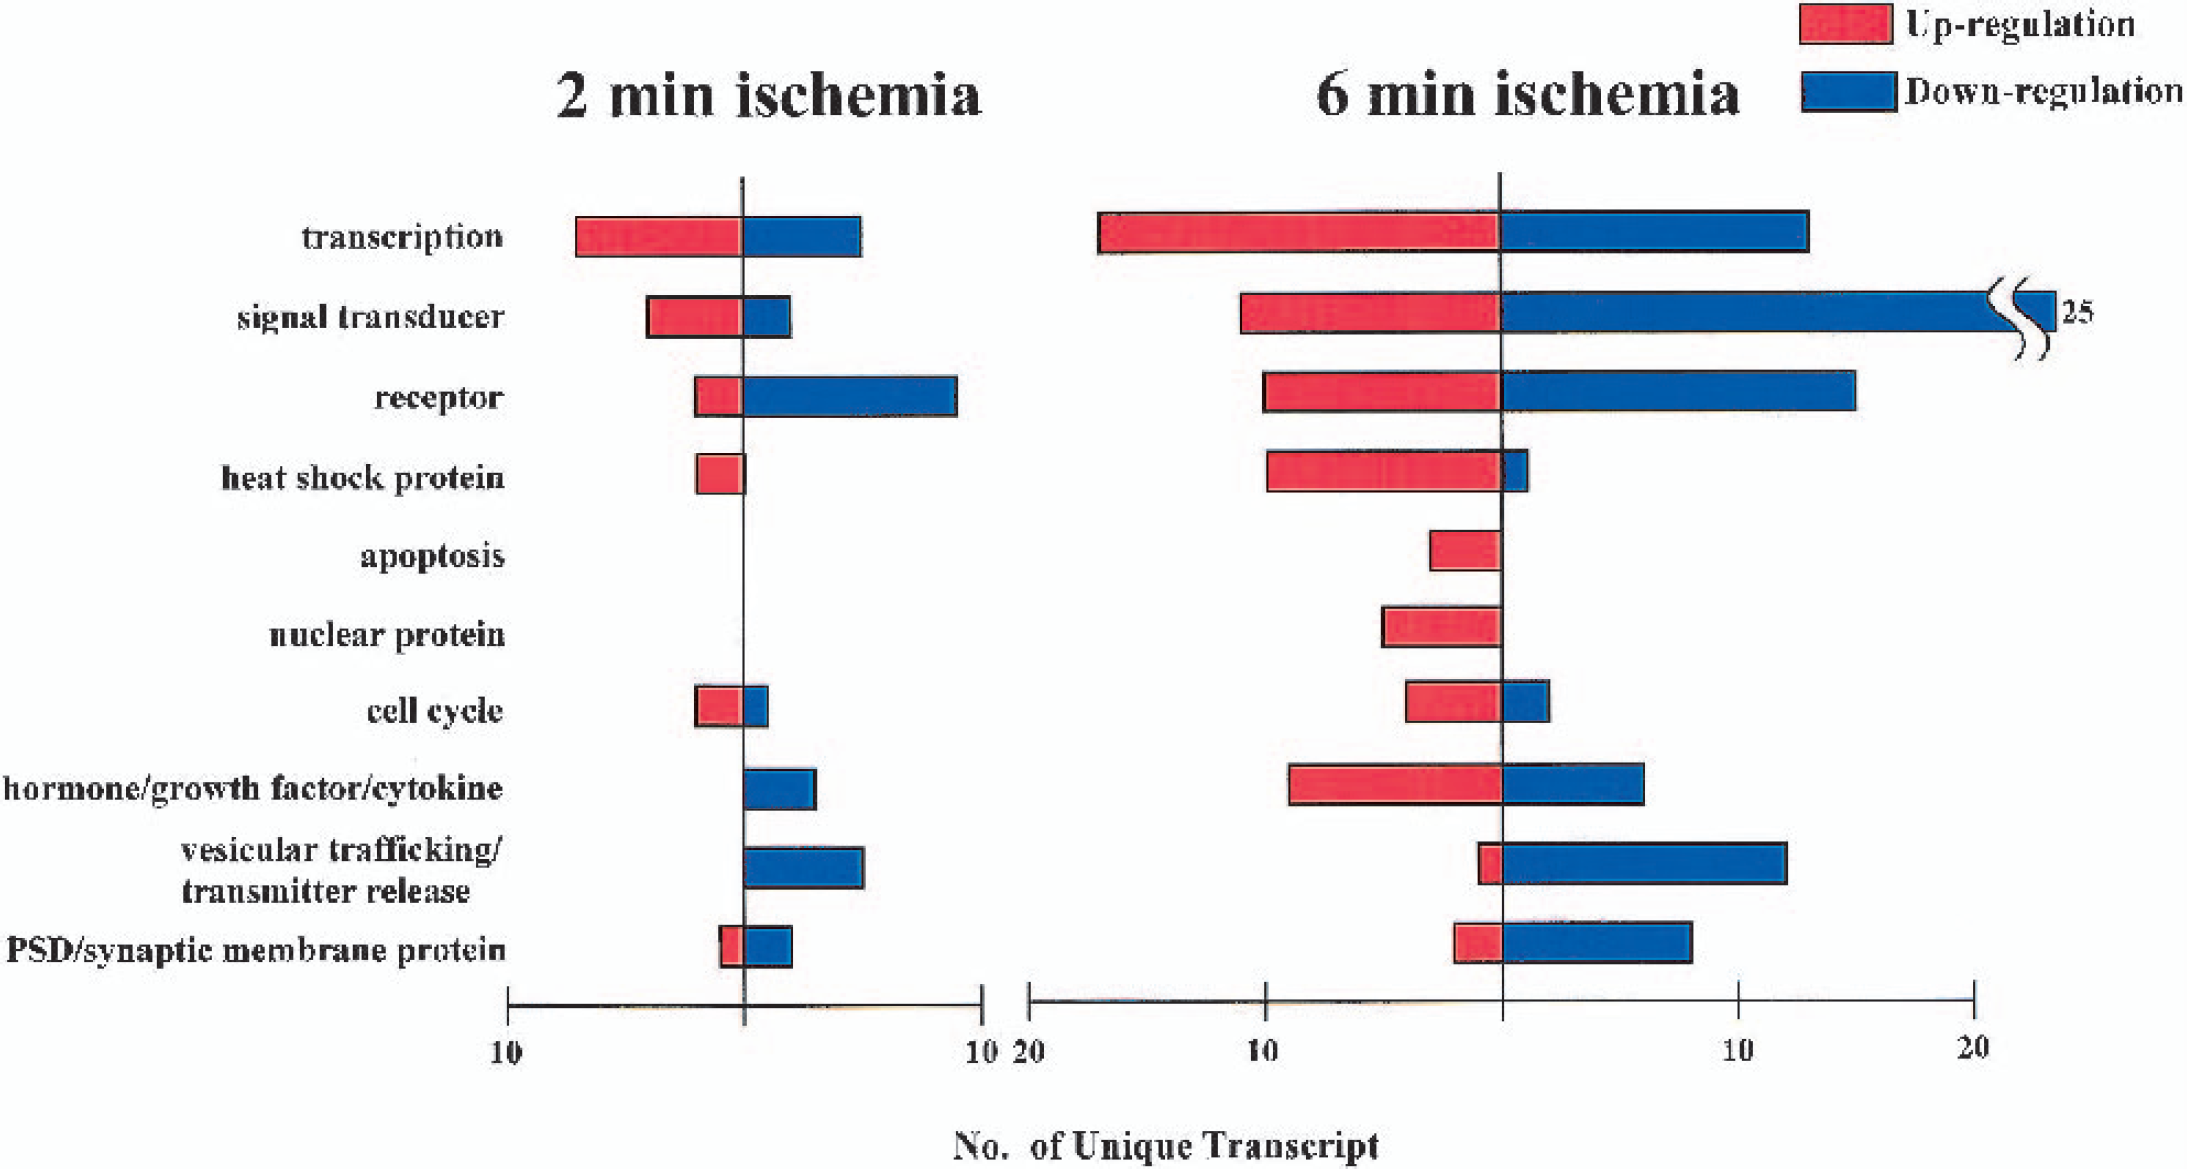
Bar diagram showing the numbers of transcripts in 10 major functional categories that exhibited up and down-regulation after two- and six-minute ischemia. Some categories, such as transcription, signal transducer, and heat shock proteins exhibited similar patterns, whereas apoptosis proteins, nuclear proteins, and hormone/growth factor/cytokine groups were more specifically altered after six-minute ischemia.
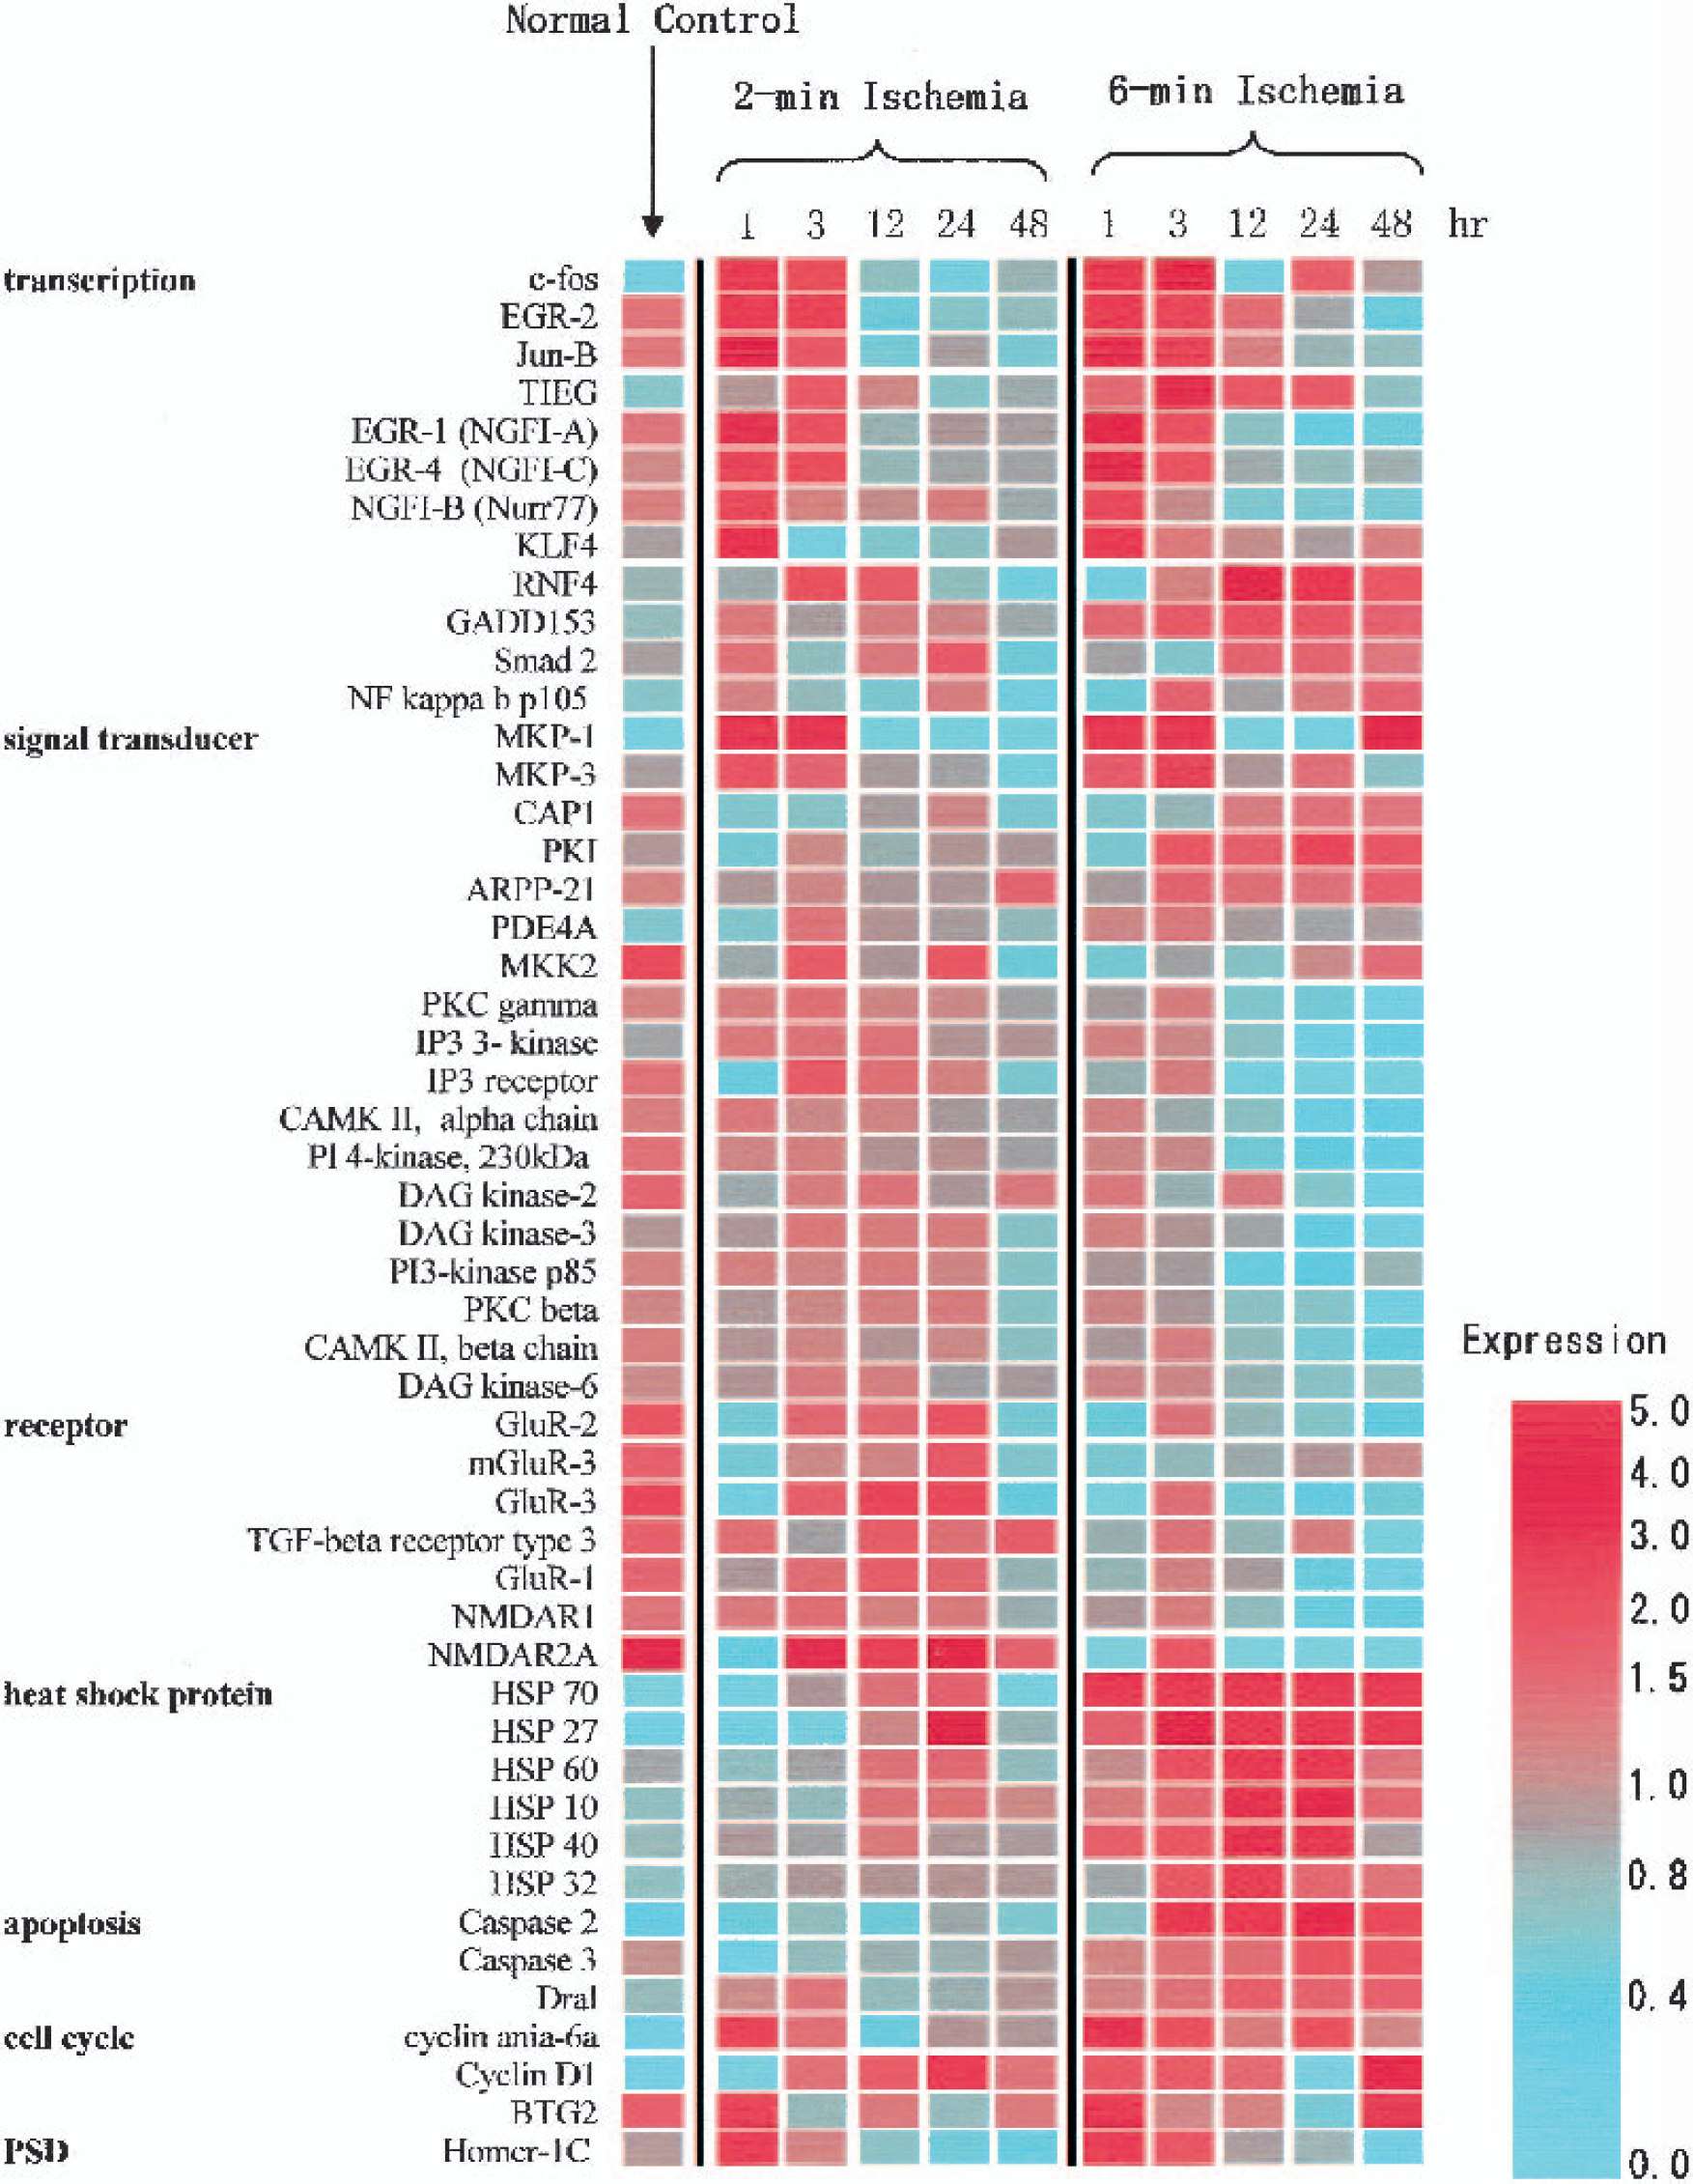
Expression levels of a subset of genes described in Table. These genes are categorized into functional clusters and their expression levels are shown by color for comparison among normal control, two-minute and six-minute ischemia with time course.
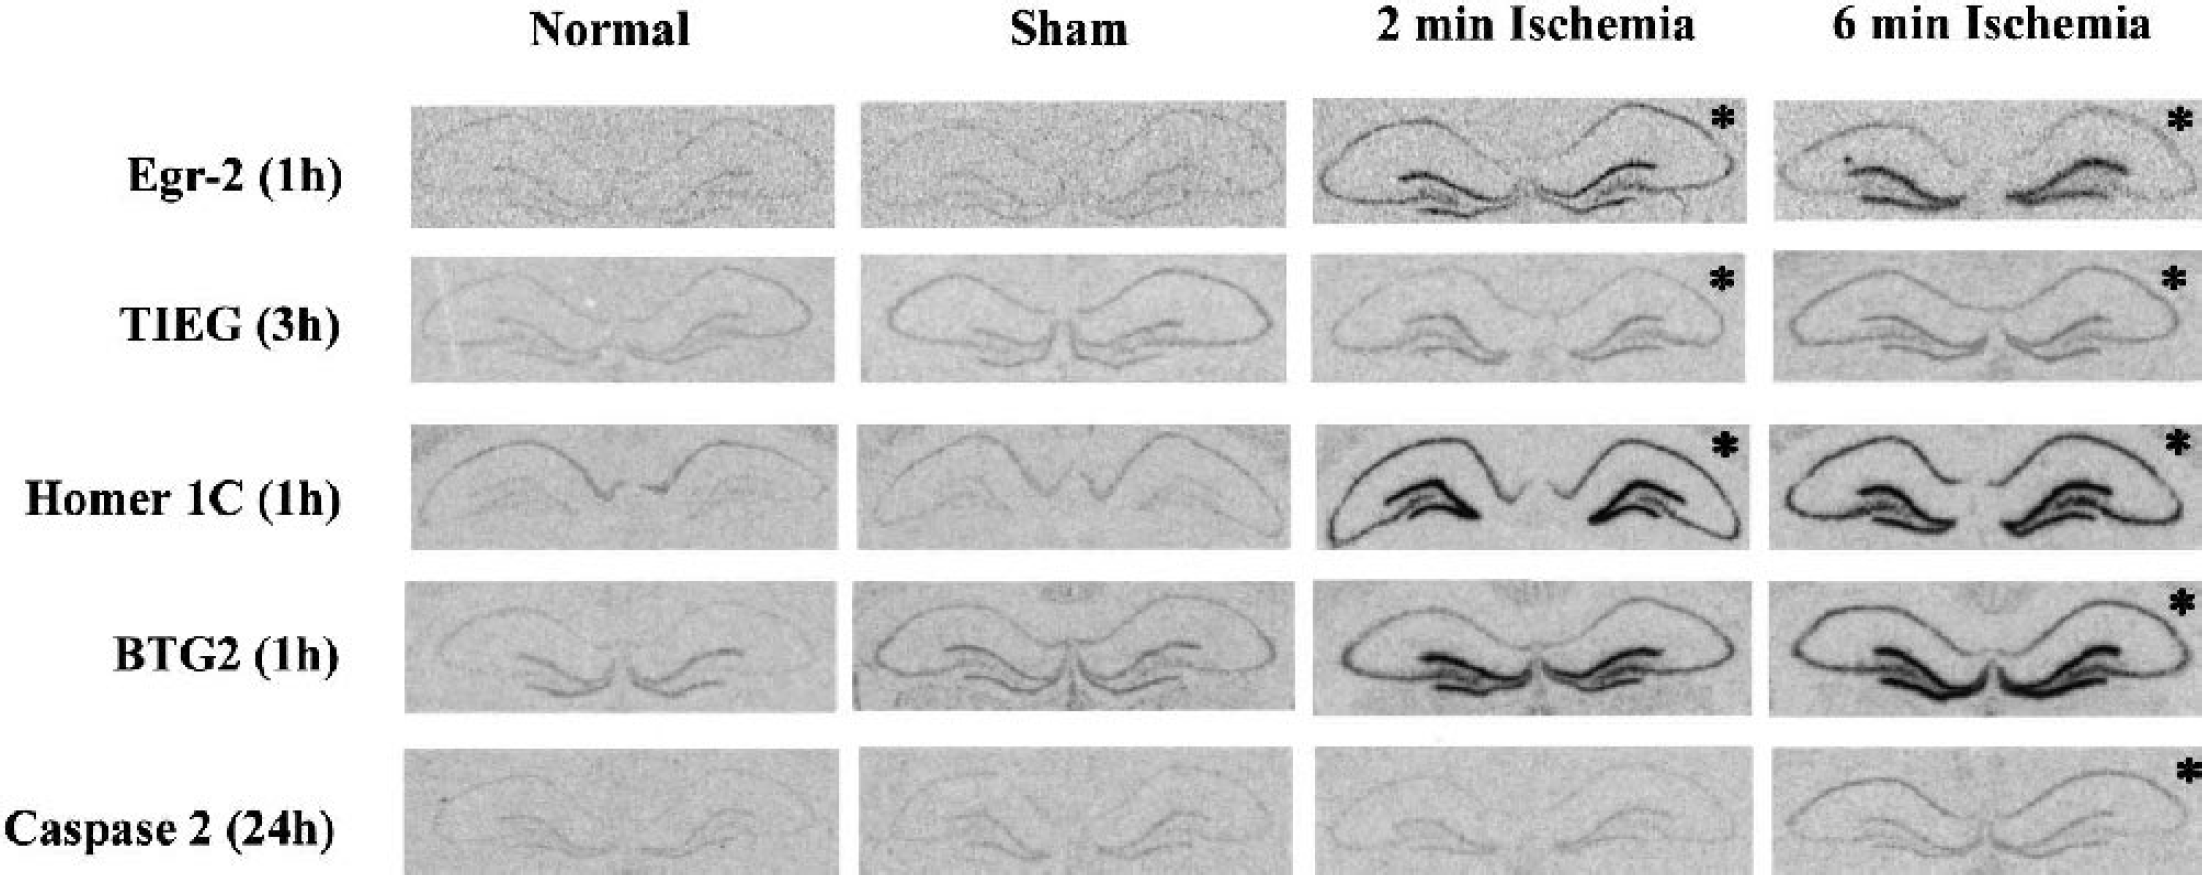
In situ hybridization autoradiogram for Egr-2, TIEG, Homer-1C, BTG2, Caspase-2. The time-points and conditions that showed increased expression by the microarray analysis were indicated by the asterisks on the autoradiograms. Comparison between these independent methods disclosed corresponding results in four out of five genes, though the signal intensity on the CA1 sector following ischemia was equivocal for TIEG.
Hierarchical Cluster Analysis for Coordinated Changes in mRNA Expression
To analyze the patterns of coordinated mRNA expression, we applied hierarchical cluster analysis (Eisen et al., 1998) to the transcripts with altered expression levels and could categorize these into seven clusters. As shown in Fig. 3, each cluster displayed distinctive time- and condition-specific characteristics. Transcripts included in cluster 2 showed immediate transient increases after both two- and six-minute ischemia, and corresponded to the majority of the up-regulated genes in two-minute ischemia, which overlap with a subset of those in six-minute ischemia. Specific changes in six-minute ischemia were shown in clusters 1 and 7, where these transcripts exhibited delayed increase or decrease, respectively. The transcripts in cluster 4 were markedly increased solely after six-minute ischemia. To analyze what type of transcripts are in each expression cluster, we searched nucleic acid databases, deleted duplicate transcripts of the same gene, and grouped each transcript into 20 functional categories. However, we could not find specific functional groups in the majority of clusters (data not shown), except clusters 2 and 4, which were highly specific for signal transducers/transcription factors and heat shock proteins, respectively.
Comparison of mRNA Expression between Ischemic Tolerance and Neuronal Death
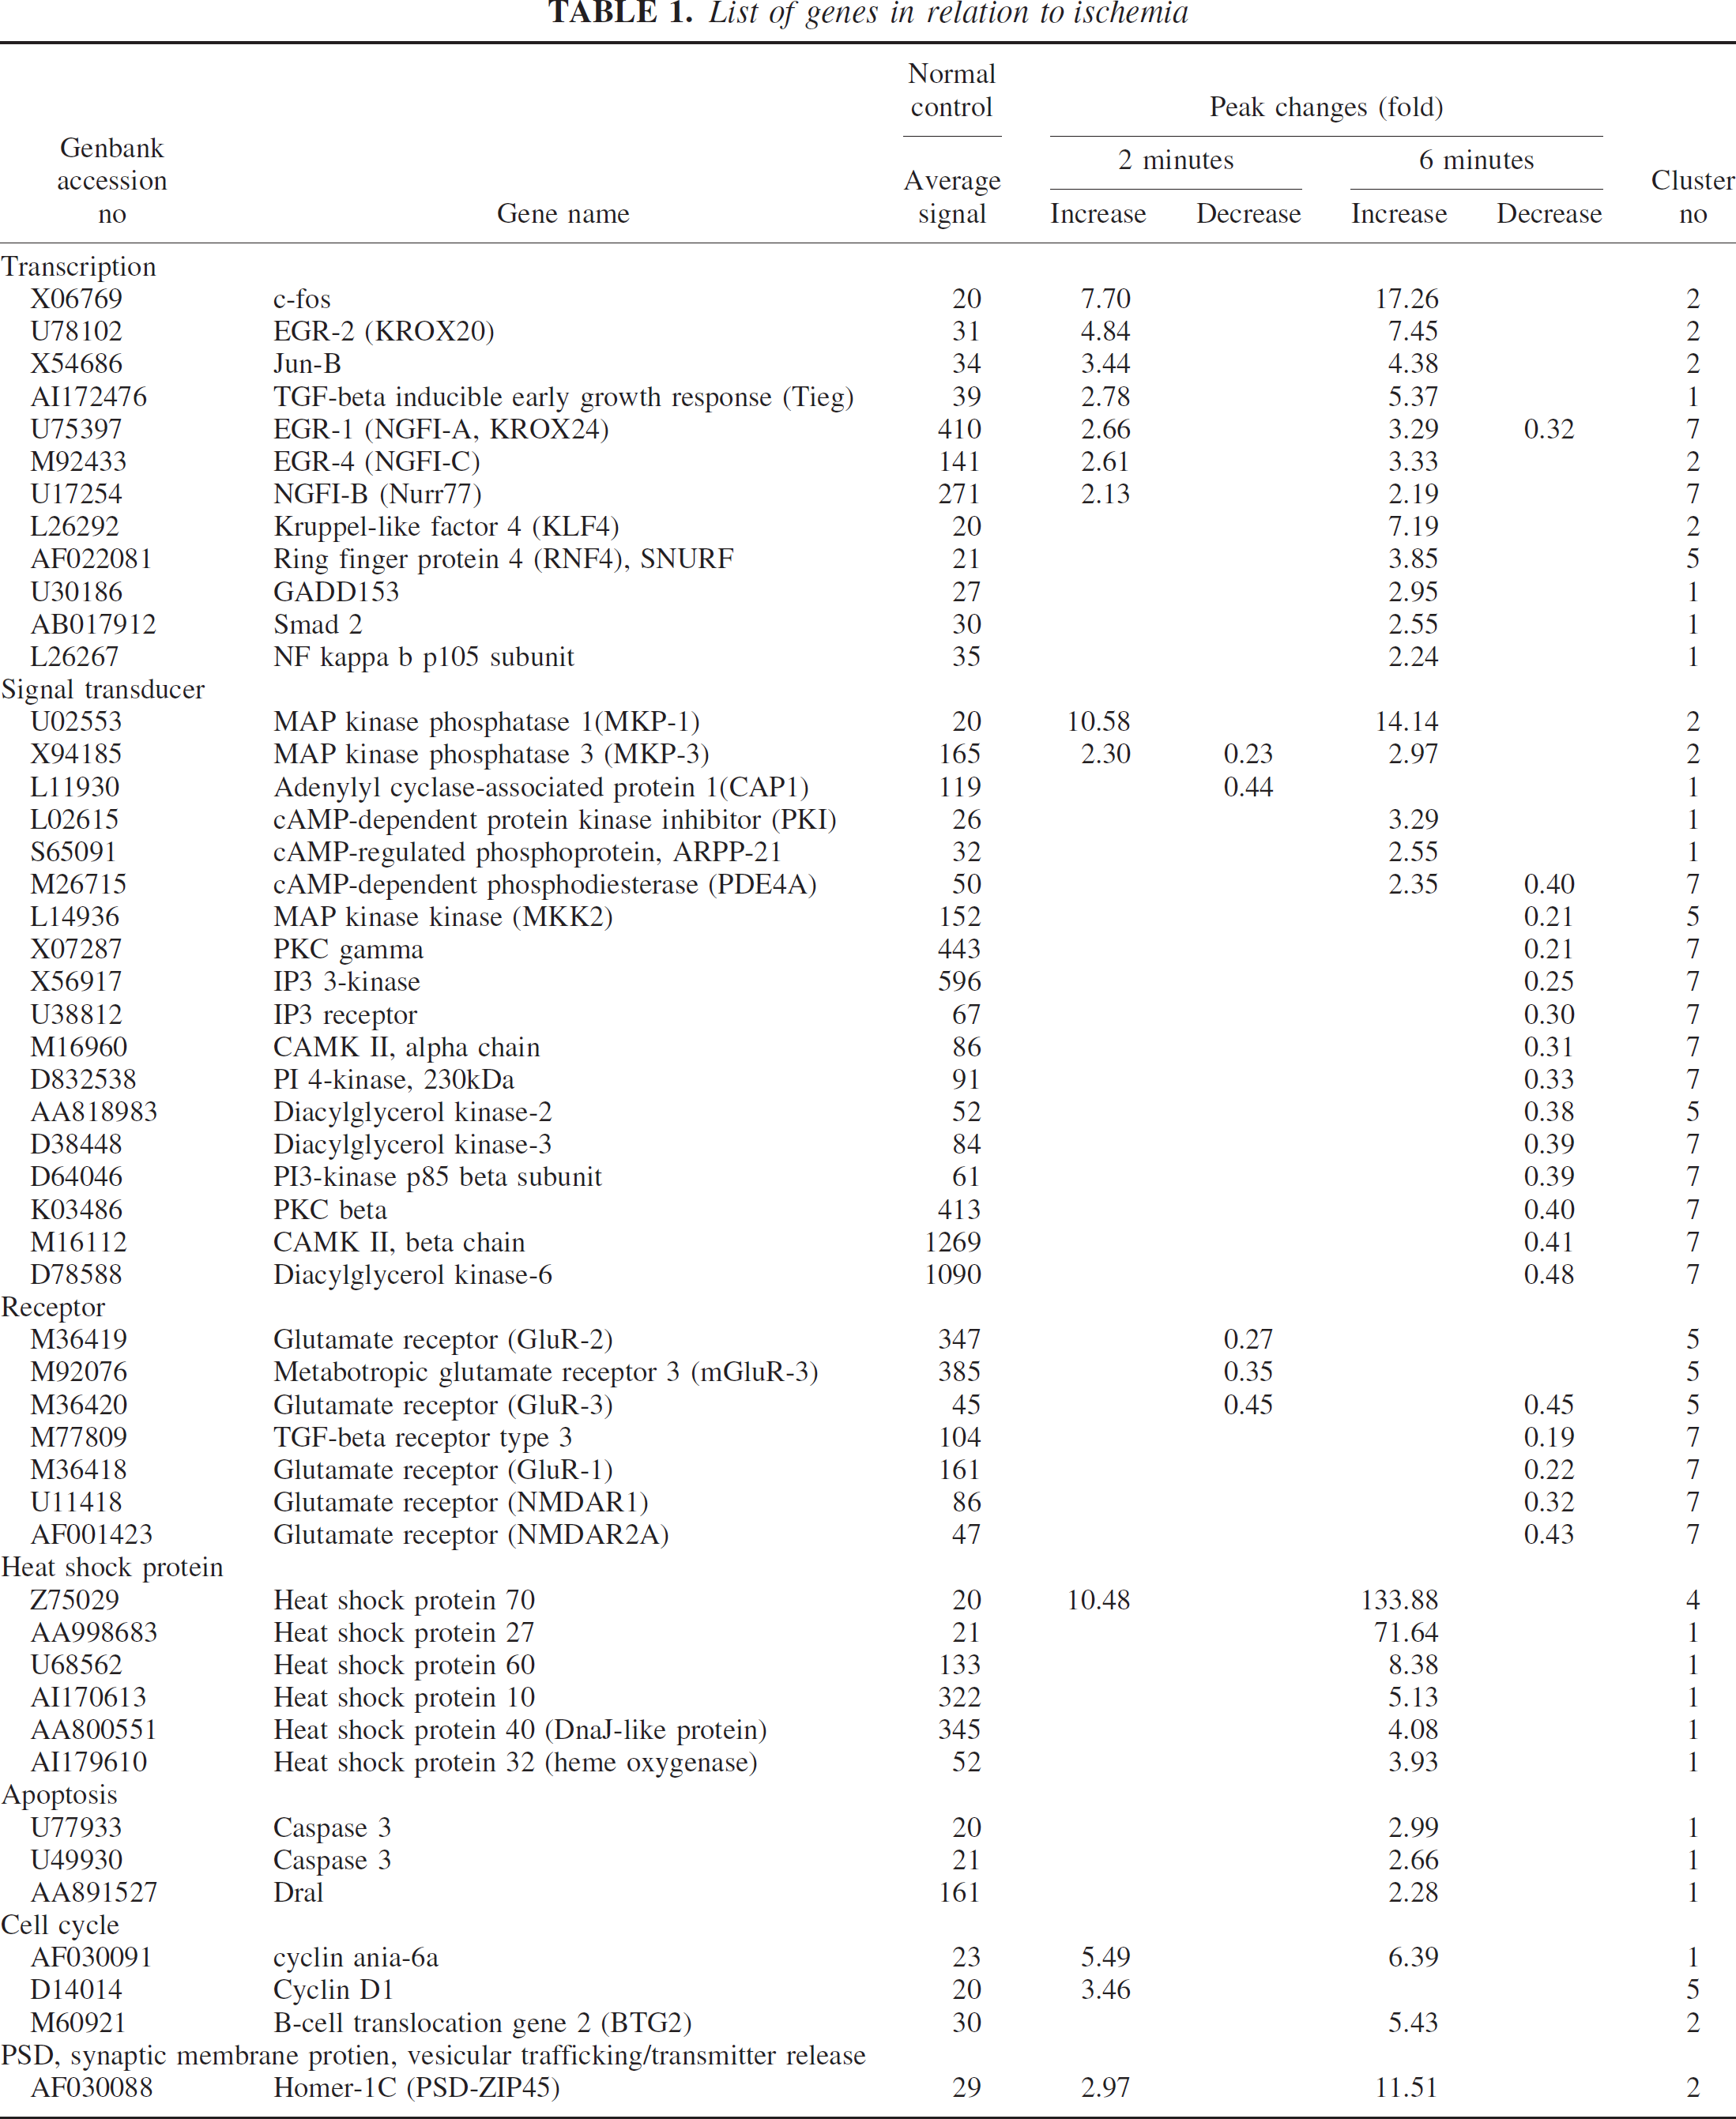
To analyze differential expression profiles between two- and six-minute ischemia, genes with altered levels of expression were compared according to their functional categories. The main results are shown in Fig. 4; some of the individual genes are listed in the Table and Fig. 5. The complete data set for individual transcripts is available at our web site (http://www2.genome.rcast.u-tokyo.ac.jp/egl/index_e.html).
Following two-minute ischemia, the majority of up-regulated genes are transcription factors, signal transducers, receptors, heat shock proteins, and cell cycle proteins. Among the transcription factors, leucine zipper transcription factors (c-Fos, JunB), zinc finger Egr family members, such as Egr-1 (NGFI-A, Krox24, zif268), Egr-2, Egr-4 (NGFI-C), and the closely related nuclear orphan receptor NGFI-B (Nurr77), showed increased expression. A marked up-regulation of mitogen-activated protein kinase phosphatases (MKP-1 and −3) was observed. In particular, MKP-1 showed a 10-fold increase in gene expression after two-minute ischemia. With regard to heat shock proteins, only HSP70 was up-regulated.
Following six-minute ischemia, several distinctive features were noted compared with those in two-minute ischemia, although similar up-regulation within the same functional categories was observed. Transcription factors related to cell death and growth arrest (KLF4, RNF4, GADD153, Smad2, NFκ b), signal transducers for cyclic AMP signaling (CAP1, PKI, ARPP-12, PDE4A), and proapoptotic factors (Dral, Caspase 2 and 3) were specifically increased after six-minute ischemia. Secondly, various heat shock proteins were increased, such as Hsp60, Hsp40, Hsp32, Hsp27, in addition to Hsp70. Finally, a substantial number of genes belonging to various functional groups were down-regulated. Of particular interest among these are signal transducers related to MAP kinase pathways (MKK2) and phosphatidyl inositol signaling (PI3 kinase, PI4 kinase), diacylglycerols (diacylglycerol kinase-2, −3, −6), protein kinase C (PKC β and γ), calcium/calmodulin dependent protein kinase (CAMK II α and β) and calcium signaling (IP3 kinase, IP3 receptor). In addition to these, glutamate receptors of various types, such as AMPA-type (GluR-1, −2, −3), NMDA-type (NMDAR1, NMDAR2A), and metabotropic type (mGluR3), were also down-regulated, as well as TGF beta receptor.
In Situ Hybridization
To confirm the microarray data, we selected five genes from four different categories that showed increased expression and performed in situ hybridization study. For each gene, the autoradiographs at the peak value in the microarray experiment are shown in Fig. 6. Egr-2 (a transcription factor), TIEG (TGF inducible early growth response protein), and Homer-1C (a postsynaptic membrane protein) showed early increase in both two- and six-minute ischemia in the microarray experiment. These increases were confirmed in the CA1 pyramidal layer by in situ hybridization for Egr-2 and Homer-1C. However, the hybridization signal in TIEG was equivocal. BTG2 (B-cell translocation gene 2) and Caspase-2 showed increased expression only after six-minute ischemia, which were also confirmed by in situ hybridization. Thus, time-course and condition-specific alterations of mRNA expression were confirmed for four out of five genes.
DISCUSSION
We used a nonbiased oligonucleotide-based DNA microarray to assess alterations in gene expression after ischemia in the hippocampal CA1 region, where ischemic cell death and tolerance are specifically demonstrated. Of a total of 8,799 transcripts surveyed, 3,518 transcripts (40.0%) were present in normal conditions and 451 (5.1%) exhibited distinct changes following ischemia. Among these, ischemic tolerance was associated with changes in only 1.2% of the total transcripts, whereas ischemic cell death induced changes in 4.5%. This ratio is consistent with other studies which demonstrated changes in 0.6–2.0% of genes screened in physiological conditions such as aging (Lee et al., 2000) and environmental enrichment (Rampon et al., 2000), while pathological conditions were associated with a greater number of changes ranging from 6 to 10% (Friddle et al., 2000; Song et al., 2001; Stanton et al., 2000). In this regard, our study confirmed the idea that cellular injury is associated with greater changes in gene expression when compared with those in cellular adaptation to the same insult, in our case, ischemia.
A major obstacle in expression profiling by DNA microarray technology has been how to analyze a huge data set to obtain indicative information underlying a specific condition. We used hierarchical cluster analysis, which can efficiently group together the transcripts with similar changes by pairwise, average-linkage cluster analysis (Eisen et al., 1998). This approach revealed condition-specific changes, for example, that six-minute ischemia induced delayed and long-lasting changes compared with two-minute ischemia, as demonstrated by clusters 1 and 7. This clearly indicates that lethal ischemia initiates more complex, long-lasting cascades of molecular events. Although this approach is expected to produce similar functional groups (Lockhart and Winzeler 2000), we did not observe specific correlation, except for clusters 2 and 4 which were mostly specific to signal transducer/transcription factors and heat shock proteins, suggesting limitation of this assumption in ischemia.
List of genes in relation to ischemia
One of the main purposes of our study was to find key molecular events leading to ischemic tolerance and delayed neuronal death by global expression monitoring. This approach is based on the hypothesis that the abundance of RNA is proportional to the amount of protein. After lethal ischemia, it is known that translational activity is significantly decreased (Kleihues and Hossmann 1971). Thus, ischemic tolerance induced by sublethal ischemia is a suitable model for this approach, since it has been shown to be dependent on de novo protein synthesis (Barone et al., 1998). The most conspicuous changes we observed were for HSP70, leucine zipper and zinc finger transcription factors, such as c-Fos, JunB, Egr-1 (NGFI-A, Korx-24), Egr-2 (Krox-20), Egr-4 (NGFI-C), and a DNA-binding nuclear orphan receptor NGFI-B (Nurr77), which are regulated by a variety of stimuli or insults (for review, refer to Herdegen and Leah, 1998). Fos and Jun family members are implicated in neuronal degeneration following ischemia. In particular, c-Jun and JunB induction is observed in dying neurons after ischemia (Dragunow et al., 1994; Whitfield et al., 1999). Recently, a peptide inhibitor for c-Jun N-terminal kinase (JNK) that phosphorylates c-Jun has been shown to dramatically reduce infarction, which was accompanied by c-Jun activation and c-Fos transcription, thus indicating a critical role for AP-1 binding proteins in ischemic injury (Borsello et al., 2003). However, contradictory observations have been reported that mRNA for c-Fos and JunB were widely expressed in the surviving peri-infarct area after focal ischemia (Kinouchi et al., 1994). Consistent with our observations, c-Fos and c-Jun have been shown to be up-regulated in sublethal ischemia (Sommer et al., 1995; Truettner et al., 2002) and spreading depression (Kariko et al., 1998), that renders brain resistant to ischemic injury (Kawahara et al., 1995; Kirino et al., 1991). Furthermore, hypothermia (Akaji et al., 2003) and treatment with a neuroprotective agent (Cho et al., 2001) during ischemia increased expression of c-Fos, while its attenuation by antisense oligonucleotide led to increased ischemic injury (Zhang et al., 1999). Since it is known that c-Fos and c-Jun heterodimerizations decrease the transcriptional activity of c-Jun (Herdegen and Leah, 1998), the increase in c-Fos expression may attenuate c-Jun signaling cascade to favor neuronal survival. Considering these opposing results, the effect of complex AP-1 binding protein signaling on cerebral ischemia needs to be clarified by further study.
Similarly, roles of zinc finger-transcription factors in cerebral ischemia are still controversial. For example, Egr-1 (NGFI-A, Korx-24), Egr-2 (Krox-20), Egr-4 (NGFI-C), and NGFI-B (Nurr77) were induced following focal and global ischemia (Honkaniemi and Sharp 1996; Honkaniemi et al., 1997), in which persistent expression of Egr-1 was associated with delayed neuronal death in CA1. Egr-1 and NGFI-B have been shown to induce apoptotic cell death in various in vitro studies (Catania et al., 1999; Li et al., 2000). However, in vivo evidence for a proapoptotic role in cerebral ischemia is still lacking. On the contrary, Egr-1 up-regulates the expression of antioxidant (Maehara et al., 2001) and neuroprotective EGF receptor (Nishi et al., 2002), and has been found to inhibit apoptosis following ultraviolet irradiation (Huang et al., 1998). NGFI-B has also been found to inhibit apoptosis when phosphorylated by Akt (Masuyama et al., 2001). Consistent with our findings, these observations may suggest a neuroprotective role in several contexts of insult such as sublethal ischemia.
Another important change in ischemic tolerance was robust up-regulation of MAP kinase phosphatase 1 and 3 (MKP-1 and −3). These phosphatases dephosphorylate and inactivate proteins of the mitogen activated protein kinases (MAPK) cascades (Franklin and Kraft 1997; Zhao and Zhang 2001), such as ERK (extracellular-signal regulated kinase), JNK, and p38 which play crucial roles in various stress conditions (for review, refer to Irving and Bamford, 2002). During cerebral ischemia, JNK and p38 are immediately phosphorylated (activated) and considered detrimental signals for neuronal death (Borsello et al., 2003; Gu et al., 2000; Sugino et al., 2000). Though ERK is also activated after lethal ischemia (Namura et al., 2001), its role is still controversial because it has been recently shown to be a critical pathway for induction of ischemic tolerance in vitro (Gonzalez-Zulueta et al., 2000), as well as in vivo (Gu et al., 2000; Gu et al., 2001). Of particular interest is the observation that MKP-1 is transcriptionally up-regulated and phosphorylated by ERK, leading to stabilization of the protein (Brondello et al., 1997; Brondello et al., 1999). MKP-1 is also up-regulated by hypoxia (Bernaudin et al., 2002), spreading depression, and in the periinfarct region, which are not accompanied by neuronal injury (Gu et al., 2000; Hermann et al., 1999; Irving and Bamford 2002; Soriano et al., 2000). Since its higher phosphatase activity is shown against JNK and p38 compared to that against ERK (Franklin and Kraft 1997), it acts rather specifically as an inhibitor of JNK and p38 signaling. Based on these findings, we speculate that MKP-1 induced by sublethal ischemia may “prime” the neurons to inhibit detrimental signals through JNK and p38 during subsequent lethal ischemic insult thus contributing to ischemic tolerance. Though this hypothesis seems attractive, it has to be verified by further in vitro and in vivo experiments at the protein level.
Compared to ischemic tolerance, remarkable changes in gene expression were associated with delayed neuronal death. However, these changes should be cautiously interpreted when considering the general translational inhibition after long lethal ischemia (Kleihues and Hossmann 1971). Nevertheless, several unique features of our study should be mentioned since some proapoptotic gene products are still increased in this condition, such as Bax and Caspase-3 (Chen et al., 1996; Chen et al., 1998), in addition to the well-described up-regulation of various heat shock proteins (Abe et al., 1998). Firstly, a substantial number of genes implicated in cell death were increased, such as NF κ b (Schneider et al., 1999), KLF4 (Chen et al., 2000), RNF4 (Pero et al., 2001), GADD153 (Murphy et al., 2001), and TGF signaling DNA biding protein Smad2 (Jang et al., 2002). Similarly, proapoptotic factors such as Caspase-2 and 3, and Dral were also increased. Caspase-2 and 3 are proteases that mediate apoptotic signals, and have already been implicated in ischemic neuronal death (Chen et al., 1998; Jin et al., 2002), whereas Dral is a newly identified gene that is p53 responsive and implicated in apoptosis (Scholl et al., 2000). Secondly, a large number of genes were down regulated. Of particular interest among these are signal transducers involved in ERK (MKK2), PI3 (PI3 kinase, PI4 kinase), and DAG/PKC (diacylglycerol kinase-2, 3, 6, PKC β and γ) pathways. Although the roles of these pathways in cell death or survival are controversial, several studies have shown their critical role as survival factors (Gu et al., 2001; Maher 2001; Marte and Downward 1997; Xia et al., 1995), which may imply attenuation of survival signals in ischemic neuronal death. PI4 kinase, a key enzyme in growth promoting PI3 kinase-Akt/PKB pathway (Marte and Downward 1997), has been shown independently to be down-regulated in ischemic neuronal death, and demonstrated to be neuroprotective when expressed persistently (Furuta et al., 2003). These observations would indicate an overall transcriptional response leading to an imbalance between death and survival signals in ischemic neuronal death, a distinctive feature not observed in ischemic tolerance.
Finally, a critical issue inherent in the current study is whether the data is reliable. We first evaluated reproducibility of housekeeping genes (GAPDH and β actin) among different arrays and confirmed that differences of expressions are within two-fold changes (data not shown). We next set the filtering value of two-fold change for duplicate samples, since this cutoff value has already been used and validated in non-tumorous expression analysis (Jin et al., 2001; Stanton et al., 2000). Another method of validation is to compare our results with those already reported in microarray analysis after ischemia (Bernaudin et al., 2002; Jin et al., 2001; Keyvani et al., 2002; Soriano et al., 2000). However, due to the differences in the model, the sampling region and timing, direct comparison is difficult. Instead, we conducted a literature search for 311 annotated genes listed in our study and identified 135 genes (43%) whose changes in expression have previously been described following ischemia in various tissues. In addition, we conducted an independent study by in situ hybridization, which revealed corresponding results in four out of five genes examined. However, some genes already described to be up-regulated in global ischemia did not appear in our profile, such as Bax (Chen et al., 1996). Bax transcripts exceeded the two-fold cutoff value only once in our experiments, thus failing to meet our current criteria. Though this observation may suggest low sensitivity (higher false negative rate), our results for ischemia seem to provide more specific data (lower false positive rate). Other studies also supported the reliability of oligonucleotide microarray data when compared with other validation methods, such as RT-PCR (Bernaudin et al., 2002; Tang et al., 2001), and others (Chudin et al., 2002; Ishii et al., 2000). New methods for microarray data analysis are being developed to improve sensitivity and specificity in a variety of experimental paradigms, such as Significance Analysis of Microarray Data (SAM) and Expression Deconvolution Analysis (Lu et al., 2003; Tusher et al., 2001). Further improvements and application of these methods to complex data, such as expression profiling of multiple groups along a time course, as in the current study, would improve data mining. Reinterpretation of the raw data derived from various ischemia related studies will be required in the future, using these highly sophisticated methods.
Our study revealed a wide variety of transcriptional responses with distinct patterns in relation to two different ischemic insults, namely delayed neuronal death and induced tolerance in the hippocampal CA1 region. Induced tolerance was associated with immediate and transient responses in a limited number of genes, whereas neuronal death was accompanied by immediate responses followed by delayed and long-lasting changes in a larger number of genes. Combined with changes in each gene, this genome-wide view of genomic responses will deepen our understanding of cerebral ischemia by narrowing our focus to target pathways or molecules and contribute to clarification of the molecular pathophysiology of delayed neuronal death and ischemic tolerance.
Footnotes
Acknowledgements
The authors thank Ms. Reiko Matsuura for technical assistance.