
Abstract
The authors investigated concomitant lactate and glucose metabolism in primary neuronal cultures using 13C- and 1H-NMR spectroscopy. Neurons were incubated in a medium containing either [1-13C]glucose and different unlabeled lactate concentrations, or unlabeled glucose and different [3-13C]lactate concentrations. Overall, 13C-NMR spectra of cellular extracts showed that more 13C was incorporated into glutamate when lactate was the enriched substrate. Glutamate 13C-enrichment was also found to be much higher in lactate-labeled than in glucose-labeled conditions. When glucose and lactate concentrations were identical (5.5 mmol/L), relative contributions of glucose and lactate to neuronal oxidative metabolism amounted to 21% and 79%, respectively. Results clearly indicate that when neurons are in the presence of both glucose and lactate, they preferentially use lactate as their main oxidative substrate.
Glucose is not only considered the major energy substrate for the brain but, by extension, it is well established that it represents the predominant, if not exclusive, fuel for neurons (Clarke and Sokoloff, 1994). Despite undisputable evidence that glucose is indeed an essential energy substrate for the brain, a number of observations collected over several decades have suggested that other substrates, and in particular monocarboxylates such as lactate, can also be used by neural cells (Bouzier-Sore et al., 2002). Indeed, studies performed on both in vitro preparations and in vivo have shown that nervous tissue efficiently uses lactate. Simple observations made on cultured neurons have revealed that once glucose has been entirely consumed, lactate remaining in the culture medium is subsequently used (Korinkova and Lodin, 1976). Lactate has also been shown to support respiration, maintain ATP levels, and reduce glucose utilization in brain slices and in cultured neurons (Fernandez and Medina, 1986; Ide et al., 1969; Izumi et al., 1994; McIlwain, 1953; Pellerin et al., 1998; Tabernero et al., 1996; Wada et al., 1997). Although the capacity of lactate alone to maintain synaptic function in hippocampal slices has been debated (Cater et al., 2001; Schurr et al., 1988; Takata et al., 2001), lactate has been shown to preserve synaptic activity even in the presence of low (and insufficient) concentrations of glucose (Izumi et al., 1997). Such an interesting observation raises the question of whether neurons can (and would prefer to) concomitantly use these two substrates.
A number of studies have also documented the use of lactate in vivo. In this regard, NMR spectroscopy has been particularly useful in providing a means by which to explore substrate utilization in the brain. Thus, it was demonstrated using 13C-lactate that lactate, once it has entered the brain, is readily metabolized in a manner analogous to glucose (Qu et al., 2000). Furthermore, it was observed that no difference in brain glutamine C2 and C3 labeling occurs when [3-13C]lactate is injected intravenously to rodents, indicating that lactate must be metabolized in a compartment deprived of pyruvate carboxylase activity (Bouzier et al., 2000; Hassel and Brathe, 2000). Altogether, these results strongly suggest that lactate is more specifically a neuronal substrate in vivo. Despite such evidence for neuronal lactate utilization both in vitro and in vivo, little information exists about the preferential use of either lactate or glucose by neurons when both substrates are available (Bliss and Sapolsky, 2001; Waagepetersen et al., 2000). Moreover, it would be interesting to consider the changes in substrate utilization as the ratio between lactate and glucose concentrations varies, as it probably does in vivo notably as a consequence of brain activation. Taking advantage of NMR spectroscopy to explore these aspects, we analyzed both lactate and glucose metabolism in primary cultures of neurons when both substrates are present by alternatively labeling each metabolite as either [1-13C]glucose or [3-13C]lactate. These conditions allowed us to evaluate the relative participation of each substrate to neuronal oxidative metabolism.
MATERIALS AND METHODS
Cell culture preparation
Experimental protocols used in this study were approved by appropriate institutional review committees and meet the guidelines of the French governmental research agency (authorization No. 7368).
Primary cultures of neurons were prepared from brains of neonatal Wistar rats (Charles River) taken at postnatal day 0, and cultured in Neurobasal medium (Gibco BRL) containing 2% B27 supplement (Gibco BRL) and 5-mmol/L glutamine. Neonates were decapitated and their head rinsed in a PBS-glucose (7.9 mmol/L) solution containing penicillin (40,000 U/L), streptomycin (40,000 U/L), and amphotericin (100 μg/L) (Antibiotic-Antimycotic, 4 mL/L, Gibco BRL). The brain was rapidly removed from the skull, placed in PBS-glucose, and dissected under a binocular microscope to remove the meninges. Forebrains were placed in a tube containing 1 mL PBS-trypsin-DNase solution (1%, 0.1%) for 15 minutes at room temperature. Forebrains were then rinsed three times with PBS and 1 mL Neurobasal-DNase-HEPES (25 mg, 600 μL of 0.33-mmol/L HEPES) was added. Mechanical dissociation was performed by 10 successive passages through the flame-narrowed opening of a Pasteur pipette (1-mm diameter), followed by the same procedure using a Pasteur pipette with an opening of smaller diameter (0.5 mm). Thereafter, dissociated tissue from two brains was pooled and 10 successive passages through the opening of the smaller-gauge Pasteur pipette were repeated. After 10 minutes of incubation at room temperature followed by 10 minutes at 4°C, the cell suspension was centrifuged at 2,000 rpm for 10 minutes. The supernatant was removed and the pellet resuspended in 3 mL Neurobasal-B27-glutamine medium. Finally, cells were plated onto poly-L-ornithine-coated Petri dishes (107 cells/dish of 10-cm diameter). Neuronal cultures were maintained for 5 days in vitro at 37°C in an atmosphere of 95% air/5% CO2 (saturated in humidity). Half of the initial culture medium was replaced by fresh medium 24 hours after plating to eliminate dead cells and waste products. For each experiment, 38 ± 2 newborn rats were used. A maximum of 12 brains were processed at once to limit the possibility of ischemia-related damage.
Characterization of cultures by immunohistochemistry
For cell labeling, cells were grown on poly-L-ornithine-coated coverslips placed in 24 multiwell plates under conditions similar as those used for NMR experiments. After washing once with PBS, cells (at 5 days in vitro) were fixed with 2% paraformaldehyde for 30 minutes. After exposure to PBS-fetal calf serum 20% to saturate nonspecific sites, cells were incubated with mouse anti-microtubule associated proteins 2 (Sigma) and/or rabbit anti–glial fibrillary acidic protein (Dako) antibodies (diluted 1/100 each, 4 hours at 4°C followed by 30 minutes at room temperature). Before addition of secondary antibodies, cells were rinsed twice with PBS and incubated for 15 minutes in PBS-fetal calf serum 20%. Primary antibodies were revealed by FITC antirabbit and/or rhodamine antimouse antibodies (Chemicon; diluted 1/100).
The percent of neurons in our cultures was calculated as the number of microtubule associated proteins 2-positive cells divided by the total number of cells as counted in phase contrast. It was found that 89.9 ± 2.8% of cells were neurons; the remaining were essentially astrocytes, as determined by glial fibrillary acidic protein staining.
Incubation conditions with 13C-labeled substrates
In this study, cells were incubated in presence of both glucose and lactate, and each metabolite being alternatively labeled as [1-13C]glucose or [3-13C]lactate. This protocol allowed us to distinguish neuronal metabolism derived from either glucose or lactate while both substrates are present. It is important to realize that, for a chosen lactate concentration, cells are exposed to exactly the same conditions (it is only the labeled substrate that changes). This approach avoids several biases, such as putative differences in redox potential, and allows direct comparison of metabolism from both substrates under identical conditions. Thus, at 5 days in vitro, neuronal cultures were rinsed once with PBS and Dulbecco's modified Eagle medium (Sigma) containing either glucose (5.5 mmol/L) and [3-13C]lactate (enriched at 99%, Eurisotop, 1.1, 5.5, or 11 mmol/L) (condition 1), or [1-13C]glucose (enriched at 99%, Eurisotop, 5.5 mmol/L) and lactate (1.1, 5.5, or 11 mmol/L) (condition 2), was added followed by an incubation period of 4 hours. To determine glucose and lactate concentrations, medium samples were taken at 0 and 4 hours.
Nuclear magnetic resonance spectroscopy of perchloric acid extracts
After the 4-hour incubation period, cells were rapidly rinsed once with PBS and their metabolites extracted with 3 mL perchloric acid (0.9 mol/L). Upon addition of perchloric acid, cell residues were scraped off and the whole suspension collected. After centrifugation (2,000 g; 10 minutes) of the perchloric acid extract, the pellet was dissolved in 0.2-mol/L Tris-base-2% sodium dodecyl sulfate for measurement of the protein content. The supernatant was neutralized with KOH, centrifuged to eliminate perchlorate salts, and freeze-dried. For NMR spectroscopy, each sample was dissolved in 800 μL D2O and a known amount of ethylene glycol was added to the sample as an internal reference (peak at 63 ppm).
Spectra were obtained with a Bruker Avance DPX400 wide-bore spectrometer equipped with a 5-mm broadband probe. 1H-NMR spectra were acquired with 3-microsecond pulses, 1-second acquisition time, 6-second relaxation delay, 4,000Hz sweep width, and 32-K memory size. Residual water signal was suppressed by homonuclear presaturation. Proton-decoupled 13C-NMR spectra were acquired overnight using 6-microsecond pulses, 0.5-second repetition time, 22,150-Hz sweep width, and 64-K memory size. Measurements were conducted at 25°C under bilevel, broadband, gated proton decoupling and D2O lock.
Determination of metabolite carbon-13 enrichments
A proton-observed carbon-editing sequence was used to determine the 13C-specific enrichments of the different carbon positions of metabolites. 13C-specific enrichment was assessed using a [13C]-1H multiple-quanta coherence transfer pulse sequence, based on the one established by Freeman et al. (1981), but slightly modified, as described previously (Bouzier et al., 2000). Flip angles for rectangular pulses were carefully calibrated on both radiofrequency channels before each experiment. The relaxation delay was 6 seconds for a nearly complete longitudinal relaxation. 13C-specific enrichment was calculated as the ratio of the area of a given resonance in the edited 13C-1H spectrum to its area in the standard spin-echo spectrum. Each sample contained 5 μmol of natural abundant 13C ethylene glycol as an internal standard for 13C-specific enrichment labeling. The 13C-enrichment of glucose C1 was determined from areas of satellite peaks resulting from the heteronuclear spin-coupling patterns on 1H-NMR spectra.
Determination of contribution from different pathways and pools to glutamate labeling
Different synthetic pathways and existing pools can contribute to total intracellular neuronal glutamate labeling. As illustrated in Fig. 1, the contribution of each of these processes can be designated as α1, α2, α3, and α4, where α1 represents the percent of labeled glutamate coming from external glucose, α2 represents the percent of labeled glutamate coming from intracellular lactate formed from glucose (i.e., glycolytic lactate), α3 represents the percent of labeled glutamate coming from external lactate, and α4 represents the percent of unlabeled endogenous glutamate coming from preexisting intracellular glutamate pools (both vesicular and non-vesicular).
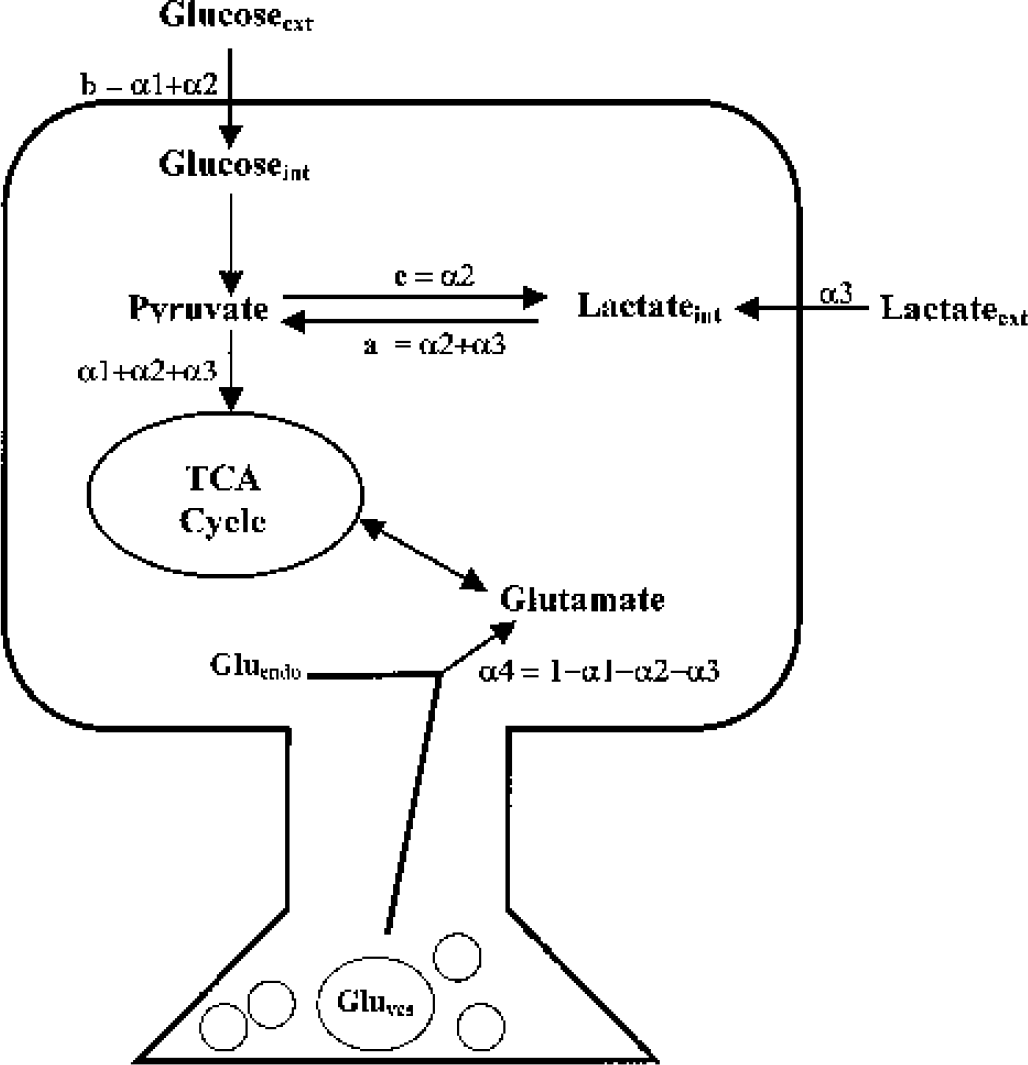
Glucose and lactate utilization by the neuron for its oxidative metabolism under defined incubation conditions. α1 represents the percent of labeled glutamate coming from external glucose (Glucoseext), α2 represents the percent of labeled glutamate coming from glycolytic lactate, α3 represents the percent of labeled glutamate coming from external lactate (Lactateext), and α4 represents the percent of unlabeled endogenous glutamate coming from the cytoplasm and mitochondria (Gluendo) and synaptic vesicles (Gluves).
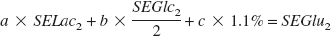
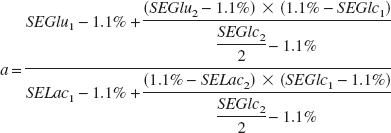
When neurons are placed in a medium containing glucose and [3-13C]lactate (condition 1), glutamate 13C-specific enrichment can be described as follows:

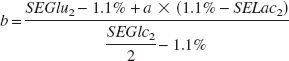
where a represents the percent of [3-13C]lactate used for glutamate labeling, b represents the percent of glucose yielding labeled glutamate, and c represents the percent of isotopic dilution by endogenous unlabeled glutamate (natural abundance of glutamate C4 13C-specific enrichment is 1.1%). SELac1, SEGlc1, and SEGlu1 represent lactate C3, glucose C1, and glutamate C4 13C-specific enrichments, respectively, in condition 1. In the same way, when neurons are incubated in a medium containing [1-13C]glucose and lactate (condition 2), glutamate 13C-specific enrichment can be determined as follows:
and
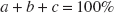
where a, b, and c are strictly the same in both conditions because of the same relative concentrations used in conditions 1 and 2.
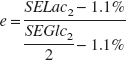
The percent of glucose yielding lactate is determined as follows:
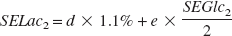
where d represents the percent of isotopic dilution by unlabeled lactate (natural abundance is therefore 1.1%), e represents the percent of [1-13C]glucose yielding [3-13C]lactate, SELac2 and SEGlc2 represent lactate C3 and glucose C1 13C-specific enrichments, respectively, in condition 2. Note that

Then, α1, α2, α3, and α4 can be determined as follows:
α1 + α2 + α3 + α4 = 100% α1 + α2 =b α2 =e α2 + α3 =a
Determination of protein, glucose and lactate contents
Protein content was determined according to the procedure of Lowry et al. (Lowry et al., 1951) using bovine serum albumin as standard.
Glucose and lactate concentrations in the medium at 0 and 4 hours were determined by enzymatic assays (Sigma, kit 510-A and 826-A, respectively). No statistically significant differences were found between the beginning and the end of the incubation (data not shown), indicating relatively low rates of glucose utilization and lactate production in these cultures, a result consistent with previous observations (Schousboe et al., 1997).
Statistical analysis
Data are represented as the mean ± SD. All data were analyzed by analysis of variance followed by the Bonferroni test.
RESULTS
Carbon-13 label incorporation into neuronal metabolites
Neuronal cultures were incubated for 4 hours in a medium containing either 5.5-mmol/L glucose and 1.1, 5.5, or 11-mmol/L [3-13C]lactate, or 5.5-mmol/L [1-13C]glucose and 1.1, 5.5, or 11-mmol/L lactate. These two labeled substrates were chosen because compound labeling patterns are similar when either [1-13C]glucose or [3-13C]lactate is used as labeled substrate. Indeed, [1-13C]glucose gives [3-13C]pyruvate at the end of glycolysis, and [3-13C]lactate also yields [3-13C]pyruvate via the LDH reaction. Then, pyruvate enters the TCA cycle through the PDH-catalyzed reaction and [2-13C]acetyl-coenzyme A thus formed will give [4-13C]citrate. Within the first TCA cycle turn, [4-13C]α-ketoglutarate and [2-13C] or [3-13C]oxaloacetate are obtained. Therefore, after the first TCA cycle, [4-13C]glutamate is formed. 13C-NMR spectra of the perchloric acid cell extracts are shown in Fig. 2. These spectra were normalized according to both protein content and ethylene glycol peak as internal reference. Spectra A, C, and E contain major signals from 13C-enriched metabolites through [3-13C]lactate metabolism whereas spectra B, D, and F show major signals from 13C-enriched compounds through [1-13C]glucose metabolism. When lactate is 13C-enriched, glutamate peak intensities (27.8, 34.16, and 55.35 ppm) increase with lactate concentration whereas they decrease when glucose is the labeled substrate. Indeed, no more glutamate signals can be observed on spectra D and F. Moreover, when lactate is 13C-enriched, glutamate C3 resonance appears as a quintuplet and glutamate C2 and C4 resonances appear as triplets, indicating that [2,3,4-13C]glutamate and [2,3-13C] and [3,4-13C] glutamate are formed, respectively, and thus that the labeled substrate is further metabolized in the TCA cycle. No glutamine is detected on the spectra, indicating that contribution of the few astrocytes present in the culture is negligible.
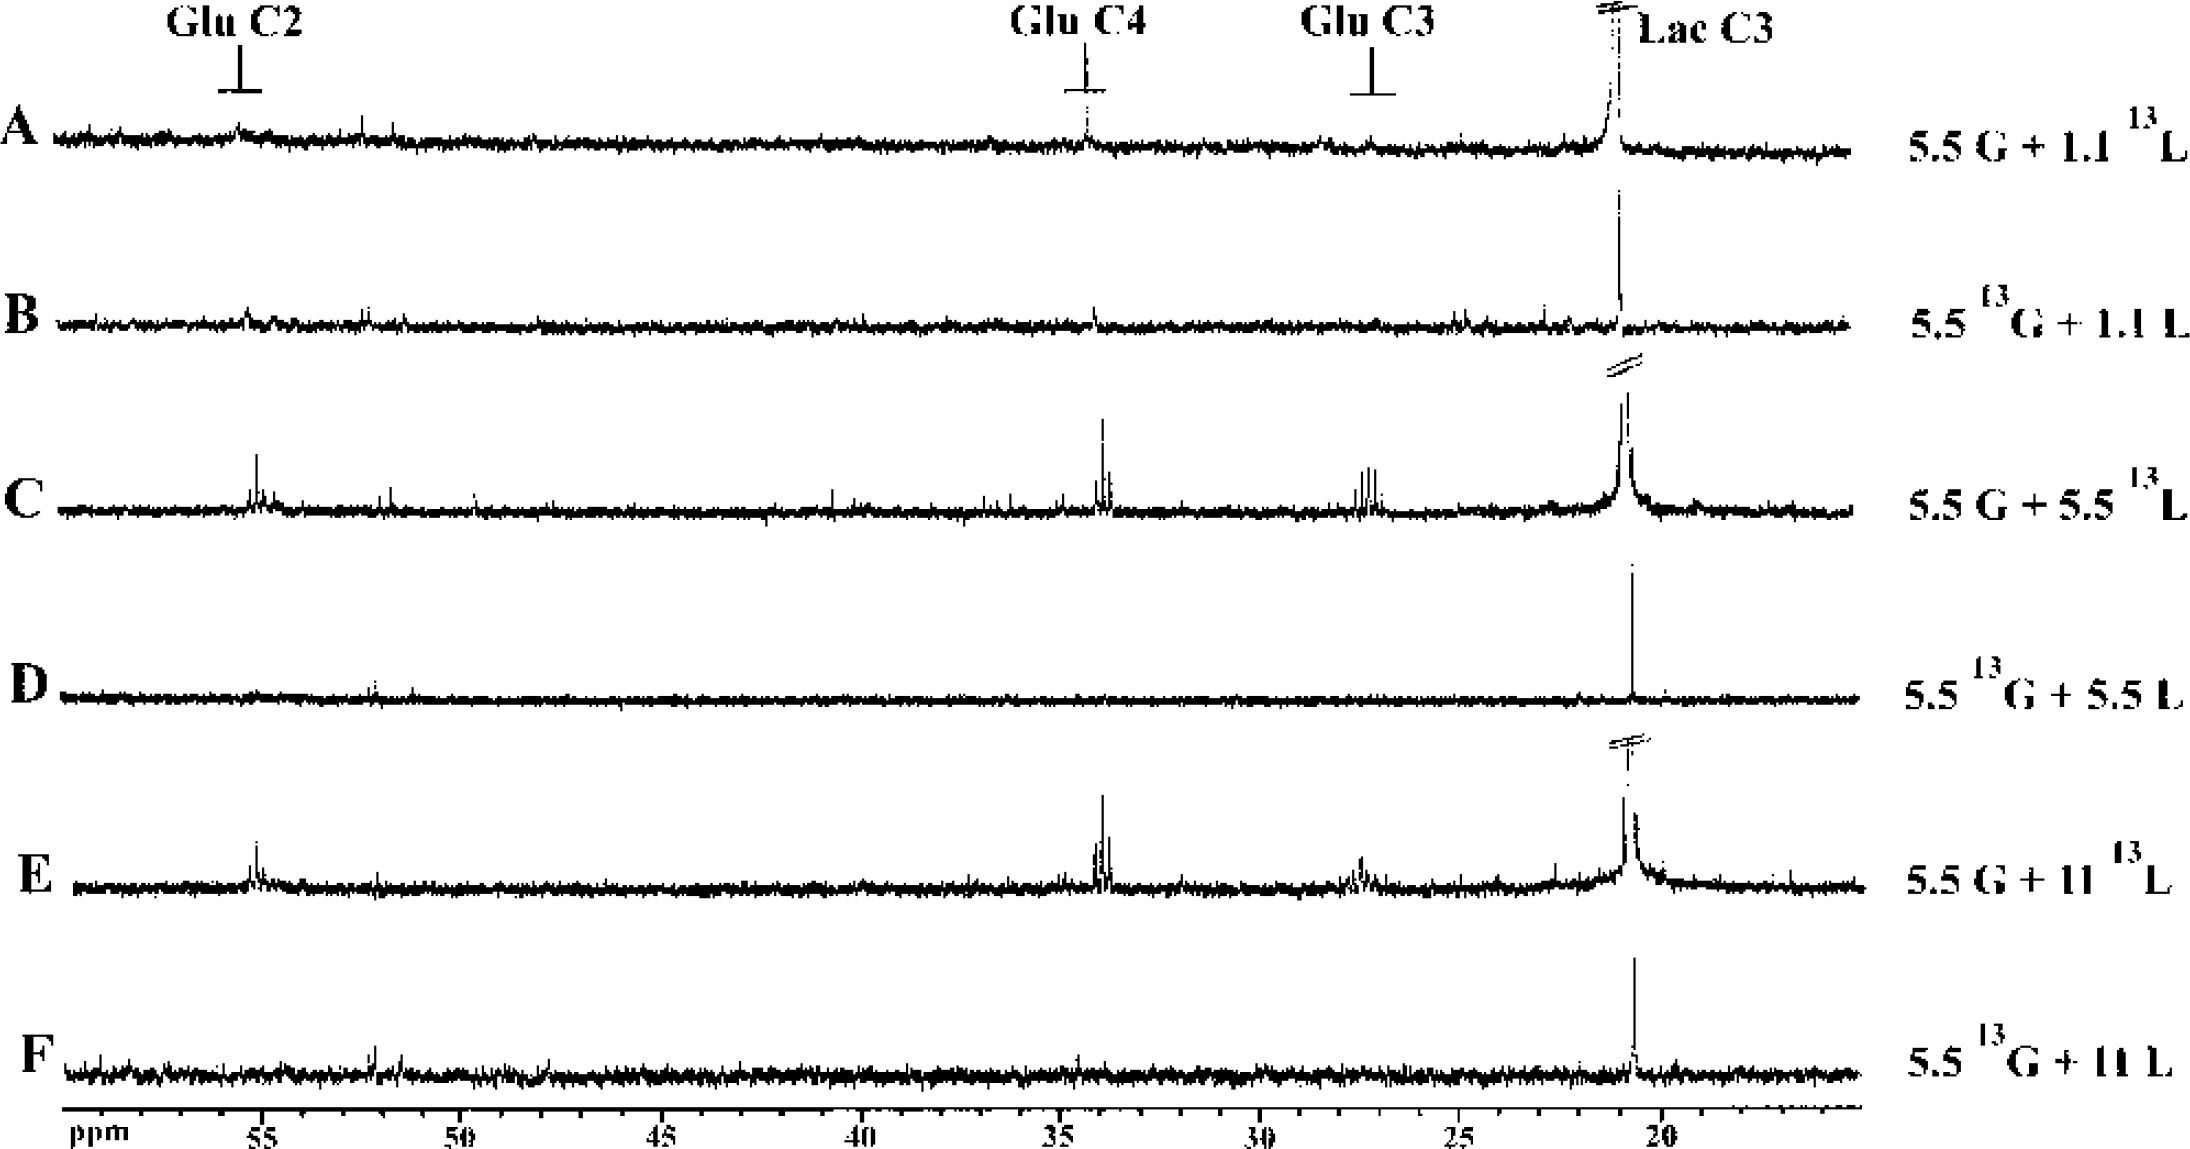
13C-NMR spectra of perchloric acid extracts after 4 hours of incubation of primary neuronal cultures in a medium containing 5.5 mmol/L glucose and 1.1, 5.5, or 11-mmol/L [3-13C]lactate (
Glutamate and lactate 13C-specific enrichments were determined in the different conditions by the ratio of the triplet area measured at 2.32 ppm on the proton-observed carbon-editing spectrum (a 1H-NMR spectrum where only protons bound to 13C are observed) (Fig. 3A and Fig. 3C) and the triplet area measured also at 2.32 ppm on the spin-echo spectrum (a 1H-NMR spectrum where all protons, thus bound to 12C and 13C, are observed) (Fig. 3B and Fig. 3D). Glucose 13C-specific enrichments were determined using the heteronuclear spin-coupling patterns on 1H-NMR spectra. Quantitative data are presented in Table 1 and 2. In the cellular extract (Table 1), after 4 hours of incubation in a medium containing 5.5-mmol/L [1-13C]glucose and 1.1, 5.5, or 11-mmol/L lactate, glucose C1 13C-specific enrichment is around 93% and lactate C3 13C-specific enrichment decreases from 6% to 2%. When the medium contains 5.5-mmol/L glucose and 1.1, 5.5, or 11-mmol/L [3-13C]lactate, glucose C1 13C-specific enrichment is around the natural abundance and lactate C3 13C-specific enrichment increases from 82% to 90% with lactate concentration. In the medium (Table 2), glucose C1 and lactate C3 13C-specific enrichments reflect those found in cellular extracts.
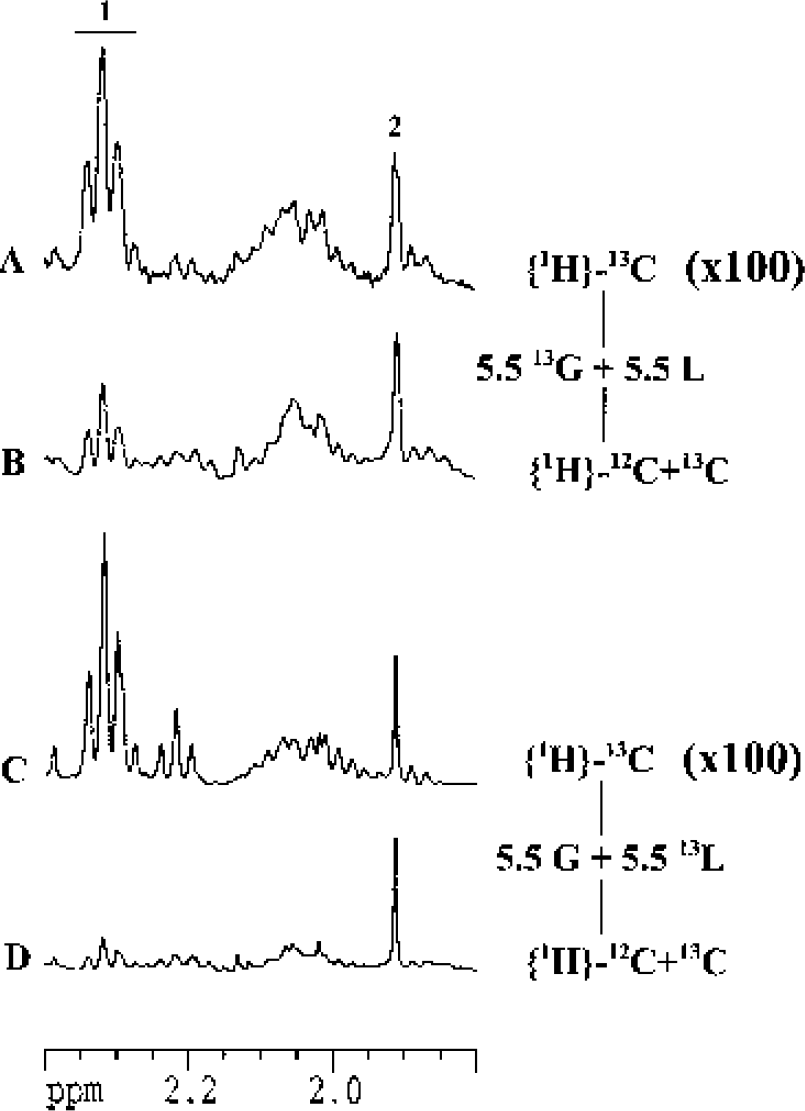
Determination of glutamate 13C-specific enrichment. Spectra were obtained after 4 hours of incubation of primary neuronal cultures in a medium containing 5.5-mmol/L [1-13C]glucose and 5.5-mmol/L lactate (
Glucose C1, lactate C3 and glutamate C4 13C-specific enrichments in perchloric acid extracts
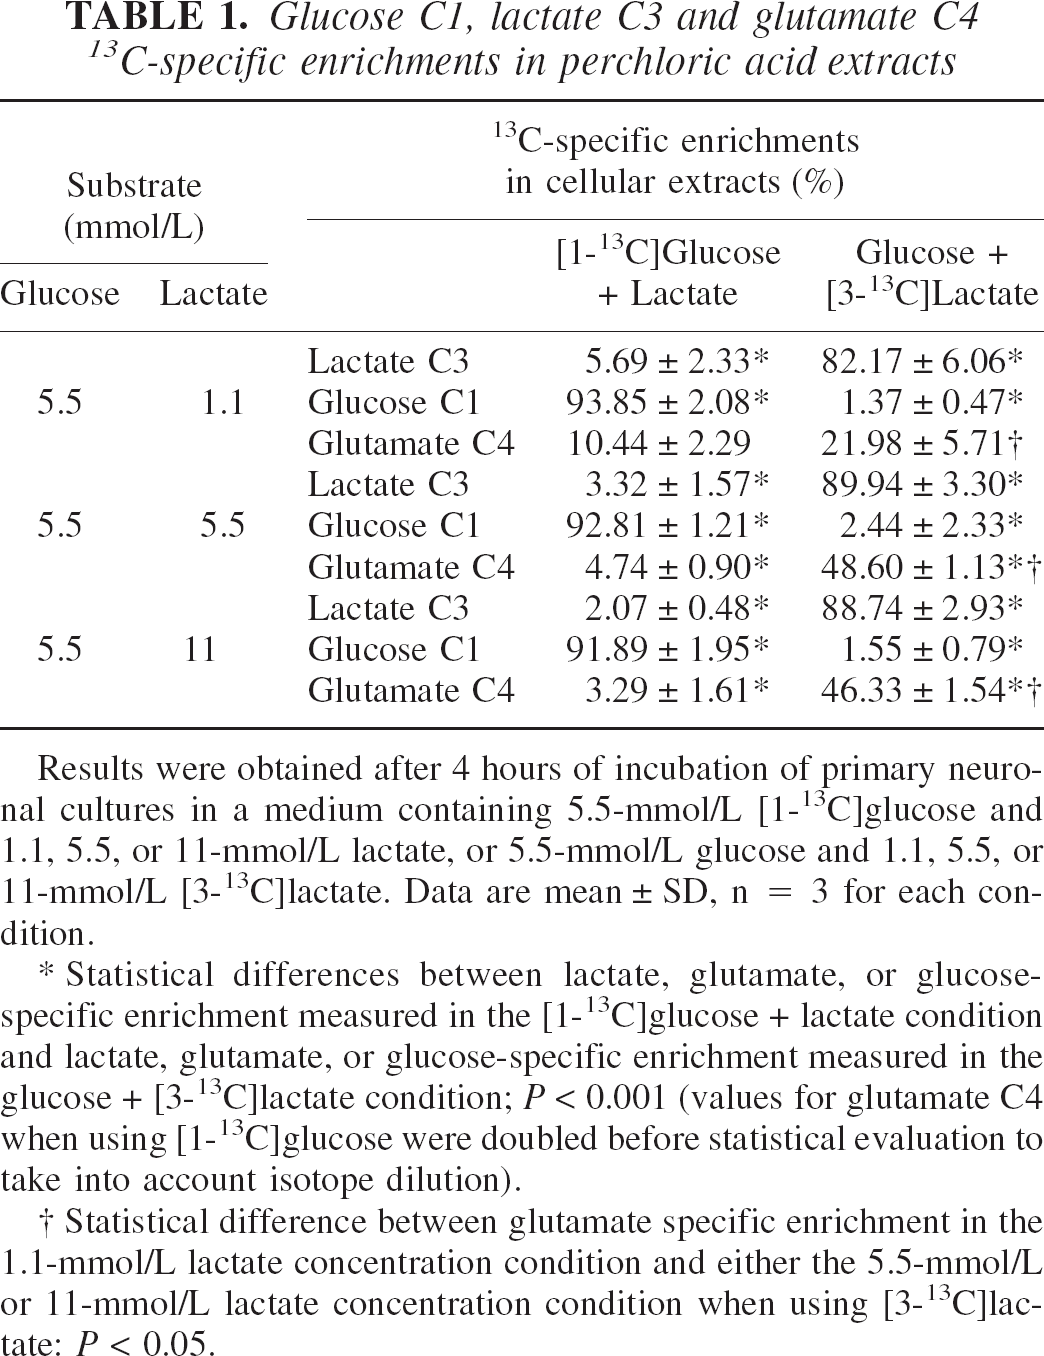
Results were obtained after 4 hours of incubation of primary neuro-nal cultures in a medium containing 5.5-mmol/L [1−13C]glucose and 1.1, 5.5, or 11-mmol/L lactate, or 5.5-mmol/L glucose and 1.1, 5.5, or 11-mmol/L [3−13C]lactate. Data are mean ± SD, n = 3 for each condition.
Statistical differences between lactate, glutamate, or glucose-specific enrichment measured in the [1-13C]glucose + lactate condition and lactate, glutamate, or glucose-specific enrichment measured in the glucose + [3−13C]lactate condition; P < 0.001 (values for glutamate C4 when using [1−13C]glucose were doubled before statistical evaluation to take into account isotope dilution).
Statistical difference between glutamate specific enrichment in the 1.1-mmol/L lactate concentration condition and either the 5.5-mmol/L or 11-mmol/L lactate concentration condition when using [3−13C]lactate: P < 0.05.
Lactate C3 and glucose C1 13 C-specific enrichments in the medium
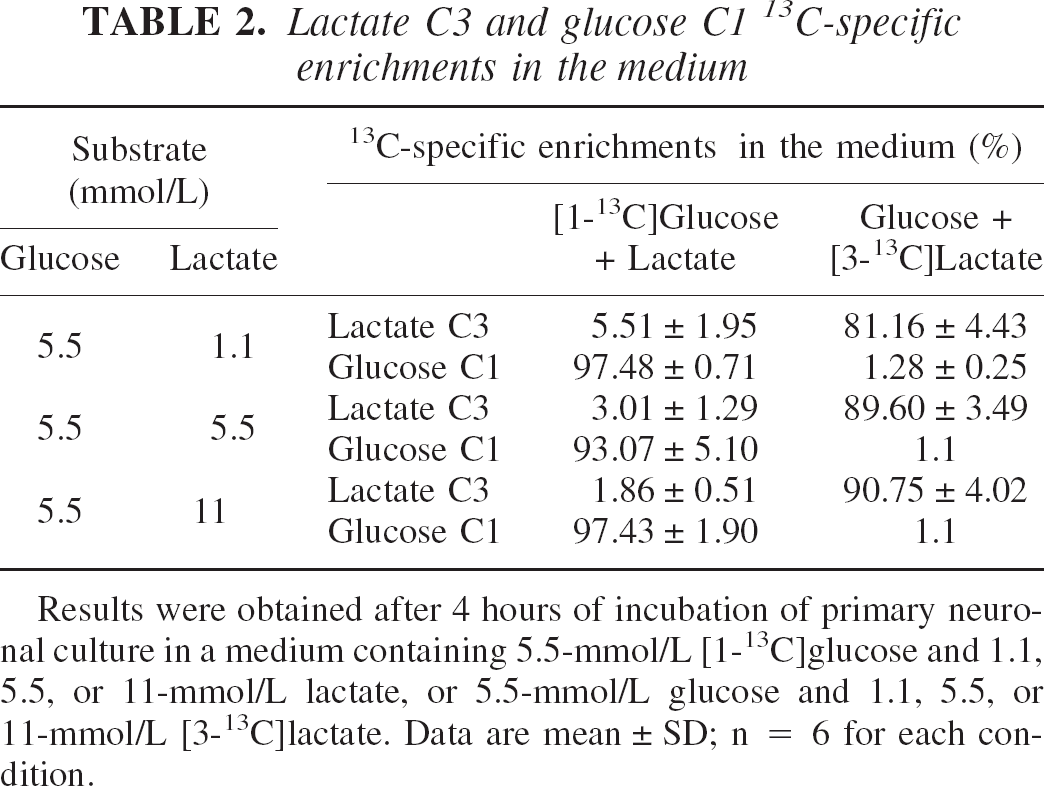
Results were obtained after 4 hours of incubation of primary neuronal culture in a medium containing 5.5-mmol/L [1-13C]glucose and 1.1, 5.5, or 11-mmol/L lactate, or 5.5-mmol/L glucose and 1.1, 5.5, or 11-mmol/L [3-13C]lactate. Data are mean ± SD; n = 6 for each condition.
Glutamate C4 13C-specific enrichment increases with lactate concentration when lactate is the labeled substrate (from 22% to 49% and 46% for [3-13C]lactate concentration from 1.1 to 5.5 and 11 mmol/L, respectively) whereas it decreases when glucose is the labeled substrate (from 10% to 5% and 3%, respectively). For the 1.1-mmol/L lactate condition, glutamate C4-specific enrichments are similar (10.44 × 2 = 20.88% with [1-13C]glucose compared with 21.98% with [3-13C]-lactate). Indeed, 1 mole of [1-13C]glucose gives 1 mole of [3-13C]pyruvate and 1 mole of unlabeled pyruvate, yielding an isotopic dilution of 50%, whereas 1 mole of [3-13C]lactate gives 1 mole of [3-13C]pyruvate. However, notice that in this condition, the glucose concentration is five times greater than the lactate concentration. In the 5.5 and 11-mmol/L lactate conditions, glutamate 13C-specific enrichments are always higher when lactate is the labeled substrate than when it is glucose. No statistical difference for the glutamate C4 13C-specific enrichments was observed between the 5.5 and 11-mmol/L lactate conditions.
Relative contribution of glucose and lactate to neuronal oxidative metabolism
Using the specific enrichment values of glutamate, lactate, and glucose, we set out to determine the relative contribution of both glucose and lactate to neuronal oxidative metabolism. The major labeled substrate observed in this study is glutamate. Because this metabolite is in equilibrium with the TCA cycle component α-ketoglutarate, the relative contribution of glucose and lactate to neuronal oxidative metabolism could be determined from the relative contribution of each substrate to glutamate labeling. Fig. 1 represents the three major pathways, under our experimental conditions, which are involved in glutamate labeling; from exogenous glucose (α1), from exogenous lactate (α3), and from glycolytic lactate (α2) (i.e., lactate synthesized from exogenous glucose). A fourth pathway represents the isotopic dilution that would be caused by endogenous glutamate pools, present in the cytoplasm and mitochondria as well as in synaptic vesicles (α4).
Table 3 shows values indicating the relative contribution of glucose and lactate to neuronal oxidative metabolism in the different incubation conditions (1.1, 5.5, and 11-mmol/L lactate). α4 represents the glutamate pool, which is already present in the neurons, whereas α1, α2, and α3 represent the three major pathways for glutamate labeling and thus the three pathways for glucose and lactate utilization by the neuron for its oxidative metabolism. To compare the contribution of the different pathways to neuronal oxidative metabolism, percents can be calculated from the values obtained for α1, α2 and α3 (α1 + α2 + α3=100%) (Table 3, numbers in brackets). When lactate concentration is 1.1 mmol/L, the contribution to neuronal oxidative metabolism of exogenous glucose and exogenous lactate seems to be equivalent because no statistical difference can be observed. When lactate concentration rises from 1.1 mmol/L to 5.5 and 11 mmol/L, then α3 strongly increases from 47% to 90% and 93%, respectively. In these last two conditions, α3 represents the major pathway for neuronal oxidative metabolism. In parallel, when lactate concentration rises from 1.1 mmol/L to 5.5 and 11 mmol/L, then (α1 + α2) decreases from 53% to 10% and 7%, respectively, thus demonstrating that glucose contribution to neuronal oxidative metabolism is reduced compared to lactate. α2 also decreases from 30% to 9% and 4%, when lactate concentration increases from 1.1 mmol/L to 5.5 and 11 mmol/L, indicating that glycolytic lactate synthesis decreases when lactate concentration increases.
Relative contribution of glucose and lactate to neuronal oxidative metabolism
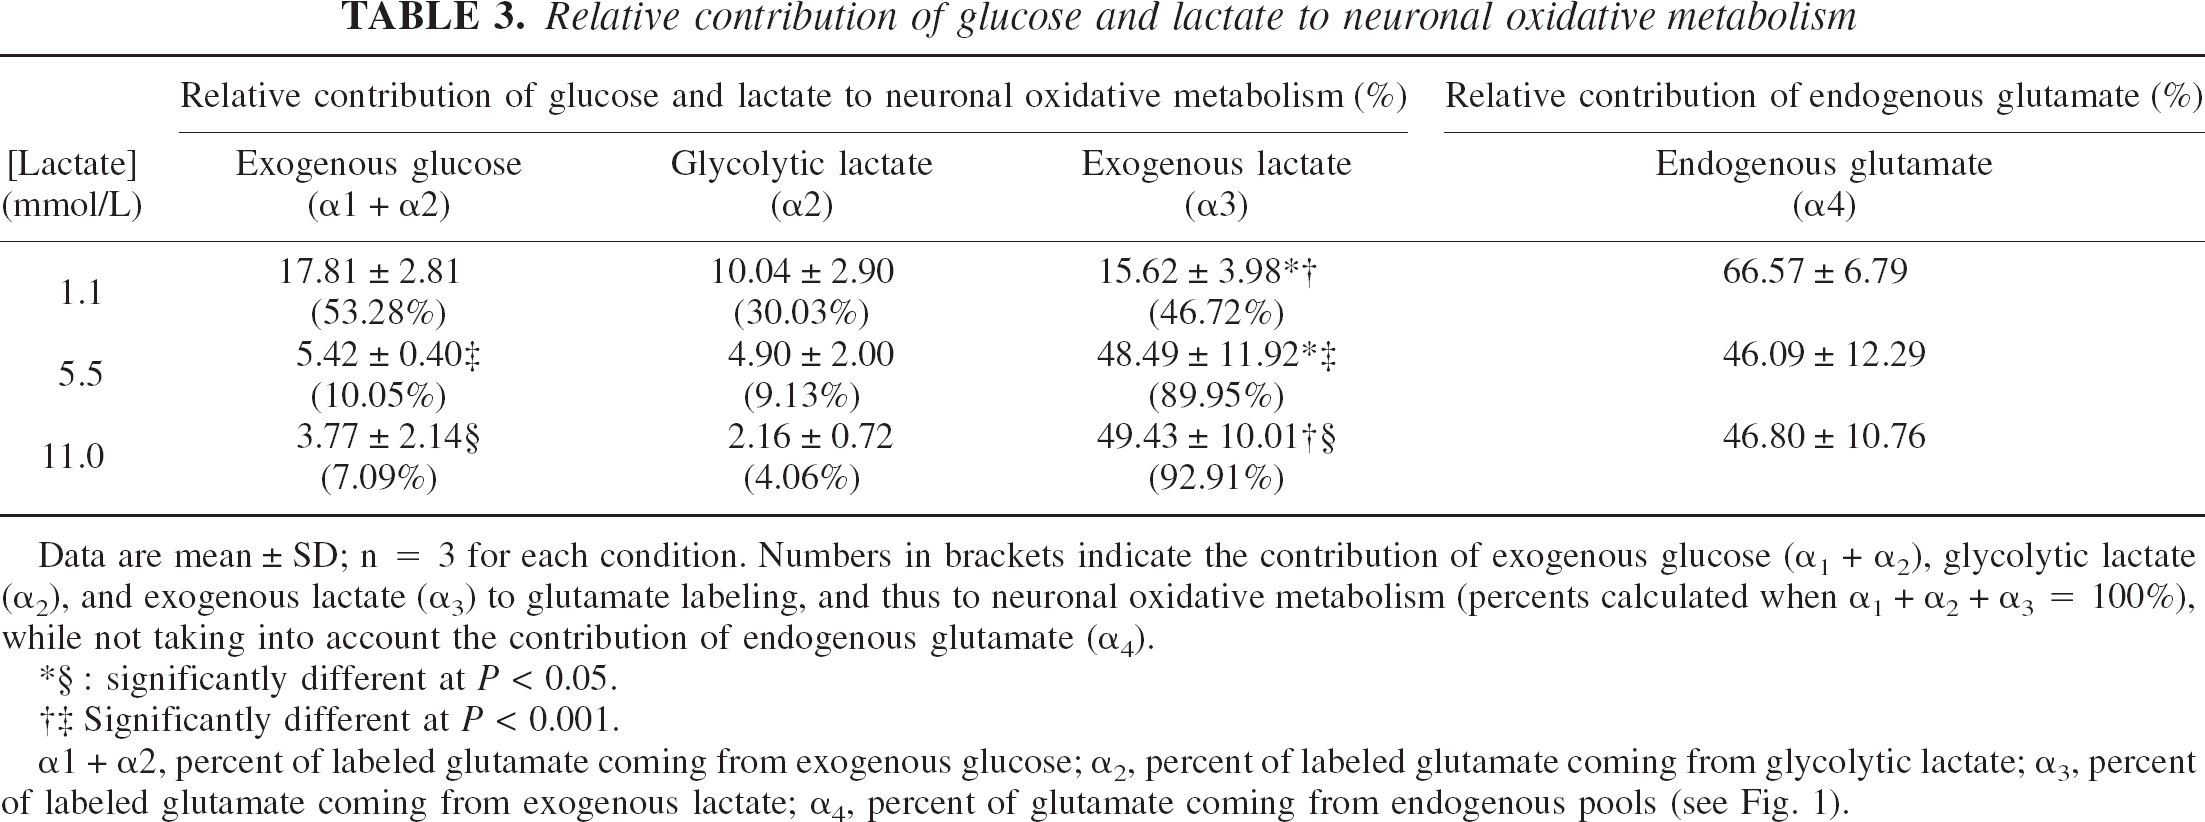
Data are mean ± SD; n = 3 for each condition. Numbers in brackets indicate the contribution of exogenous glucose (α1 + α2), glycolytic lactate (α2), and exogenous lactate (α3) to glutamate labeling, and thus to neuronal oxidative metabolism (percents calculated when α1 + α2 + α3 = 100%), while not taking into account the contribution of endogenous glutamate (α4).
significantly different at P < 0.05.
Significantly different at P < 0.001.
α1 + α2, percent of labeled glutamate coming from exogenous glucose; α2, percent of labeled glutamate coming from glycolytic lactate; α3, percent of labeled glutamate coming from exogenous lactate; α4, percent of glutamate coming from endogenous pools (see Fig. 1).
DISCUSSION
Numerous studies on glucose and lactate metabolism in neuronal cultures using 13C-labeled substrates and NMR spectroscopy have been conducted in the past few years, many of them suggesting that lactate could represent a valuable oxidative substrate for neurons (Aurelli et al., 1997; Martin et al., 1993; Merle et al., 1996; Schousboe et al., 1997; Sonnewald et al., 1991; Waagepetersen et al., 1998a; Waagepetersen et al., 2000). However, none could clearly and quantitatively determine what would be the proportion of each substrate used oxidatively when both substrates are present, and in varying proportions. In the present study, cells were incubated in presence of both glucose and lactate, each metabolite being alternatively labeled as [1-13C]glucose or [3-13C]lactate, thus permitting direct comparison of metabolism from both substrates under identical conditions.
A first important consideration is the absence of 13C-enriched glutamine detected with either [1-13C]glucose or [3-13C]lactate as enriched substrate in our neuronal cultures. Glutamine synthetase, the enzyme necessary for glutamine synthesis, is selectively expressed in astrocytes (Norenberg and Martinez-Hernandez, 1979) and 13C-labeled glutamine formed from either labeled glucose or lactate is readily detected in cultured astrocytes (Leo et al., 1993; Waagepetersen et al., 1998a). The lack of label appearing in glutamine indicates that the number of astrocytes present in our neuronal cultures must be small, as confirmed by immunocytochemical stainings, and thus that essentially all metabolic observations can be considered arising from neurons. In addition, no difference between glutamate carbon 2 and 3 were observed, indicating that no carboxylation of pyruvate could be detected in neuronal cultures, as previously described (Waagepetersen et al., 2001). These results are also in good agreement with in vivo results, indicating that lactate is metabolized in the brain in a pyruvate carboxylase-deprived compartment, most likely neurons (Bouzier et al., 2000).
One major finding in this study is that glutamate C4 13C-specific enrichment is much higher when lactate is the labeled substrate compared to glucose, both when the two substrates are at equimolar concentration (5.5 mmol/L) or when they are at equicaloric concentration (5.5 and 11 mmol/L for glucose and lactate, respectively). Even when lactate is present at a concentration five times lower than glucose concentration (1.1 versus 5.5 mmol/L), glutamate C4 13C-specific enrichments are equivalent (when taking into account isotopic dilution). These results suggest that lactate, even when available at moderate concentrations, has preferential access to glutamate labeling in neurons as compared with glucose. Moreover, as the concentration of lactate is increased, a decrease in label incorporation from [1-13C]glucose into glutamate C4 position is observed, indicating a possible competition between lactate and glucose. Previous NMR studies on cerebral cortical neurons in culture have shown that 13C from lactate is readily incorporated into amino acids, and in particular into glutamate (Waagepetersen et al., 1998b), whereas compared with glucose, lactate was considered to be at least equivalent in terms of TCA cycle access and glutamate labeling (Waagepetersen et al., 1998a). One important difference however compared to the present study is that each labeled substrate was tested separately, in the absence of the other substrate. In such case, conditions for each substrate are not entirely equivalent and might lead to biased estimation of substrate use. Nevertheless, previous results are generally consistent with the concept that lactate has easy access to the glutamate pool, while our data further extend this observation by showing a predominant use of lactate over glucose under conditions where both substrates are available, a condition more relevant to the physiological situation. Since glutamate is in equilibrium with the TCA cycle component α-ketoglutarate, the glutamate C4 13C-specific enrichment directly reflects neuronal oxidative metabolism (Fitzpatrick et al., 1990; Mason et al., 1992). Thus, on this basis, it can be argued that lactate might represent a better oxidative substrate than glucose for neurons, at least in vitro. This conclusion is consistent with numerous other studies performed by measuring CO2 production on synaptic terminals (McKenna et al., 1993, 1994, 1998), excised sympathetic ganglia (Larrabee, 1996), brain slices (Fernandez and Medina, 1986; Ide et al., 1969), and cultured neurons (McKenna et al., 2001; Tabernero et al., 1996; Vicario et al., 1991), all of which have shown preferential oxidation of lactate over glucose.
Recently, extracellular concentrations of glucose and lactate have been determined in both rat and human brain cortex (Abi-Saab et al., 2002). Under basal conditions, glucose concentrations were 1.66 and 0.82 mmol/L whereas lactate concentrations were 2.70 and 1.38 mmol/L in rats and humans, respectively, indicating that intracerebral lactate levels are significantly higher than glucose levels in both species. Upon activation, the extracellular glucose concentration was shown to decrease while lactate levels transiently increase by 70% or more depending on the brain region studied (Fellows et al., 1993; Frahm et al., 1996; Prichard et al., 1991; Sappey-Marinier et al., 1992). In such situations, neurons would be exposed to even more favorable lactate-to-glucose ratios, thus putatively enhancing the contribution of lactate to neuronal oxidative metabolism. Parallel measurement of lactate, glucose and oxygen in the rat hippocampus upon electrical activation suggests that it is indeed the case during repeated stimulations (Hu and Wilson, 1997). Interestingly, it was recently shown that neurons predominantly express the monocarboxylate transporter MCT2 (Pierre et al., 2002). This transporter has a Km for lactate at pH 7.0 of 0.74 mmol/L (Bröer et al., 1999), a value close to the range of measured extracellular lactate concentrations in the brain. As lactate enters into neurons via MCT2 and accumulates, its conversion to pyruvate by lactate dehydrogenase 1, an enzyme shown to be enriched in neurons (Bittar et al. 1996), can occur. Because this enzyme is working near equilibrium, as the lactate concentration becomes much higher than the intracellular pyruvate concentration, the important extracellular lactate concentration will drive the lactate dehydrogenase reaction in the direction lactate to pyruvate. Lactate is then converted to pyruvate and yields NADH. Enhanced NADH production by this reaction leads to increased cytosolic NADH/NAD+ ratio, a situation that inhibits glycolysis (and thus pyruvate production from glucose). Such a phenomenon was previously observed in cultured neurons and described as the “redox switch” (Cruz et al., 2001). It could at least partly explain why we observed a decrease in glutamate C4 13C-enrichment from labeled glucose as lactate concentrations were increased.
From the specific enrichments of glutamate, lactate, and glucose, it was possible to estimate the relative contribution of each pathway and source to labeled glutamate in neurons for different lactate concentrations. Values obtained for α3 (47%, 90% and 93% for the 1.1, 5.5, and 11 mmol/L lactate concentrations, respectively;Table 3) clearly indicate that lactate represents an important substrate for neuronal oxidative metabolism. One other interesting result that emerged from this evaluation is the fact that even at a low concentration of lactate (1.1 mmol/L), when the participation of glucose to oxidative metabolism should be maximal, a sizeable fraction of glycolytically derived pyruvate is first metabolized into lactate and subsequently converted back to pyruvate to enter the TCA cycle (it corresponds to α2 in Fig. 1). This surprising finding not only emphasizes the fact that neurons will reuse any lactate available, but that there is a need for neurons to process glucose glycolytically and produce lactate in parallel with lactate utilization. Previous evidence has been provided that glycolysis in neurons is essential to maintain synaptic function (Li et al., 2000). Thus, one advantage for the neuron to already have lactate available would be that as it uses more lactate for oxidative metabolism, it could spare glucose for fast generation of cytosolic ATP from glycolysis to be used for more specific and restricted functions; e.g., by the Na+,K+ ATPase to reestablish ion gradients (Silver et al., 1997) or to replenish synaptic vesicles with neurotransmitters like glutamate (Ikemoto et al., 2003). Such compartmentation of glycolysis and TCA cycle activity, leading to concomitant production and utilization of lactate forming two separate pools, has been documented in other cell types (Bouzier et al., 1998; Peuhkurinen et al., 1983).
In conclusion, our data show that lactate constitutes a preferential oxidative substrate over glucose in neurons, at least in vitro. There is, however, no indication that lactate can replace glucose and become the unique energy substrate for neurons. Similarly, our results do not preclude glucose utilization by neurons, which clearly is an essential energy substrate to support neuronal functions. Rather, our data suggest that the use of lactate as a preferential oxidative substrate might allow neurons to concomitantly favor a glycolytic use of glucose for specific purposes related to the maintenance of synaptic transmission.
Footnotes
Abbreviations used:
Endnote
As this manuscript was submitted, two reports appeared that support the main conclusion of the present article. First, Sokoloff and coworkers reported, using a different methodological approach based on measurement of CO2 production, a kinetic preference in cultured neurons for oxidation of extracellular lactate over pyruvate/lactate produced by glycolysis (Itoh et al., 2003). Moreover, they showed that it was not the case for cultured astrocytes, that displayed a much more important glycolytic profile. Finally, Amiel and colleagues used positron emission tomography to provide evidence that lactate is a preferred energy substrate for the human brain (Smith et al., 2003). This observation strengthens the view that our results obtained in vitro can be extended to the adult brain.
Acknowledgments
The authors thank Michel Merle for helpful discussions and Véronique Bouchaud for technical assistance.