
Abstract
Glucose is the primary energy substrate for the adult mammalian brain. However, lactate produced within the brain might be able to serve this purpose in neurons. In the present study, the relative significance of glucose and lactate as substrates to maintain neurotransmitter homeostasis was investigated. Cultured cerebellar (primarily glutamatergic) neurons were superfused in medium containing [U-13C]glucose (2.5 mmol/L) and lactate (1 or 5 mmol/L) or glucose (2.5 mmol/L) and [U-13C]lactate (1 mmol/L), and exposed to pulses of N-methyl-D-aspartate (300 μmol/L), leading to synaptic activity including vesicular release. The incorporation of 13C label into intracellular lactate, alanine, succinate, glutamate, and aspartate was determined by mass spectrometry. The metabolism of [U-13C]lactate under non-depolarizing conditions was high compared with that of [U-13C]glucose; however, it decreased significantly during induced depolarization. In contrast, at both concentrations of extracellular lactate, the metabolism of [U-13C]glucose was increased during neuronal depolarization. The role of glucose and lactate as energy substrates during vesicular release as well as transporter-mediated influx and efflux of glutamate was examined using preloaded D-[3H]aspartate as a glutamate tracer and DL-threo-β-benzyloxyaspartate to inhibit glutamate transporters. The results suggest that glucose is essential to prevent depolarization-induced reversal of the transporter (efflux), whereas vesicular release was unaffected by the choice of substrate. In conclusion, the present study shows that glucose is a necessary substrate to maintain neurotransmitter homeostasis during synaptic activity and that synaptic activity does not induce an upregulation of lactate metabolism in glutamatergic neurons.
Introduction
The astrocyte-neuron lactate shuttle hypothesis proposed by Pellerin and Magistretti (1994) has led to a discussion of whether lactate or glucose is the preferred neuronal substrate during synaptic activity (e.g., Vannucci and Simpson, 2001; Hertz, 2004). According to this, uptake of released neurotransmitter glutamate into astrocytes leads to increased glycolysis and production of lactate, which is subsequently exported to neurons (Bittar et al, 1996; Pellerin et al, 1998). Indeed, neurons in culture as well as other brain tissue preparations are able to maintain functional activity using lactate, other monocarboxylates, and certain amino acids as energy substrates (Schurr et al, 1988; Hertz et al, 1988; Brown et al, 2001; Waagepetersen et al, 2005). In addition, lactate has been proposed to function as an energy substrate for neurons recovering after glucose deprivation or a hypoxic insult (Fowler, 1993; Schurr et al, 1997a, b , c ; Cater et al, 2001). However, much remains controversial and additional experiments seem pertinent to elucidate whether neurons in fact prefer lactate over glucose during synaptic activity (McKenna et al, 2001; Chih et al, 2001a). The present study represents an attempt to shed further light on this important question.
Cultured cerebellar neurons were used to investigate the role of glucose and lactate during resting conditions as well as during neuronal activity. The latter was induced by repetitively depolarizing the neurons using pulses of N-methyl-D-aspartate (NMDA; 300 μmol/L) together with a slightly elevated potassium concentration (15 mmol/L). This depolarizing signal results in vesicular release of glutamate as described previously (Bak et al, 2003, 2004). Because of the presence of energy-dependent glutamate transport in glutamatergic neurons, the energy substrate may influence the efficacy of the glutamate transporters (Drejer et al, 1982; Nicholls and Attwell, 1990; Gundersen et al, 1993; Danbolt, 2001; Schousboe et al, 2004). Ultimately, energy failure results in release via reversal of the transporter (Nicholls and Attwell, 1990; Allen et al, 2005). Energy deprivation may also affect vesicular release since glutamate uptake into the vesicles is energy dependent as well (Attwell and Laughlin, 2001). Conceivably, glucose and lactate may contribute differently to maintain these processes. The release of glutamate was monitored by the use of the nonmetabolizable glutamate analog D-[3H]aspartate, which labels the vesicular as well as the cytoplasmic glutamate pools (Belhage et al, 1992; Cousin and Nicholls, 1997; Fleck et al, 2001). To examine a possible contribution of the transporters to the release of D-[3H]aspartate, the nontransportable glutamate transport inhibitor DL-threo-β-benzyloxyaspartate (TBOA) was employed (Shimamoto et al, 1998; Waagepetersen et al, 2001; Bak et al, 2003, 2004). To assess the relative importance of glucose and lactate as substrates for neuronal metabolism, the cultures were superfused in media containing either [U-13C]glucose (2.5 mmol/L) and lactate (1 or 5mmol/L) or [U-13C]lactate (1 mmol/L) and glucose (2.5 mmol/L). Thus, at all times the cells were provided with both glucose and lactate, making it possible to probe the metabolism of glucose or lactate, respectively, during identical experimental conditions by alternating the labeling of the substrates. The metabolism was investigated by determining the labeling of intracellular metabolites using mass spectrometry. The two different lactate concentrations were chosen to mimic the physiologic concentration (Abi-Saab et al, 2002) as well as that reflecting the glucose concentration of 2.5 mmol/L.
Materials and methods
Seven-day-old mice were obtained from either the animal facility at the Department of Pharmacology and Pharmacotherapy, The Danish University of Pharmaceutical Sciences, or from Taconic M&B (Ry, Denmark). Plastic tissue culture flasks and dishes were purchased from NUNC A/S (Roskilde, Denmark), fetal calf serum from SeraLab Ltd (Sussex, UK), and culture medium from GibcoBRL Life Technologies A/S (Roskilde, Denmark).
Poly-D-lysine (MW> 300,000), glycine, and NMDA were obtained from Sigma Chemical Co. (St Louis, MO, USA). Penicillin was from Leo (Ballerup, Denmark). 13C-labeled compounds were from Cambridge Isotopes Laboratories Inc. (Woburn, MA, USA). D-[3H]Aspartate (474 MBq/M) was from Amersham Bioscience (Horsholm, Denmark) and TBOA was obtained from Tocris (Ellisville, MO, USA). The Phenomenex EZ:faast liquid chromatography-mass spectrometry (LC-MS) kit was used for amino-acid analysis. Columns used for high-performance liquid chromatography (HPLC) were from Phenomenex (Torrance, CA, USA) and Varian (Palo Alto, CA, USA). All other chemicals used were of the purest grade available from regular commercial sources.
Cell Cultures
Cerebellar neurons were isolated and cultured from seven-day-old mice essentially as described by Schousboe et al (1989). After dissection of cerebellum, the tissue was exposed to a mild trypsinization (0.25 mg/mL trypsin, 15 mins, 37°C) followed by trituration in a DNase solution (75 IU/mL) containing a trypsin inhibitor (0.53 mg/mL) from soybeans. The cells were suspended in a slightly modified Dulbecco's medium (Hertz et al, 1982) containing 24.5 mmol/L KCl, 12 mmol/L glucose, 7 μmol/L p-aminobenzoate, 50 μmol/L kainate, and 10% fetal calf serum, and cultured in poly-D-lysine-coated 80 cm2 culture flasks (15 mL/flask, 3.0 × 10⁶ cells/mL) or 35 mm Petri dishes (2 mL/dish, 2.75 × 10⁶ cells/mL). The medium of the individual cultures was supplemented twice with an aliquot of glucose (1,200 mmol/L) to reach a minimum concentration of 12 μmol/L. Cytosine arabinoside was added to a final concentration of 20 μmol/L after 48 h in culture. The treatment with cytosine arabinoside and kainate prevents proliferation of astrocytes and inhibits GABAergic cell function, respectively (Drejer and Schousboe, 1989; Schousboe et al, 1989; Sonnewald et al, 2004). The cells were cultured for 7 to 8 days, at which point the cultures consist of 80% to 90% cells with glutamatergic characteristics.
Superfusion Experiments
For metabolic studies using 13C-labeled substrates, cultures grown in 80 cm2 flasks were utilized. The medium was replaced with an N-2-hydroxyethyl-piperazine-N′-2-ethanesulfonic acid (Hepes)-buffered, Mg2+-free saline solution (10 mmol/L Hepes at pH 7.4, 5 mmol/L KCl, 135 mmol/L NaCl, 1.5 mmol/L CaCl2, 2.5 mmol/L glucose, and 1 or 5 mmol/L lactate, as described below). Subsequently, the cultures were placed in a superfusion system (Drejer et al, 1987). The cell layer was covered with a nylon mesh (80 mm) and the culture flasks were superfused (5 mL/min) with the Hepes-buffered saline. The superfusion medium could be repetitively alternated to a similar medium containing NMDA (300 mmol/L) and 15 mmol/L potassium (with an isomolar reduction in sodium). Using this superfusion system, the effect of repetitive depolarization on intermediary metabolism in neuronal cultures could be investigated in the presence of either [U-13C]glucose (2.5 mmol/L) and lactate (1 or 5 mmol/L) or [U-13C]lactate (1 mmol/L) and glucose (2.5 mmol/L). The cell cultures were superfused for 90 mins and exposed to 13 periods of depolarization lasting 30 secs each. The cell cultures were subsequently washed twice with isotonic saline and metabolites were extracted using 70% (v/v) ethanol. The cell extracts were lyophilized and redissolved in water for analysis of content and labeling of intracellular amino acids, lactate, and succinate.
A similar superfusion procedure was employed in parallel experiments to investigate the release of glutamate from cerebellar neurons using preloaded D-[3H]aspartate as a marker. D-Aspartate enters both the cytoplasmic and the vesicular glutamate pools (Fleck et al, 2001; Bak et al, 2003, and references herein). D-[3H]Aspartate (1 μCi) was added to the cell cultures (35 mm Petri dishes), which were incubated for 30 mins and then placed in a superfusion apparatus. The culture medium was replaced by a Hepes-buffered saline solution as described above and superfused (2 mL/min) for 20 mins in a medium containing glucose (2.5 mmol/L) to remove excess radioactivity. Subsequently, the cultures were exposed to a medium containing either glucose (2.5 mmol/L), lactate (1 mmol/L), or both substrates combined. Release of D-[3H]aspartate was induced by repetitive pulses of NMDA (300 mmol/L) and potassium (15 mmol/L) as described above and previously (Bak et al, 2003). Some cultures were exposed to TBOA (100 μmol/L) during the stimulation pulses to inhibit sodium-dependent glutamate transport (Shimamoto et al, 1998). The superfusion medium was collected by a fraction collector (30 secs/fraction) and analyzed using a scintillation counter. After the experiment, the cells were extracted in 70% (v/v) ethanol and analyzed for remaining radioactivity. The release in each fraction was calculated as the fractional release in the percent of the total amount of radioactivity in the culture. The release is calculated as the area under the curve (AUC) (Bak et al, 2003).
Biochemical Analysis
Amino acids were quantified by HPLC using precolumn, on-line o-phthaldialdehyde derivatization and fluorescence detection (excitation 350 nm; detection 450 nm) on a Shimadzu 10A VP HPLC system equipped with a Shimadzu RF-10AXL fluorescence detector (Geddes and Wood, 1984). The chromatography was performed on a Varian Chromsep C-18 HPLC column (100 × 4.6 mm ID, particle size 3 mm, pore size 100 A) using a elution gradient profile at a flow of 1.0 mL/min. Mobile phase A consisted of a 50 mmol/L phosphate buffer at pH 5.9 with 1.25% tetrahydrofuran (THF). Mobile phase B consisted of methanol with 1.25% THF. The gradient profile was as follows: 0 to 5mins, 20% B; 5 to 20mins, 20% to 54% B; 20 to 30mins, 54% to 10% B; 30 to 40mins, 10% to 90% B; 40 to 45 mins, 90% to 10% B, 45 to 50 mins, 10% B; and 50 to 60 mins; 20% B. Liquid chromatography-mass spectrometry analyses were performed using a Shimadzu LCMS-2010 mass spectrometer coupled to a Shimadzu 10A VP HPLC system. The Phenomenex EZ:faast amino cid analysis kit for LC-MS was used for analysis of abeling in relevant amino acids. Labeling of lactate and succinate was determined using reversed-phase chromatography on a Phenomenex Synergi Hydro-RP C18 column 250 × 2.0 mm ID, particle size 4μ, pore size 80 A) coupled to detection on the mass spectrometer. The HPLC system was operated using a mobile phase of 20% methanol in water (isocratically) containing 0.1% formic cid (pH B 2.6). Protein content was determined according o Lowry et al (1951) using bovine serum albumin as the standard. The typical protein content of the cell cultures grown in 80 cm2 flasks was 3.5 mg.
Calculation of Molecular Carbon Labeling(%)
To obtain a measure of total incorporation of 13C label, the average percent of labeled carbon atoms for each metabolite was calculated. For example, glutamate may contain anywhere between one and five 13C atoms (designated M + 1 to M + 5, see Results for details). To provide a measure of he total labeling of the glutamate pool, the percent of the Individual isotopomers (i.e., M + 1, M + 2, M + 3, etc.) are first multiplied by the number of carbons labeled (i.e., 1 or M + 1, 2 for M + 2, etc.), subsequently summed up, and expressed as a percent of the total number of carbon atoms. To illustrate this, the following example of the calculation for glutamate in a fictive experiment is provided: if glutamate is labeled as follows M + 1, 20%; M + 2, 10%; M + 3, 5%; M + 4, 3%; and M + 5, 2%, the calculation will be (([M + 1, 20% × 1] + [M + 2, 10% × 2] + M + 3, 5% × 3] +[M + 4, 3% × 4] +[M + 5, 2% × 5])/500) × 100% = 15.4%. Hence, percent molecular carbon abeling (MCL) is a measure of the total labeling of glutamate (or any other metabolite), and is therefore the most precise measure of total incorporation of label.
)Data Analysis
All labeling data were corrected for natural abundance of 13C by subtracting a standard sample of the relevant metabolite. The isotopic enrichment was calculated according to Biemann (1962). Data analysis was performed sing Microsoft Excel 2002 and GraphPad Prism v4.01 and he data are presented as averages 7 the standard deviation. Statistical differences were analyzed using either unpaired, two-tailed Student's t-test, or one-way analysis of variance (ANOVA) followed by Tukey–Kramer post hoc test.
Results
The labeling of intracellular glutamate, aspartate, alanine, lactate, and succinate was determined sing mass spectrometry. Figure 1 provides a schematic representation of the metabolic pathways involved in the formation of these metabolites from glucose and lactate. Pyruvate is the central metabolite linking metabolism of exogenous glucose and lactate. Label from [U-13C]glucose or [U-13C]lactate must initially pass through pyruvate before it can be incorporated into alanine, glutamate, succinate, and aspartate. Likewise, label appearing in lactate from [U-13C]glucose also involves metabolism through pyruvate.
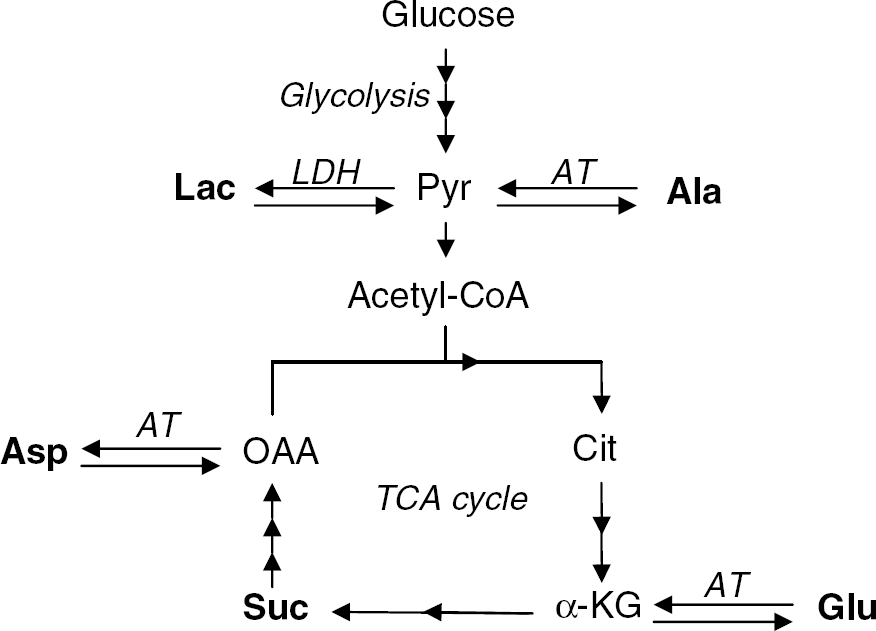
Metabolic scheme showing the metabolism of glucose and lactate and the formation of metabolites discussed in the present work (in bold). Glucose is metabolized to pyruvate, a multistep process known as glycolysis, which takes place in the cytosol. Pyruvate is the central metabolite linking glucose and lactate metabolism, as lactate is oxidized to pyruvate. Pyruvate can either be transaminated to alanine or transported into the mitochondria where it is oxidized to acetyl-CoA, which condenses with oxaloacetate to form citrate. Citrate is in two steps transformed to α-ketoglutarate, which is in equilibrium with glutamate catalyzed by aminotransferases. Succinate is formed in two steps from α-KG and oxaloacetate is formed in three steps from succinate. Aspartate is formed from oxaloacetate by transamination. Ala, alanine; Asp, aspartate; AT, aminotransferase; Cit, citrate; Glu, glutamate; α-KG, α-ketoglutarate; Lac, lactate; LDH, lactate dehydrogenase; OAA, oxaloacetate; Pyr, pyruvate; Suc, succinate; TCA, tricarboxylic acid.
The MCL (see Materials and methods) of glutamate obtained from the two labeled substrates is affected by different parameters: (i) acetyl-CoA enrichment, (ii) tricarboxylic acid (TCA) cycling, (iii) aspartate aminotransferase activity, and (iv) compartmentation of metabolic pathways. The enrichment of acetyl-CoA in every single pool is directly reflected in the MCL of glutamate in its connected pool. This, in turn, is dependent on TCA cycling. Tricarboxylic acid cycling may in any given microenvironment be monitored using labeling of glutamate since aspartate aminotransferase activity is several fold higher than that of the TCA cycling (Drejer et al, 1985; Fitzpatrick et al, 1990; Mason et al, 1992). The enzymatic pathways involved in the conversion of glucose/lactate to glutamate including glycolysis, lactate dehydrogenase, and TCA cycle reactions are most likely compartmentalized and heterogeneous (Eloqayli et al, 2002; Waagepetersen et al, 2003, and references therein). However, the MCL of glutamate is an average value of the labeling generated in all compartments metabolizing the labeled substrate and it is at present not possible to analyze this parameter completely with regard to complexity. Because of these considerations, the MCL of glutamate is interpreted as a combined measure of acetyl-CoA 13C enrichment and TCA cycling. It corresponds to oxidative metabolism including glycolysis for glucose and the lactate dehydrogenase reaction for lactate.
Uniformly 13C-labeled glucose or lactate gives rise to uniformly labeled acetyl-CoA and double labeling (designated M + 2, that is, the mass of the parent ion (M) plus 2 U of molecular weight (Da) corresponding to two atoms of 13C) in glutamate reflecting α-KG labeled in the first turn of the TCA cycle. It should be noted that M + 2 glutamate to some extent may be derived from subsequent turns of the TCA cycle as well (Figure 2). Mono, triple, quadruple, and uniform label (designated M + 1, 3, 4, and 5) represent glutamate derived from α-KG labeled in subsequent turns of the TCA cycle (Figure 2). Alanine formed from pyruvate derived from [U-13C]lactate or [U-13C]glucose is uniformly labeled (i.e., M + 3). Label in succinate and aspartate occurs when uniformly labeled acetyl-CoA is metabolized in the TCA cycle, as explained for glutamate above and shown in Figure 2. To obtain a measure of the total incorporation of 13C label, the average percent of labeled carbon atoms for each metabolite was calculated (MCL as explained in Materials and methods).
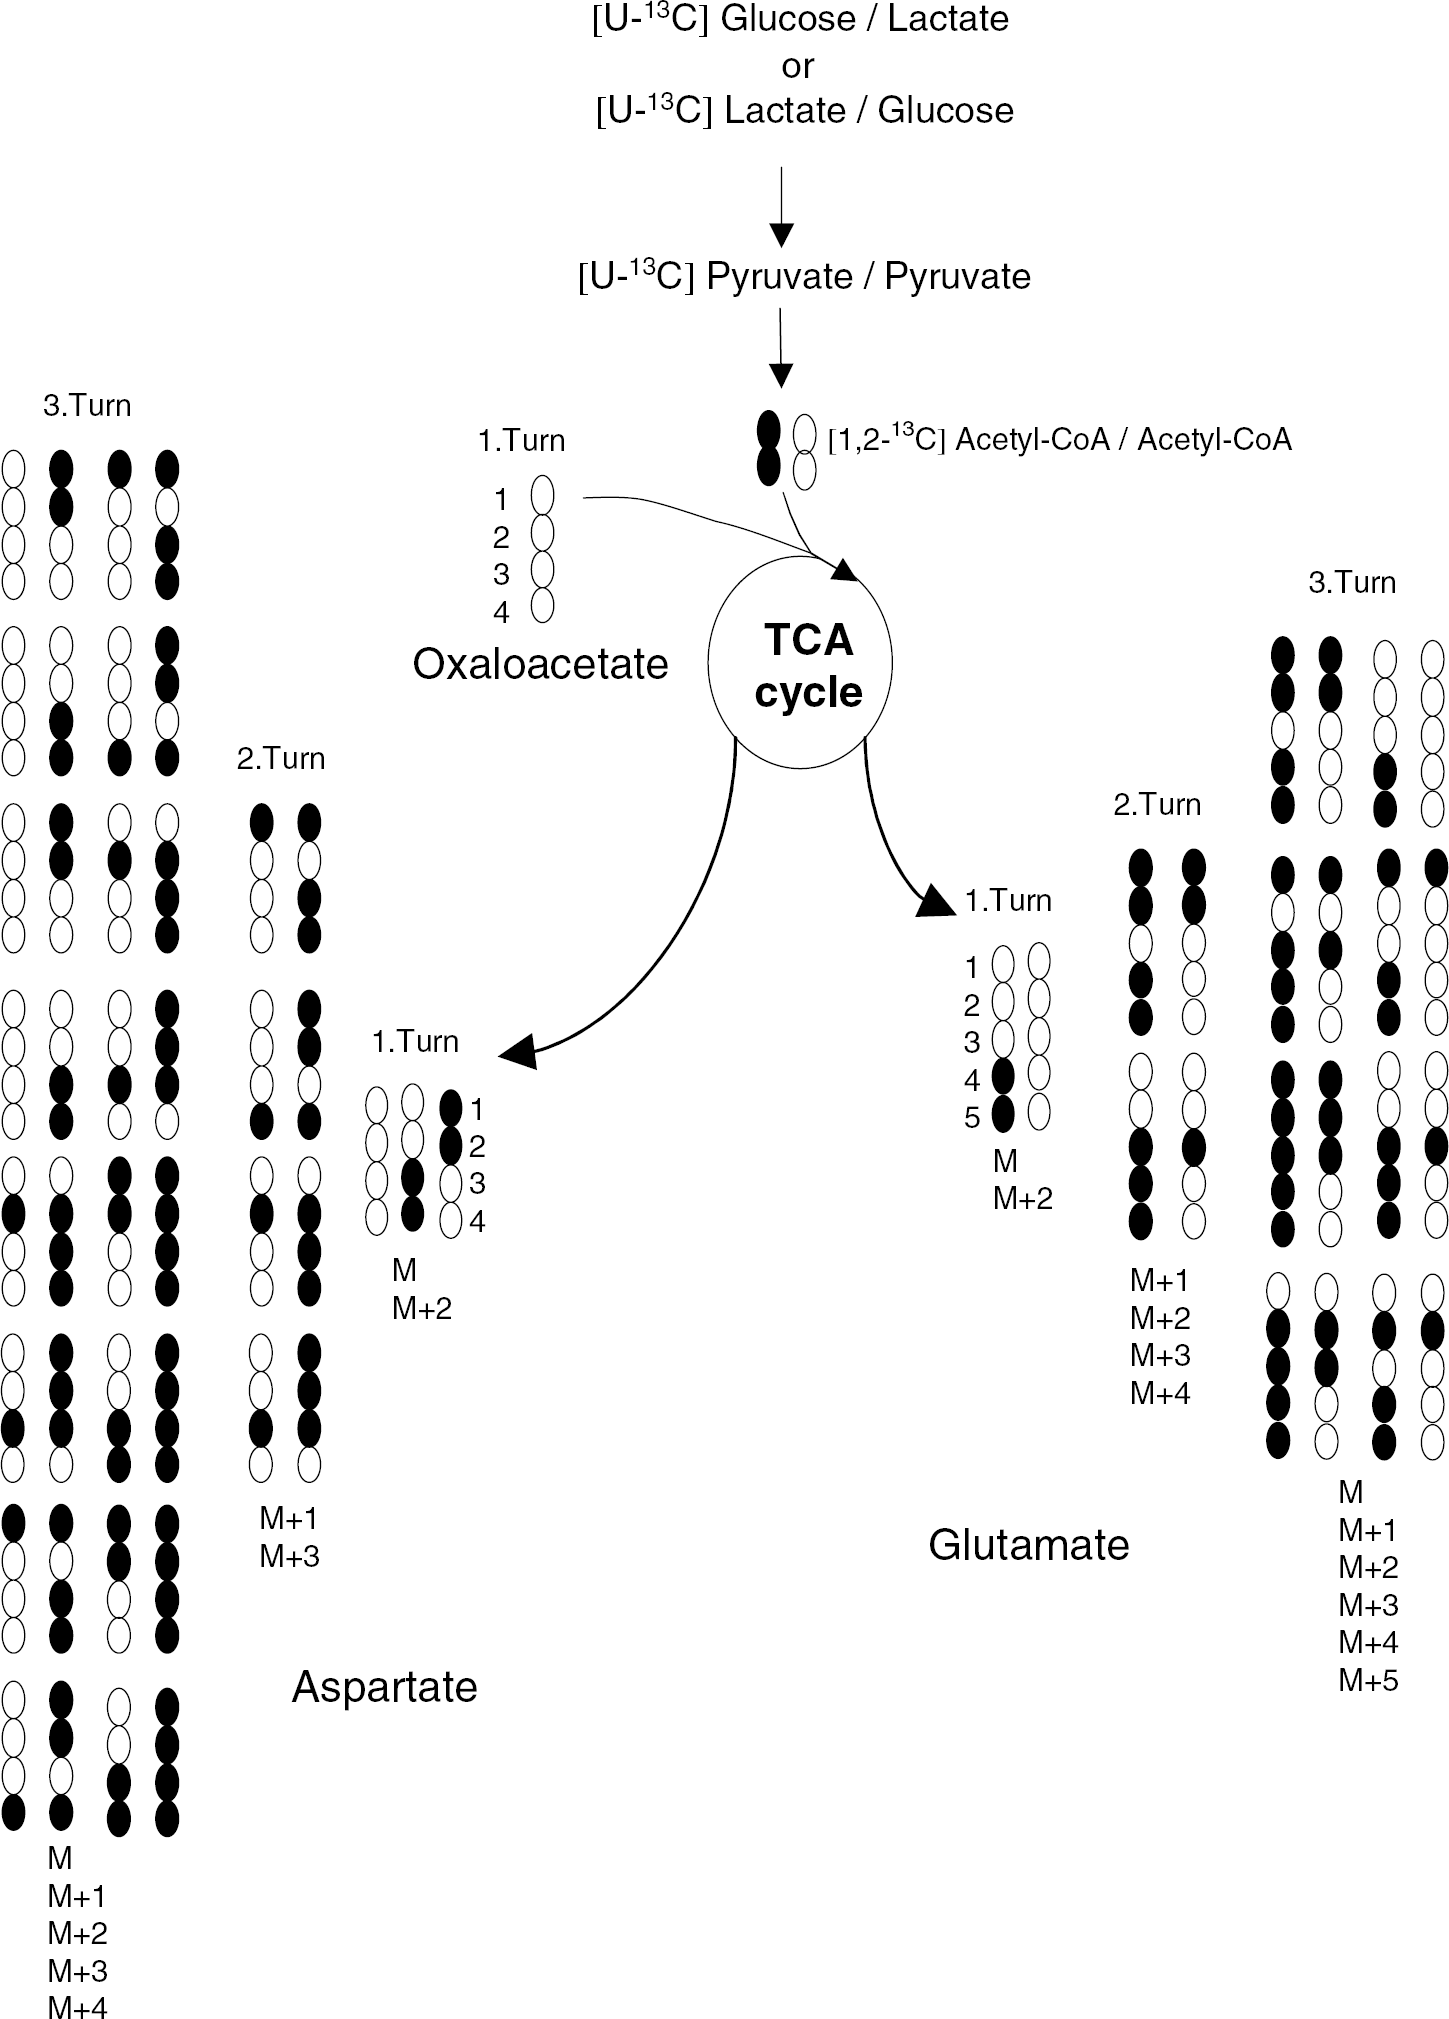
A simplified scheme of TCA cycle metabolism of [1,2-13C]acetyl-CoA and acetyl-CoA derived from [U-13C]glucose/glucose or [U-13C]lactate/lactate. In the first turn, unlabeled oxaloacetate condenses with either labeled or unlabeled acetyl-CoA. The scheme shows all the possible combinations of label in glutamate and aspartate during three turns of the TCA cycle. Labeled carbon atoms are represented by black circles. TCA; tricarboxylic acid.
Metabolism of [U-13C]glucose and Lactate
The labeling of metabolites from [U-13C]glucose (2.5 mmol/L) was investigated in the presence of two different lactate concentrations, 1 and 5 mmol/L (Tables 1 and 2). At 1 mmol/L lactate, the labeling of glutamate (M + 3, 4, and 5) and aspartate (M + 2, 3, and 4) showed significant increases as a result of repetitive depolarization (Table 1). These amino acids are in equilibrium with the TCA cycle via the intermediates α-ketoglutarate (α-KG) and oxaloacetate, and the labeling therefore reflects 13C enrichment of acetyl-CoA and extent of TCA cycle and oxidative metabolism. The increase of label from [U-13C]glucose indicates that TCA cycle and oxidative metabolism of pyruvate derived from glucose was increased under conditions of evoked neuronal activity, that is, more labeled acetyl-CoA derived from [U-13C]glucose entered the TCA cycle for further metabolism. Intracellular lactate and alanine were only modestly labeled and lactate showed a depolarization-dependent doubling of M+ 3 labeling, likely reflecting increased glycolysis. Succinate showed a significant increase of M + 3 labeling in the repetitively depolarized neurons, again indicating increased TCA cycling of labeled acetyl-CoA originating from [U-13C]glucose. The cellular content of glutamate was unaffected by repetitive depolarization and that of aspartate exhibited a slight decrease (Table 1). This might be explained by glutamate formation at the expense of aspartate via aspartate aminotransferase to meet the need for neurotransmitter glutamate during depolarization-induced release (see Figure 1). In line with the increase of individual isotopomers, the MCL of glutamate, aspartate, and lactate increased as a result of repetitive depolarization (Table 3). Using a higher concentration of lactate (5 mmol/L) in combination with [U-13C]glucose (2.5 mmol/L), the labeling of glutamate (M +1, 2, 3, and 4), aspartate (M + 1, 2, and 3), and alanine (M + 3) from [U-13C]glucose was increased when the neurons were repetitively depolarized (Table 2). This shows that neurons, even when offered a five times higher lactate concentration, still increase the metabolism of glucose during repetitive depolarization. The labeling of succinate (M+ 1, 2, and 3) and lactate (M + 3) increased as well, the latter again suggesting increased glycolysis. These augmentations of labeling are in line with an increased MCL for all measured metabolites (Table 3). At the high lactate concentration, no significant changes in the cellular content of amino acids could be detected after repetitive depolarization (Table 2).
Intracellular context (nmol/mg protein) and labeling (%) of metabolites in cultured cerebellar neurons after superfusion in the combined presence of (U-13C]glucose (2.5 mmol/L and lactate (1 mmol/L)
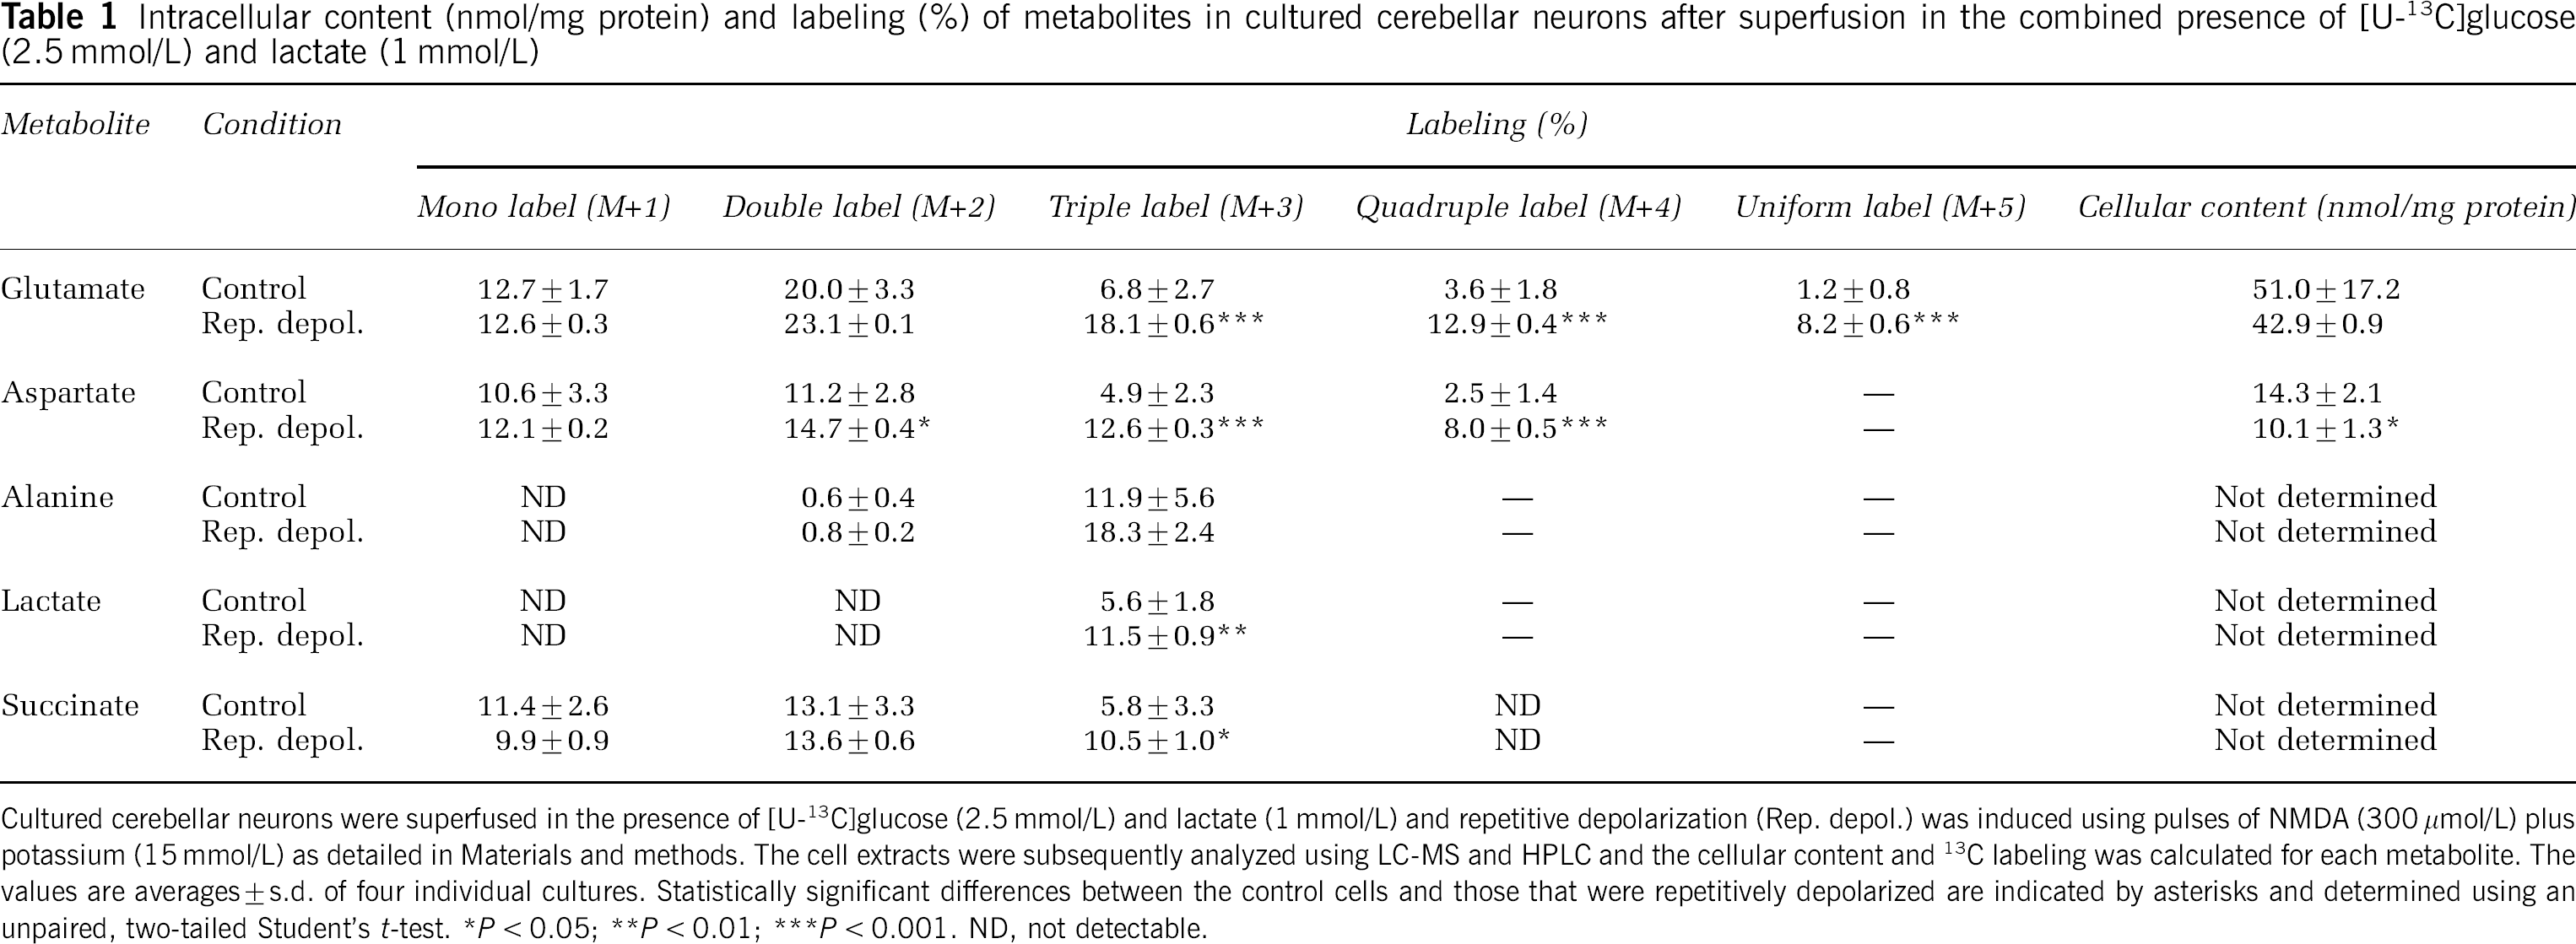
Cultured cerebellar neurons were superfused in the presence of [U-13C]glucose (2.5 mmol/L) and lactate (1 mmol/L) and repetitive depolarization (Rep. depol.) was induced using pulses of NMDA (300 mmol/L) plus potassium (15 mmol/L) as detailed in Materials and methods. The cell extracts were subsequently analyzed using LC-MS and HPLC and the cellular content and 13C labeling was calculated for each metabolite. The values are averages + s.d. of four individual cultures. Statistically significant differences between the control cells and those that were repetitively depolarized are indicated by asterisks and determined using an unpaired, two-tailed Student's t-test.
P < 0.05
P < 0.01
P < 0.001. ND, not detectable.
Intracellular context (nmol/mg protein) and labeling (%) of metabolites in cultured cerebellar neurons after superfusion in the combined presence of (U-13C]glucose (2.5 mmol/L and lactate (5 mmol/L)
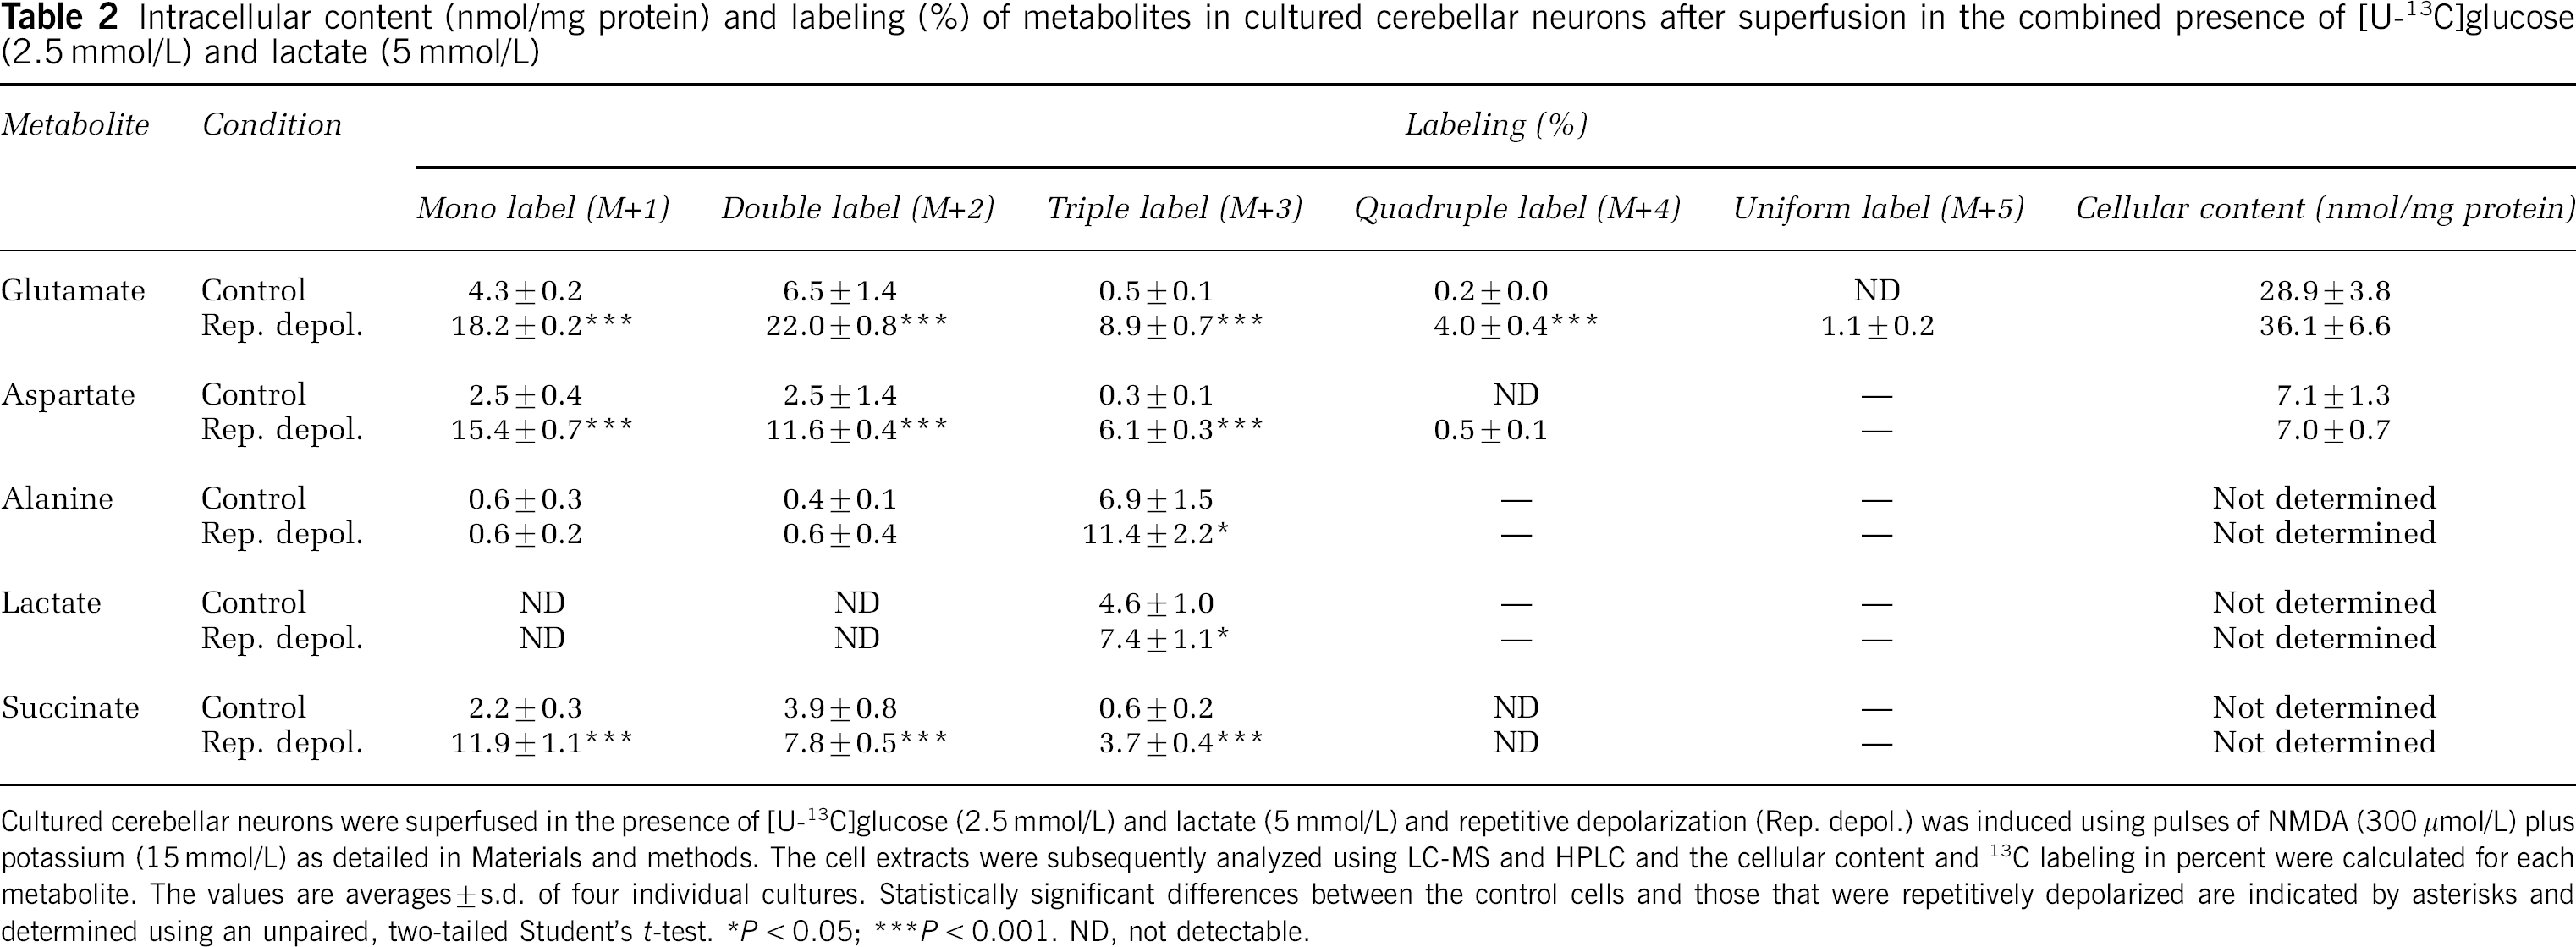
Cultured cerebellar neurons were superfused in the presence of [U-13C]glucose (2.5 mmol/L) and lactate (5 mmol/L) and repetitive depolarization (Rep. depol.) was induced using pulses of NMDA (300 mmol/L) plus potassium (15 mmol/L) as detailed in Materials and methods. The cell extracts were subsequently analyzed using LC-MS and HPLC and the cellular content and 13C labeling in percent were calculated for each metabolite. The values are averages + s.d. of four individual cultures. Statistically significant differences between the control cells and those that were repetitively depolarized are indicated by asterisks and determined using an unpaired, two-tailed Student's t-test.
P < 0.05
P < 0.001. ND, not detectable.
MCL (%) for each intracellular metabolite in cultured cerebellar neurons after superfusion in the presence of either(U-13C]glucose (2.5 mmol/L)/lactate (1 or 5 mmol/L) or [U-13C]lactate(1 mmol/L)/glucose (2.5 mmol/L)
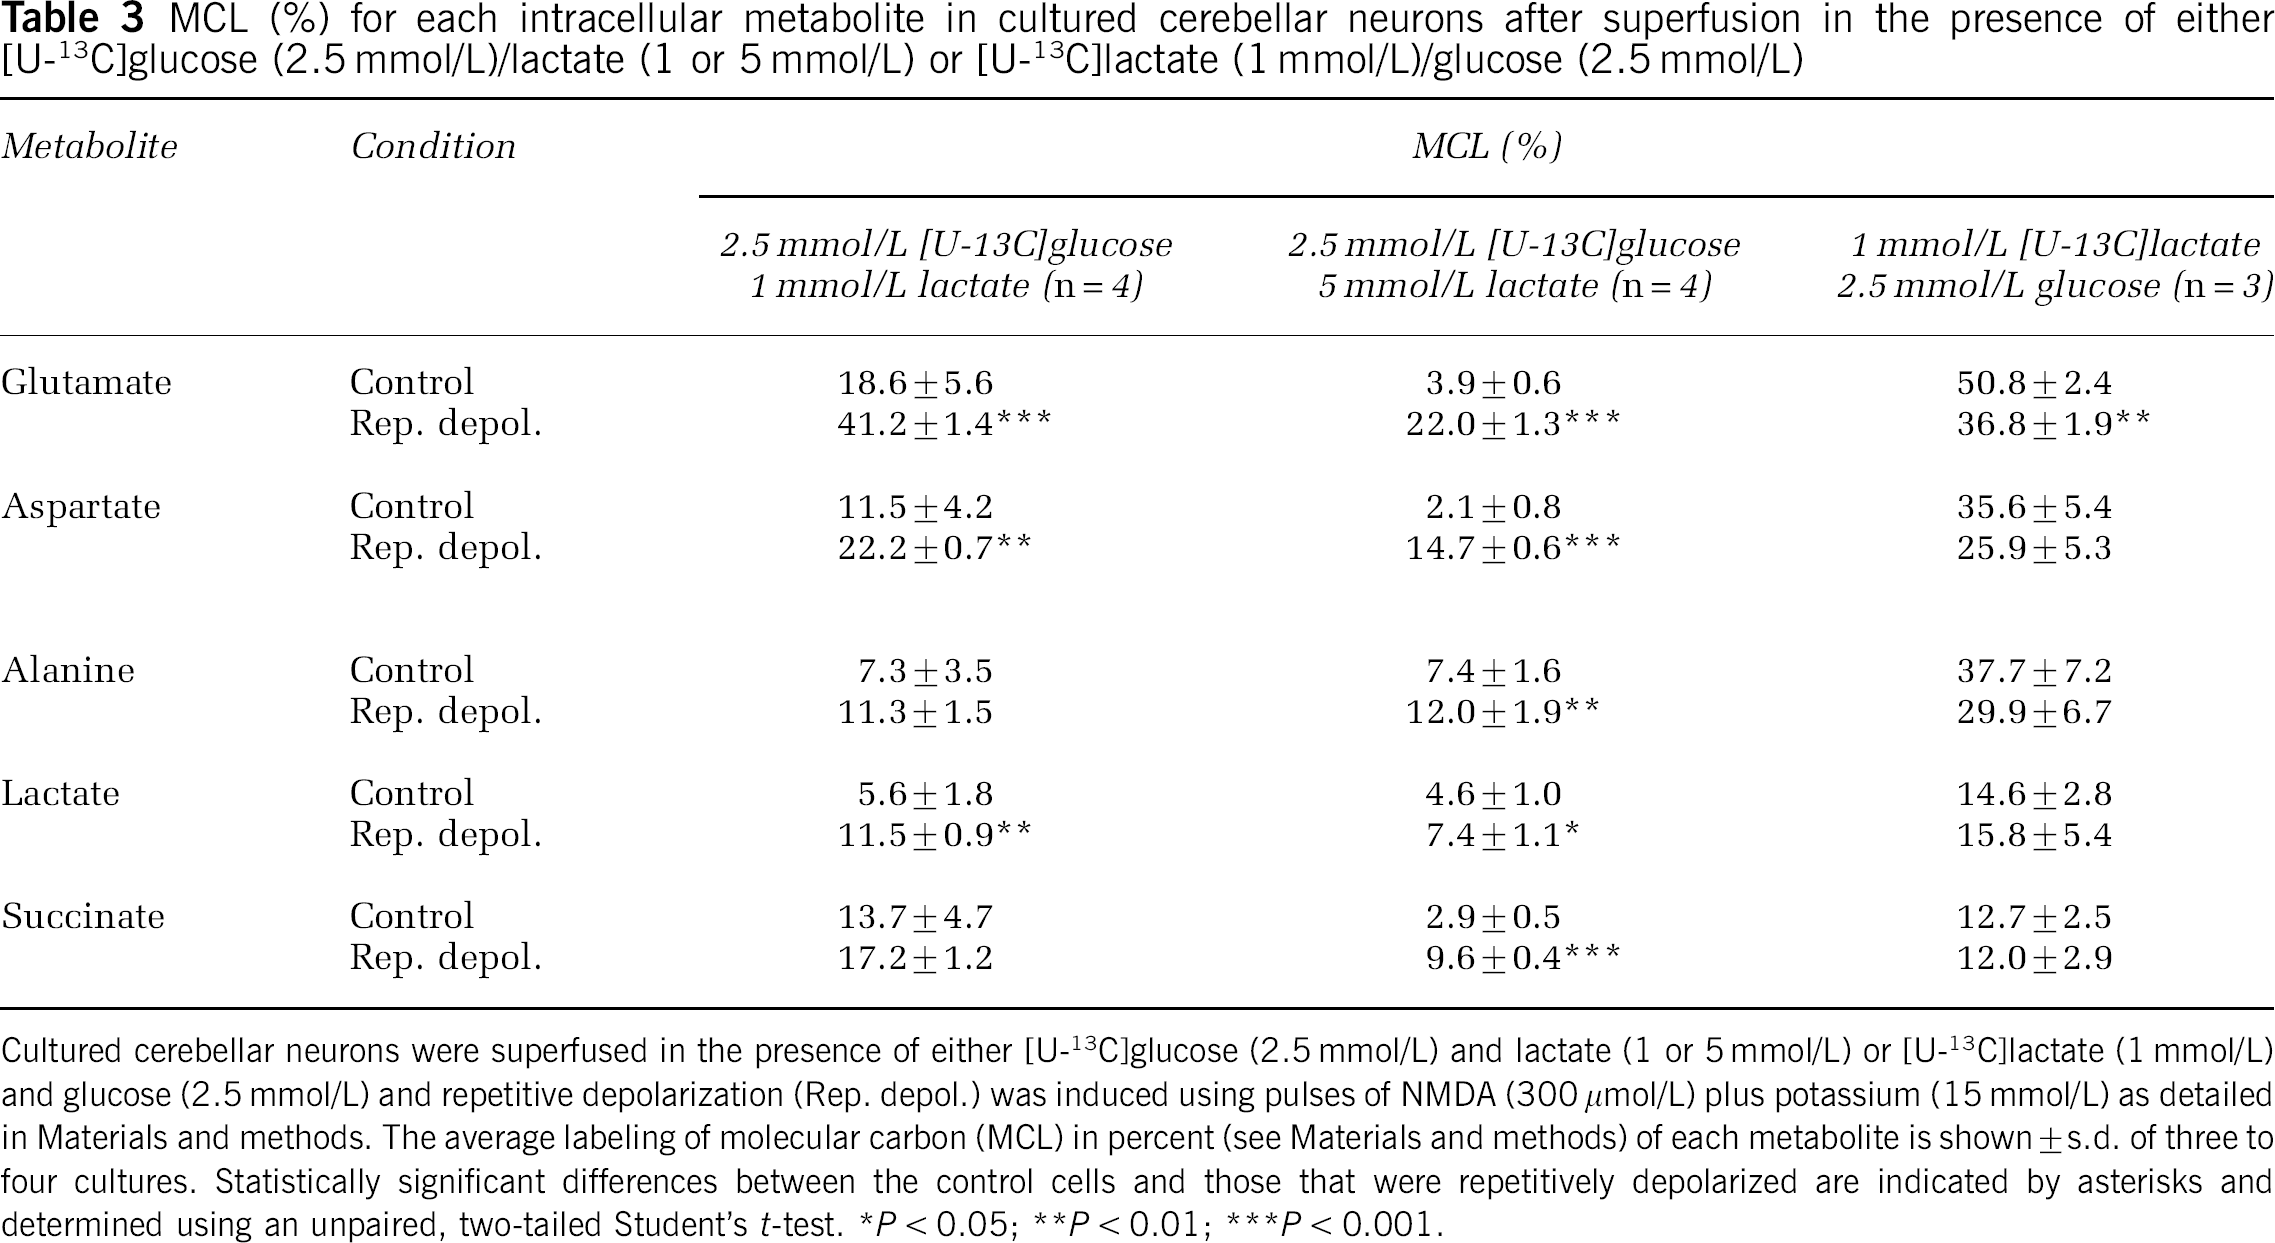
Cultured cerebellar neurons were superfused in the presence of either [U-13C]glucose (2.5 mmol/L) and lactate (1 of 5 mmol/L) or [U-13C]lactate (1 mmol/L)and glucose (2.5 mmol/L) and repetitive depolarization (Rep. depol.) was induced using pulses of NMDA (300 μmol/L) plus potassium (15 mmol/L) as detailed in Materials and methods. The average labeling of molecular carbon (MCL) in percent (see Materials and methods) of each metabolite is shown ± s.d. of three to four cultures. Statistically significant differences between the control cells and those that were repetitively depolarized are indicated by asterisks and determined using an unpaired, two tailed Student's t-test.
P < 0.05
P < 0.01.
P < 0.001.
Metabolism of [U-13C]Lactate and Glucose
Employing [U-13C]lactate (1 mmol/L) as the labeled substrate in the presence of glucose (2.5 mmol/L), the MCL of glutamate decreased substantially when the neurons were repetitively depolarized (Table 3). Significant decreases were observed for glutamate M + 4 and 5 and aspartate M + 4, whereas M + 1 was increased for both amino acids (Table 4). These observations reflect a higher amount of unlabeled glucose-derived acetyl-CoA entering the TCA cycle. Using labeled lactate as precursor in the presence of unlabeled glucose, uniformly labeled lactate represented only about 15% of the total intracellular lactate pool and was not affected by repetitive depolarization. This was an unexpected finding, since the labeling of lactate in the presence of [U-13C]glucose was also modest, that is, approximately 6% (see the Discussion for further details). In contrast, alanine was labeled to a much higher extent (Tables 3 and 4), indicating that alanine is formed from pyruvate originating from a [U-13C]lactate pool having a higher labeling than the total lactate pool, that is, a classical example of metabolic compartmentation. Except for glutamate, only modest changes were observed in labeling of metabolites including succinate on repetitive depolarization in the presence of [U-13C]lactate and glucose (Table 3). Reflecting the observation employing glucose as the labeled substrate, the cellular content of aspartate was decreased (Table 4).
Intracellular context (nmol/mg protein) and labeling (percetn) of metabolites in cultured cerebellar neurons after superfusion in the combined presence of (U-13C]lactate (1 mmol/L and glucose (2.5 mmol/L)
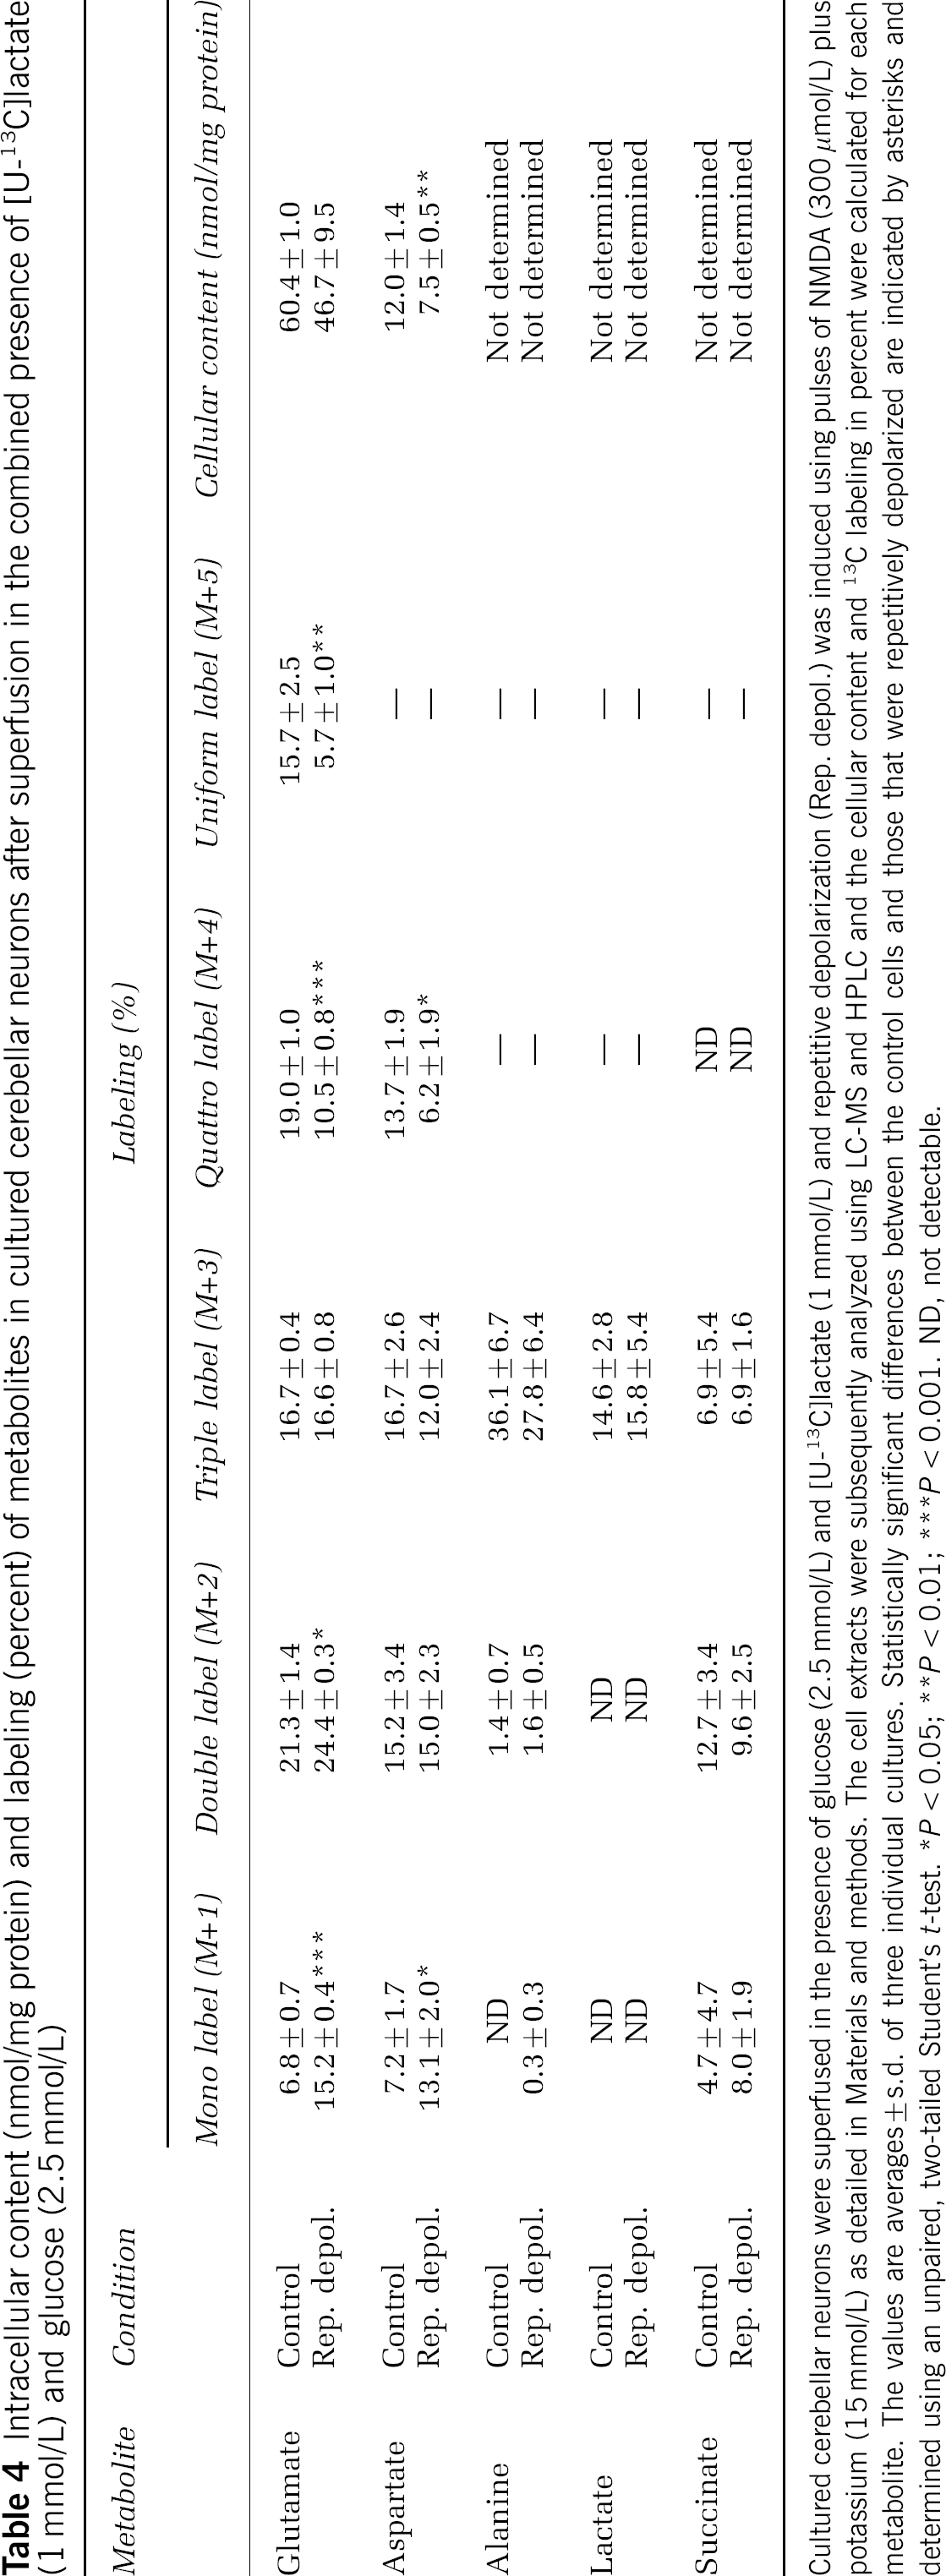
Cultured cerebellar neurons were superfused in the presence of glucose (2.5 mmol/L) and [U-13C]lactate (1 mmol/L) and repetitive depolarization (Rep. depol.) was induced using pulses of NMDA (300 /mol/L) plus potassium (15 mmol/L) as detailed in Materials and methods. The cell extracts were subsequently analyzed using LC-MS and HPLC and the cellular content and 13C labeling in percent were calculated for each metabolite. The values are averages + s.d. of three individual cultures. Statistically significant differences between the control cells and those that were repetitively depolarized are indicated by asterisks and determined using an unpaired, two-tailed Student's t-test.
P < 0.05
P < 0.01
P < 0.001. ND, not detectable.
Extent of Tricarboxylic Acid Cycle Metabolism
Glutamate is labeled from the TCA cycle intermediate α-KG, and the labeling pattern reflects the 13C enrichment of the acetyl-CoA pool and the extent of TCA cycling. To evaluate this under the given conditions, ratios corresponding to the sum of label in glutamate occurring after two or more turns of the TCA cycle (i.e., M + 1, 3, 4, and 5; Figure 2) divided by that occurring after the first turn (M + 2; Figure 2) were calculated and shown in Table 5. This ratio is a measure of TCA cycling of labeled acetyl-CoA and thus most likely reflects oxidative metabolism of the labeled substrates. An analogous ratio was previously obtained from 13C nuclear magnetic resonance data (Waagepetersen et al, 1998a). As noted above, glutamate M + 2 may to some extent be derived from subsequent turns of the TCA cycle. Hence, the calculated ratios could be slightly underestimated. The significant changes (P < 0.001) in the ratios induced by repetitive depolarization indicate a decrease in the oxidative metabolism of labeled lactate in the presence of unlabeled glucose. In addition, an increase in oxidative metabolism of labeled glucose in the presence of unlabeled lactate is indicated. Moreover, in the nondepolarized cultures, the ratio of oxidative metabolism of labeled glucose was lower than that of labeled lactate.
Ratios of label in intracellular glutamate ({M+1, 3, 4, and 5}/M+2) indicating oxidative metabolism of [U-13C]glucose and [U-13C]lactate in cultured cerebellar neurons
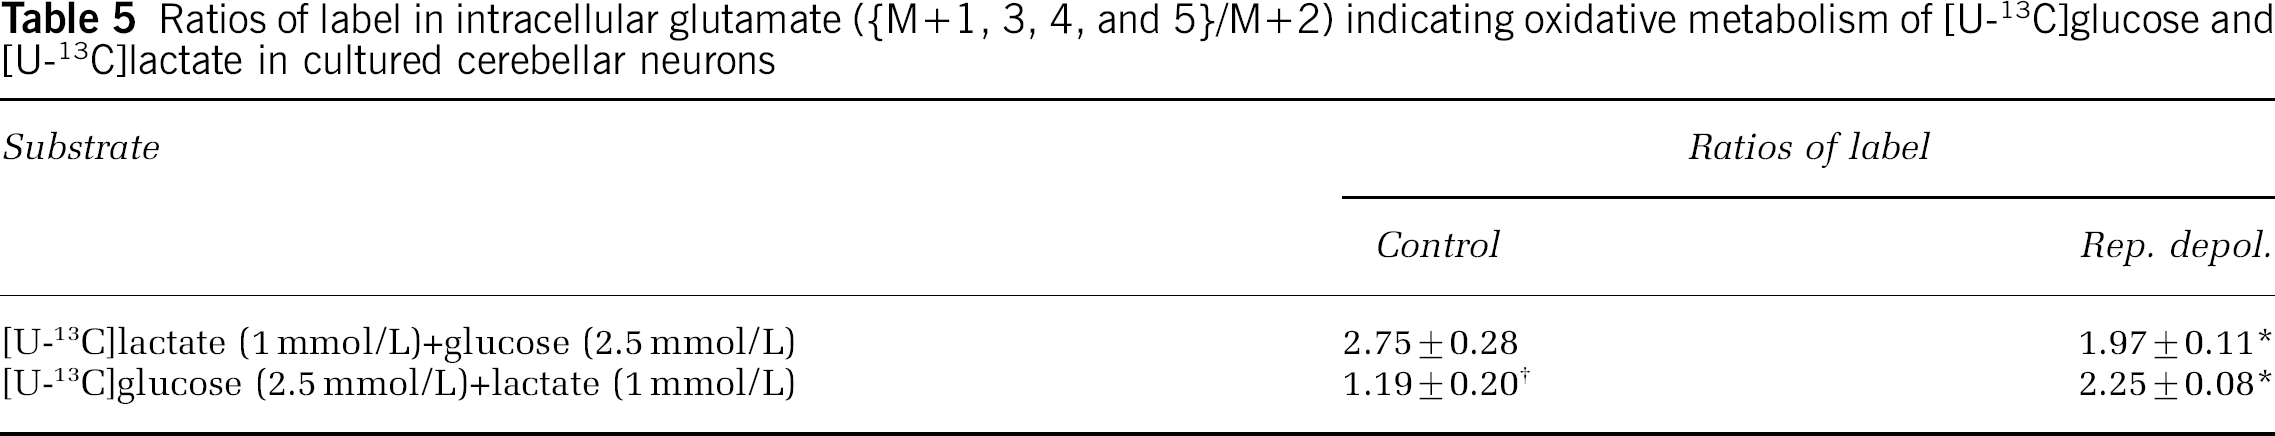
Oxidative metabolism in cultured cerebellar neurons of pyruvate derived from either labeled glucose or lactate after superfusion of the cells in media containing these substrates was compared by calculating the ratio of the sum of label occurring after two or more turns of the TCA cycle with that occurring after the first turn ({M + 1, 3, 4, and 5}/M + 2), see Results for details. Two experiments were performed illustrating the effect of repetitive depolarization (Rep. depol.) on the oxidative metabolism of [U-13C]lactate (1 mmol/L) in the presence of glucose (2.5 mmol/L) or [U-13C]glucose (2.5 mmol/L) in the presence of 1 mmol/L lactate. Results are averages ± s.d. of three to four cultures. Statistically significant differences were analyzed using a one-way ANOVA followed by a Tukey-Kramer post hoc test.
Statistically significant difference between control cells and the repetitively depolarized cells (P < 0.001).
Significant difference from cells superfused under control conditions in the presence of [U-13C]lactate and glucose (P < 0.01).
Release of Preloaded D-[3H]Aspartate in the Presence of Either Glucose or Lactate
Release of preloaded D-[3H]aspartate from cerebellar neurons was monitored in a superfusion experiment using pulses of NMDA (300 μmmol/L) combined with potassium (15 mmol/L) to induce repetitive vesicular release. Figure 3 shows the results of experiments in which the cells were superfused in the presence of either glucose (2.5 mmol/L) or lactate (1 mmol/L) alone or in combination. The fractional release is quantified as the AUC for each condition, reflecting vesicular plus release, that is, efflux caused by depolarization-induced reversal of the glutamate transporter. The release obtained in the presence of glucose was normalized to 100. When lactate was the only substrate, the release was significantly higher (80%) compared with that obtained when glucose alone or glucose in combination with lactate were the energy substrates (P < 0.001). Figure 4 shows the results of another set of experiments in which the effect of the nontransportable, glutamate transport inhibitor TBOA (100 μmol/L) was investigated. DL-Threo-β-benzyloxyaspartate had no effect on the fractional release of D-[3H]aspartate in the presence of glucose. However, the difference in the fractional release of D-[3H]aspartate obtained using lactate or glucose as sole substrates was abolished by inhibiting glutamate transport (P < 0.001).
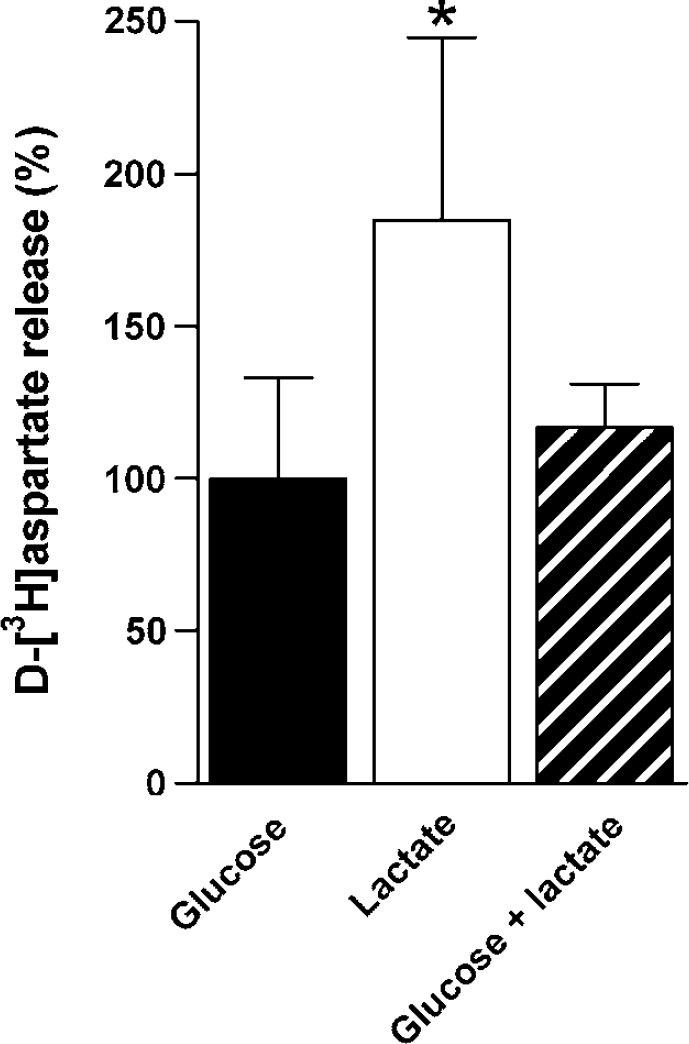
Quantification of depolarization-coupled release of preloaded D-[3H]aspartate from cultured cerebellar neurons evoked by 30 secs pulses of NMDA (300/mol/L) plus potassium (15 mmol/L) measured as AUC (see Materials and methods). Release in the presence of glucose (2.5 mmol/L, black bar), lactate (1 mmol/L, open bar) or in the combined presence of glucose and lactate (hatched bar) was investigated. Glucose as sole substrate was used as a reference and normalized to 100. Results are averages of five peaks of release from four cultures with error bars representing s.d. Statistically significant differences were calculated using a oneway ANOVA followed by a Turkey–Kramer post hoc test. *Significantly different from the two other conditions (P < 0.01).
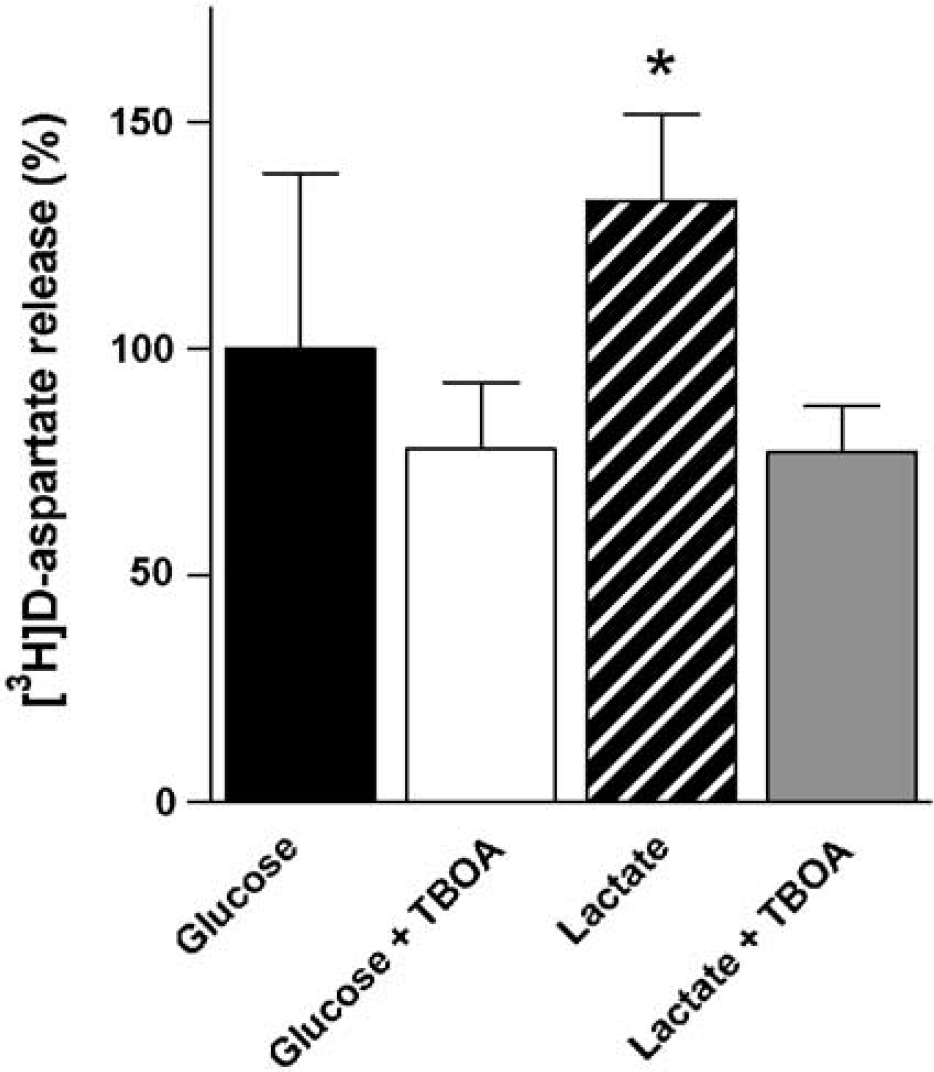
Quantification of depolarization-coupled release of preloaded D-[3H]aspartate from cultured cerebellar neurons evoked by 30 secs pulses of NMDA (300 /mol/L) plus potassium (15 mmol/L) measured as AUC (see Materials and methods). The effect of TBOA (100 /mol/L) on the release in the presence of glucose (2.5 mmol/L, black and open bars) or lactate (1 mmol/L, hatched and gray bars) was investigated. The release in the presence of glucose alone was used as a reference and normalized to 100 (black bar). Results are averages of three peaks of release from three to four cultures with error bars representing s.d. Statistically significant differences were calculated using an one-way ANOVA followed by a Tukey–Kramer post hoc test. *Significantly different from the other three conditions (P < 0.01).
Discussion
The experimental paradigm using neuronal depolarization in the presence of glucose and lactate may allow a discussion of a correlation between the utilization of each of these substrates and the energy demand related to neurotransmission. Glucose and lactate were in the present study used either independently or together, but in the latter case, their metabolism could be distinguished by 13C labeling of either one or the other substrate.
Metabolism of Glucose and Lactate
A depolarization-induced enhancement of oxygen consumption and CO2 production in brain slices using glucose as the substrate has been known for decades (for references, see Hertz and Schousboe, 1975). The increased oxidative metabolism of glucose during depolarization observed in the present study as an increase in incorporation of label into glutamate is in agreement with this. The somewhat lower incorporation of label into succinate compared with glutamate may be surprising in this context and it may reflect a compartmentalized TCA cycle metabolism as also suggested previously (Eloqayli et al, 2002). In addition to an increased oxidative metabolism of [U-13C]glucose, the labeling of lactate increased subsequent to depolarization, which is compatible with increased glycolytic activity.
The relative significance of glucose and lactate as neuronal substrates during synaptic activity is at present not established. Transporters for both lactate and glucose are expressed on neuronal cell membranes (Vannucci et al, 1997; Bergersen et al, 2002) and it has been shown in cultured neurons that 13C label from both substrates is efficiently incorporated into amino acids derived from TCA cycle intermediates (Waagepetersen et al, 1998a, b, 2000; Bouzier-Sore et al, 2003). It has been reported that a chronic depolarization (1 h) of glutamatergic neurons using an elevated potassium concentration enhances CO2 production in the presence of glucose as the sole substrate, but not from lactate (Peng et al, 1994).
The incorporation of label into glutamate from exogenous [U-13C]lactate was extensive and higher than that from [U-13C]glucose at rest. This finding is in agreement with the study by Bouzier-Sore et al (2003) using [1-13C]glucose and [3-13C]lactate, showing that cultured rat forebrain neurons utilize lactate more extensively than glucose for oxidative metabolism under resting conditions. However, as mentioned above, the labeling of glutamate from [U-13C]glucose was increased and the incorporation of label from [U-13C]lactate into glutamate was decreased during conditions leading to synaptic activity. The latter reflects the fact that the depolarization-induced increase in glucose metabolism leads to the production of unlabeled acetyl-CoA, which dilutes the pool of 13C-labeled acetyl-CoA from [U-13C]lactate. The present study in which the neurons were exposed to conditions leading to synaptic activity extends the conclusions previously reached by Bouzier-Sore et al (2003), using neuronal cultures maintained under resting conditions. Thus, in agreement with Bouzier-Sore et al (2003) lactate was the preferred substrate over glucose to maintain metabolism under resting conditions. However, the present findings as well as the results of a recent study by Allen et al (2005) show that during synaptic activity glucose is the preferred substrate. This may appear at odds with the astrocyte-neuron lactate shuttle hypothesis, which implies that lactate is transferred from astrocytes to neurons during neuronal activity, and thus lactate should be the preferred substrate under such conditions (Magistretti et al, 1999). The present results do not rule out the existence of an astrocyte-neuron lactate shuttle, as the neurons metabolized lactate extensively during both rest and repetitive depolarization. A recent study of Kasischke et al (2004) employing fluorescence imaging of nicotinamide adenine dinucleotide (reduced form) (NADH) shows an initial increase of oxidative metabolism in neuronal dendrites of acute hippocampal slices and a temporally delayed increase in NADH fluorescence localized to astrocytic processes. These authors support the astrocyte-neuron lactate shuttle hypothesis, suggesting that the increase in astrocytic NADH corresponds to an increase in glycolysis to provide lactate for use in neurons during synaptic activity. The results obtained by Kasischke et al (2004) are not contradictory to the present findings since the substrate during the initial increase of oxidative metabolism in neuronal dendrites might very well be glucose. The activation of astrocytic glycolysis after neuronal activation, suggested to lead to increased release of lactate (Kasischke et al 2004; Pellerin and Magistretti, 2004), is taken into account in the present study by employing lactate at two different concentrations (1 and 5 mmol/L), thus mimicking the proposed situation. Even in the presence of the higher lactate concentration, the neurons still increased the oxidative metabolism of glucose upon repetitive depolarization. Thus, lactate metabolism was not upregulated subsequent to neuronal activation.
The finding that label in the intracellular pool of lactate increased significantly upon repetitive depolarization in the presence of [U-13C]glucose at both levels of extracellular lactate indicates that more glycolytically produced lactate was formed during activity. This last point agrees with the findings of Bouzier-Sore et al (2003), as this might well correspond to an intracellular pool of lactate produced from glucose constituting a neuronal pool available for oxidative energy production. Furthermore, it might agree with the recent suggestion that lactate rather than pyruvate should be regarded as the end product of glycolysis (Schurr, 2005). This intriguing hypothesis implies that lactate formed in glycolysis is transported into mitochondria and oxidized (by lactate dehydrogenase) to pyruvate for oxidation in the TCA cycle. This, in turn, suggests that lactate is the only true oxidative substrate for all cells of the nervous system, neurons, and astrocytes alike (Schurr, 2005; Lam et al, 2005).
The enrichment of intracellular lactate in the presence of [U-13C]lactate was about 15% and that from [U-13C]glucose was 6%. This can only be explained if the cerebellar neurons contain a large, metabolically distinct pool of lactate that is not in equilibrium with exogenously supplied lactate. That compartmentation of intracellular lactate may indeed exist is further supported by the finding that the products of lactate metabolism, alanine, glutamate, and aspartate, all had a higher labeling than lactate itself. Such a precursor product relationship can only occur when distinctly different pools of a precursor exist (Berl and Clarke, 1983).
Effect of the Energy Substrate on Glutamate Release
Failure to quickly restore the sodium gradient after membrane depolarization would result in aberrant function of the glutamate transporter and a shift in equilibrium towards the release of cytoplasmic glutamate (Nicholls and Attwell, 1990). Hence, one likely explanation for the increased release of D-[3H]aspartate in the presence of lactate is that the ATP required to drive the Na+/K+-ATPase must at least to some extent be derived from metabolism of glucose. This is further substantiated by the finding that TBOA, which blocks the transporters (Shimamoto et al, 1998), reduced the release in the presence of lactate as the only energy substrate, but had no effect when glucose was the substrate. The functional importance of neuronal glutamate reuptake has not received much attention because of the generally accepted view of a predominant astrocytic glutamate uptake (Danbolt, 2001; Schousboe et al, 2004) and its functional importance may thus be underestimated. Cultured cerebellar neurons exhibit a pronounced glutamate uptake (Drejer et al, 1982), and it has recently been shown in cerebellar neuronal cultures that glutamate re-uptake is important to maintain neuronal transmitter glutamate homeostasis (Waagepetersen et al, 2005). Moreover, an immunocytochemical study has provided evidence for sodium-dependent uptake of D-aspartate in presynaptic nerve endings of hippocampal slices, showing that this process occurs in the intact tissue as well (Gundersen et al, 1993).
The finding that the stimulated release in the presence of TBOA was identical for glucose and lactate strongly suggests that the two substrates were equally effective in sustaining the energy requiring vesicular uptake of glutamate (D-[3H]aspartate), which is a prerequisite for release. This conclusion may appear in contrast to the recent suggestion by Ikemoto et al (2003) that vesicular glutamate transport is dependent on glycolytically produced ATP since glyceraldehylde-3-phosphate dehydrogenase and 3-phosphoglycerate kinase are tightly associated with the vesicular membrane. The explanation for this is presently unknown and further experimentation concerning this important question seems warranted.
Conclusion
The main conclusion of this study is that cerebellar neurons in culture derive the energy necessary to maintain neurotransmitter homeostasis during synaptic activity from metabolism of glucose. When neurons are provided with both lactate and glucose, lactate contributes significantly to the oxidative metabolism under both resting and activated conditions. Hence, if lactate is present it will be utilized. Astrocytes, metabolically activated by neurotransmitter glutamate uptake, may produce a surplus of lactate from glycolysis that is released to the extracellular space, as suggested by the astrocyte-neuron lactate shuttle hypothesis. However, the present results suggest that synaptic activity does not induce a corresponding upregulation of lactate metabolism in the neuronal compartment. In line with numerous other authors (Dienel and Hertz, 2001; Gjedde and Marrett, 2001; Chih et al, 2001a, b; Chih and Roberts, 2003; Patel et al, 2004; Dienel and Cruz, 2004; Hertz, 2004), the results presented here support a paradigm in which the neuronal energetics during activation is more complex than suggested by the astrocyte-neuron lactate shuttle hypothesis. Finally, indications for compartmentation of energy metabolism related to differences in the utilization of glucose and lactate has been revealed. This is evidenced by the observation that the intracellular lactate pool is complex since endogenously produced lactate appears to be partly separated from lactate taken up from the environment, a notion compatible with other studies (Anousis et al, 2004; Sickmann et al, 2005). Thus, complexity of lactate metabolism should be taken into consideration when glucose and lactate are compared as energy substrates and it clearly warrants further experimentation to elucidate this intriguing phenomenon.
Footnotes
Acknowledgements
The expert technical assistance by Mrs Kirsten Thuesen (Danish University of Pharmaceutical Sciences, Copenhagen, Denmark) as well as Dr Turit Nilsen and Mr Lars Evje, MSc (both Norwegian University of Science and Technology) is hereby cordially acknowledged. We like to extend our gratitude to Dr Mary C McKenna (University of Maryland, Baltimore, MD, USA) for fruitful discussions regarding this manuscript.