
Abstract
Because of observations that cultured neurons from mice deficient in the transcription factor E2F1 exhibit resistance after treatment with a wide variety of cell-death inducers, the authors investigated whether resistance extended to a cerebral ischemic insult. No differences in cerebral blood flow or physiologic parameters were observed in the mutant E2F1 littermates after the focal ligation. After 2 hours of left middle cerebral artery occlusion and 1 day of reperfusion, a 33% smaller infarct (P < 0.05) was observed by 2,3,5-triphenyltetrazolium staining in the brains of E2F1-null mice compared with their E2F1+/+ and +/− littermates. A milder ischemic insult produced by 20 minutes of middle cerebral artery occlusion and 7 days of reperfusion produced a greater difference in the E2F1-null animals with a 71% smaller infarct (P < 0.001) compared to littermate controls. A decrease in neuronal damage after mild ischemia in E2F1-null mice was observed by immunohistochemical monitoring of the loss in neuronal-specific microtubule-associated protein 2 cytoskeletal protein and the appearance of nuclear DNA fragmentation by terminal deoxynucleotidyl transferase-mediated 2′-deoxyuridine 5′-triphosphate-biotin nick end labeling. This decreased brain damage was evidenced by improved behavior in motor function of E2F1 −/− mice compared with their E2F1 +/+ littermates by 7 days of reperfusion. In an effort to address the underlying molecular mechanism of the resistance of E2F1-null mice, the expression of several downstream proapoptotic target genes (p73, Apaf1, Arf) of the E2F1 transcription factor was measured by quantitative polymerase chain reaction. Although an attenuated increase in Hsp68 mRNA was found in E2F1 −/− mice, no changes in the proapoptotic transcripts were found after ischemia, and a mechanistic inference was not possible. The authors conclude that the transcription factor E2F1 does modulate neuronal viability in brain after cerebral ischemia and corroborates the findings with cultured neurons.
As a member of the family of E2F transcription factors, E2F1 is considered to be a pivotal node in complex pathways that control decisions of cellular life and death (Ginsberg, 2002; Wyllie, 2002). Although there is redundancy in the family and multiple different E2Fs may bind to the promoter region of target genes, E2F1 appears to have specific actions particularly in control of apoptosis (Ginsberg, 2002, Wells et al., 2002). Surprisingly for such a putatively important transcription factor, animals devoid of E2F1 develop and reproduce normally, and have only slight overall changes in gene expression and tissue development (Cooper-Kuhn et al., 2002; Field et al., 1996; Wells et al., 2002). Decreased cell death in thymus has been observed in adult E2F1-null mice (Field et al., 1996; Yamasaki et al., 1996), and increased cell death in testes or skin has been reported in transgenic mice overexpressing E2F1 (Holmberg et al., 1998; Pierce et al., 1998). To modulate the many hundreds of downstream target genes, the E2F family acts in concert with other protein families such as DP and Rb (retinoblastoma). Consequently, animals deficient in Rb also have excessive free E2F1, and it is therefore of interest that such animals have extensive apoptosis during neurogenesis (Jacks et al., 1992; Lee et al., 1992; MacLeod et al., 1996). The mechanism whereby free E2F1 could induce apoptosis is not clear. Three possibilities have been put forward: induction of apoptotic genes, stabilization of the proapoptotic transcription factor p53, and inhibition of antiapoptotic signaling (Ginsberg 2002; Phillips and Vousden 2001).
There are many reports, including several from our laboratory, that cultured neurons from cerebellum, cortex, or hippocampus isolated from E2F1-null mice show resistance to a wide variety of cell-death inducers; e.g., anti-Fas antibody (Hou et al., 2002), β-amyloid (Giovanni et al., 2000), dopamine (Hou et al., 2001a,b), low potassium (O'Hare et al., 2000), oxygen-glucose deprivation (Gendron et al., 2001), or staurosporine (Hou et al., 2000). Using E2F1-null mice, we performed a preliminary investigation in 1999 and demonstrated slight resistance to focal ischemia in E2F1-null mice, but that study was flawed by use of outbred mice (MacManus et al., 1999). Because of the growing evidence showing that the absence of E2F1 confers resistance in neurons to a wide variety of insults, we have now undertaken a rigorous study using E2F1-mutant littermates that more robustly demonstrates that mice lacking the E2F1 transcription factor do indeed have resistance to both mild and severe ischemic episodes.
MATERIALS AND METHODS
Animals
A local committee for the Canadian Council on Animal Care approved all procedures involving mice. The E2F1 −/− mice (stock #2785) were originally obtained from Jackson Laboratories (Bar Harbor, MA, U.S.A.) and bred locally. We consistently used F2-generation littermates produced from interbreeding the F1 generation of E2F1 −/− stock crossed with purebred C57B/6 mice. F2-generation animals were genotyped by PCR as described previously (Field et al., 1996). Under temporary isoflurane anesthesia, the mice (20–23 g) were subjected to occlusion of the left MCA using an intraluminal filament as previously described (MacManus et al., 1999). After 20 minutes or 2 hours of ischemia, the animals were briefly reanesthetized, the filament withdrawn, and wounds sutured. In preliminary experiments to verify a consistent stroke procedure, measurements of blood pressure, blood gases, and pH were also performed (MacManus et al., 1999) and compared between E2F1 wild-type and mutant littermates.
Measurement of cerebral blood flow during ischemia
In some experiments, focal ischemia was initiated in mice and under continued anesthesia, blood flow was measured 25 minutes later in right versus left cerebral hemispheres using an indicator fractionation technique modified after Yamada et al. (2000). The mouse received an 80-μL bolus injection into the right jugular vein of 0.8 μCi Iofetamine HCl (N-[isopropylmethyl-1,3–14C]p-iodo-amphetamine hydrochloride, ARC-468, American Radiolabeled Chemical Inc., St. Louis, MO, U.S.A.). Immediately before and for 15 seconds after the bolus, syringe-pump sampling of femoral arterial blood was performed (1.8 μL/s), and terminated simultaneous with decapitation. Routine liquid-scintillation counting techniques were used to determine radiotracer concentration in each cerebral hemisphere (Cbrain, dpm/g) and the captured arterial sample (dpm/mL), which along with sample weight, blood specific gravity (1.05 g/mL), and pump rate enabled calculation (Patlak et al., 1984) of the time-integrated blood concentration (Integral, dpm · min · mL−1). Blood flow (mL · 100g−1 · min−1) was calculated from the ratio: (Cbrain/Integral) × 100.
Infarct measurement
To measure ischemic damage at 1 or 7 days (2 hours or 20 minutes, respectively) after MCA occlusion, the brains were removed from euthanized animals, and the cerebrum cut into five 2-mm-thick coronal slices that were stained with 2% 2,3,5-triphenyltetrazolium chloride (TTC). The slices were photographed with a millimeter scale and the images subsequently digitized. Infarct areas were obtained by digital planimetry of the slices using ImagePro software (Media Cybernetics, Silver Spring, MD, U.S.A.) and normalized for edema as described elsewhere (MacManus et al., 1999).
Alternatively, ischemic damage was monitored by similar measurement of areas in brain sections that had been stained for the neuronal-specific MAP2 (Endres et al., 1998; Katchanov et al., 2001; Matsushita et al., 1998). Briefly, sections of formalinfixed brains were incubated overnight with anti-MAP2 (1:100; Sigma), washed and incubated with Cy3-conjugated AffiniPure F(ab)2 fragment goat anti–mouse immunoglobulin G (1:200; Jackson ImmunoResearch Laboratory) for 4 hours. After washing, the section was mounted in Vectashield mounting medium (Vector Laboratories).
Motor function behavior
An expanded six-point scale was employed as described previously (Zausinger et al., 2000) to assess neurological deficits in motor function in the ischemic E2F1 wild-type and mutant mice. An individual blinded both to the genotype and the treatment made the assessments at 1 and 7 days of reperfusion.
Quantitative analysis of gene expression
Real-time quantitative PCR was performed using the ABI GeneAmp 5700 Sequence Detection System as described by the manufacturer (Applied Biosystems, Foster City, CA, U.S.A.). RNA was extracted from E2F1-mutant mice using the Trizol reagent (Invitrogen, Burlington, ON, Canada). A Superscript First-Strand Synthesis System for RT-PCR (Invitrogen) kit was used for cDNA synthesis according to the manufacturer's protocol with 5 μg of RNA. The primers were designed using Primer Express software version 2.0 (Applied Biosystems) as follows: β-actin (forward) 5′-GGCCAACCGTGAAAAGATGA, (reverse) 5′-CACAGCCTGGATGGCTACGTA; Hsp68 (forward) 5′-AAGAACGCGCTCGAGTCCTAT, (reverse) 5′-TTGTCAGCCTCGCTGAGCTT; p73 (forward) 5′-CAGAGCATGTGACCGACATTGT, (reverse) 5′-GGGCAGACTGTCCTTCATTGA. The uniqueness of the primers was verified by Blast-analysis against the mouse genome (ncbi.nlm.nih.gov).
A series of PCR reactions was performed on RNA isolated from the contralateral and ischemic brain hemispheres of littermate pairs of E2F1 +/+ and −/− mice in 25 μL using 2 ng input cDNA in 10 μL, 3.75 pmol primers (2.5 μL) and the SYBR Green PCR Master mix (12.5 μL) from QuantiTect SYBR Green PCR kit (Qiagen, Mississauga, Ontario, Canada). The PCR was for 40 to 45 amplification cycles with uracil removal (2 minutes at 50°C) and polymerase activation (15 minutes at 95°C). Each two-step PCR cycle contained denaturation (15 seconds at 95°C) annealing and extension (1 minute at 60°C). Amplification plots for Hsp68 mRNA are shown in Fig. 1A. In order to quantitate the transcript of interest, a standard curve was generated using a twofold dilution series of control total cDNA of each primer set. Triplicate data points were used for relative quantification of the specific mRNA using β-actin as the endogenous control. The data are presented relative to the contralateral hemisphere for each sample in Fig. 1B.
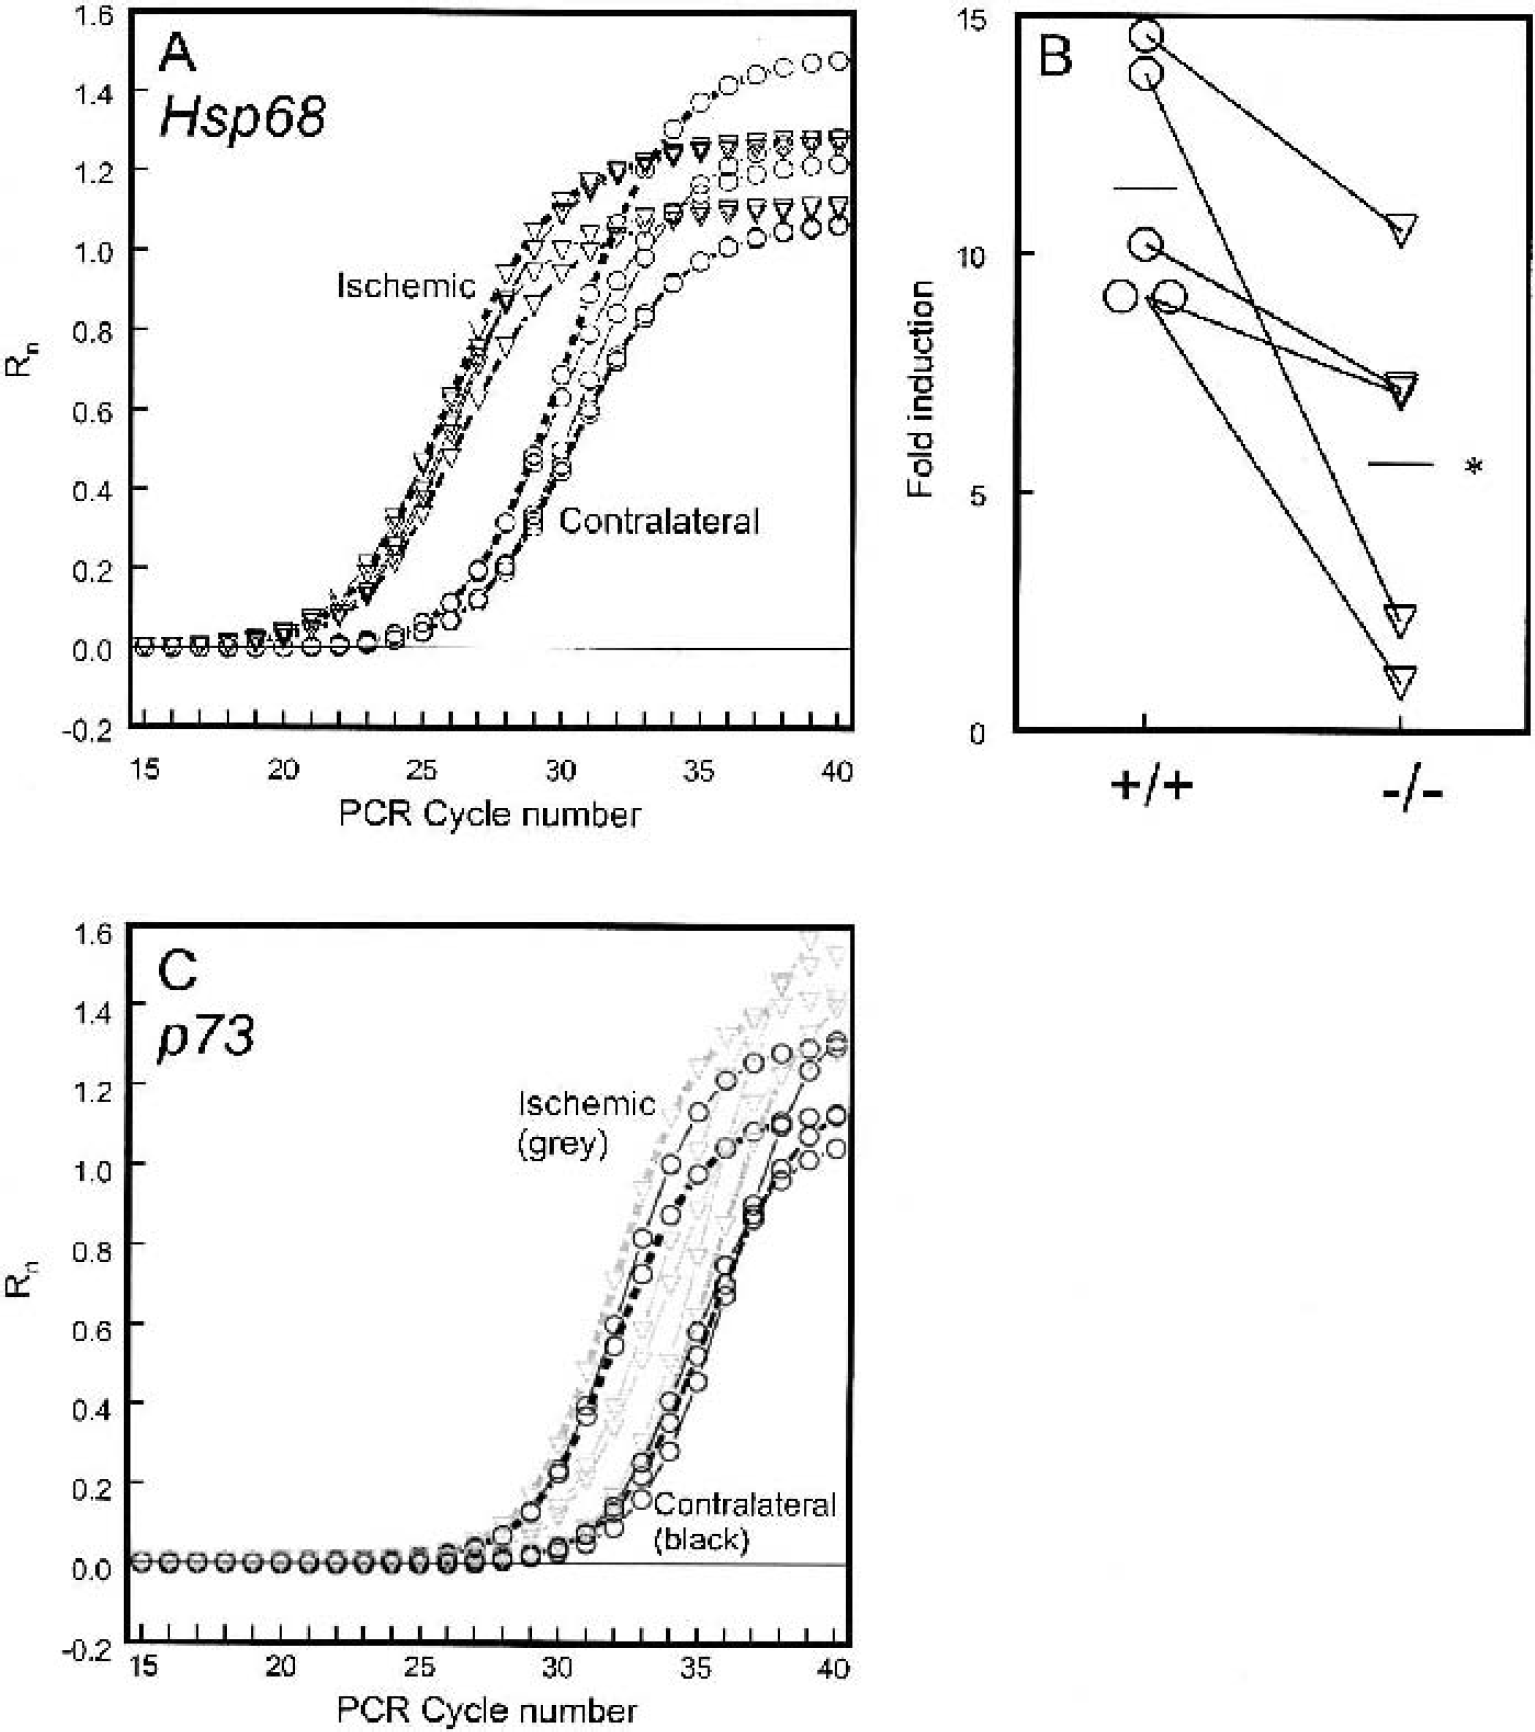
Decreased ischemia-induced expression of Hsp68 in E2F1-null mice compared with +/+ littermates measured by quantitative real-time PCR.
Statistical analysis
Comparisons of ischemic injury in the brains of homozygous (+/+), heterozygous (+/−) and null (−/−) mice were based on one-way analysis of variance with a Tukey-Kramer post-test. When comparisons were restricted to the two groups +/+ and −/−, a paired or unpaired Student's t-test was used as indicated. Analyses were performed using the InStat statistical package (GraphPad Software, San Diego, CA, U.S.A.).
RESULTS
After MCA occlusion, the E2F1 +/+ and −/− mutant littermates had similar decreased blood flow in the ischemic hemisphere compared with the contralateral hemisphere with no change in cerebellum or pons/medulla (Table 1). Other experiments showed that focal ischemia in wild-type or mutant littermates was not associated with any significant between-group difference in blood pressure, blood gases, or pH. The overall MCA territory, as visualized by perfusion with India ink (MacManus et al., 1999), was also similar in all groups of littermate mice (not shown).
Blood flow, blood gases, and physiologic parameters in E2F1 mutant mice
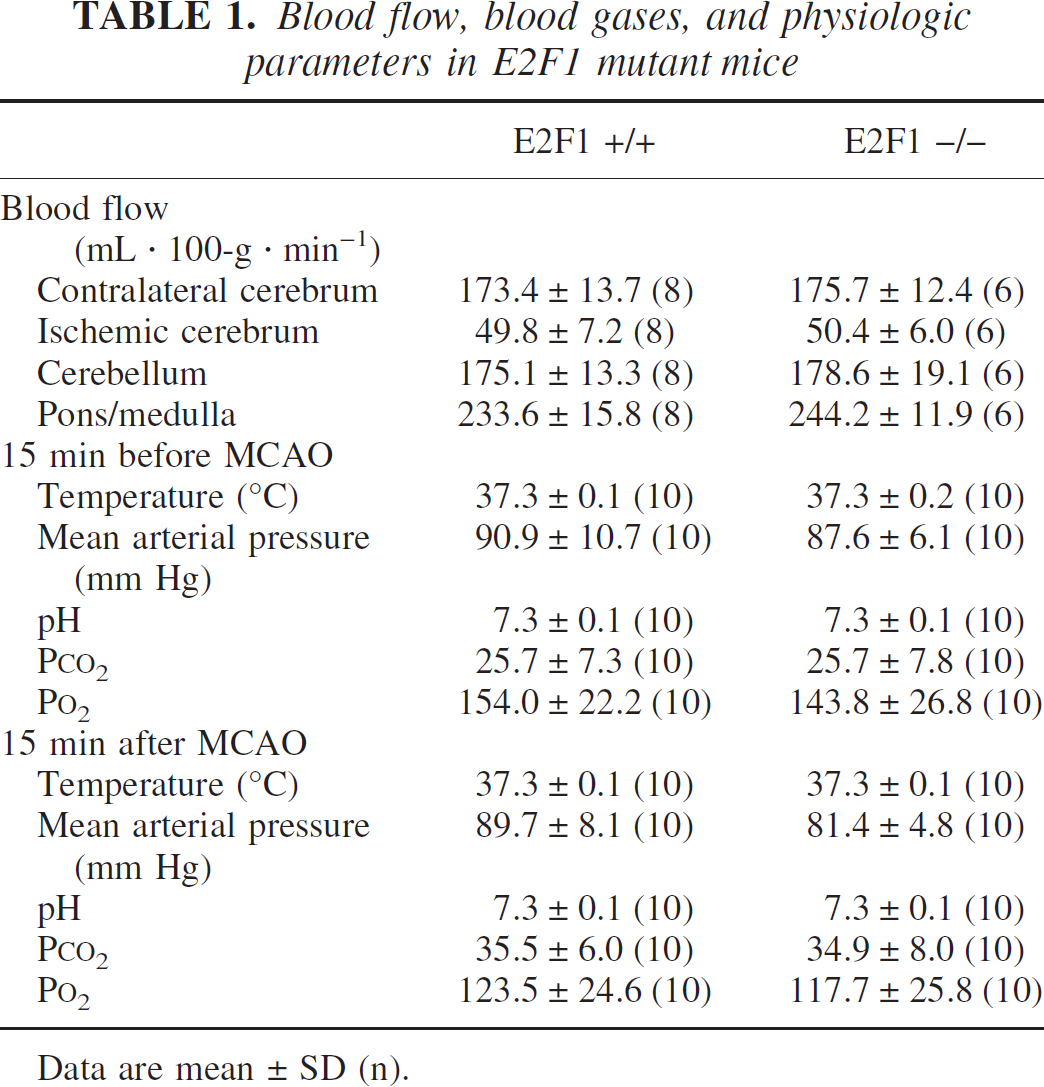
Data are mean ± SD (n).
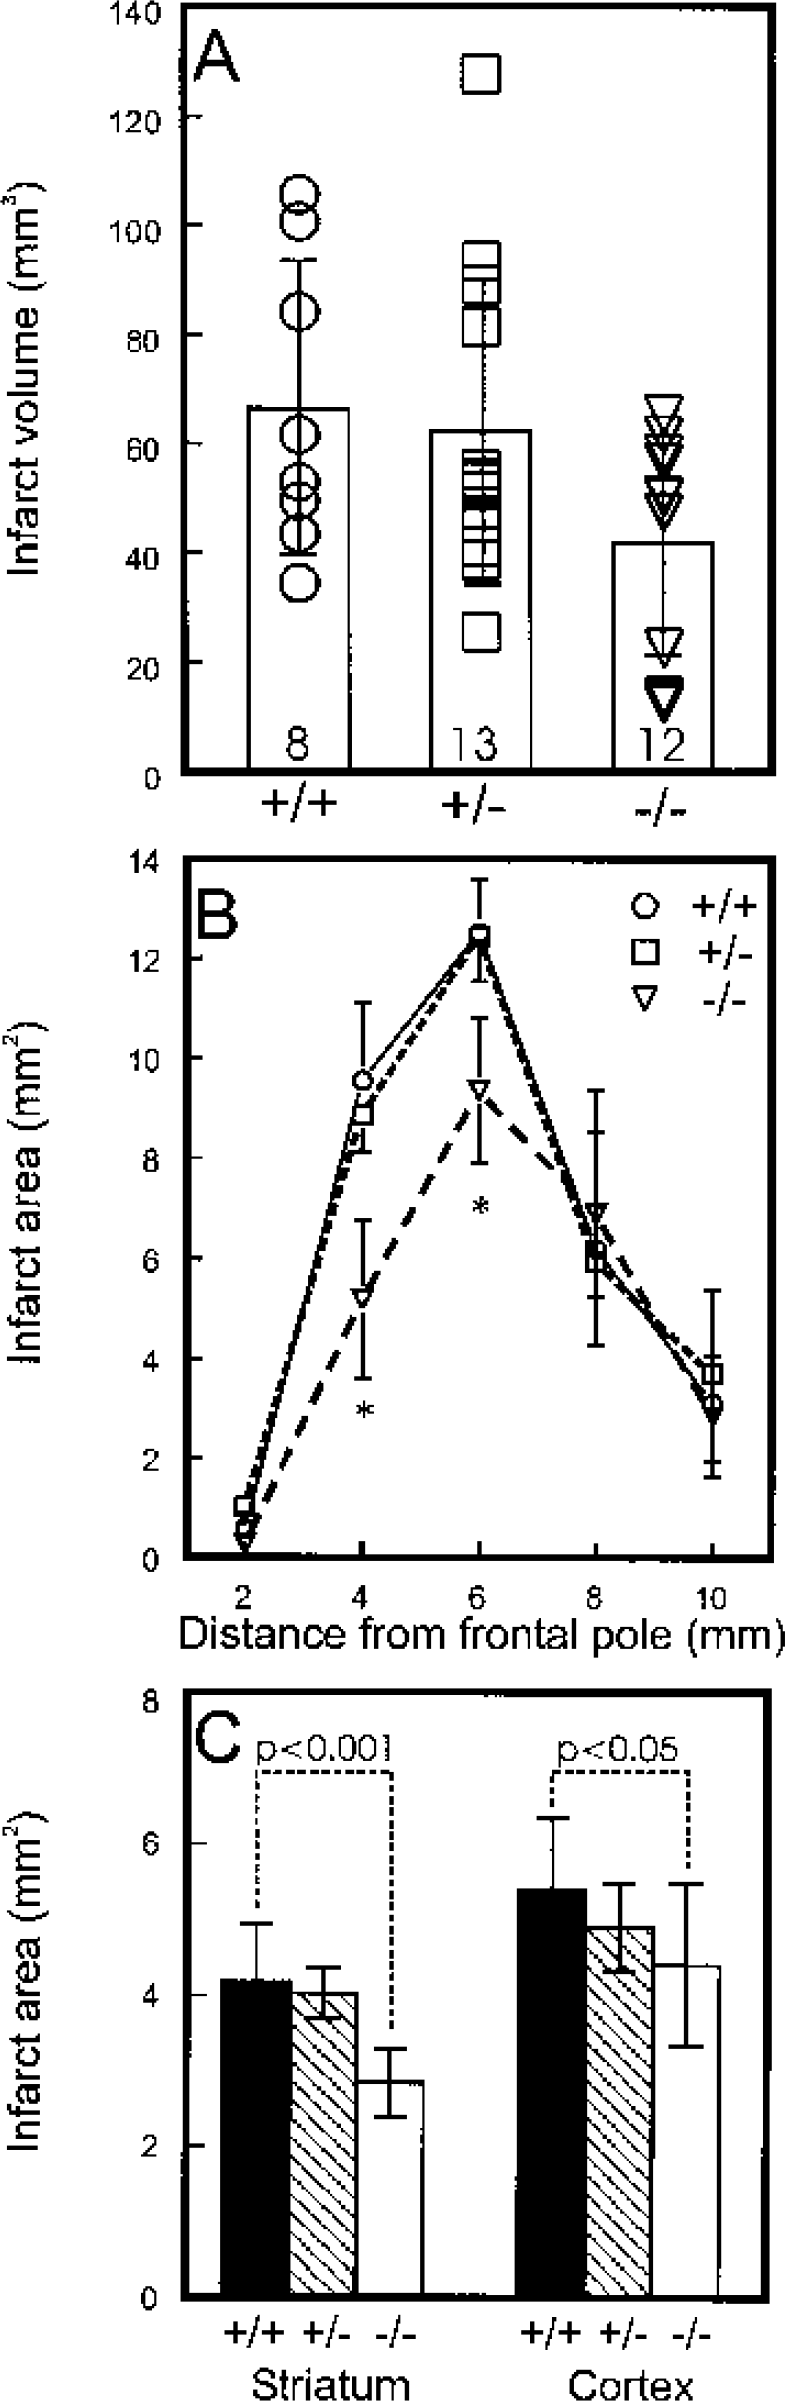
Having thus established that the E2F1 +/+ and −/− mice received the same relative depth and duration of ischemia, we proceeded to investigate the subsequent brain injury. After 2 hours of MCA occlusion and 1 day of reperfusion, a similarly sized infarct of 60 to 70 mm3 was measured in the left hemisphere of the brains of E2F1 +/+ and heterozygous +/− littermate mice, but a 33% smaller infarct (P < 0.05) was found in brains of E2F1-null homozygous animals (Fig. 2A). When individual coronal slices of brain from the ischemic littermates were examined, the decrease in infarcted tissue in the E2F1-null mice compared to +/+ and +/− animals was located primarily in the anterior and mid regions of the brain (P < 0.001) (Fig. 2B). In the slice where the maximum difference in infarcted tissue was found (i.e., 4 mm from the frontal pole), this decreased damage was discernable principally in striatum but also in cortex (Fig. 2C).
Severe ischemic insult.
The use of 2 hours of MCA occlusion was considered very severe and capable of partially masking the suggested resistance of E2F1-null animals to ischemic injury shown in Fig. 3. The alternate use of a much shorter 20-minute period of MCA occlusion followed by 7 days of reperfusion has been described and suggested to change the mode of cell death from severe necrosis to apoptosis (Du et al., 1996; Endres et al., 1998). We therefore repeated our study using this milder insult and a longer period of reperfusion. The final infarct volume produced at 7 days with the milder chronic ischemic insult was approximately one third that produced with the 2-hour occlusion (Fig. 3) and occurred principally in the striatum, although damage was also seen scattered throughout the cortex in about half of the animals (data not shown). Again, the E2F1 +/+ and +/− animals had similar volumes of affected tissue of 25 to 30 mm3, but the E2F1-null littermates had a much smaller infarct size, approximately 70% smaller than that seen in the wild-type or heterozygote ischemic mice (P < 0.001) (Fig. 3).
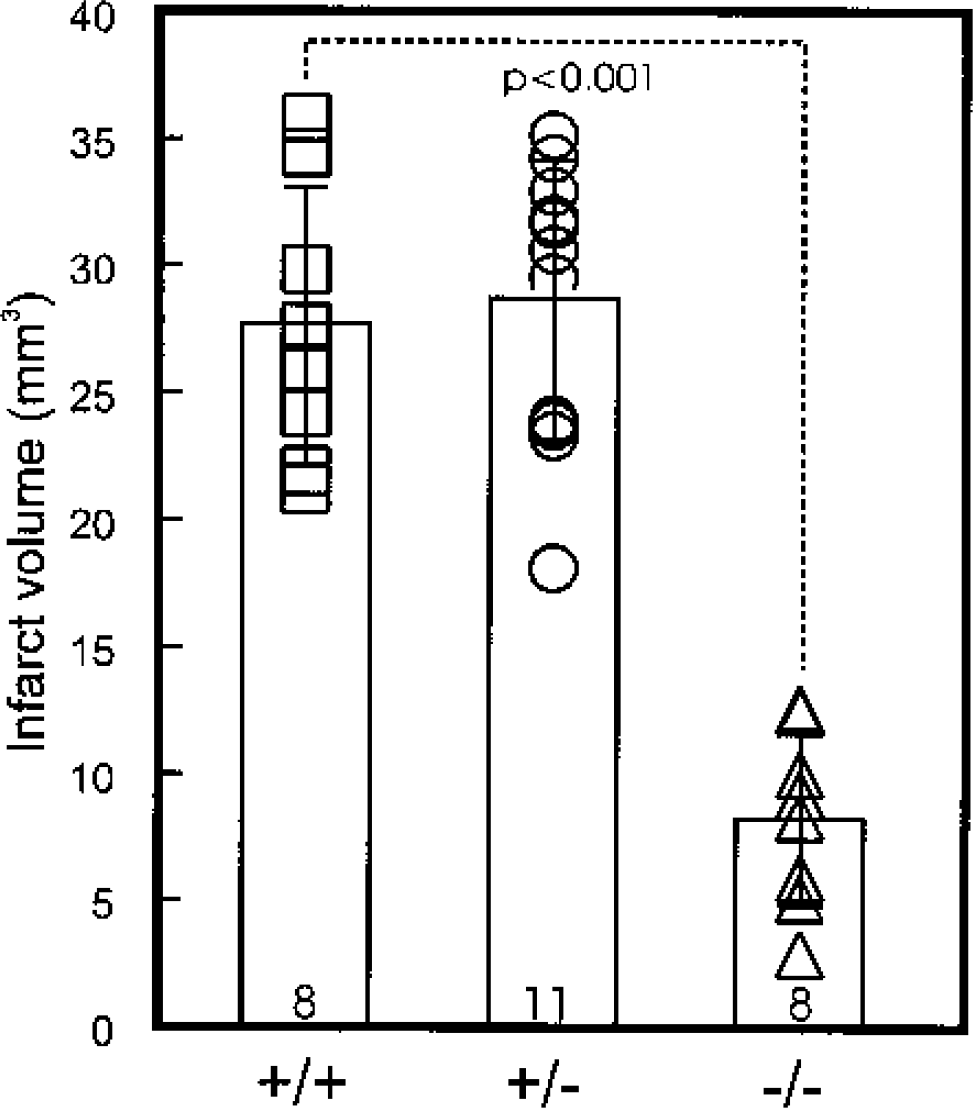
Mild ischemic insult. Decreased infarct volume at 7 days of reperfusion after 20 minutes of MCA occlusion in E2F1 −/− mice compared with wild-type and heterozygous littermates (mean ± SD; n = 8–11; P < 0.001 by analysis of variance with Tukey-Kramer analysis). Analysis of variance showed no difference between +/+ and +/− mice. Measurements of infarct volume in individual animals based on TTC staining are shown along with the number of animals analyzed.
In addition to this general delineation of infarcted tissue by the monitoring of decreased mitochondrial activity using TTC staining of brain slices, the influence of the absence of the E2F1 gene on ischemic brain damage was further studied at the cellular level using immunohistochemical visualization of various indicators of damage. We visualized the area of neuronal injury by immunohistochemical monitoring of the neuronal-specific MAP2 cytoskeletal protein combined with localization of cells with fragmented DNA (TUNEL) in ischemic brain sections. In brain sections at the level of the striatum where maximum infarction was observed, areas of MAP2-negative staining were seen principally in striatum but also in cortex in both E2F1 +/+ and −/− animals (Figs. 4A and 4B). This negative MAP2-stained area contained positive TUNEL staining, which indicated the presence of cells with nuclear DNA fragmentation. The intensity of TUNEL staining was not high enough to permit image capture and quantification at low magnification, but using a 10× microscopic objective, it was observed that the cells containing DNA fragments were confined to the MAP2-negative regions in both striatum and cortex of the ischemic hemisphere (Figs. 4 C–4E). When the area of MAP2-negative staining was measured in animals at 1 day of reperfusion after 20 minutes of MCA occlusion, a significantly smaller area of neuronal injury was observed in the E2F1 −/− mice compared to littermate controls (Fig. 4 F). This early MAP2 loss demarcated the final lesion size because there was no increase at 7 days of reperfusion in the +/+ mice (Fig. 4G). However, at this time the E2F1-null mice still had less injury compared with their +/+ littermates (Fig. 4G).
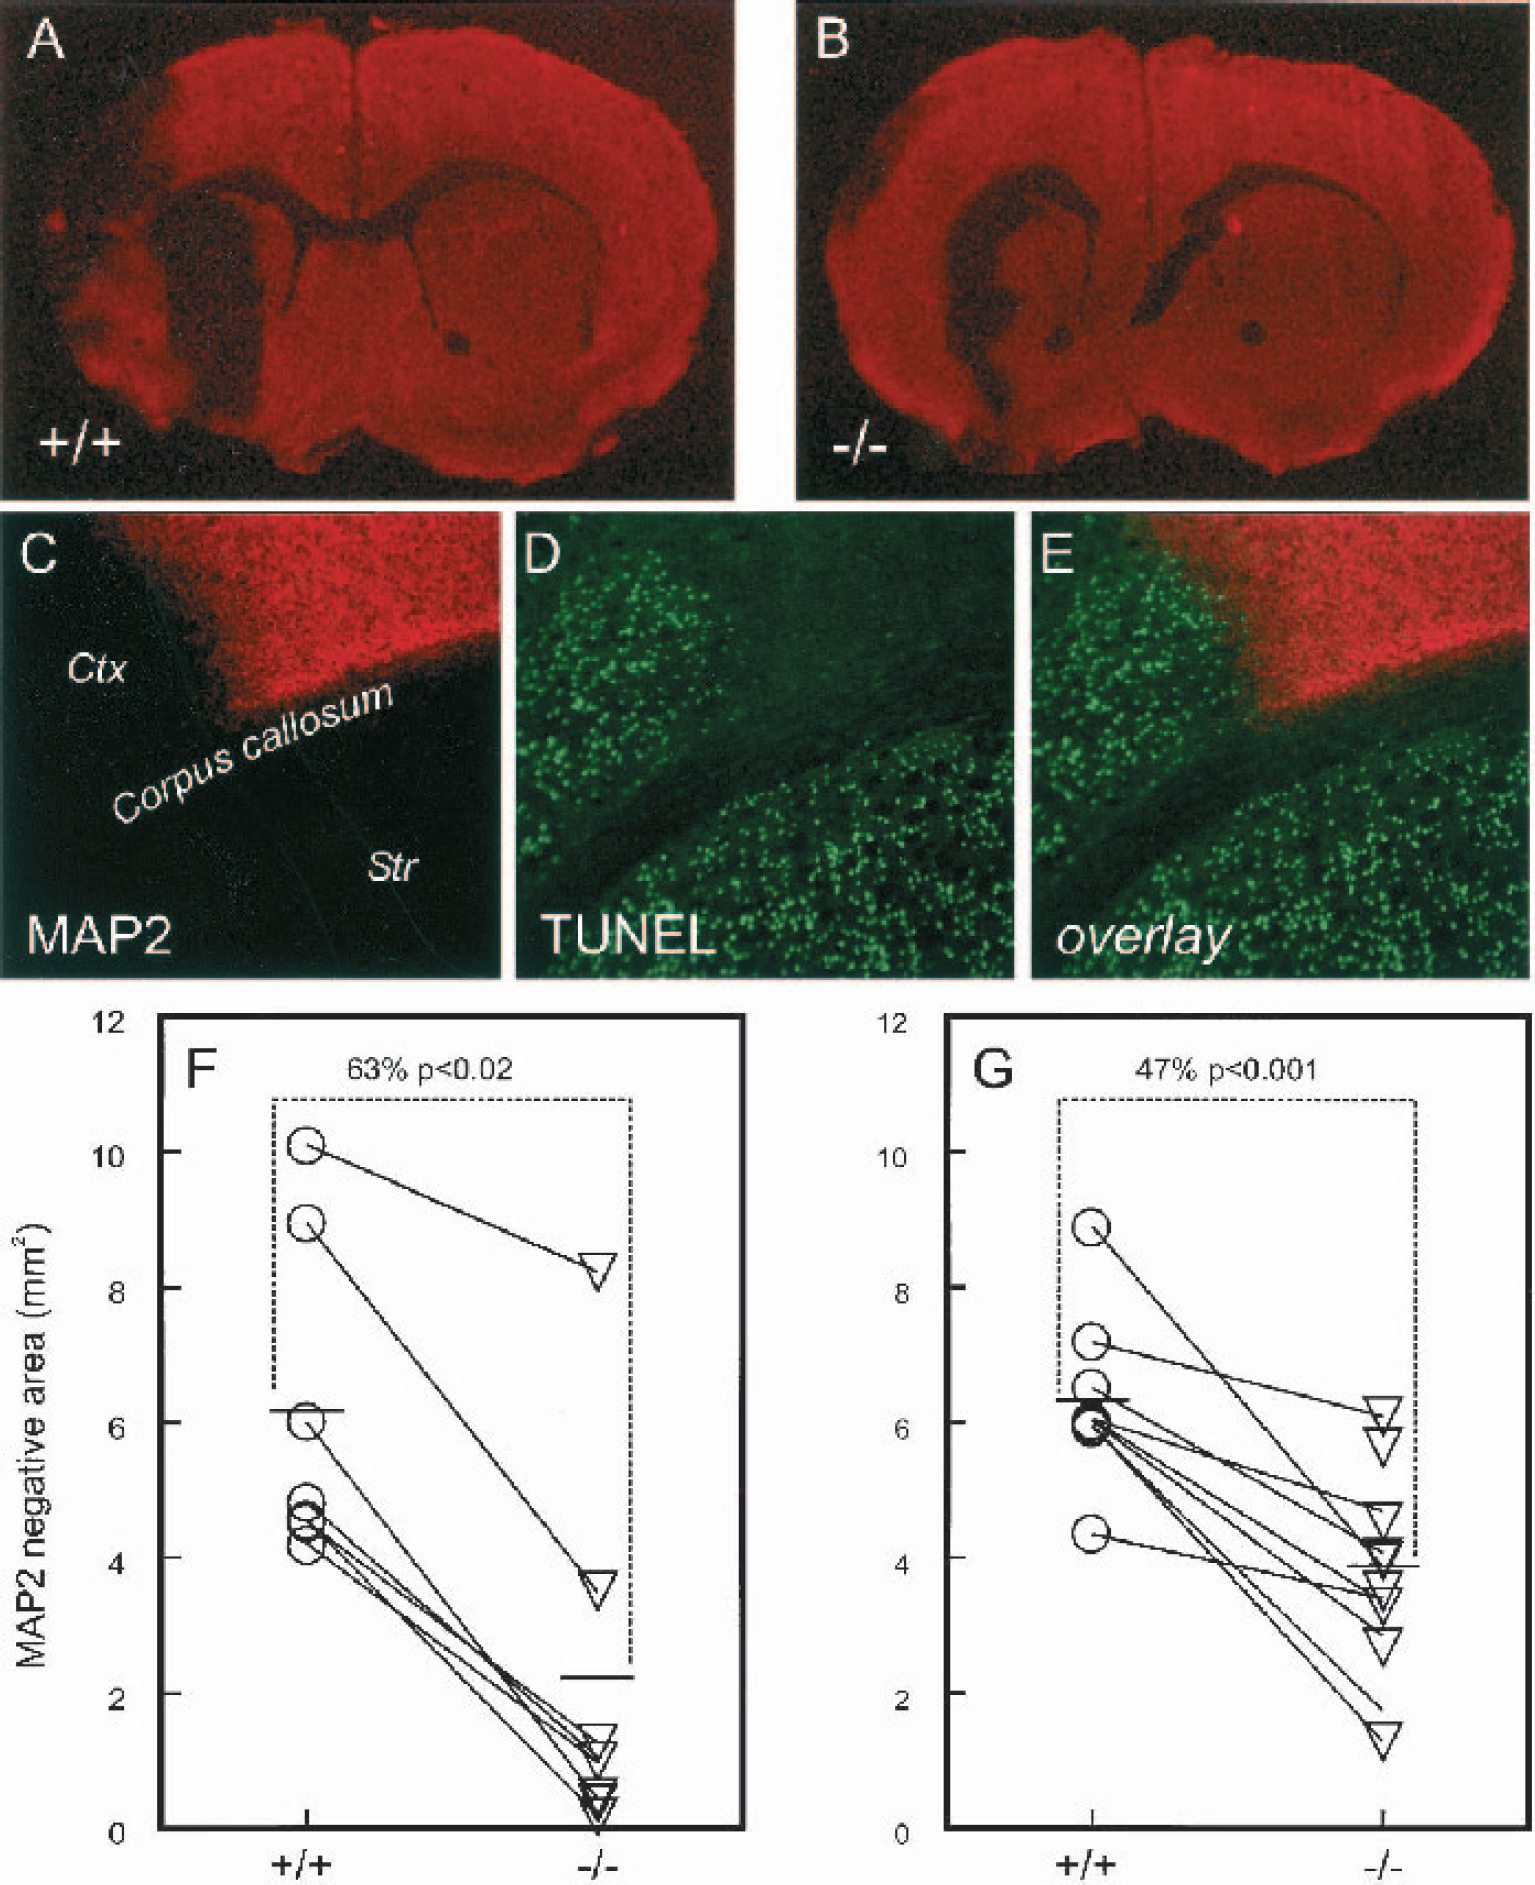
Decreased loss in littermate pairs of neuronal MAP2 staining after mild focal ischemia in the left hemisphere of E2F1-null mice compared with wild-type littermates.
We also undertook an assessment of neuronal function in these ischemic E2F1-mutant mice. Using a battery of six tests of motor function (Zausinger et al., 2000) both +/+ and −/− littermates were similarly impaired at 1 day of reperfusion after 20 minutes of MCA occlusion (Fig. 5). The neurologic score of both groups of animals showed the expected improvement by 7 days (Zausinger et al., 2000), but the E2F1 −/− mice improved significantly more (P < 0.01) than the wild-type mice and were only slightly impaired by that time (Fig. 5).
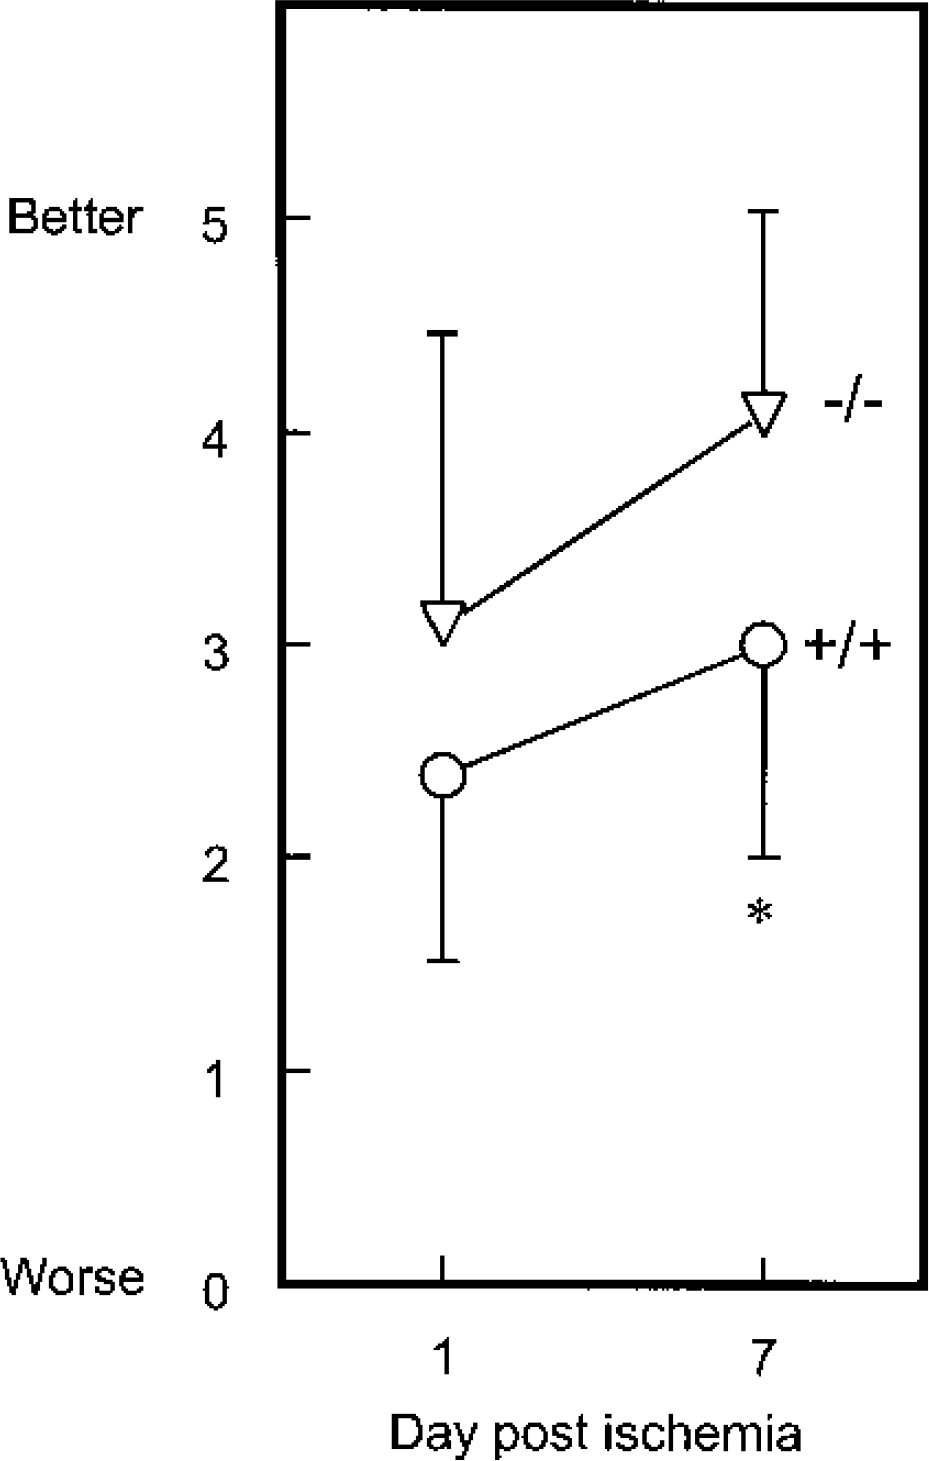
A less severe behavioral deficit was observed in ischemic E2F1-null mice compared with +/+ littermates at 1 and 7 days of reperfusion (mean ± SD; n = 11–13). Asterisk indicates a significant difference (P < 0.01, unpaired t-test) at 7 days. A six-point neurologic score (Zausinger et al., 2000) was used: 5 = extend both forelimbs when held by tail; 4 = flexion of contralateral forelimb; 3 = reduced resistance to lateral push; 2 = circling towards paretic side when pulled by tail; 1 = spontaneously circling; 0 = without spontaneous motion.
The molecular cause of the neuronal resistance to ischemia in the absence of the E2F1 transcription factor is not at all clear. The downstream target genes of this transcription factor are beginning to be catalogued with over 1,000 genes under consideration (Ma et al., 2002; Muller et al., 2001; Polager et al., 2002; Wells et al., 2002). Among them are the proapoptotic genes Apaf1, Arf, and p73, so we undertook an examination of the possible increase in expression of these transcripts after ischemia and their hypothesized attenuation in E2F1-null mice, which might explain the observed resistance. Using quantitative real-time PCR of the well-documented ischemia-induced Hsp68 transcript as a positive control, we found the expected shift left of about four PCR cycles with increased expression at 24 hours after 20-minute MCA occlusion in the RNA from the ischemic hemisphere compared with the contralateral hemisphere (Fig. 1A). The shift corresponded at the threshold cycle to a 10- to 15-fold increase in Hsp68 expression in E2F1 +/+ mice (Fig. 1B). This ischemia-induced increase in Hsp68 was reduced by half in the E2F1-null animals (Fig. 1B). Unfortunately, in these same RNA samples we could not detect any increase in either the p73 transcript (Fig. 1C) or the transcripts for Apaf1 or Arf (data not shown) after MCA occlusion in our model. Thus, we were unable to support our hypothesis that blunted proapoptotic E2F1-target gene expression is responsible for resistance to injury in E2F1 −/− mice.
DISCUSSION
The E2F1 transcription factor in partnership with the retinoblastoma protein Rb is central in the control of the cell cycle, response to DNA damage, and modulation of differentiation and apoptosis (Ginsberg, 2002; Phillips and Vousden 2001). However, the deletion of the gene encoding E2F1 causes no major perturbation in mouse reproduction, development, or gene expression, perhaps because of redundancy in the protein family, which has five other members (Cooper-Kuhn et al., 2002; Field et al., 1996; Wells et al., 2002). In addition to the previously cited evidence from cultured neurons indicating a role for E2F1 in cell death of these postmitotic cells, there is also evidence from animal studies that this transcription factor is active in brain. For example, increased free E2F1 caused by mutation in its binding partner Rb leads to massive neuronal apoptosis during development (Jacks et al., 1992; Lee et al., 1992; MacLeod et al., 1996). The mRNA encoding the transcription factor E2F1 increases in brain after either focal (Hou and MacManus, unpublished observations, 2001) or global (Jin et al., 2001) ischemia. In addition, increased E2F1 protein levels have been noted after focal ischemia (Osuga et al., 2000), and also in brain from patients with Down syndrome (Motonaga et al., 2001). Another potential cause of increased free E2F1 after cerebral ischemia is increased activity of cyclin-dependent kinases (CDK4/6) as seen by increased phosphorylation of Rb after ischemia (Hayashi et al., 2000; Osuga et al., 2000). This increased kinase activity could occur via the action of increased cyclin D1, which has been reported in both focal (Katchanov et al., 2001; Li et al., 1997; Osuga et al., 2000) and global ischemia (Timsit et al., 1999), although involvement of cyclin D1 has been questioned after global ischemia (Small et al., 2001). Another cause for increased CDK4/6 kinase activity could be the postischemic destruction of kinase inhibitors such as p16INK4a (Katchanov et al., 2001).
All of the above discussion would suggest that a resistance to ischemic injury would occur in E2F1-null mice. Indeed, our finding of attenuated ischemic damage in E2F1-null mice compared with their littermate controls (Figs. 2 and 3) is in agreement with our preliminary observations in outbred mice (MacManus et al., 1999), and includes the inexplicable lack of resistance to damage in the hindmost areas of the brain (Fig. 2B). This decreased damage in littermates does not appear attributable to differences in cerebral perfusion nor physiologic parameters such as blood pressure or blood gases (Table 1). The resistance to ischemic injury is greater after a brief ischemic episode (20 minutes) (Fig. 3) compared to the standard more severe 2 hours of MCA occlusion (Fig. 2A). A loss of immunohistochemical staining for the cytoskeletal neuronal protein MAP2 has been described as an early indicator of neuronal injury after either global (Small et al., 2001; Yagita et al., 1999) or focal ischemia (Li et al., 1997; Matsushita et al., 1998), and this loss has been observed in mice after mild focal ischemia (Endres et al., 1998; Katchanov et al., 2001). In our current study, the decreased ischemic damage in E2F1-null mice was also reflected in a smaller loss of neuronal MAP2 staining as early as 1 day of reperfusion (Fig. 4F). Areas depleted of MAP2 have been reported to contain cells with DNA fragments as seen by TUNEL staining after global (Yagita et al., 1999) or focal (Katchanov et al., 2001) ischemia. After the 20 minutes of focal ischemia in our present study, we observed increased TUNEL-positive cells at 7days of reperfusion in the area of negative MAP2 staining (Figs. 4C–4E). This increase in neurons with DNA fragmentation was also attenuated in the E2F1-null ischemic mice. Some investigators claim that the mild ischemia produced by 20 to 30 minutes of MCA occlusion results in delayed neuronal death at 7 days of reperfusion that has more apoptotic characteristics than the more severe 2 hours of occlusion, which leads to a massive necrotic lesion (Du et al., 1996; Endres et al., 1998; Katchanov et al., 2001). Thus, the greater ability of E2F1 loss to attenuate damage after the mild ischemic episode compared with the prolonged 2-hour period could be considered due to a different mode of cell death. However, our data do not support such a difference because we have not observed a qualitative difference between the cell death after mild versus severe ischemia in mice that would indicate a more apoptotic form after 20 minutes of ischemia using any of the apoptotic criteria, such as DNA fragmentation (MacManus and Rasquinha, 2000). Whatever the mode of cell death, the decrease in the extent of infarction and neuronal loss in the absence of the E2F1 transcription factor did manifest itself in the E2F1-null ischemic mice as a less severe behavioral impairment than littermate controls (Fig. 5).
There are three potential mechanisms described whereby E2F1 may modulate the cell death pathway: induction of proapoptotic genes, stabilization of the proapoptotic transcription factor p53, and inhibition of antiapoptotic signaling (Ginsberg, 2002; Phillips and Vousden, 2001), which may include derepression of target genes (Liu and Greene, 2001). The most debated proapoptotic E2F1-target genes at the moment are the transcription factor p73 and scaffolding protein Apaf1, which is involved in the formation of the caspase proteolytic machinery (Ginsberg, 2002). There are, as yet, no indications in genome-scale gene expression profiling studies after focal cerebral ischemia of increases in p73 or Apaf1 (Bates et al., 2001; Hayashi et al., 2003; Keyvani et al., 2002; Rao et al., 2002; Soriano et al., 2000; Tang et al., 2002; Trendelenburg et al., 2002), but of course activation of caspase-3 and subsequent neuronal apoptosis has been widely implicated in both global and focal cerebral ischemia (Graham and Chen, 2001; Hou and MacManus, 2002; Read et al., 2001). In addition, several studies have identified p19-Arf as an E2F1-target gene, and stabilization of the proapoptotic transcription factor p53 by decreased interaction with mdm2 is a definite possibility for the death-inducing actions of E2F1 (Ginsberg, 2002; Phillips and Vousden, 2001). Despite our ability to quantitate changes in Hsp68, we found no evidence of increases in the E2F1-target genes p73, Apaf1, or p19-Arf after cerebral ischemia (Fig. 1) and were thus unable to come to any mechanistic conclusion. The current estimate of the existence of over 1,200 E2F1-target genes (Ma et al., 2002; Muller et al., 2001; Polager et al., 2002; Wells et al., 2002) leaves many possibilities for future study, but it is a disappointment that of the 80 genes that could be traced from these reports via the gene symbol identifier in the public databases (source.stanford.edu) to their rodent homologues, only casp3 appears on the combined list of several hundred of genes that have been found to increase after ischemia (Hayashi et al., 2003; Jin et al., 2001; Keyvani et al., 2002; Rao et al., 2002; Schmidt-Kastner et al., 2003; Tang et al., 2002; Trendelenburg et al., 2002). We have preliminary microarray results showing that differences in several hundred transcripts can be found in ischemic E2F1 +/+ mice compared with E2F1 −/− mice (Hou and MacManus, 2002), but only two genes are on published E2F1-target lists: Fst (Muller et al., 2001) and Tieg (Polanger et al., 2002). Several of our putative E2F1 responsive genes in ischemic brain have already been noted after cerebral ischemia: Fgf1 and Madh1 (Hayashi et al., 2003); Itm2b (Trendelenburg et al., 2002); Lif (Bates et al., 2001); Nfya, Ifnar2 and Ptx3 (Schmidt-Kastner et al., 2003); Nos3 (Tang et al., 2002); and Tnfrsf1a and Il1b (Rao et al., 2002). The identification of these genes as downstream targets of E2F1 would be novel. The lack of noteworthy overlap between these gene lists suggests that more sophisticated experiments at the genome level will be necessary to identify E2F1 targets relevant to stroke damage, perhaps by microarray analysis (preferably using DNA chips with complete genome coverage) combined with immunoselection of target genes as has been described in cancer cells (Wells et al., 2002).
However, an intriguing alternate whereby E2F1 could modulate apoptosis has been proposed that possibly could render moot any consideration of these transcriptional mechanisms, that is, the inhibition of antiapoptotic signaling (Phillips et al., 1999). It has been reported that E2F1 can induce apoptosis without transcriptional transactivation in several cultured cell types (Hsieh et al., 1997; Phillips et al., 1997, 1999), including neurons (Hou et al., 2001a,b). Interference with the antiapoptotic signaling involving nuclear factor κB has been described as the means whereby E2F1 acts in such a direct way (Phillips and Vousden, 2001), and we have obtained some evidence to support this idea in dopamine evoked apoptosis in cultured cerebellar granule neurons (Hou et al., 2001a,b). Thus, it is fair to say that emphasis on apoptosis may be misplaced and that E2F1 may influence oxidative stress, glial activation, or leukocyte infiltration.
All of the above potential mechanisms whereby E2F1 might influence the cell death pathway are not necessarily mutually exclusive, and may indeed be interdependent (Ginsberg, 2002). Whether such mechanisms are at work in ischemic brain, or in injured cultured neurons, must await further work. It is hoped that publication of the ongoing gene expression profiling studies after cerebral ischemia will show the way towards pinpointing the death-promoting actions of E2F1 in brain.
Footnotes
Acknowledgments:
The authors thank Jack Daoust and his team for animal management.