
Abstract
Studies of gene expression changes after cerebral ischemia can provide novel insight into ischemic pathophysiology. Here we describe application of restriction-mediated differential display to screening for differentially expressed genes after focal cerebral ischemia. This method combines the nonredundant generation of biotin-labeled fragment sets with the excellent resolution of direct blotting electrophoresis, reliable fragment recovery, and a novel clone selection strategy. Using the filament model in mouse with 90 minutes MCA occlusion followed by 2, 6, and 20 hours reperfusion, we have compared gene expression in sham-operated animals to both the ipsi- and contralateral forebrain hemisphere of ischemic mice. Our screening method has resulted in the identification of 70 genes differentially regulated after transient middle cerebral artery occlusion (MCAO), several of which represent unknown clones. We have identified many of the previously published regulated genes, lending high credibility to our method. Surprisingly, we detected a high degree of correspondent regulation of genes in the nonischemic hemisphere. A high percentage of genes coding for proteins in the respiratory chain was found to be up-regulated after ischemia, potentially representing a new mechanism involved in counteracting energy failure or radical generation in cerebral ischemia. One particularly interesting gene, whose upregulation by ischemia has not been described before, is pip92; this gene shows a rapid and long-lasting induction after cerebral ischemia. Here we demonstrate that pip92 induces cell death in primary neurons and displays several hallmarks of pro-apoptotic activity upon overexpression, supporting the notion that we have identified a novel pathophysiological player in cerebral ischemia. In summary, restriction-mediated differential display has proven its suitability for screening complex samples such as brain to reliably identify regulated genes, which can uncover novel pathophysiological mechanisms.
Changes in gene expression after cerebral ischemia have become a major focus of interest in the research community, since many regulated genes have been shown to be of functional importance in various aspects of stroke pathophysiology. Important transcription factors such as c-jun and NF-κB have been demonstrated to respond to ischemic insults and determine outcome, particularly by influencing neuronal cell death (Herdegen et al. 1998; Schneider et al. 1999). However, attempts to systematically approach transcriptional changes after cerebral ischemia are still a difficult and costly undertaking. Reasons for this are the high number of different transcripts in the brain with its many cell types, the broad range in abundance of transcripts, and the fact that the amount of available biological material is often quite limiting. The experimental concepts currently in use can be roughly grouped into subtractive hybridization (e.g., (Diatchenko et al., 1996), array hybridization (Schena et al. 1995; Lockhart et al. 1996), tag sequencing (Lee et al. 1995; Velculescu et al. 1995; Brenner et al. 2000), and fragment display (Liang and Pardee 1992; Welsh et al. 1992; Fischer et al. 1995) (for review, see (Scheel et al. 2002)). Table 1 gives a simplified overview on the main techniques.
Overview of different techniques for transcriptional profiling
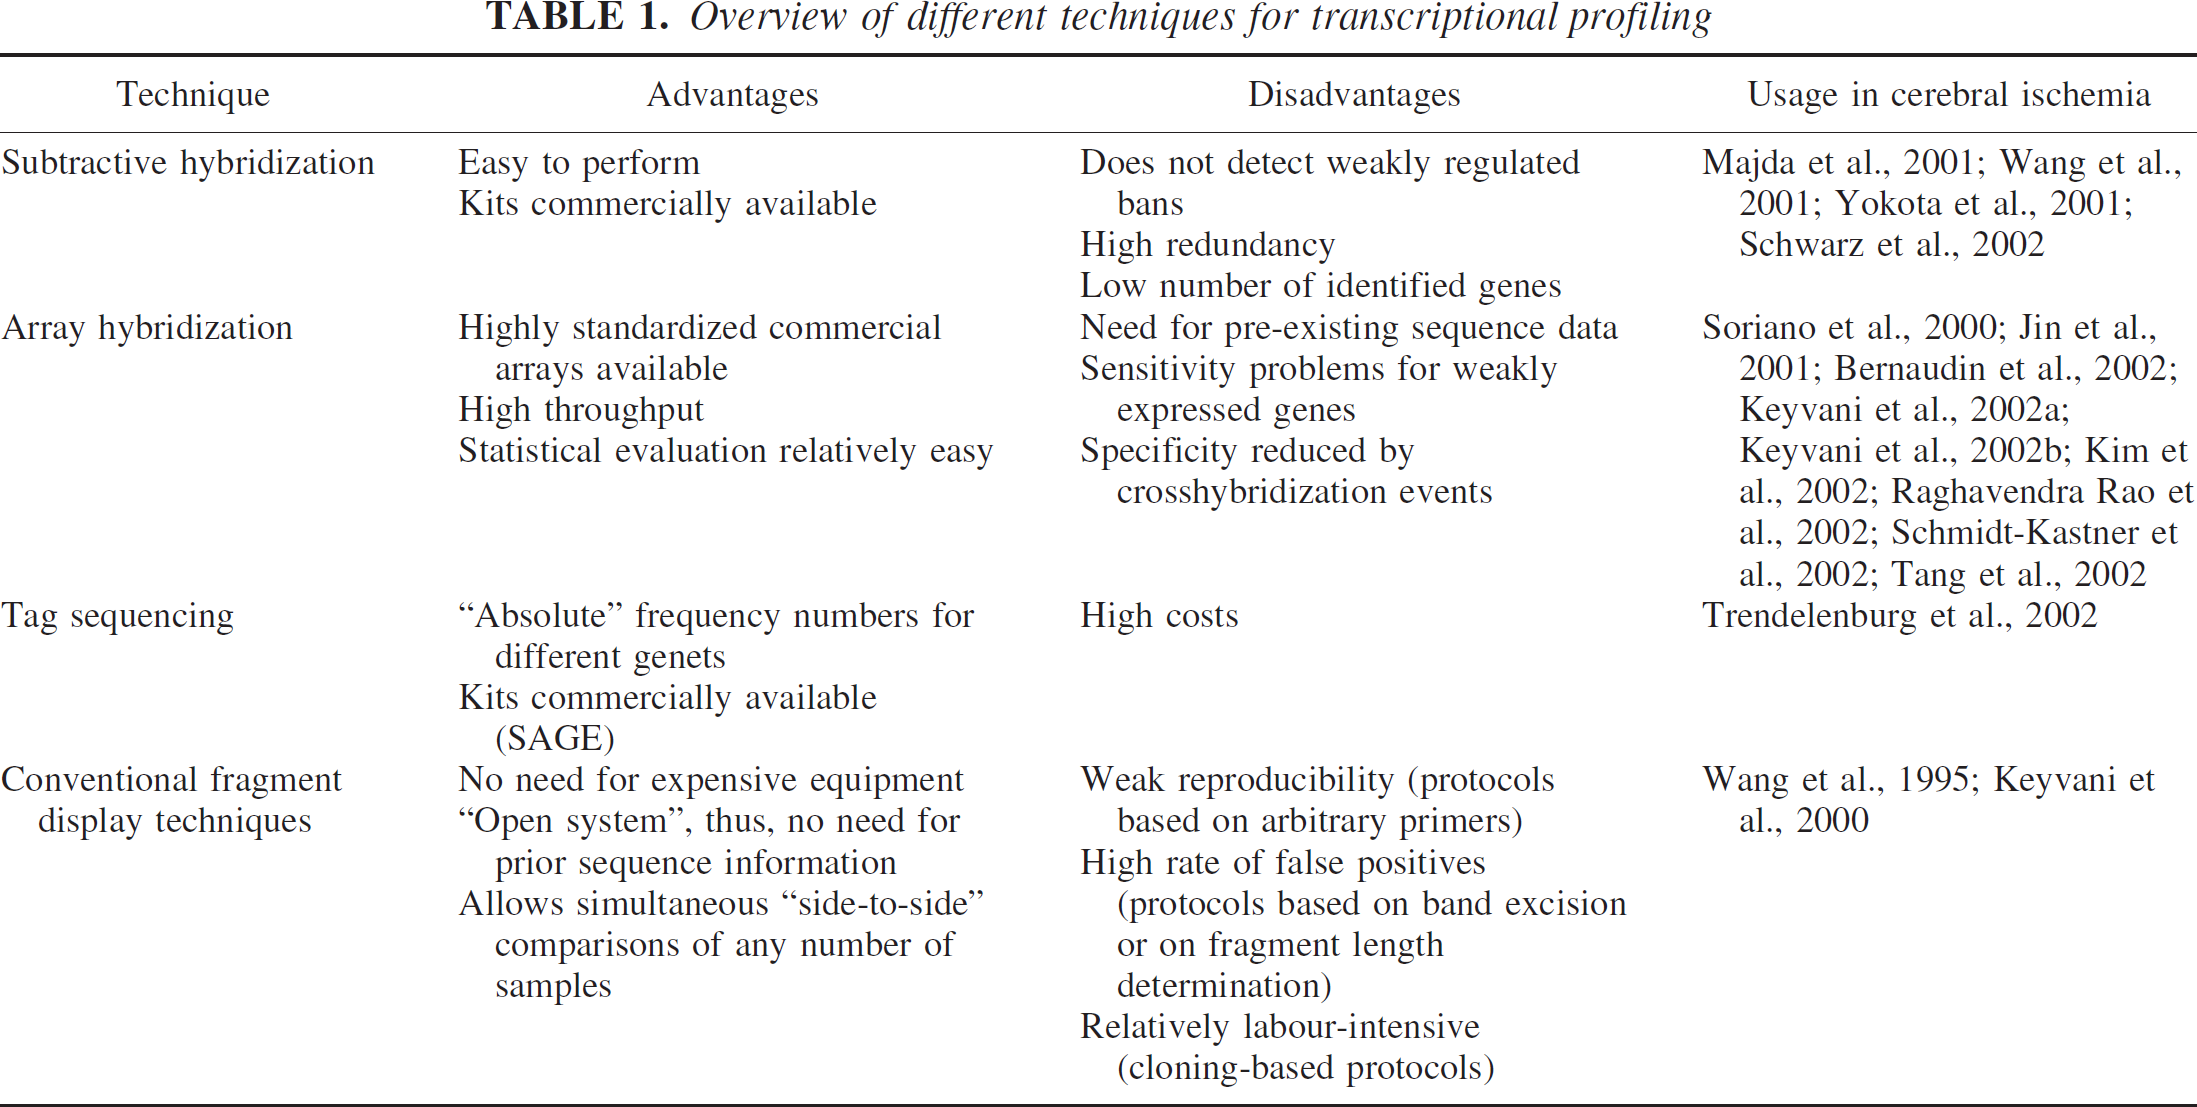
One of the most comprehensive studies using microarrays in ischemia relied on the established oligonucleotide arrays made by Affymetrix (Soriano et al. 2000). Drawbacks here are the need for pre-existing sequence data for DNA array design, which limits the use of this method as a true discovery tool. In addition, because of the high cost of arrays, the technique is unaffordable for many laboratories, and sensitivity problems with rare transcripts exist.
Fragment display techniques such as differential display (Liang and Pardee 1992) or RNA arbitrarily primed PCR (Welsh et al. 1992) originally relied on the generation of arbitrarily primed amplification products, each representing a particular transcript, and subsequent comparison of band patterns. Unfortunately, in practice, the application of these protocols led to considerable “differential dismay” (Debouck 1995). After the introduction of restriction enzymes for fragment display (Fischer et al. 1995), several strategies were published (Fischer 1995; Prashar and Weissman 1996) that overcame the above limitations, at least in part. However, none of the methodologies reported so far offers a convincing strategy to cope with what seems to be the major source of false positives, namely, the isolation and identification of bands of interest. Approaches to eliminate this step by defining fragment signatures and performing database searches (Shimkets et al. 1999; Sutcliffe et al. 2000) are hampered by the influence of base composition on the electrophoretic mobility of a DNA strand, which introduces considerable inaccuracies when fragment sizes are to be determined, and they are unsuitable for organisms molecularly less well characterized than man or mouse.
Here, we present the application of a display-based technology that we have named restriction-mediated differential display (RMDD), which solves several fundamental obstacles inherent to current differential display-related protocols.
We present data from a transient MCAO paradigm, which we analyzed at various reperfusion times (2, 6, and 20 hours). For each time point, gene expression was compared between the forebrain hemisphere of sham-operated animals, and of the ipsi- and contralateral hemisphere of ischemic mice. This permitted us to also identify genes that show bilateral gene expression changes after MCAO. We discovered 70 regulated genes after ischemia, virtually all upregulated. We verified the regulation of a number of genes by quantitative PCR. Among the genes identified are several that might provide new insights into pathophysiological mechanisms during cerebral ischemia.
Pip92 / ier2 is an example of a gene that is induced as early as 2 hours after the start of reperfusion and that shows sustained activation for up to 20 hours of reperfusion. This gene was originally identified as an immediate-early gene induced by growth factors in fibroblasts (Charles et al. 1990). We demonstrate here that pip92 induces cell death in primary neurons and displays a number of hallmarks characteristic of apoptosis. We therefore propose that pip92 is an interesting novel factor in ischemic pathophysiology due to its sustained activation and pro-apoptotic activity.
MATERIALS AND METHODS
Tissue samples
MCAO was performed using the filament model as described previously (Herrmann et al. 2003) with 8–0 nylon filaments (Dermalon®, Braun-Dexon, Spangenberg, Germany) coated with Xanthopren (Xanthopren M Mucosa®, Heraeus Kulzer, Dormagen, Germany). MCAO was monitored using laser Doppler flowmetry (Periflux4000, Perimed, Stockholm, Sweden). Inhalation anesthesia with halothane (1%) and N2O/O2 (70%/30%) was used. During surgery a body temperature of 37°C was maintained, with the mice on a heating pad. For laser Doppler measurements, the probe (P415–205; Perimed, Järfälla, Sweden) was placed 3 mm lateral and 6 mm posterior to the bregma. Relative perfusion units were determined (Periflux 4001; Perimed, Järfälla, Sweden). After 90-minutes occlusion with a drop of more than 80% in the laser Doppler signal, the filament was withdrawn carefully, and brains were reperfused for 2, 6, or 20 hours. Mice were perfused transcardially with Hanks balanced salt solution (HBSS); the brains were immediately removed and frozen on dry ice. After removal of cerebellum, brain stem, and olfactory bulb, the forebrains were halved and processed for RNA. The left hemisphere is always the ischemic one.
All animal experiments followed ethical standards, and protocols were approved by the respective government authorities.
RNA preparation
RNA was initially prepared from forebrain hemispheres by a guanidinium-isothiocyanate acid-phenol extraction (Chomczynski and Sacchi 1987), after homogenizing the tissue with an Ultraturrax T25 (Ilka Labortechnik, Staufen, Germany). This step was followed by further purification using RNAeasy columns (Qiagen, Hilden, Germany). RNA concentrations were determined by photometric measurements (DU640, Beckman Coulter, Fullerton, USA) and samples were stored at −80°C until used. For the following analyses, RNA was pooled from four independent animals for each sample and reperfusion time point (ischemic, contralateral, and sham; 2, 6, and 20 hours).
cDNA preparation
Of the total RNA 20 μg was reverse transcribed in a 50-μl reaction containing 200 U Superscript II Reverse Transcriptase (Invitrogen, Karlsruhe, Germany), 1 ϗ Superscript buffer and 1.5 μl of 10 μM cDNA primer CP28V (5'-ACC TAC GTG CAG ATT TTT TTT TTT TTT TV-3'), for 1 hour at 42°C. After completion, 48 μl 5 ϗ second-strand buffer (94 mM Tris-Cl pH 6.9, 453 mM KCl, 23 mM MgCl2, 50 mM (NH4)2SO4), 148 μl H2O, 3.6 μl dNTPs, 1.8 U RNase H (Promega, Mannheim, Germany), and 60 U E. coli DNA polymerase I (New England Biolabs, Frankfurt, Germany) were added and second-strand synthesis was performed for 2 hours at 22°C. After incubation for 20 minutes at 75°C, reactions were extracted with phenol/chloroform and cDNA was precipitated with 14% PEG 8000 (Promega, Mannheim, Germany)/ 4.1 mM MgCl2.
RMDD
cDNAs were digested with MboI (Stratagene Heidelberg, Germany), purified with phenol/chloroform, and precipitated with ethanol, and the pellets were resuspended in ligation mixes, containing 1.2 μl of 10 ϗ ligation buffer (Roche Diagnostics, Mannheim, Germany), 2 μl 10 mM ATP (Roche Diagnostics), 4 μg linker ML2025 (prepared by annealing oligonucleotides ML20 (5'-TCA CAT GCT AAG TCT CGC GA-3’ and LM25 (5'-GAT CTC GCG AGA CTT AGC ATG TGA C-3') in 1 ϗ ligation buffer), and 1 U T4 DNA ligase (Roche Diagnostics) in a total volume of 20 μl. After incubation overnight at 16°C, ligations were extracted with phenol/chloroform and precipitated with 14% PEG 8000/1.8 mM MgCl2. Pellets were resuspended in 40 μl of 1x TE (10 mM Tris-Cl pH 8.0/1 mM EDTA). For the first round of amplification, 2 μl of each ligation mix was used in a 20-μl PCR containing 1 ϗ PCR buffer (67 mM Tris-Cl pH 8.8, 17 mM (NH4)2SO4, 0.1% Tween 20), 1.5 mM MgCl2, 200 μM dNTPs, 1 U AmpliTaq polymerase (Perkin-Elmer, Boston, USA), and 0.4 μM each of anchor primer CP28X (5'-ACC TAC GTG CAG ATT TTT TTT TTT TTT TX-3’ [X = A, C, or G]) and linker primer ML19Z (5'-TGC TAA GTC TCG CGA GAT CZ-3’ [Z = A, C, G, or T]). After 25 cycles of first-round PCR (denaturation for 20 seconds at 94°C, annealing for 30 seconds at 65°C, and extension for 4 minutes at 72°C), reactions were diluted 1:100 with 0.25 ϗ TE. Using 2 μl of diluted first-round amplification products as template, 20 cycles of second-round amplification were performed as above, but using second-round primers CP28XX1 (5'-ACC TAC GTG CAG ATT TTT TTT TTT TTT TXX1–3’ [X1 = A, C, G or T]) and biotinylated Bio-ML18ZZ1 (5'-Biotin-TGC TAA GTC TCG CGA GAT CZZ1– 3’ [Z1 = A, C, G or T]). After checking the products by agarose gel electrophoresis, reactions were mixed with 1 vol. of formamide buffer (99% formamide, 5 mM EDTA, 0.1% bromophenol blue, 0.1% xylene cyanol), denatured for 2 min. at 70°C, and loaded on a preheated 4.5% denaturing acrylamide gel mounted on a GATC 1500 direct blotting electrophoresis apparatus (GATC Biotech, Konstanz, Germany). Electrophoresis took place for 4 hours at 30Wconstant power and the conveyor belt with the blotting membrane (GATC Biotech) attached was moved with an initial speed of 16 cm/h and a constant deceleration down to 10 cm/hour at the end of the run. After mild UV fixing (10,000 μJ/cm2) in a Stratalinker (Stratagene), fragment patterns were visualized by standard biotin detection chemistry using a streptavidin/alkaline phosphatase conjugate (Roche Diagnostics), according to the manufacturer's protocol. Membranes were stored wet at 4°C until band recovery. A more detailed protocol can be found in (Fischer 2001).
Identification of differentially expressed genes
Band patterns obtained from ischemic (left), contralateral (right), and sham-operated mice were visually compared. As the selection of bands is based on subjective judgment, we tried to monitor the selection process by assigning bands with different intensities between groups a confidence level (grading system: “+++”, very high confidence level, to “±”, moderate trust in regulation of the particular gene). This confidence level was based on both the apparent staining intensity between bands, as well as on the appearance of the immediate surrounding of the band pattern (absence of local staining artefacts, equal intensities of neighboring bands between groups running above or below the band of interest). These were excised from the wet membrane using a scalpel. Bands were transferred directly to an amplification mixture composed as above, but with a final concentration of 2 mM MgCl2. After reamplification for 25–30 cycles, products were immediately cloned using the TOPO T/A cloning kit (Invitrogen, Karlsruhe, Germany). Mini-prep DNA from five bacterial colonies per band was prepared (Qiaprep 96 turbo BioRobot kit, Qiagen, Hilden, Germany) and sequenced with T3 and T7 primers (ABI BigDye Mix, ABI 3700 capillary sequencer, Applied Biosystems, Foster City, CA, USA). If the sequences were not identical, inserts of the clones in question were amplified using 20 μl PCR mix each, containing 0.4 μM each of primers CP28 (5'-ACC TAC GTG CAG ATT TTT TTT TTT TTT T) and Bio-ML18 (5'-Biotin-TGC TAA GTC TCG CGA GAT C). Amplified inserts were electrophoresed side by side with their “parental” display reaction and developed as described above, allowing the positive identification of the right clone by direct size comparison. Contaminating bands most often differed by only 1 or 2 nucleotides in length from the band of interest.
Bioinformatics
Sequence assembly was performed using the Seqman program (DNAStar, Lasergene, Madison, WI, USA). The resulting sequences were matched against the EMBL EST and non-EST databases using BLAST 2.0 searches. If possible, the RefSeq accession number (http://www.ncbi.nih.gov/RefSeq) is given in Table 2.
Quantitative PCR
cDNA was synthesized as described above with an oligo-dT primer and purified by using the PCR purification columns (Qiagen, Hilden, Germany). Quantitative PCR was performed using the LightCycler system (Roche Diagnostics, Mannheim, Germany) as described previously (Brambrink et al. 2000). In brief, cDNAs were serially diluted three times to obtain four concentration points for quantification. The concentrations of genes of interest in different cDNA samples were normalized to levels of cyclophilin; 60°C was chosen as the annealing temperature. Measurements of cyclophilin and other amplicons were carried out at 84°C to exclude potential formation of primer-dimers. The following primers were used for PCR amplification:
cyclophilin: cyc5, ACC CCA CCG TGT TCT TCG AC; acyc300, CAT TTG CCA TGG ACA AGA TG
bcas1/43C2: 43C2–1a-mm: TGG GTT AGG GGA GGG TTT TTA TCA; 43C2–1s-mm: TTG GCA CTG AGG AAG GTT TAT TT
NGK2/63C2: 63C2–576s: ACG ACG TGG AGA TGA CCA AGA G; 63C2–1215as: GCA AAG ATG AGC ACT CCC AGG G
IP3 3-kinase/56C2: 56C2–1s-mm: TCC TTA GTT GGG GTT TGT ATT TGT; 56C2–1as-mm: AGC CCA GCC TTT CAT CTT AGT GTT
H5 septin/ 31C1: 31C1–1s-mm: CAA GTT GAG GAC GAT GCT GGT G; 31C1–1as-mm: GGG ATA TAA GGC GAA CTG GTA GGA
han11/16C1: 16C1–172s: TGC CTG GAG ATA CTC CGC GTG; 16C1–576as: GGG GAC ACG AGA TGG ATG ACT
MT-II/ 7C6: mt2-S: GCG CTG GCG CCT GCA AAT GCA AAC; mt2-a: ATT GTC AGT TAC ATG CTT TAT AGA
NARP / 52C1:narp-1s-mm: TGG GGC AGG AGC AGG ACA CG; narp-1as-mm: CTC GAC AAA ATG GTA AGG AAC AAA
The specificity of the PCR reaction was checked by determining the melting point and by agarose gel electrophoresis. Values were averaged from at least three different dilutions per sample.
Cloning of an expression construct for pip92
The coding region of pip92 was PCR-amplified from mouse brain cDNA using specific primers (pip92_m_B1: 5'-GGG GAC AAG TTT GTA CAA AAA AGC AGG CTC TAC CAT GGA AGT ACA GAA AGA AGC GCA GCG-3'; pip92_m_B2: 5'-GGG GAC CAC TTT GTA CAA GAA AGC TGG GTC TCA GAA GGC CAC CAC AGC TCG C-3'). The utilized primers contained recombination sites for the GATEWAY system (Invitrogen, Karlsruhe, Germany) (underlined above). Final recombination into the CMV expression vector pDEST 12.2 (Invitrogen) was carried out following the manufacturer's recommendations.
Electroporation of COS-1 cells
For electroporation, 3.5×10⁶ COS-1 cells were trypsinized and resuspended in 300 μl electroporation buffer (50 mM K2HPO4, 20 mMCH3COOK, 20 mM KOH, pH 7.4) and 25 μλ 1 M MgSO4 added. The cell suspension was mixed with 5.25-μg plasmid DNA and transferred into an electroporation cuvette (Gene Pulser Cuvette 0.4 cm electrode, BioRad, Hercules, CA, USA). Electroporation was performed using a Gene Pulser II (BioRad) at 500 μF and 230 V. The electroporated cell suspension was plated at a density of 1ϗ106 cells per 6-cm plate in DMEM (Sigma-Aldrich, Seelze, Germany) plus glucose, 10% FCS, 1% penicillin / streptomycin.
Cell-survival assay in primary cortical neurons
Ten to 12 cortices were dissected from rat embryos E18. The tissue was dissociated using 10 mg/ml trypsin, 5 mg/ml EDTA/DNase (Roche diagnostics, Mannheim, Germany) in HBSS (BioWhitakker, Taufkirchen, Germany). The digestion was stopped using four parts neurobasal medium containing 1X B-27 supplement (Invitrogen, Karlsruhe, Germany), 0.5 mM L-glutamine, and 25 μM glutamate. After centrifugation, the pellet was dissolved in 5 ml medium and cells were plated at a density of 250,000 cells per well of a 24-well-plate on glass cover slips coated with poly-L-lysine. Three days after plating. The cells were transfected with 50 ng CMV-LacZ plus 450 ng of either the empty vector, a bax CMV expression construct, or the pip92 expression construct. Transfection was performed with lipofectamine 2000 (Invitrogen, Karlsruhe, Germany), following a method described previously (Ohki et al. 2001). In our hands, this resulted in the transfection of approximately 10% of neurons. Three days after transfection, the cells were washed and incubated with 500 μl β-Gal buffer (20 mM Tris-HCl, pH 8; 100 mM NaCl, 1 mM MgCl2; 0.25 Triton X-100; 10 mM DTT, 1 mM MUG = 4-methylumbelliferyl-β-D-galacto-pyranoside) for 10 minutes at 4°C, followed by incubation for 30 minutes at 37°C. The reaction was terminated with 500 μl 0.4 M Na2CO3 at 4°C. Using a spectrofluorometer (AMINCO-Bowman Series 2, Thermo Spectronic, Rochester, USA), the amount of produced 4-methylumbelliferone was measured (excitation wavelength 364 nm, emission wavelength 440 nm). 4-Methylumbelliferone is a direct measure for the activity of β-galactosidase and thus cell viability (Memon et al. 1995).
FACS sorting of Annexin-stained COS-1 cells
COS-1 cells were transfected with CMV-pip92 and an expression plasmid for EGFP, according to an electroporation protocol. For control, pDEST 12.2 (Invitrogen, Karlsruhe, Germany) was cotransfected with EGFP. After 24 h, cells were treated with increasing concentrations (0.2 – 1.0 μM) of staurosporine (Calbiochem, San Diego, CA, USA). Then, 24 hours after adding staurosporine, 3=105 cells – including those in the medium – were washed once with Annexin V-binding buffer (BD Biosciences Pharmingen, San Diego, USA) and resuspended in 300 μl Annexin V-binding buffer containing 15 μl phycoerythrin-conjugated Annexin V (Annexin V-PE; BD Biosciences Pharmingen). After incubation for 15 minutes at room temperature in the dark, cells were centrifuged for 5 minutes at 250 g at 4°C and resuspended in 300 μl ice-cold Annexin V-binding buffer containing 5 μl propidium iodide (PI; 30 mg/ml; Oncogene, Cambridge, MA, USA). Using a FACSCalibur sorter 1 × 10⁵ cells were analyzed (Becton Dickinson Biosciences, San Jose, USA). The fraction of Annexin V-PE-positive and PI-negative cells was determined in the EGFP-positive cells
Assessment of PARP cleavage
To detect PARP cleavage, COS-1 cells were transiently transfected with CMV-pip92 or control vector. Forty-eight hours after transfection, the cells were treated for 5 hours with 0.2 μM staurosporine as indicated (Calbiochem, San Diego, CA, USA). The cells were scraped off the plate and washed twice in ice-cold PBS containing 2.5 mg/ml pepstatin (Sigma-Aldrich, Seelze, Germany) und aprotinin (1:1000, Sigma-Aldrich). Pellets were resuspended in 1 volume 2% SDS (40 μl), and 5 μl benzonase solution (40 μl 100 mM MgCl2 and 9 μl benzonase, Roche Diagnostics, Mannheim, Germany) was added. After solubilization, 1 volume PBS was added and the protein concentration determined (BCA-Test, Pierce, Rockford, IL, USA). After denaturing at 95°C for 5 minutes, 100 μg was run on 8% SDS-polyacrylamide gels. Proteins were transferred to nitrocellulose membranes (Protan BA79, Schleicher & Schuell, Dassel, Germany) using a semi-dry blotting chamber (Whatman Biometra, Göttingen, Germany). Blots were blocked with 5% milk powder in PBS/ 0.02% Tween 20, washed three times with PBS/ 0.02% Tween 20, and incubated for 1 hour at room temperature with the primary antibody (anti-cleaved-PARP-antibody, Promega, 1:800). After washing, the blots were incubated with the secondary antibody (anti-rabbit-antiserum HRP-coupled, Dianova, Hamburg, Germany 1:5000) for 1 hour at room temperature. Signals were detected using the supersignal chemiluminescence system (Pierce, Rockford, IL USA) and exposed to Hyperfilm-ECL (Amersham Pharmacia Biotech, Piscataway, NJ, USA). PARP cleavage was quantified on scanned autoradiographs using Windows ImageJ v1.29 (http://rsb.info.nih.gov/ij/index.html).
Assessment of DNA fragmentation
COS-1 cells were trypsinized, transfected with CMV-pip92 or control vector as described above, and plated at a density of 7500 cells / well on a 96-well plate. Part of the cells were treated with 0.15 or 0.3 μM staurosporine 48 hours later (Calbiochem, Bad Soden, Germany). After 5 hours, the Cell Death Detection ELISA plus (Roche Diagnostics, Mannheim, Germany) was performed, following the manufacturer's recommendations. Absorption was measured in a plate reader (platereader Fluostar Galaxy; BMG Labtechnologies, Offenburg, Germany) at 390 nm and 485 nm. Accumulation of mono- and oligonucleosomes in the cytoplasm was determined, following the manufacturer's recommendations, and normalized to control-transfected cells that were not treated with staurosporine.
Statistical evaluation
All data are given as mean ± standard deviation (SD). Statistical significance was determined by using ANOVA followed by a Newman-Keuls post-hoc test. Data were considered significantly different at P < 0.05.
RESULTS
RMDD: Description of the method
In RMDD, RNA samples are converted to ds-cDNA, which is then digested with a frequently cutting restriction enzyme (Fig. 1A). Fragments are ligated to linker molecules, and ligation products are amplified using forward primers recognizing the linker sequence and reverse primers derived from the sequence of the cDNA primer. As the linkers used for ligation are not phosphorylated, only the 3'-most fragment of each cDNA is amplified to a detectable level, while all internal restriction fragments remain unamplified.
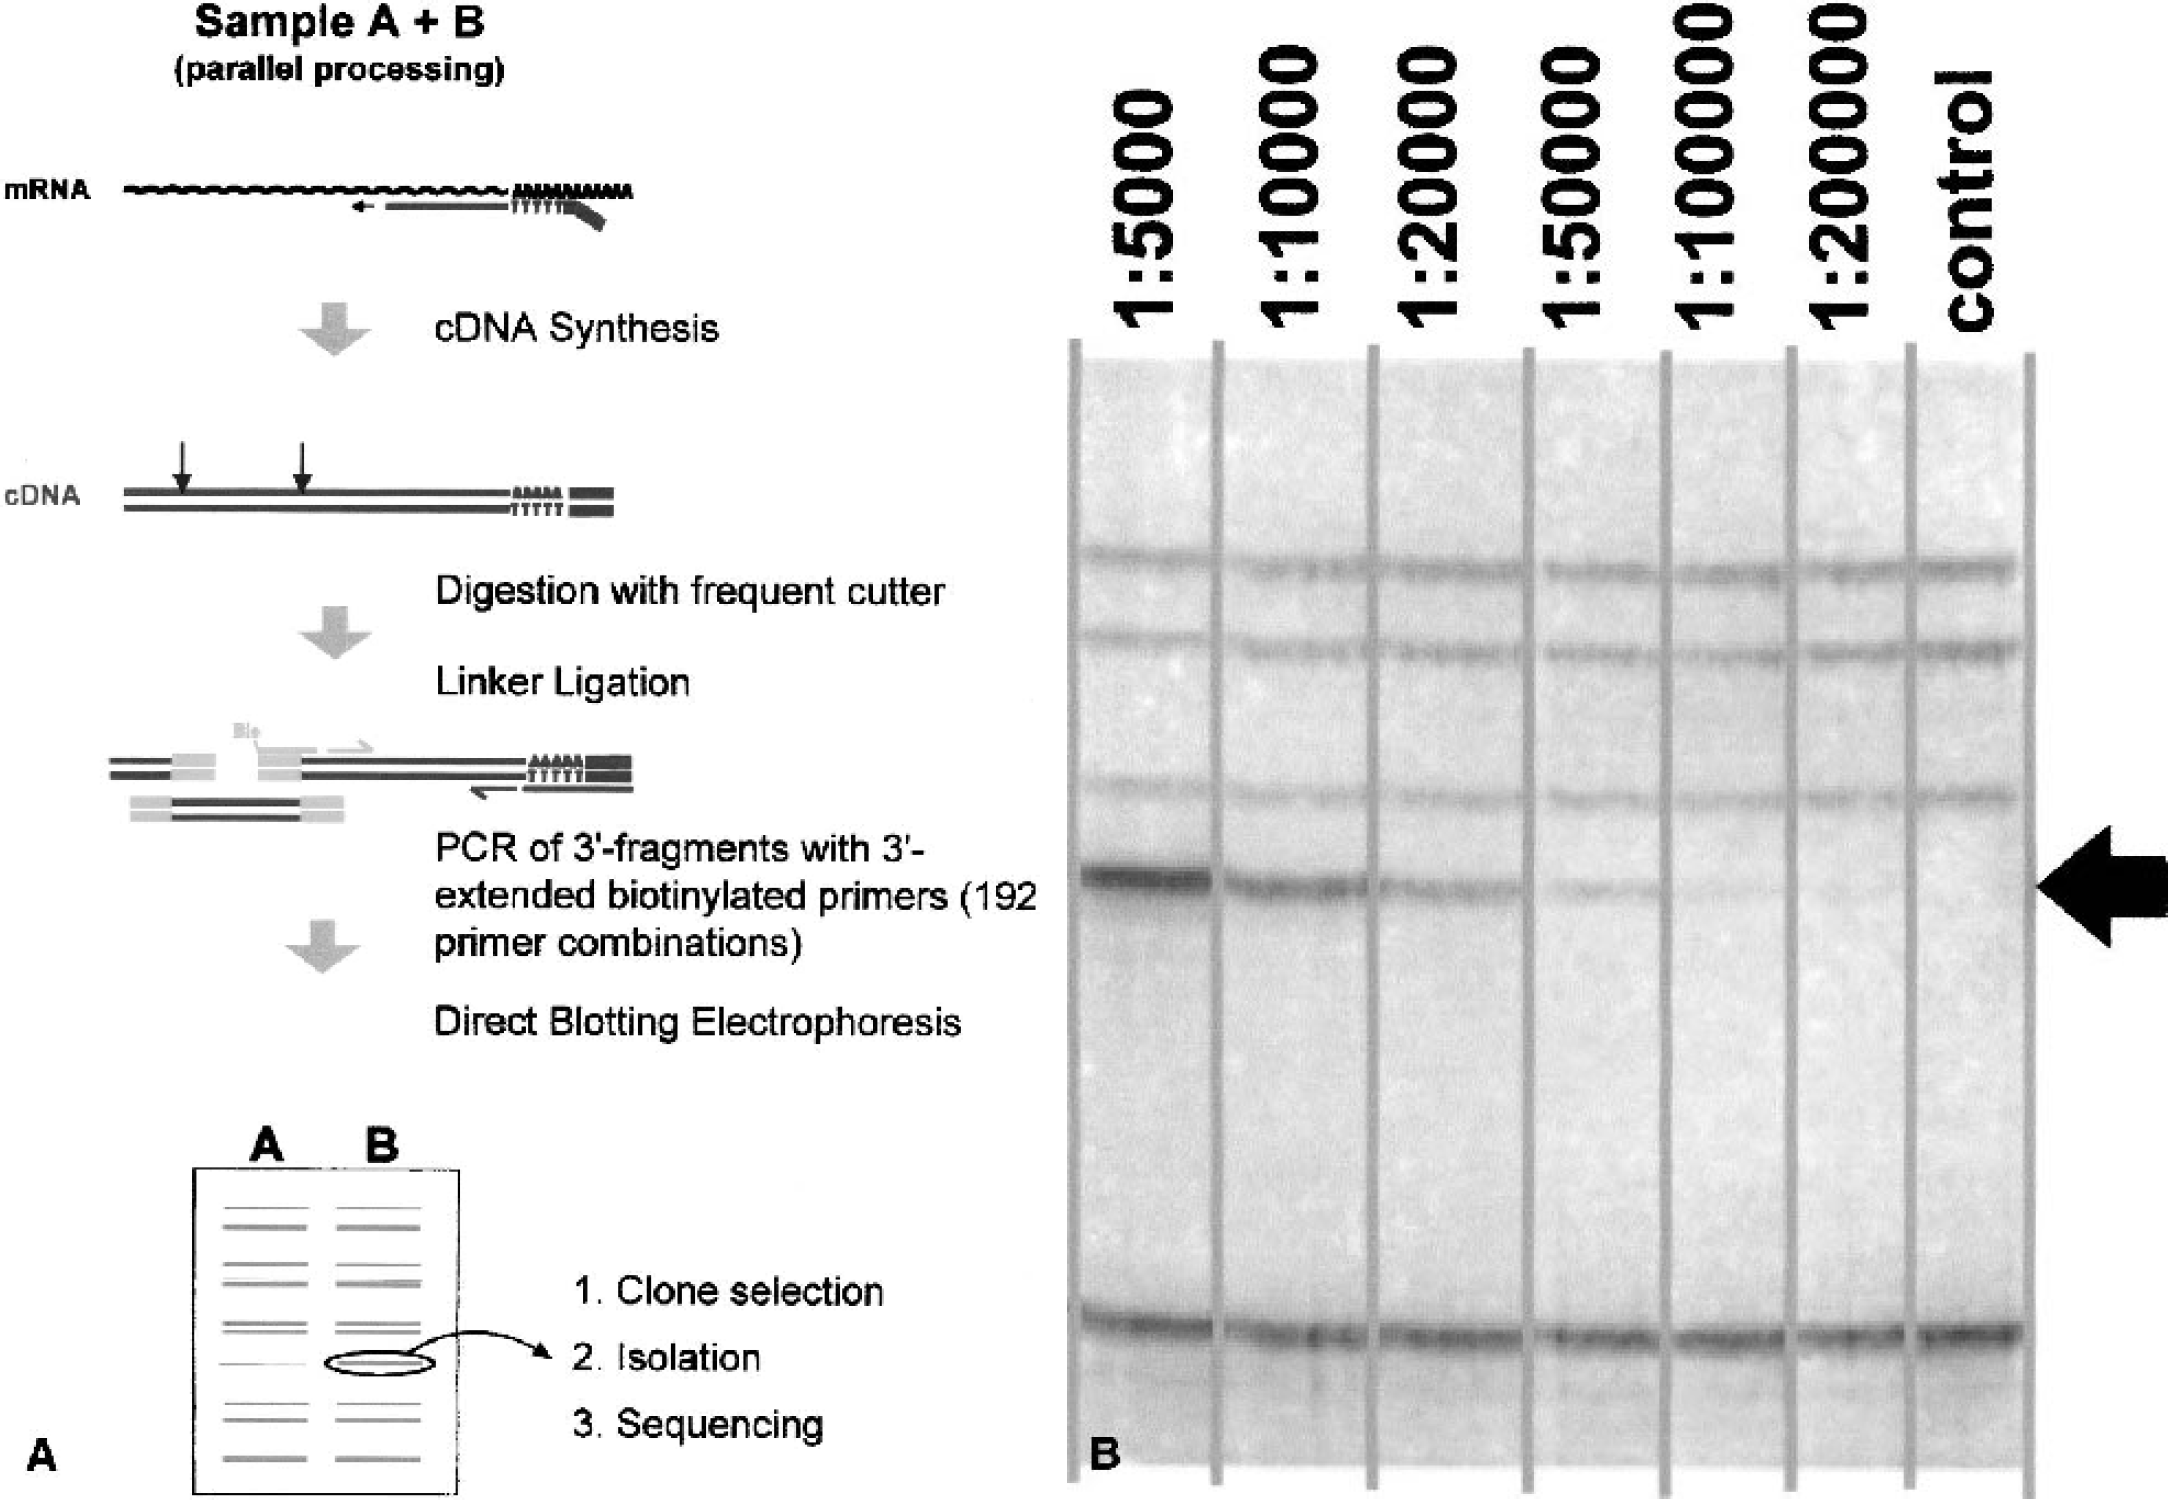
To increase the resolution and sensitivity of detection of the thousands of 3'-cDNA fragments generated, primers elongated at their 3'-ends are used for amplification, each only allowing the amplification of a defined subset of fragments. Using extensions of two nucleotides on each side, 16 linker primers and 12 reverse (oligo-dT-) primers (whose first extension nucleotide, by definition, cannot be a T) are synthesized. Thus, during the subsequent PCR step, the original set of fragments is divided into 16ϗ12 = 192 subsets.
We applied the direct blotting electrophoresis technique, which allows the high-resolution separation and transfer of DNA fragments up to 1 kb in length to a blotting membrane in a single step (Beck and Pohl 1984), and use biotinylated primers with which blotted fragments can be detected nonradioactively by a standard color reaction. Staining provides direct physical access to fragments of interest by simply cutting visible bands out of the membrane.
When corresponding PCRs from different RNA samples are loaded side by side on the gel, resulting band patterns can be visually compared (Fig. 2). A typical RMDD membrane shows, in each lane, bands of different sizes and intensities, each representing one particular cDNA. The band intensities correlate with the original relative frequencies of the template cDNAs. This corresponds to the observation that, in complex PCR reactions with more than one amplification product, entry into the plateau phase of amplification freezes the different amounts of synthesized products (McClelland and Welsh 1994). Therefore, if a particular cDNA is present at different amounts in two samples, the resulting bands will show different intensities on the RMDD membrane. Spiking experiments using in vitro transcribed RNA indicated a detection limit of 1:100,000 and a signal linearity, making it possible to identify regulation factors down to 1.5-fold (Fig. 1B).
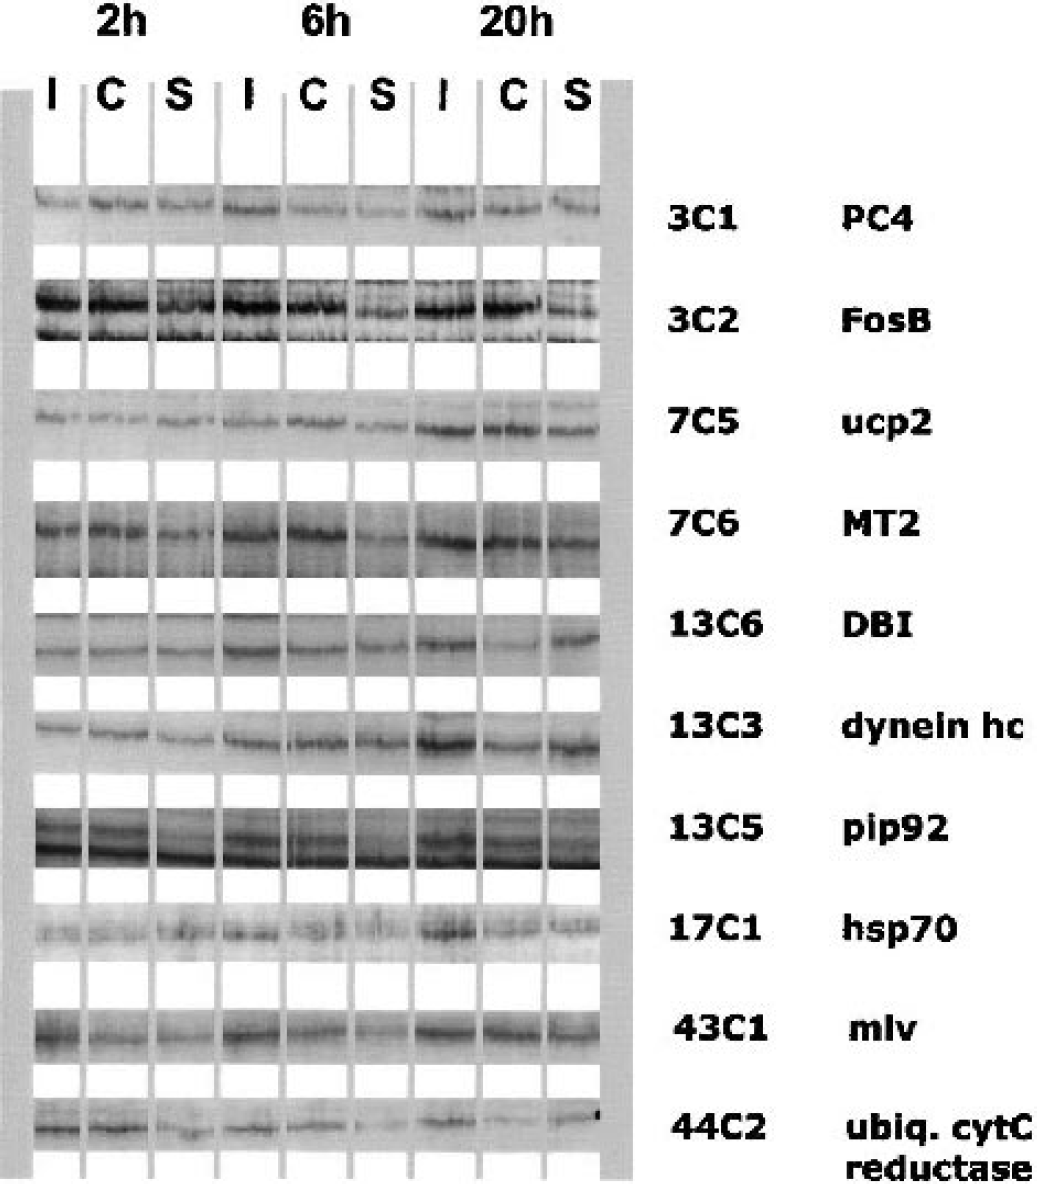
Examples of band patterns for several identified bands with differing intensities. The nine different lanes represent different samples after transient MCAO in mice (90-minutes occlusion and 2-, 6-, and 20-h reperfusion). I, ischemic hemisphere; C, contralateral; S, sham. While several genes show permanent up-regulation from 2- to 20-h reperfusion time (e.g. FosB), most are selectively upregulated at specific reperfusion times (e.g., hsp70).
Identification of differentially expressed genes in MCAO
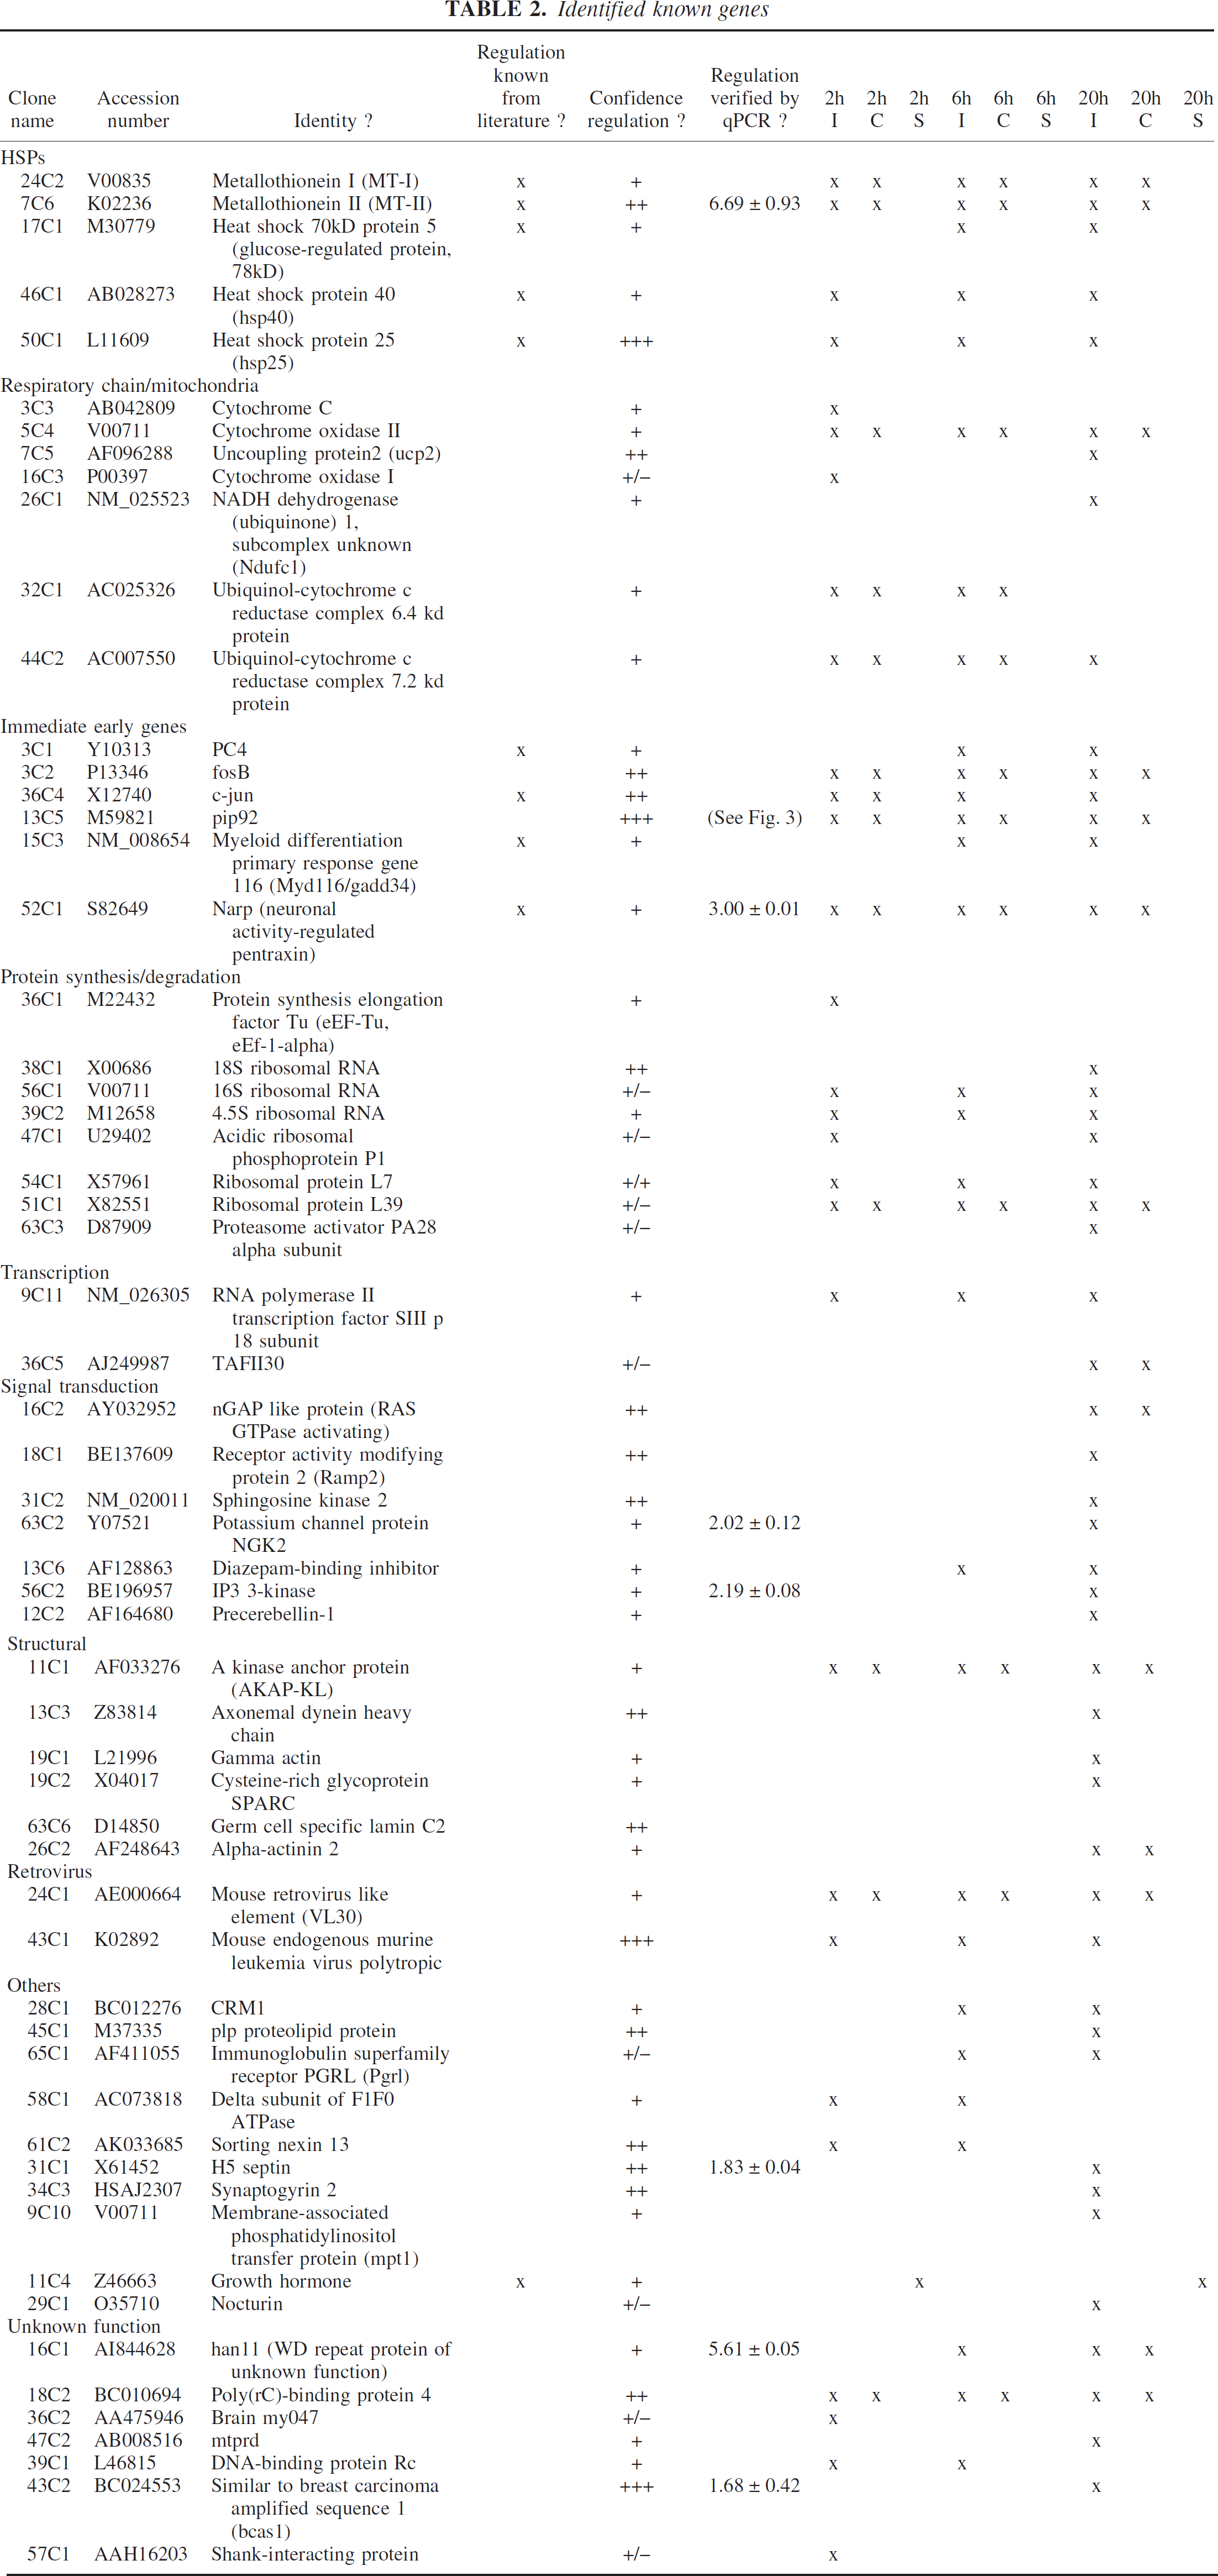
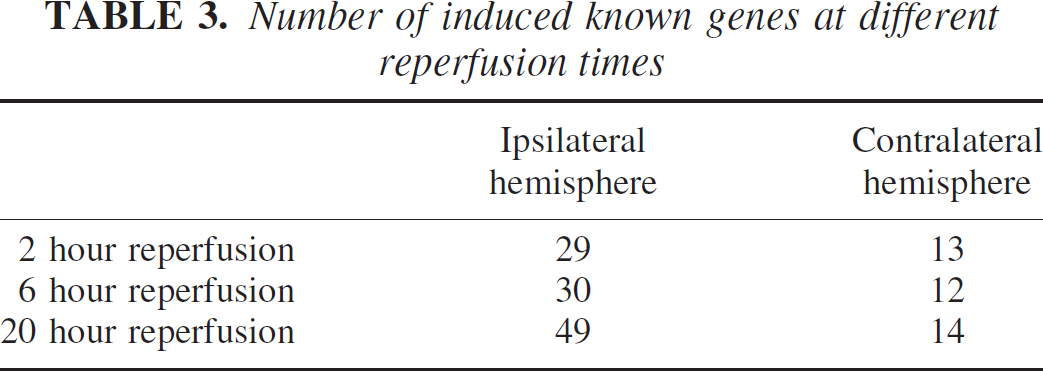
We applied the RMDD protocol to identify differentially transcribed genes in RNA samples from mice after focal cerebral ischemia, using transient (90-minutes occlusion and 2-, 6-, and 20-hours reperfusion) ischemia. The ischemic forebrain hemisphere was compared with the contralateral hemisphere and with sham-operated animals. We have identified 74 differentially regulated genes. Notably, 14% of the sequences represent novel clones (only ESTs present in public databases). Among the genes detected in our screen, we have found many genes whose upregulation has been reported before in cerebral ischemia: metallothionein I and II (Campagne et al. 2000), hsp-70.2 (Kinouchi et al. 1993), hsp-40 (Paschen et al. 1998), fosB and c-jun (Gass et al. 1992), among others. Surprisingly, a high percentage of genes in the respiratory chain appeared upregulated. Of note, almost all regulated sequences found were transcriptionally induced instead of repressed. We detected more regulated bands at later reperfusion time points (47 bands at 20-hour reperfusion in the ischemic hemisphere vs. 23 and 24 at 2- and 6-hour reperfusion, respectively; Table 3), and there was a high degree of co-regulation between the ischemic and the contralateral hemisphere when compared to sham-operated animals. This coregulation was found more frequently at earlier reperfusion times and, in some instances, became more specific to the ischemic hemisphere at later time points.
To validate the RMDD protocol we analyzed seven genes that were found to be upregulated in RMDD with quantitative PCR at 20-hours reperfusion compared to sham-treated mice. Six out of seven could be confirmed to be upregulated, with factors ranging from approximately 1.5- to sevenfold (Table 2, column 5).
Pip92 induces cell death
Pip92 was found to be upregulated at 2-, 6-, and 20-hours reperfusion in both hemispheres (Fig. 2; Table 2). This type of regulation pattern was also detected in the metallothioneins, cytochrome oxidase II, fosB, narp, and some others (Table 2). Quantitative PCR verified the induction of pip92. Pip92 was upregulated approximately two-fold at 2 and 6 hour, and threefold at 20 hours of reperfusion, both in the ischemic and contralateral hemisphere (Fig. 3). As pip92 has been shown to be inducible by NMDA treatment and has links to intracellular pathways that are involved in cell death regulation (jnk, p38), we speculated that pip92 might be involved in cell death events in the course of ischemia. Pip92 appears to be neuronally expressed in the brain (Chung et al. 2000b). Therefore, we tested whether overexpression of pip92 influenced cell viability in primary cortical neurons. Pip92 overexpression reduced cell survival to 58% ±5% of control-transfected cells, whereas the positive control bax reduced cell viability to 13% ±5% of controls (Fig. 4A). Pip92 was less potent in inducing cell death than the strong apoptosis stimulus bax. Overexpression of pip92 in cos1 cells (Fig. 4B) and HeLa cells (data not shown) also induced cell death. This indicates that the cell death-promoting effect of pip92 is not neuron-specific, fitting the broad tissue expression of this gene (data not shown). This result allowed us to further study potential involvement of apoptotic mechanisms in the cos1 cell line (Fig. 5). In all of the following assays, we compared pip92 overexpressing cells to vector-transfected cells. Membrane phosphatidylserine exposure is one hallmark of apoptosis and can be detected by AnnexinV staining. Propidium iodide (PI) is used in conjunction with AnnexinV to detect cells that already have perforated the cell membranes, indicating necrotic cell death. To determine whether cells were transfected, we cotransfected EGFP plasmids. We then used FACS sorting to determine the numbers of EGFP-positive cells that also stained for AnnexinV and/or PI. The fraction of apoptotic cells are, therefore, those that are AnnexinV-positive, but PI-negative, whereas necrotic cells show both stainings. Overexpression of pip92 doubled the percentage of all dying cells (apoptotic and necrotic), comparable to results obtained in the cell viability assay (Fig. 5A). In control-transfected, untreated cells, the percentage of EGFP-positive, AnnexinV-positive, but PI-negative cells (“apoptotic cells”) was approximately 9%, while in pip92-overexpressing cells this ratio amounted to 15%. The fraction of necrotic cells changed from 3% in the control to 9% in the pip92 overexpressing cells. From that we conclude that pip92 increases both the number of cells dying by necrosis as well as apoptosis as defined by this paradigm.
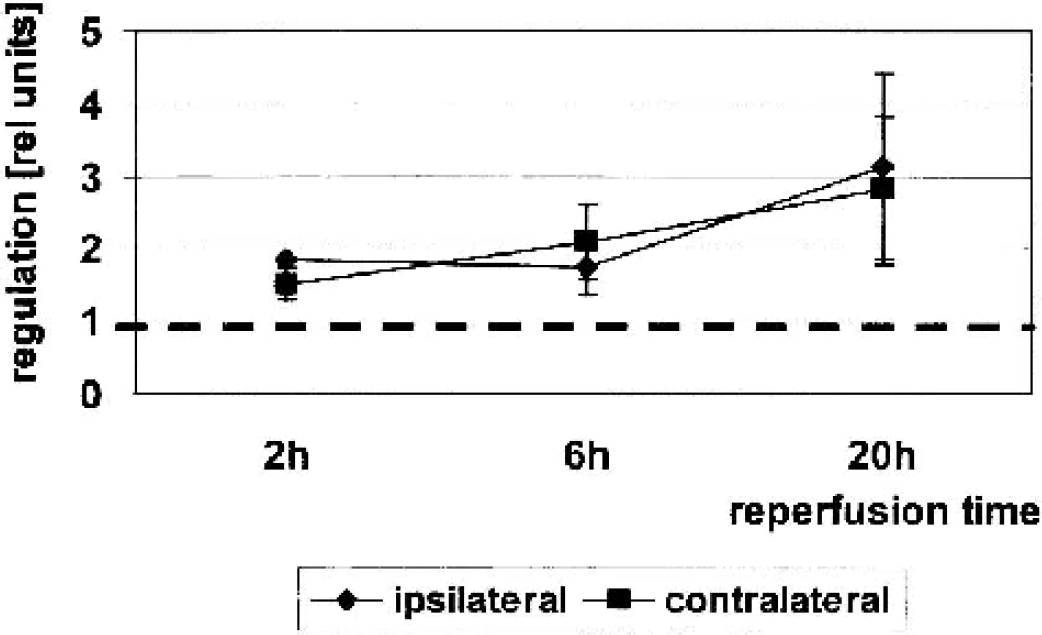
Verification of pip92 regulation by quantitative PCR at 2, 6, and 20 hours of reperfusion (n = 3). Relative expression levels were increased in the ischemic and contralateral hemisphere of mice after 90-minutes occlusion as compared to sham-treated animals (set to 1, P < 0.02).
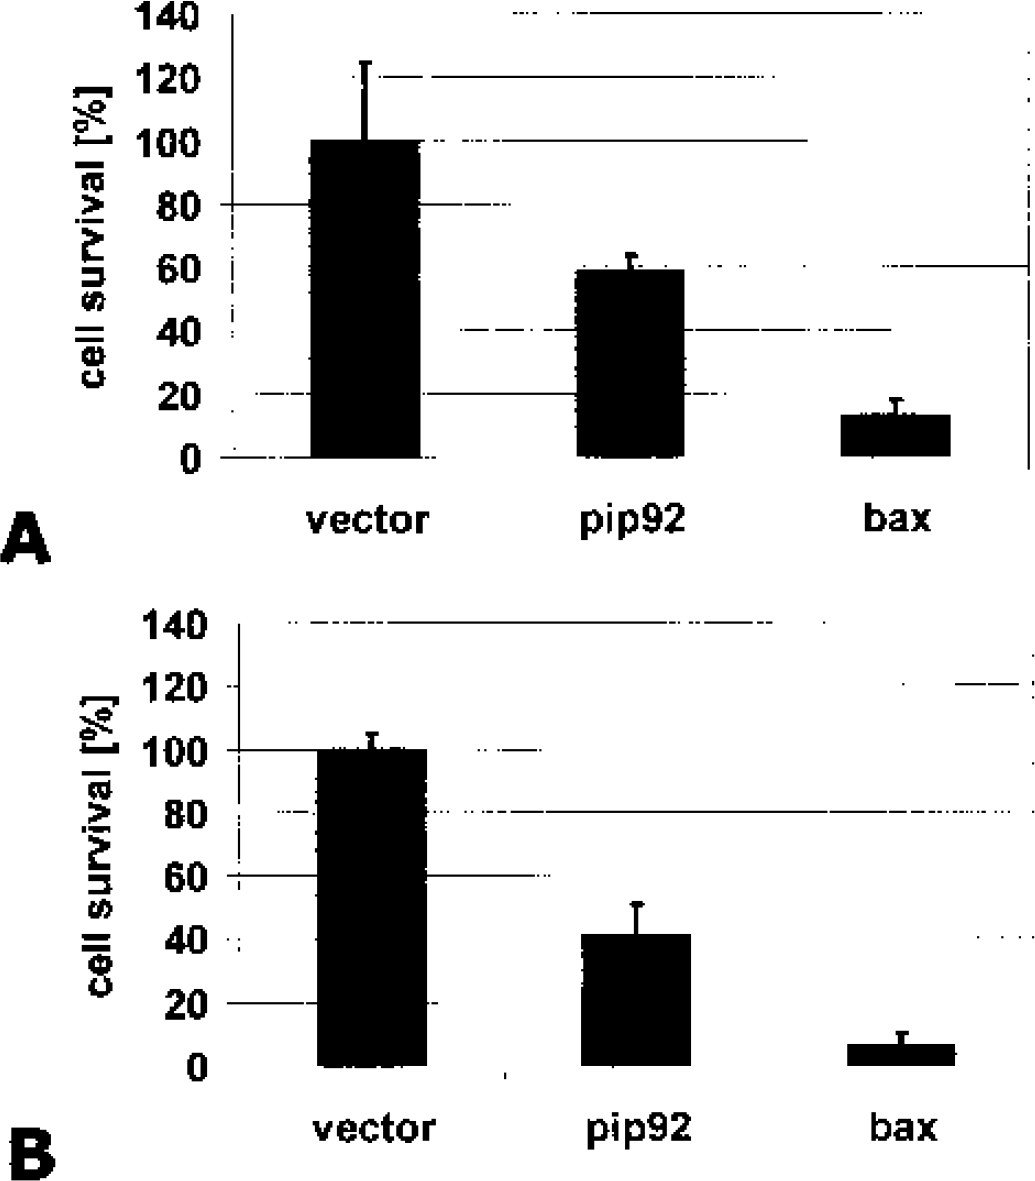
A, pip92 induces cell death in primary cortical neurons after overexpression. The decrease in cell viability as measured by a β-galactosidase assay is shown. Overexpression of pip92 reduced cell survival significantly by 40% 24 hours after transfection. By comparison, a plasmid encoding the strongly proapoptotic bax gene was transfected, which displays a dramatic reduction in cell survival by almost 90%. B, Overexpression of pip92 in cos1 cells also led to a significant reduction of cell survival by approximately 60%. (n = 3, P < 0.05).
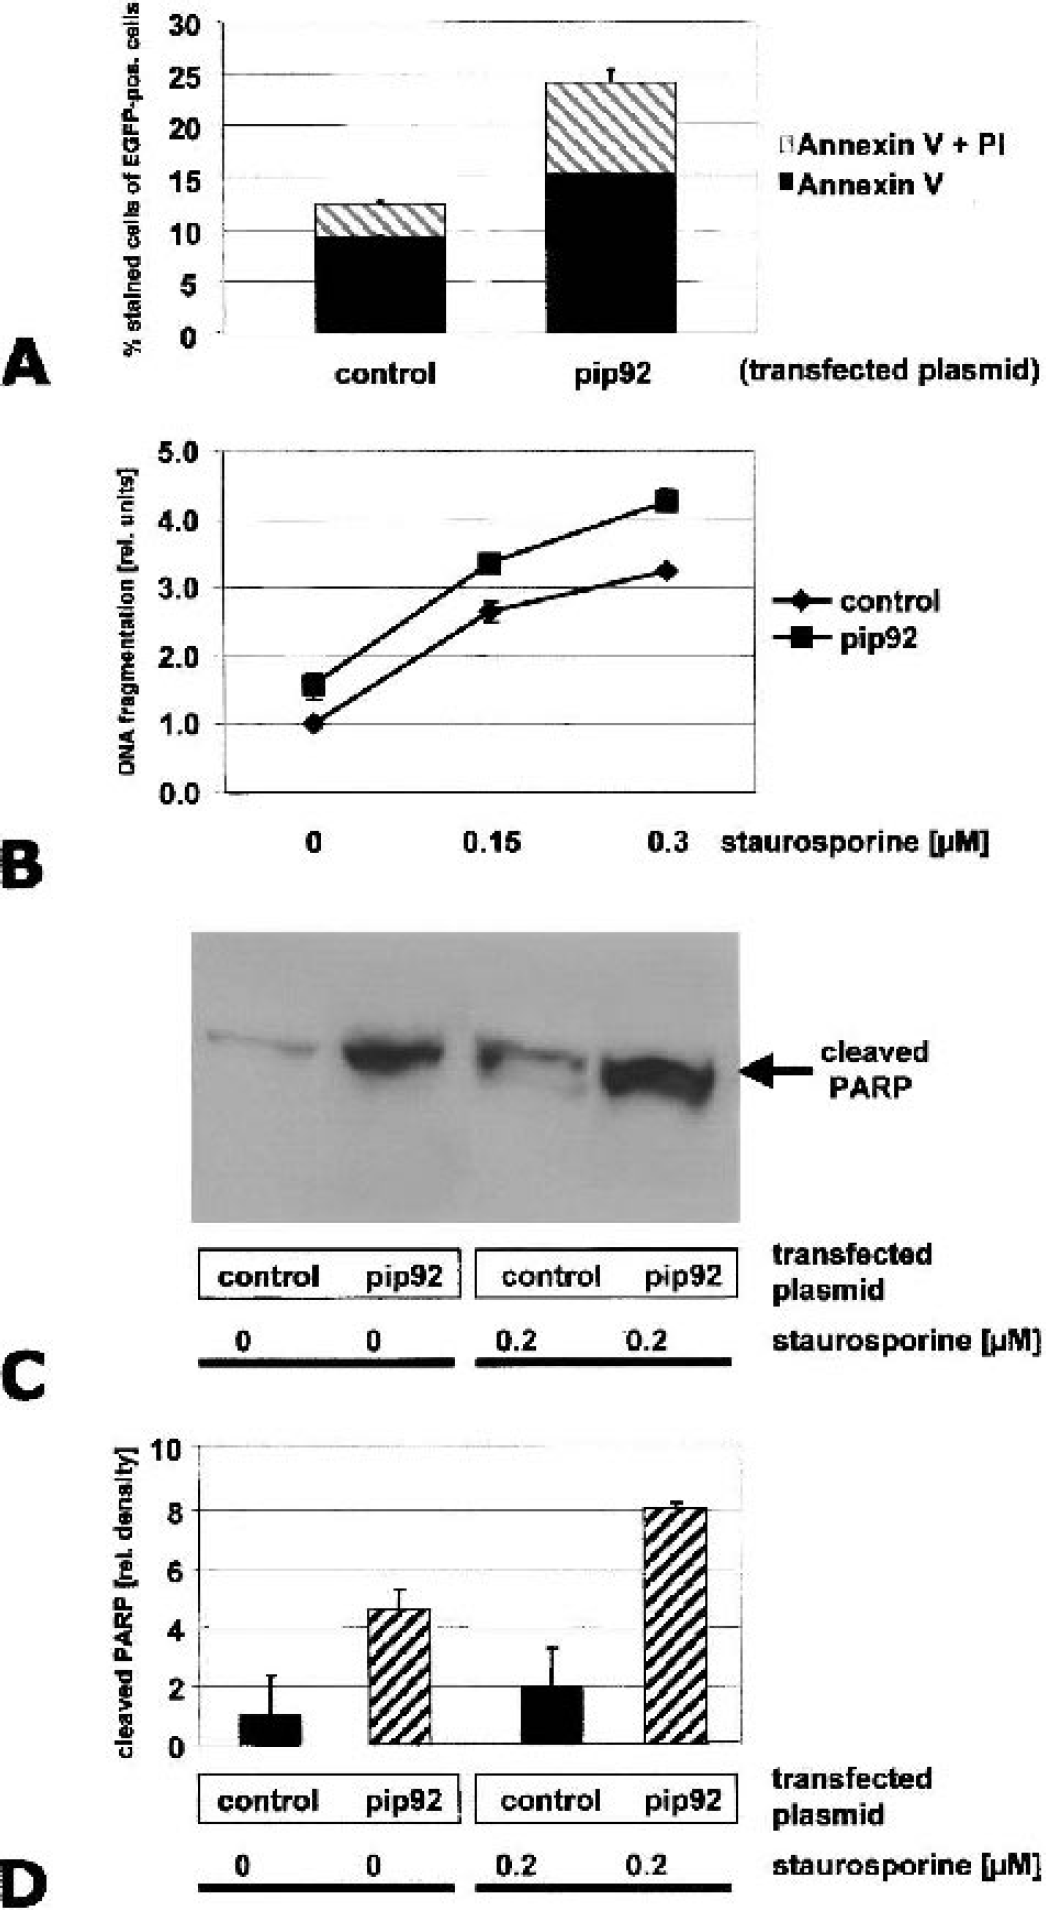
pip92 has pro-apototic activity. A, quantification of the relative percentages of necrotic and apoptotic cell-death evoked by overexpression of pip92 (AnnexinV plus PI (propidium iodide) = necrotic cell death, AnnexinV only = apoptotic cell death) B, relative amount of DNA fragmentation under increasing concentrations of staurosporine. C, PARP cleavage detected by Western blot using an antibody specific for the caspase-cleaved form. Without staurosporine, and under 0.2 μM staurosporine, there is dramatically enhanced cleavage of PARP in the pip92-transfected Cos1-cells. D, Quantification of PARP cleavage by densitometry of Western blot autoradiographs. In all experiments shown, pip92-transfected cells behaved significantly differently from controls (n = 3; P < 0.05).
As another marker of apoptotic cell death, we measured DNA fragmentation by an ELISA that detects histone-DNA complexes in cell lysates. Again, pip92-transfected cells displayed a significantly higher degree of DNA fragmentation (Fig. 5B). This difference remained stable even after the application of increasing concentrations of the external apoptosis inducer staurosporine.
Poly ADP-ribose polymerase (PARP) is an important target of caspase-3 and is cleaved in apoptotic cell death. We assayed PARP cleavage by caspase-3 by using an antibody specific for the cleaved product. By Western blot analysis, we detected an increase in the amount of cleaved PARP after overexpression of pip92, under both unstimulated conditions and under 0.2 μM staurosporine (Fig. 5C). Quantification of Western blot signals by densitometry revealed an approximately fourfold increase in PARP cleavage under unstimulated conditions as well as under staurosporine treatment (Fig. 5D). We conclude that pip92 evokes cell death that is characterized by many features typical for apoptosis.
DISCUSSION
RMDD
We have presented the use of RMDD for analysis of complex gene expression changes, which occur in brain after focal cerebral ischemia. Its main advantages are the relative ease of the experiments, that expensive equipment is not required, the high reliability, and the sensitivity, allowing detection of 1.5-fold changes. The direct staining of the membranes is a major advantage over traditional protocols, where cutting invisible radioactive bands out of a dried gel after superimposing the relevant autoradiograph is one of the common sources of false positives. Additional strengths are the moderate demand for input material (10 μg total RNA), and independence from preexisting sequence information. We have demonstrated that transcriptional profiling in cerebral ischemia can identify genes that are functionally meaningful and may represent new target genes for therapy.
Regulation patterns
RMDD allows a comparison of parallel paradigms, treatments, or time points. We have used it for the simultaneous detection of gene expression changes at three reperfusion time points after MCAO. The upregulation of genes in both hemispheres implies that mechanisms influencing gene expression hit both hemispheres after an ischemic insult. One such mechanism is spreading depression (Sharp et al. 2000; Yrjanheikki et al. 2000), which might be replaced after time by a more specific inducing stimulus in some cases. It is quite surprising that the number of induced genes increases with reperfusion, as the transcriptional levels of many immediateearly genes drop at earlier time points. This might reflect the introduction of additional pathophysiologic mechanisms at this time point, such as inflammation. A second notable aspect is that we almost exclusively detected upregulated genes.
Identified known genes
Identified genes
We have classified identified genes into different groups. The fraction of 14% unknown genes in our pool underscores the usefulness of RMDD as a true “gene discovery” tool and holds promise for detecting new pathophysiological mechanisms in stroke.
We identified a high percentage of the genes whose regulation during ischemic events has been described before. Prominent inductions were seen for both of the metallothioneins (MT-I and MT-II). Both were detected as upregulated in our experiments in the ipsi- and contralateral hemisphere, pointing towards a possible up-regulation by mechanisms such as cortical spreading depression. The upregulation in a transient MCAO model has been described before (Campagne et al. 2000). Metallothioneins in the brain seem to mainly localize to endothelial cells and astrocytes (Campagne et al. 2000). They are induced by a broad variety of noxious stimuli and seem to confer a protective role via their properties of forming complexes with zinc. In our model, MT-II was upregulated sevenfold after 20 hours of reperfusion compared to sham (Table 3) and thus appears to be among the genes most strongly induced during ischemia. MT-II was shown to be protective in the MCAO model (Trendelenburg et al. 2002).
Number of induced known genes at different reperfusion times
Heat-shock proteins have been amply described in the context of cerebral ischemia (Sharp et al. 2000) and appear to have strong protective effects (Lu et al. 2002; Yenari et al. 1998). We have identified hsp25, hsp40, and hsp70/grp78 as being upregulated in our screening procedure. Hsp70 was found to be upregulated after 6 and 20 hours reperfusion in the ischemic hemisphere, and hsp40 and hsp25 were induced at all reperfusion time points in the ischemic hemisphere.
We also detected members of the well-known fos/jun family of transcription factors, c-jun and fosB (Herdegen and Leah 1998). Whereas fosB was induced at all time points in both the ipsi- and contralateral hemisphere, c-jun lost its contralateral upregulation at 6- and 20-hour reperfusion.
The secreted protein Narp has been described recently as being upregulated during focal ischemia (Schwarz et al. 2002). We detected Narp as being induced in both hemispheres, most clearly at 20-h reperfusion. Verification by quantitative PCR revealed threefold induction as compared to sham-operated animals (Table 3). Narp was originally cloned as an immediate-early gene in the brain and has neurite outgrowth-promoting activities (Tsui et al. 1996). In cultured neurons, Narp increases the number of excitatory synapses and leads to clustering of AMPA receptors (O'Brien et al. 1999). In the context of cerebral ischemia, the long-lasting induction detected in our model might lead to prolonged excitotoxic effects; however, the function of Narp in respect to neuronal survival has not been investigated yet.
Some genes appeared especially interesting in the context of data from other groups: The oligodendrocyte protein PLP (proteolipid protein) was found to be upregulated after 20 hours in the ischemic hemisphere. It is well known that white matter damage, oligodendroglial cell death, and subsequent demyelinization occur after cerebral ischemia and might contribute significantly to the functional damage occurring after stroke (Guan et al. 2001). In that sense, increased PLP levels at a late phase after focal ischemia might indicate a remodeling process in the white matter.
The septin H5 appeared quite interesting to us, as one splice form of this gene has been described as an apoptosis inducer (ARTS, (Larisch et al. 2000)). H5 localizes to astroglial processes in the brain (Kinoshita et al. 2000). H5 was tested by quantitative PCR and this revealed an upregulation of a factor of 1.83 ± 0.04-fold at the 20-hours reperfusion time point (Table 3). We tested the induction of the two different splice forms H5 and ARTS by quantitative PCR with specific primer pairs and found that the upregulated form was the H5 transcript itself (data not shown), whose function is less well-defined. Since the RMDD method is 3'-based, it does not distinguish between differentially spliced transcripts.
The receptor activity-modifying protein 2 (Ramp2) was detected at 20 hours in the ipsilateral hemisphere. Ramp2 is a transmembrane protein with one membrane-spanning domain that can associate with a G-protein-coupled receptor (CRLR, calcitonin-receptor like receptor) and shifts specificity from calcitonin-related peptide towards the ligand adrenomedullin (Sexton et al. 2001). Adrenomedullin is induced after ischemic events in the brain (Serrano et al. 2002) and was shown to act in a protective manner in the MCAO model (Watanabe et al. 2001). Therefore, it is tempting to speculate that Ramp 2 induction adds to this beneficial effect by increasing the number of adrenomedullin-responsive receptors.
A surprising finding was the discovery of the upregulation of a significant number of members of the respiratory chain and related proteins, which had not been described before. We identified cytochrome oxidase I and II, NADH dehydrogenase I, ubiquinol-cytochrome c reductase complex, subunits 6.4 kD and 7.2 kD, surprisingly, cytochrome c itself, and ucp-2. In light of the restricted energy available in the ischemic area, an upregulation of parts of the respiratory chain makes sense as a compensatory mechanism. However, this might also contribute to enhanced radical production. Further investigation is needed to examine the consequences of this upregulation. The uncoupling protein unc-2 or ucp2, which we found upregulated at 20 hours of reperfusion in the ischemic hemisphere, is a protein localized in the inner mitochondrial membrane and short-circuits ATP synthesis in favor of heat production (Fleury et al. 1997). Its distribution in the brain has been mapped and it seems to be expressed in several brain areas in neurons (Richard et al. 1998). It appears that ucp-2 contributes to oxygen radical generation (Negre-Salvayre et al. 1997) and apparently is involved in thermogenesis and regulation of obesity (Fleury et al. 1997). A recent study unveiled upregulation of ucp-2 in response to entorhinal lesions and a clear reciprocal association between ucp-2 expression and caspase-3 activation, pointing towards involvement in neuroprotective processes (Bechmann et al. 2002). It appears likely that ucp-2 upregulation in our model has a protective function. During submission of this paper, Mattiasson et al. have indeed proven that ucp-2 is a protective gene product in cerebral ischemia (Mattiasson et al. 2003).
Pip92
Here we describe an approach that can further narrow down the list of genes in the search for genes that are involved in ischemic pathophysiology. One important aspect in the ischemic cascade is delayed cell death by cell-intrinsic mechanisms. For example, ample evidence has been provided for members of bax or bcl2 families (Brambrink et al. 2000; Isenmann et al. 1998; Krajewski et al. 1995). Here we show that pip92, a gene with unknown function, is induced after focal cerebral ischemia. It has been shown to be upregulated in the hippocampus by NMDA treatment (Chung et al. 2000b). It appears that pip92 induction can be mediated via p38 and jnk pathways (Chung et al. 2000a) and via Ca2+ elevation and subsequent activation of MEK and src (Chung et al. 2001). Whereas its activation modes have been studied quite well, it is less clear what its function is. Pip92 has little similarity to any known gene product, is extremely rich in proline, and seems to be localized both in the cytoplasm and the nucleus. Due to its interesting activation pattern in transient cerebral ischemia and its reported induction by NMDA and intracellular Ca2+ elevation, we speculated that it might be involved in cell-death mechanisms in the brain. Upon overexpression, pip92 elicits cell death in primary neurons This cell death displays many features of apoptosis, such as phosphatidylserine exposure, DNA fragmentation, and PARP cleavage. How pip92 exerts its cell death-promoting functions is unclear at present. We conducted yeast-two-hybrid screens, but could not detect specific interactors. However, a recent report suggests that pip92 interacts with MyD116 (gadd43) (J.B.Park; J.H.Baik, Y.S.Ahn, K.C. Chung, abstract #818.4, Society for Neuroscience Meeting, 2002), another gene found to be upregulated in our experiments and in those by other groups (Doutheil et al. 1999). MyD116 is a DNA damage-response gene capable of inducing apoptosis (Grishin et al. 2001) and thus might provide a link to pip92's cell death-evoking potential.
Conclusion
Here, we have shown that restriction-mediated differential display can identify many regulated genes in focal cerebral ischemia that have not been detected before by other screening approaches. A surprisingly high percentage of regulated genes was found to be co-regulated on the contralateral hemisphere (e.g. the metallothioneins), implicating induction of these genes by electrical spreading depression, or transcallosal communication. Pip92, a gene with similar induction characteristics to the metallothioneins was found to act as a pro-apoptotic protein in vitro. Further work is needed to clarify the role of a number of other interesting genes identified here.
Footnotes
Acknowledgements
We thank Rebecca Wü rz, Claudia Brosch, Siena Kiess, Frank Herzog, and Jomana Naim for expert technical assistance.