
Abstract
Whole genome expression microarrays can be used to study gene expression in blood, which comes in part from leukocytes, immature platelets, and red blood cells. Since these cells are important in the pathogenesis of stroke, RNA provides an index of these cellular responses to stroke. Our studies in rats have shown specific gene expression changes 24 hours after ischemic stroke, hemorrhage, status epilepticus, hypoxia, hypoglycemia, global ischemia, and following brief focal ischemia that simulated transient ischemic attacks in humans. Human studies show gene expression changes following ischemic stroke. These gene profiles predict a second cohort with > 90% sensitivity and specificity. Gene profiles for ischemic stroke caused by large-vessel atherosclerosis and cardioembolism have been described that predict a second cohort with > 85% sensitivity and specificity. Atherosclerotic genes were associated with clotting, platelets, and monocytes, and cardioembolic genes were associated with inflammation, infection, and neutrophils. These gene profiles predicted the cause of stroke in 58% of cryptogenic patients. These studies will provide diagnostic, prognostic, and therapeutic markers, and will advance our understanding of stroke in humans. New techniques to measure all coding and noncoding RNAs along with alternatively spliced transcripts will markedly advance molecular studies of human stroke.
Introduction—blood and blood vessels in stroke
Ischemic stroke, in most cases, is a disease of the vasculature and blood, involving platelets, red blood cells, clotting factors, inflammatory cells, and endothelium. Though the result is ischemic brain damage, the primary disease process does not generally relate to the brain tissue itself except in some diseases such as mitochondrial diseases. Most strokes in humans are due to large-vessel atherosclerotic disease, cardioembolic disease (blood clots), and lacunar small vessel disease (Amarenco et al, 2009). Atherosclerosis is an inflammatory disease due to a complex interaction between lipids, endothelium, and vascular risk factors (Chalela, 2009; Chamorro and Hallenbeck, 2006; Hansson, 2009). Atherosclerotic plaques cause stroke by thromboembolism of clot/platelets formed at the plaque or following plaque fragmentation (Chalela, 2009; Wu and Grotta, 2010). Cardioembolic stroke represents a group of cardiac disorders with a propensity to form blood clots in the heart that embolize to brain (Babarro et al, 2009). The third major stroke subtype, lacunar, is due to ‘lipohyalinosis' of small penetrating vessels in the brain (Nah et al, 2010; Stevenson et al, 2010).
Thus, studies of blood cells and vessels are very relevant for understanding all subtypes of ischemic stroke. The role of the immune system has also gained more attention based upon human and animal studies. The importance of the immune system in human stroke was emphasized by the Enlimomab trial, which worsened outcome. In a follow-up animal study it was found that the deleterious effect of the murine anti-intercellular adhesion molecule 1 (ICAM-1) antibody was probably due to the augmentation of ischemic brain injury by the immunogenicity of the Enlimolab antibody (Furuya et al, 2001). Though considered a ‘negative’ trial, this trial does point out the great importance of the immune system involvement in human ischemic stroke (Furuya et al, 2001). An increasing number of animal studies demonstrate the role of inflammatory cytokines, chemokines, neutrophils, lymphocytes, monocytes, and a variety of other immune molecules including toll receptors in modulating stroke outcome (Becker, 2010; Chamorro and Hallenbeck, 2006; del Zoppo, 2010; Downes and Crack, 2010; Elkind, 2010; Hallenbeck, 2010; Marsh et al, 2009). These studies prompted our studies of gene expression in blood to evaluate cerebrovascular diseases.
Markers for stroke assessed from blood
A benefit of studying blood is that one could potentially derive biomarkers of stroke to facilitate diagnosis, determine cause, offer prognostic information, and provide insight into pathogenesis and prevention. A number of potential biomarkers have been examined including proteins, peptides, cytokines, chemokines, metabolites, leukocytes, platelets, stem or progenitor cells, microparticles, and others (Jickling et al, 2009; Reid et al, 2010). Most studies have examined serum or plasma. The goal of many studies has been to search for proteins released from injured neurons, glia, or endothelial cells that could be used as indicators of tissue damage. These molecules are the subject of a number of recent reviews (Chavez et al, 2009; Dassan et al, 2009; El Husseini and Laskowitz, 2010; Elkind, 2009; Foerch et al, 2009; Jensen et al, 2009; Montaner, 2009; Saenger and Christenson, 2010; Whiteley et al, 2009a, b).
This review will focus primarily on RNA expression in blood following stroke (Sharp et al, 2006). The rationale for examining RNA is outlined below, followed by proof-of-principle studies in animals that formed the basis for subsequent human studies. This review will mainly summarize our own studies and those most related to them. This is done because it is difficult to compare between platforms and using different approaches for isolating cells and isolating RNA. We recommend other studies as a contrast to our own since most support the same proof-of-principles even if the same molecules were not always identified (Baird, 2006, 2007; Barr et al, 2010; Carmichael, 2003; Freedman et al, 2010; Grond-Ginsbach et al, 2008, 2009; Kassner et al, 2009; Li et al, 2010; Ridder et al, 2009).
Advantages of RNA and microarrays
RNA was studied for several reasons. RNA is induced extremely rapidly (within minutes) well before events could be detected using protein markers. Second, almost all of the currently known coding RNAs have been described and are available on a single platform (Alizadeh et al, 2000). This provides a major advantage over many protein biomarker studies. Using arrays of all known RNAs allows one to derive ‘the best’ markers rather than prospectively guessing at what the best biomarkers might be (Tang et al, 2001, 2002, 2005).
The approaches for identifying proteomic markers are quite different (Zhang et al, 2008). The most common approach uses candidate protein biomarkers, which may or may not be the best. Alternative proteomics approaches use mass spectrometry and some sort of preselection, which usually assesses only part of the proteome (Yao et al, 2009). However, protein biomarkers for vasospasm after subarachnoid hemorrhage have been discovered using this approach (King et al, 2010; Maurer et al, 2007, 2008). Mass spectrometry offers the advantage of being able to examine protein modifications and isoforms. However, newer RNA technologies are making it possible to also examine alternative splicing using exon arrays or high-throughput RNA sequencing.
One potential advantage of identifying RNAs that are regulated in stroke is that these might serve to guide the search for similarly regulated proteins. However, this may not be desirable. First, some RNAs do not code for proteins. Second, the synthesis of some RNAs does not result in a corresponding change of protein synthesis. Third, the RNAs usually represent intracellular molecules, with the possible exception of some microRNAs, most of which are not secreted from the leukocytes, platelets, and red blood cells. Thus, RNA itself might be preferable for some indications like studying the immune response, and proteins would be preferred for other indications like injury to endothelium, glia, and neurons.
Disadvantages of RNA and microarrays
Studying RNA in blood of stroke patients has been challenging. Fold changes of expression are usually less than twofold, making detection of biological effects difficult. At present, studies of whole blood are the most feasible and thus lose specificity related to responses of specific cell types. This is because we use special vacutainer tubes to obtain whole blood via venipuncture, which lyse all cells and immediately stabilize released RNA. This is essential since RNA is unstable and rapidly degrades unless stabilized. The other disadvantage of RNA is that it can be slow to measure—requiring arrays, reverse transcriptase polymerase chain reaction (PCR), or blots. This may be resolved in part by attempts at developing point of care PCR (Lee et al, 2010).
Why study leukocyte RNA in blood of stroke patients
A conceptual issue in the field has been how leukocytes can report on or respond to brain infarction. Though the answer is still unclear, leukocytes patrol the body, interact with cells from every tissue, endothelial cells of the vasculature, foreign organisms or cells, injured cells and every element within blood (Franks et al, 2010). In addition, leukocytes have a complement of expressed RNAs that reflect a combination of the genetics of these cells as well as the interactions of those cells with their environment.
In Figure 1, we show an overview of how leukocytes might respond to cues relevant to stroke in humans. Leukocytes of all types express various adhesion molecules on their surface and interact with normal or inflamed endothelium (Figure 1) (Pries and Kuebler, 2006). Thus, injured brain signals to endothelium to express different adhesion molecules on the luminal side of the vessel, which in turn signal to leukocytes (Beck et al, 1997). Leukocytes in blood are known to interact with both platelets and elements of the atherosclerotic plaque and may contribute to disease (Caplan and Fisher, 2007; Franks et al, 2010; Htun et al, 2006). Thus, endothelial cell-platelet interactions signal to leukocytes and endothelial cell-atherosclerotic plaque interactions signal to leukocytes (Clark et al, 1993). Moreover, blood clots that form in the heart or other sites are detected by circulating leukocytes. In addition, the platelets and clots that form on atherosclerotic plaques interact with leukocytes, which may contribute to instability of the potentially embolic elements (Akopov et al, 1996). Finally, leukocytes independent of the above influences respond to cytokines, chemokines, hormones, and other molecules in blood, which differ as a function of the genetics of each individual cell and their environment (Figure 1). Indeed, each of the above leukocyte interactions results from a complex interplay of the individual environmental interactions of each cell and the genetic make up of the cells (Elneihoum et al, 1996). Thus, though leukocytes themselves do not cause strokes, they can sense and likely have specific intracellular signaling related to the main causes of stroke. The rapidly growing literature on the immune response to stroke and associated signaling events is beyond the scope of this review.
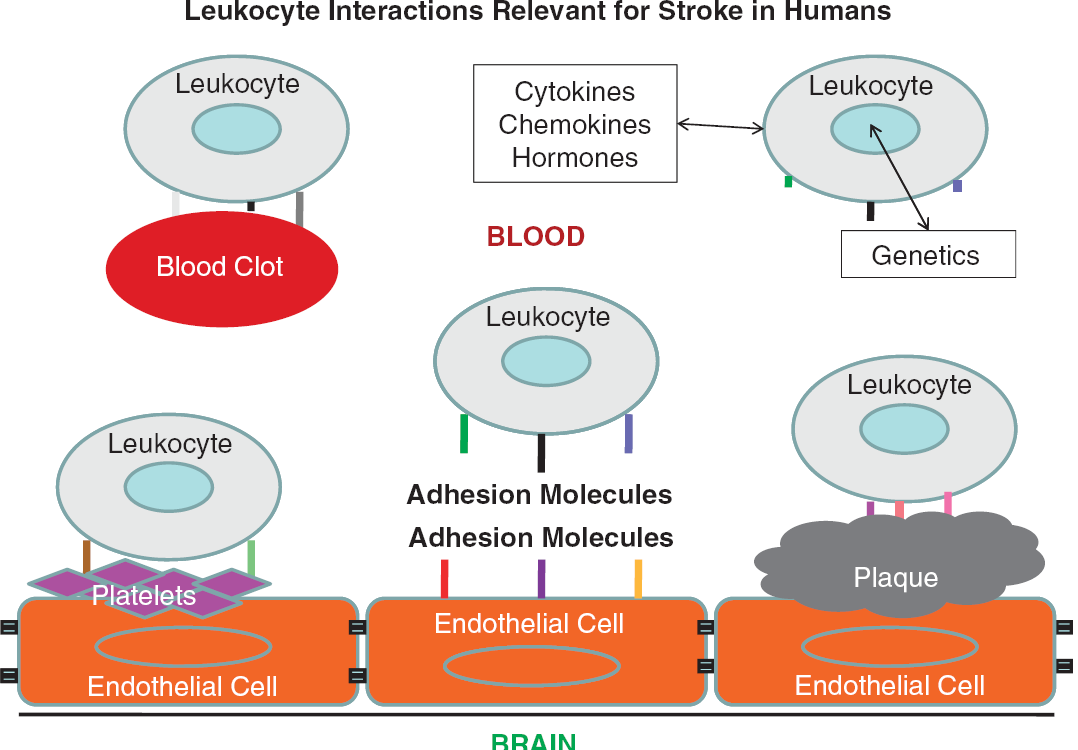
Leukocyte interactions with intravascular elements relevant for stroke in humans. Leukocytes (neutrophils, lymphocytes, monocytes), platelets, red blood cells, and other cells interact with each other and with endothelial cells in normal vessels. Leukocyte interactions with endothelial cells, platelets, atherosclerotic plaque, blood clots, and intravascular molecules (cytokines, chemokines, hormones, others) likely account for some changes of gene expression following stroke. Leukocytes also signal to these other cell types, which also account for changes of gene expression.
Animal studies—focal ischemia, hemorrhage, seizures, hypoxia, hypoglycemia
Even assuming leukocytes detect all of the events pictured in Figure 1, we initially had no idea whether there would be enough reactive leukocytes in blood that could be detected by taking a single blood sample from an animal or human at a single point in time. After all, there are hundreds of thousands of leukocytes in peripheral blood only a fraction of which might respond to factors related to stroke, potentially making it difficult or impossible to detect RNA changes in the few leukocytes collected in a single blood sample. To address this question, we performed the first study of its kind using several different experimental brain injury models in rats (Tang et al, 2001).
Adult rats were subjected to experimental ischemic strokes, hemorrhagic strokes, kainic acid-induced status epilepticus, insulin-induced hypoglycemia, or hypoxia and compared with sham-operated controls and to untouched, naive controls (Tang et al, 2001). At 24 hours, RNA from peripheral blood monocytes (PBMCs) was processed on Affymetrix microarrays. There were hundreds of upregulated and downregulated genes for each condition compared with sham or untouched controls (Figure 2A). This study demonstrated that (1) there were detectable changes of gene expression in blood 24 hours after each injury; (2) no single gene was specific for a given injury; and (3) there were groups or ‘profiles' of genes that distinguished each condition from the other (Tang et al, 2001) (Figure 2A). Though there were genes shared by every injury, perhaps related to stress or similar mechanisms of injury, there were profiles specific for the injury (Figure 2B). Comparisons of expression using arrays (Figure 2B, teal) and PCR (Figure 2B, blue) showed very similar patterns for each even in these early studies (Figure 2B), which has been validated in many studies since that time (Git et al, 2010; Mieczkowski et al, 2010).
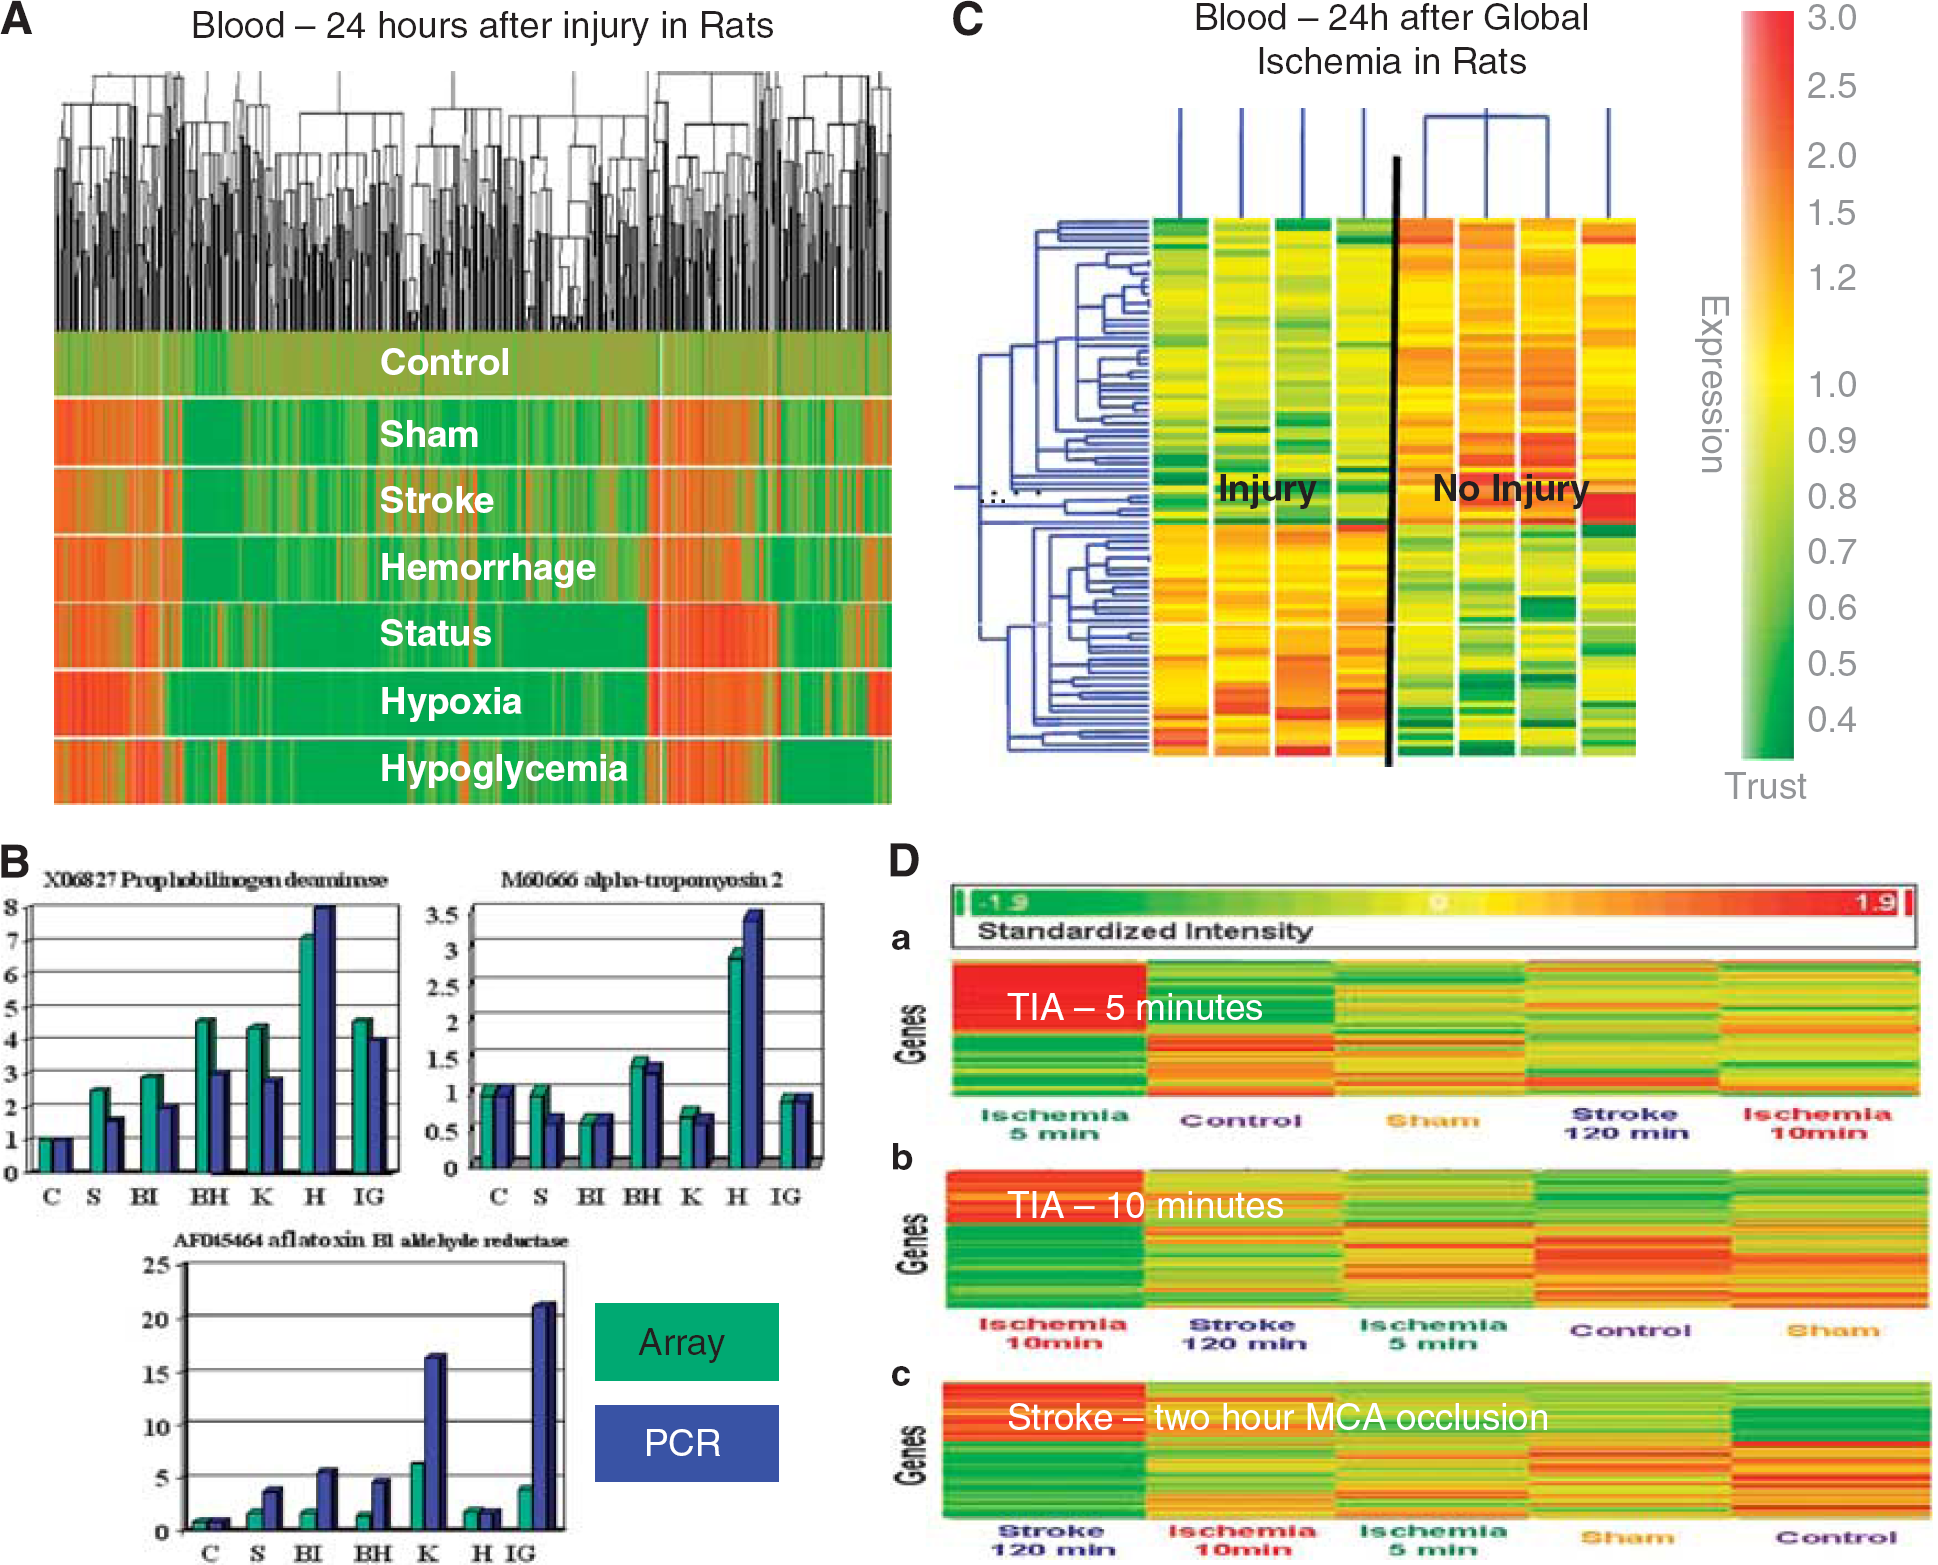
Animal studies of gene expression in blood following cerebral ischemia and other injuries. (
These studies provided the first proof-of-principle that gene expression in blood changed 1 day following brain injury and following systemic metabolic stresses like hypoxia and hypoglycemia (Tang et al, 2001). The studies also showed that different types of brain injury were associated with specific gene expression profiles in blood. In a follow-up study we demonstrated that there were specific gene profiles in brain for each of these injuries as well (Tang et al, 2002). Just as in the blood, there were genes that were common to all of the injuries and could represent responses to stress, neuronal injury, or death and other factors common to each condition. Though many genes expressed in blood were also expressed in brain, the majority were different (Tang et al, 2002). Thus, one cannot necessarily use blood to infer changes of gene expression in brain.
Animal studies—injury (neuronal cell death) versus no injury
We next determined whether there might be a profile for ‘neuronal injury.’ Global ischemia was produced by bilateral carotid occlusion in rats, which resulted in no cell death in some animals and cell death in hippocampus and cortex documented with terminal deoxynucleotidyl transferase-mediated 2'-deoxyuridine 5'-triphosphate-biotin nick end labeling (Tang et al, 2003). Blood obtained from these animals 24 hours later showed 37 upregulated and 67 downregulated genes in the ‘injury’ animals compared with the ‘no injury’ animals (Figure 2C). These data were important for showing that gene expression changes were detectable even when there was selective neuronal cell death (Tang et al, 2003).
Animal studies—transient focal cerebral ischemia
Recent studies have also shown changes of gene expression in blood of rats following brief periods of focal ischemia that mimic human transient ischemic attacks (Zhan et al, 2008, 2010). Adult rats were subjected to sham operations or 5 minutes, 10 minutes, or 2 hours of middle cerebral artery ischemia using the suture model. Hsp70 protein was induced 24, 48, and 72 hours later in neurons throughout the middle cerebral artery territory. Following 5 and 10 minutes middle cerebral artery occlusions, 9 of 32 animals (28%) had microinfarcts in striatum (Zhan et al, 2008). These studies showed that brief ischemia in animals can be associated with microinfarcts in some animals. Moreover, there was a stress gene response in the ‘penumbra’ in brain as manifested by induction of Hsp70 protein in the middle cerebral artery distribution. We postulated that these molecular responses in brain would be associated with molecular responses of circulating leukocytes (Zhan et al, 2008).
To test this, the identical study was performed except that whole blood was obtained at 24 hours following 5, 10, or 120 minutes of focal cerebral ischemia (Zhan et al, 2010). These studies showed genes regulated in blood that were specific for 5, 10, and 120 minutes of focal ischemia (Figure 2D). Moreover, there were 103 genes common to brief focal ischemia and ischemic stroke (Zhan et al, 2010). The data confirm immune responses to brain that may not be associated with cell death. The nature of this ‘sublethal’ signaling is less clear but might include cytokines and chemokines that could signal from brain to blood and blood to brain.
Human studies—first study assessing diagnosis of ischemic stroke (2005)
The first human study to assess RNA expression in stroke was published by the Baird group (Moore et al, 2005). Using PBMCs obtained 1 to 4 days following ischemic stroke, 190 genes were significantly regulated in 20 stroke compared with 20 control subjects (Moore et al, 2005). A panel of 22 genes derived from the prediction analysis for microarrays algorithm in the index cohort (
Human studies—whole genome, whole blood studies of ischemic stroke
In our initial rodent study (Tang et al, 2001), and in the first human study (Moore et al, 2005) blood was drawn and then PBMCs were separated from the blood using a Ficoll gradient and centrifugation. This procedure in and of itself could affect gene expression in blood. If performed at different times after stroke, or if the methods were not identical, this could affect gene expression.
We therefore utilised PAXgene tubes to address this issue. These commercial vacutainer tubes lyse cells and stabilize RNA, and have proven to be reliable for many clinical studies (Chai et al, 2005; Thach et al, 2003; Vartanian et al, 2009; Yamamoto et al, 2006). Blood from 15 patients was drawn into PAXgene tubes at < 3, 5, and 24 hours after ischemic stroke (
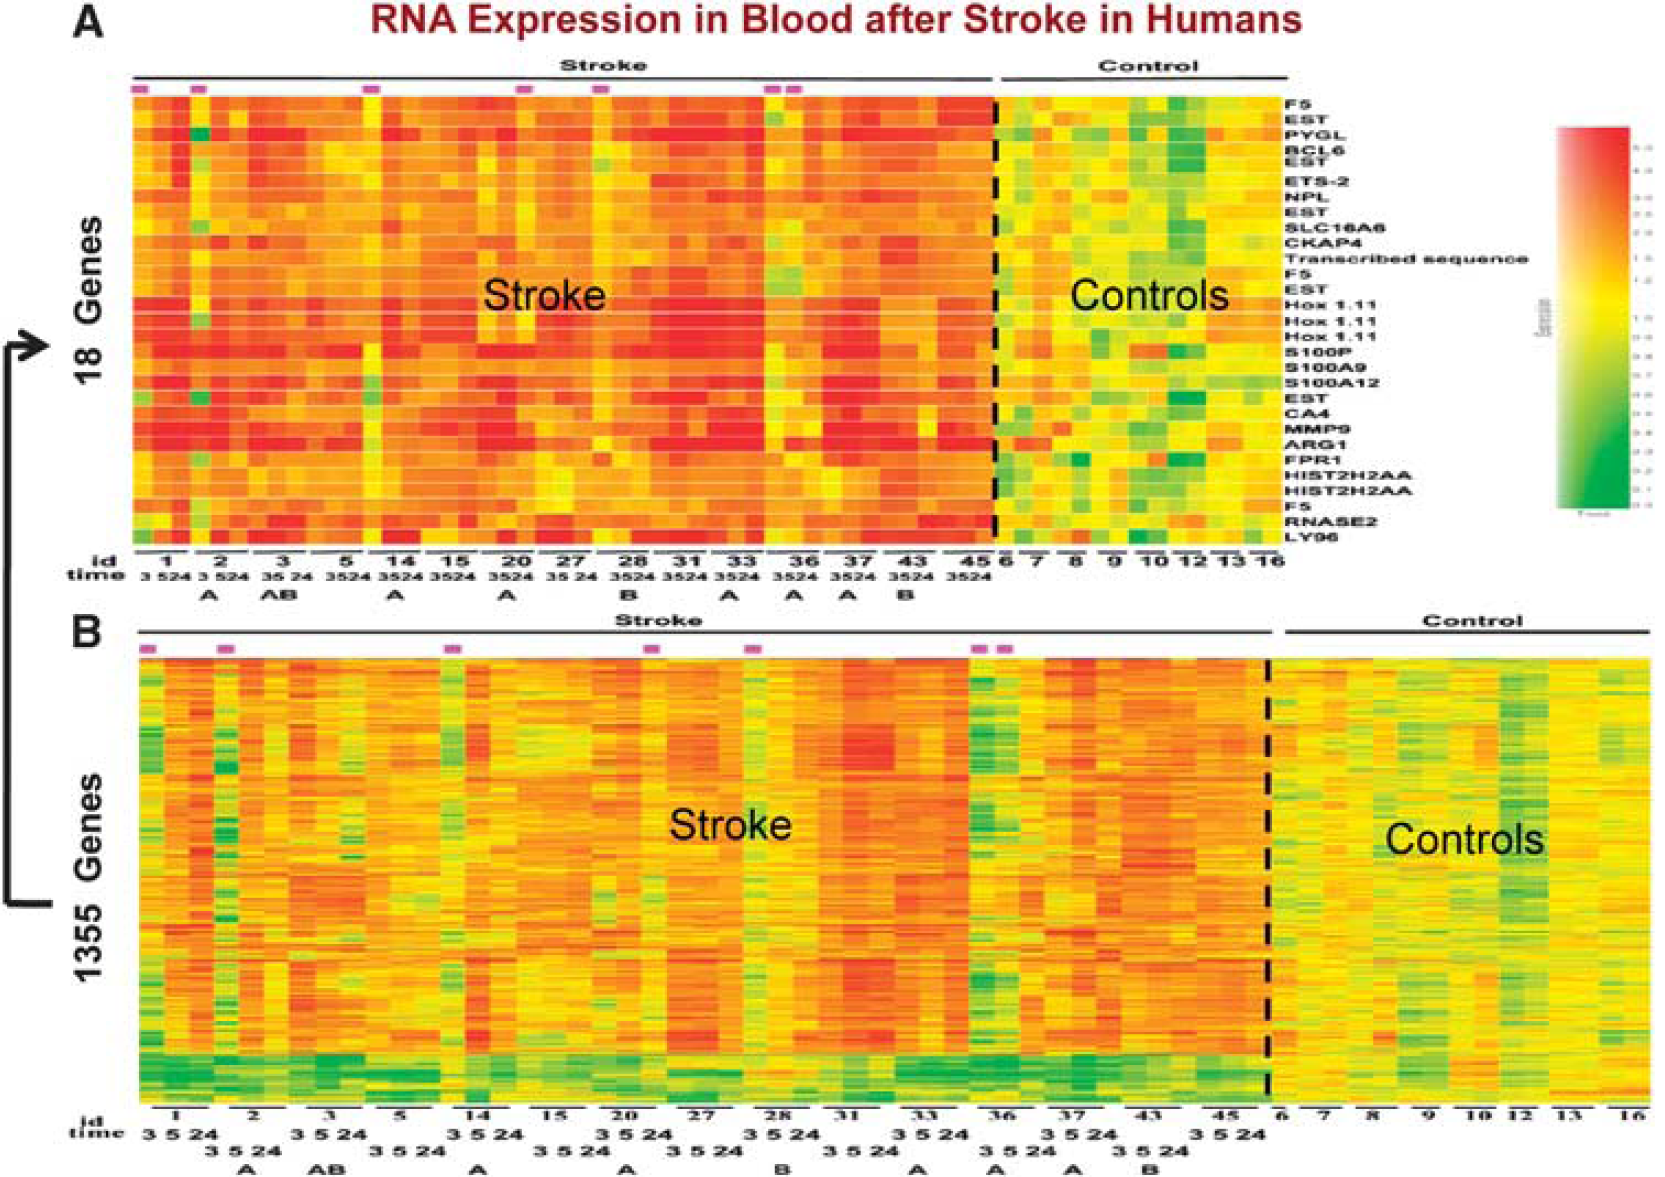
Gene expression in whole blood of humans following ischemic stroke. Patients had whole blood drawn before 3 hours after an ischemic stroke and before treatment with tissue plasminogen activator (tPA) with or without eptifibatide. Blood samples from the same patients were drawn again at 5 and 24 hours. RNA from these samples was processed on whole genome microarrays. When comparing ischemic stroke to control patients, over 1,000 genes were regulated in blood (
To address the issue of reproducibility, we have recently repeated our initial study in a larger cohort (Stamova et al, 2010). Thus, patients with ischemic stroke (
Sensitivity and specificity of diagnosing ischemic stroke (
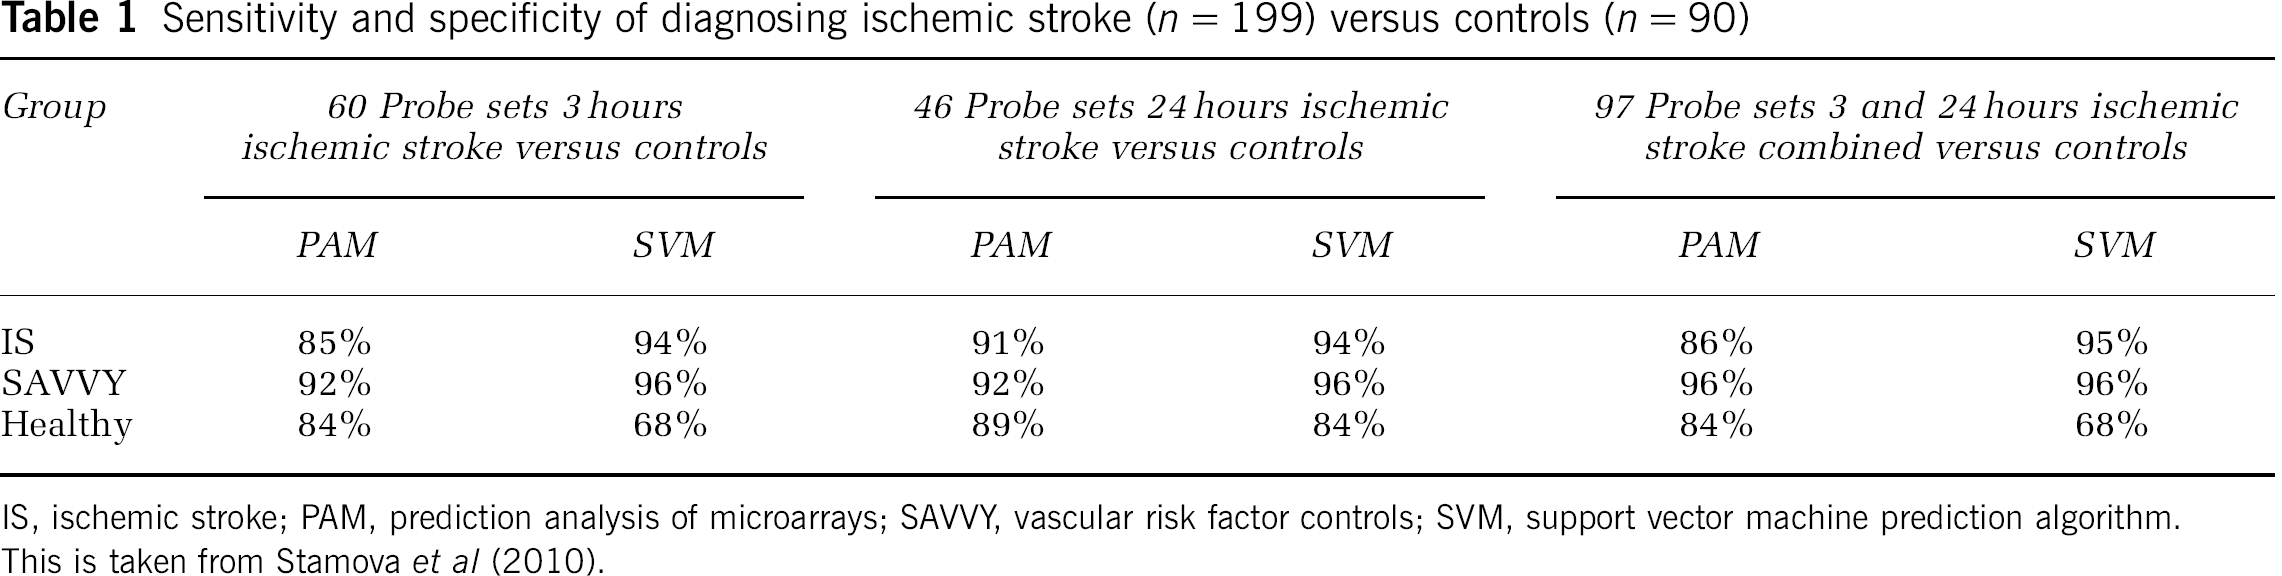
IS, ischemic stroke; PAM, prediction analysis of microarrays; SAVVY, vascular risk factor controls; SVM, support vector machine prediction algorithm. This is taken from Stamova et al (2010).
Finally, another recent study from Barr supports the above findings. Whole blood was obtained in PAXgene tubes from 39 ischemic stroke patients and 25 healthy control subjects (Barr et al, 2010). RNA was processed on Illumina HumanRef-8v2 bead chips. Among a large number of regulated genes, they identified a nine-gene profile that separated ischemic stroke patients compared with controls (Barr et al, 2010). Moreover, five of these nine genes were identified in our previous study (Tang et al, 2006). Thus, another group has confirmed at least a core set of genes, and we have replicated our own gene expression studies following ischemic stroke. All of these studies, however, are confounded to some degree by various treatments, comparisons to healthy controls, variations in time after stroke, different risk factors between groups and differences of age, race, and gender. Nonetheless, the first test of the technology has been achieved: replication of results and independent validation by at least two different groups. Such promising results provide strong support for further study.
Causes of stroke in humans—large vessel and cardioembolic
Early on it was apparent that developing a ‘diagnostic test for stroke’ would be difficult, and perhaps not of practical use unless it could be performed within the first few hours of stroke. In addition, a diagnostic test would not only have to diagnose ischemic stroke but rule out hemorrhagic stroke if it were used to guide acute stroke treatments such as tissue plasminogen activator (tPA).
Thus, we have approached different questions that could be rapidly translated to the care of stroke patients. We asked whether gene profiles in blood exist that are specific for the different causes of ischemic stroke. The main reason for developing such profiles would be to use them to diagnose the cause of ischemic stroke in those patients with ‘cryptogenic stroke’ with no known cause who represent approximately one third of all ischemic strokes.
In the first study, whole blood was collected in PAXgene tubes from acute ischemic stroke patients (< 3, 5, and 24 hours) and healthy controls. RNA was isolated and processed on Affymetrix Human U133 Plus 2.0 Arrays. Expression profiles in the blood of cardioembolic stroke patients differed from large-vessel atherosclerotic stroke patients (Figure 4). Of the 77 genes that differed between the two groups (fold change > 1.5,
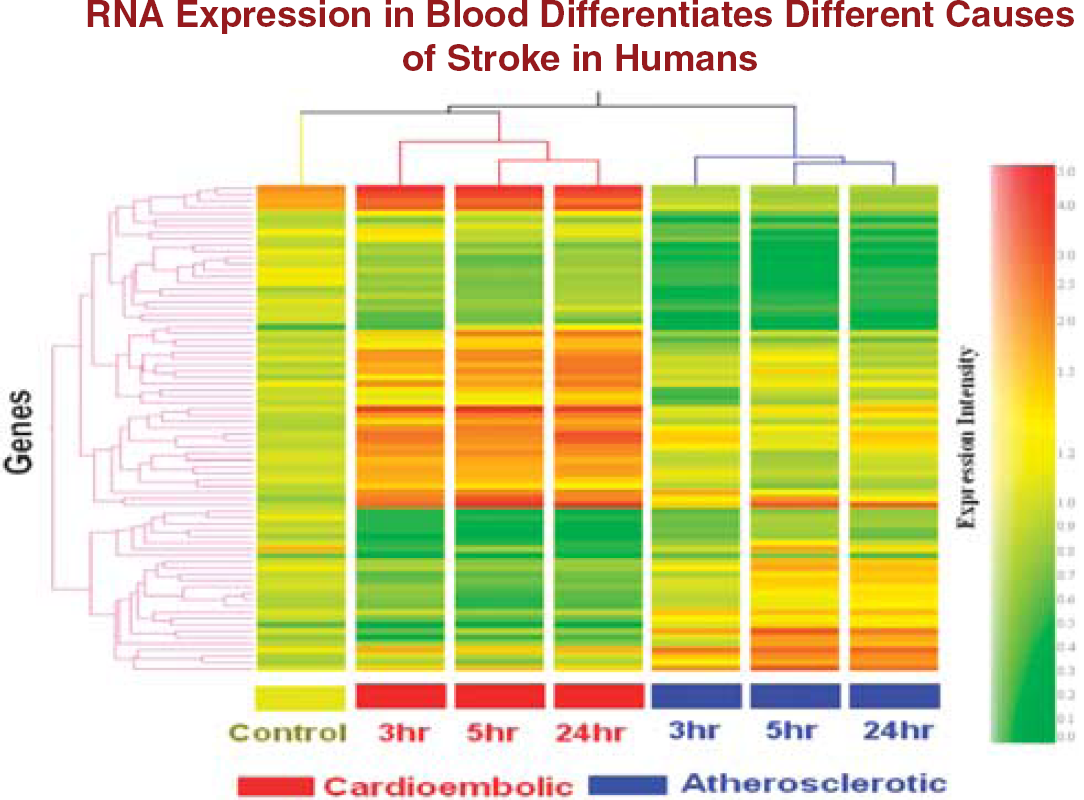
Cluster analysis of the 77 genes (analysis of variance (ANOVA),
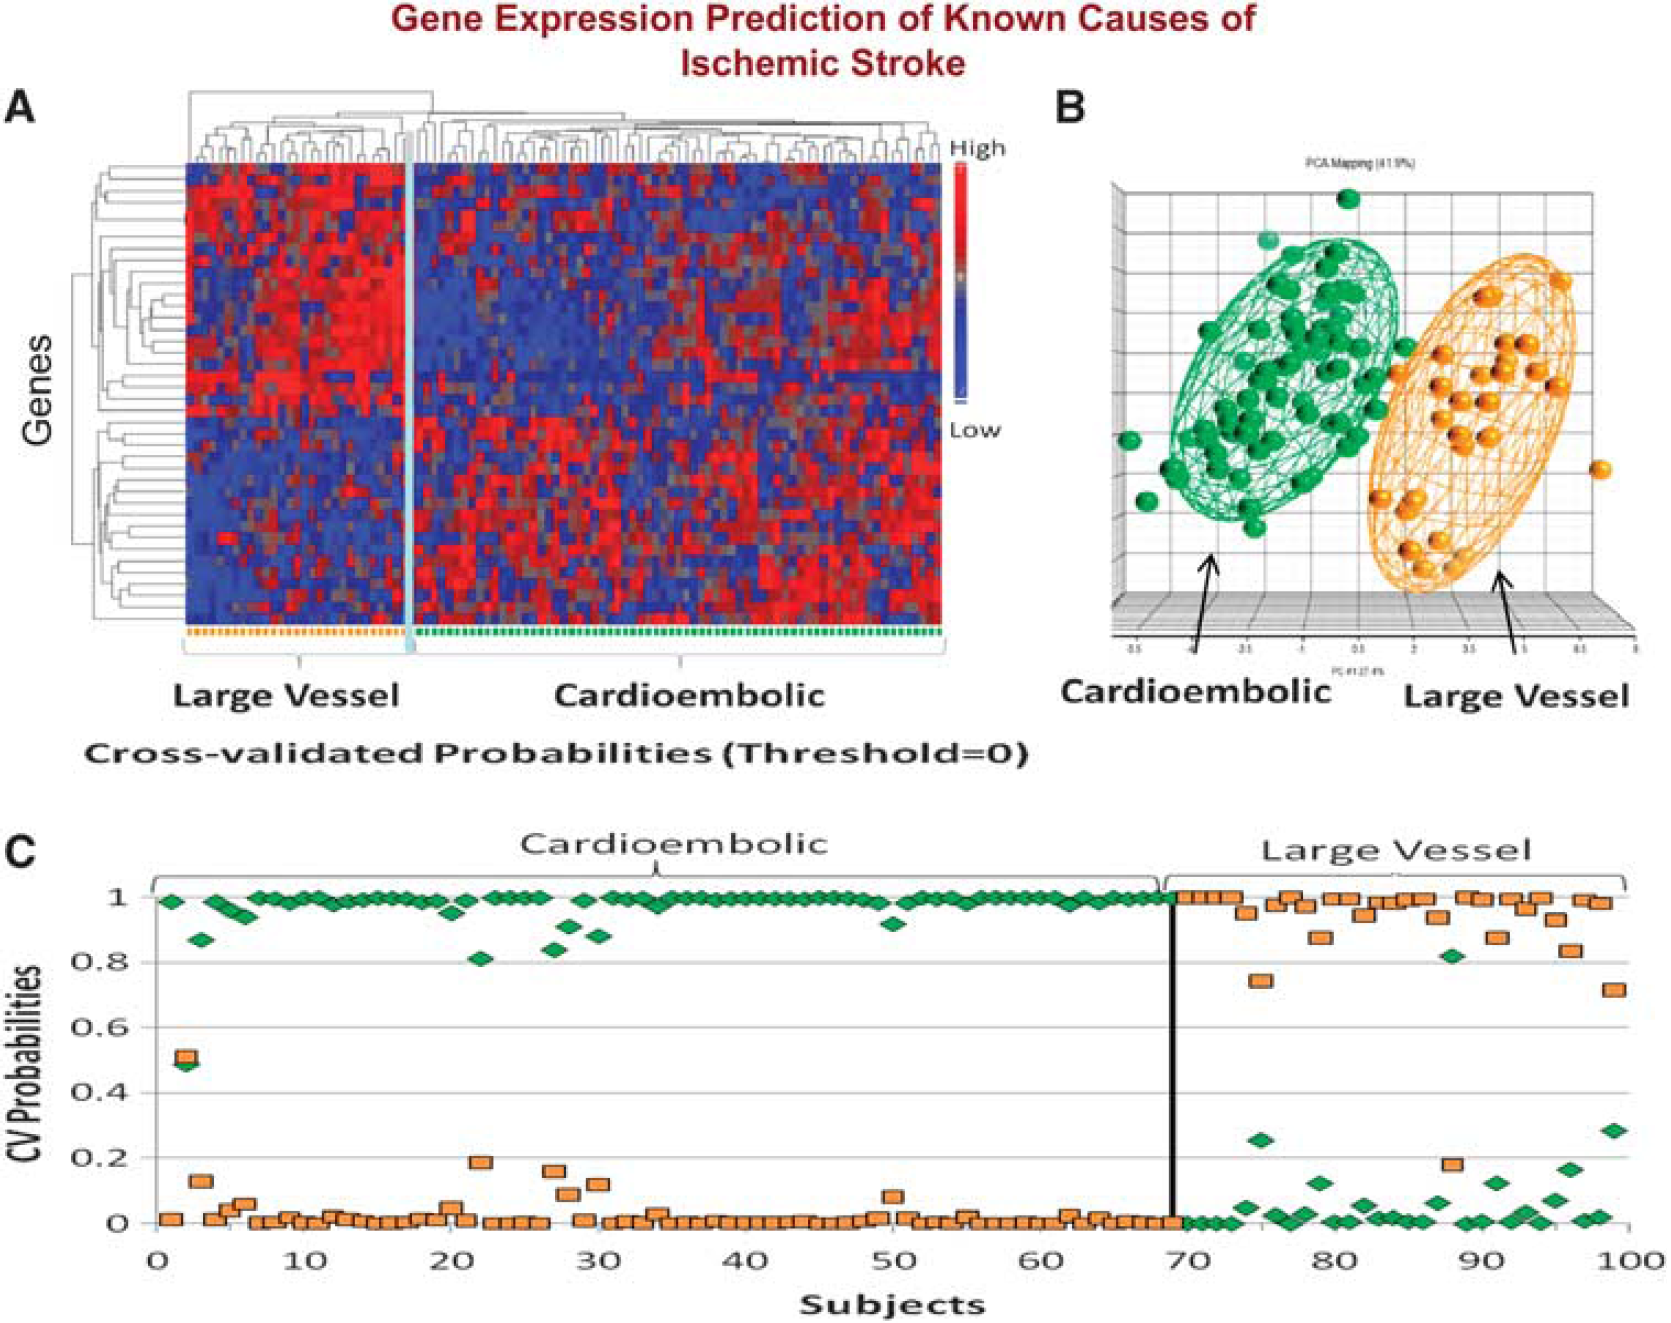
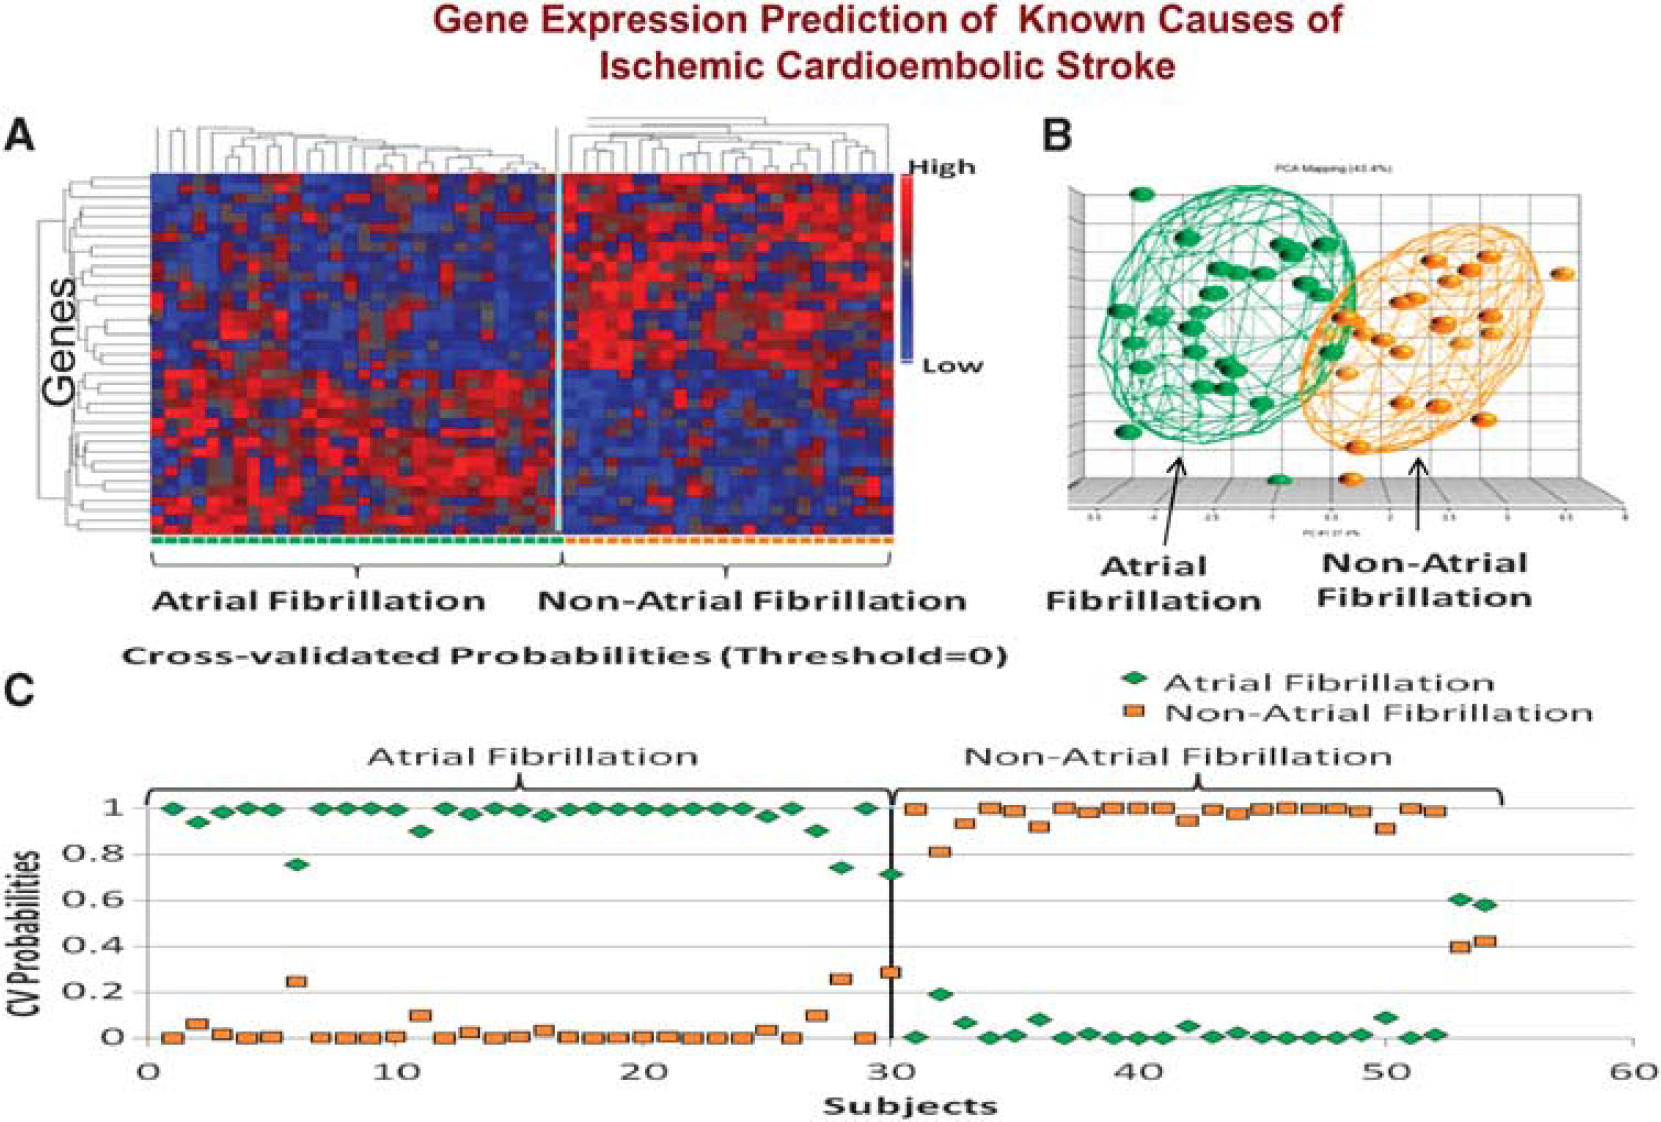
We have recently confirmed these initial findings using identical methods to study 194 samples from 76 acute ischemic stroke patients (Jickling et al, 2010). A 40-gene profile differentiated cardioembolic stroke from large-vessel stroke with > 90% sensitivity and specificity (Figure 5). A separate 37-gene profile differentiated cardioembolic stroke due to atrial fibrillation from nonatrial fibrillation causes with > 90% sensitivity and specificity (Figure 6). When these profiles were applied to patients with cryptogenic stroke, 17% were predicted to be large vessel and 41% to be cardioembolic stroke. Of the cryptogenic strokes predicted to be cardioembolic, 27% were predicted to have atrial fibrillation (Jickling et al, 2010). Thus, we have demonstrated the feasibility of using gene expression to demonstrate the causes of ischemic stroke, and to use these profiles to predict the causes of cryptogenic stroke.
(
(
Markers versus mechanisms
The above descriptions outline the approach for deriving biomarkers. However, for each analysis we obtain a short list of genes for prediction and a long list of genes for functional analyses (Figure 7). For example, after obtaining data from an experimental data set (stroke) compared with controls, different statistical approaches are used. First, the least number of genes that best distinguish the groups are determined using strict statistical cutoffs. Second, the maximal number of genes/probes that distinguish the two groups are derived using less stringent statistical cutoffs (Figure 7). The least number of genes is used for biomarkers and prediction (diagnosis) (Figure 7). The large list of regulated genes is used to derive the gene ontologies and the known pathways and networks that differentiate the two groups (Figure 7). These changes may represent causes or effects related to the stroke, but nonetheless provide information regarding pathogenesis.
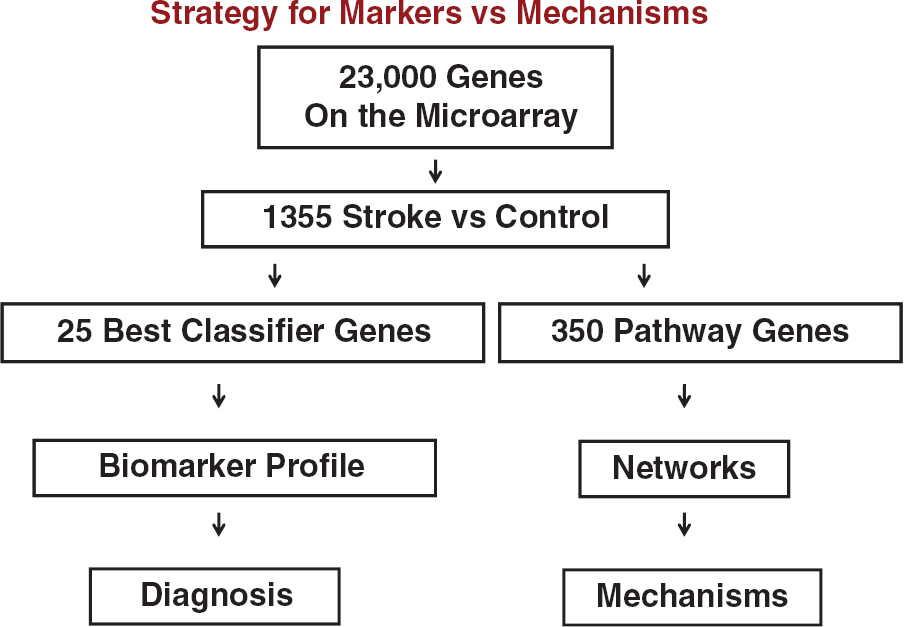
Strategy for deriving gene lists to for prediction (biomarker profile and diagnosis) versus lists to study pathways, networks and mechanisms. Stroke versus controls produces a large gene list using loose statistical criteria. Prediction algorithms (e.g., linear discriminant analysis, support vector machine and others) are used to derive the best classifier/prediction genes, which are then applied to a second test set for prediction. An intermediate statistical cutoff is used to generate a list of hundreds of genes that can then be used for pathway, gene ontology, and other analyses to assess pathways, networks, and mechanisms.
One of the important and difficult to grasp features of these analyses is that there may be no best number of classifier/biomarker/diagnostic genes. For example, a panel of 25, 30, or 35 genes may all have a similar sensitivity and specificity. This can explain why different gene lists might be quite predictive in different studies. Generally, too few genes or too many genes can significantly decrease predictive power.
A different approach is used for pathway analyses. For most studies, a given level of significance is set (corrected
Figures 8–11 provide examples of markers and mechanisms derived from several of our microarray studies. Figure 8 shows the derivation of markers and their use to diagnose cryptogenic stroke (Jickling et al, 2010). Using linear discriminant analysis (or other methods like support vector machines or
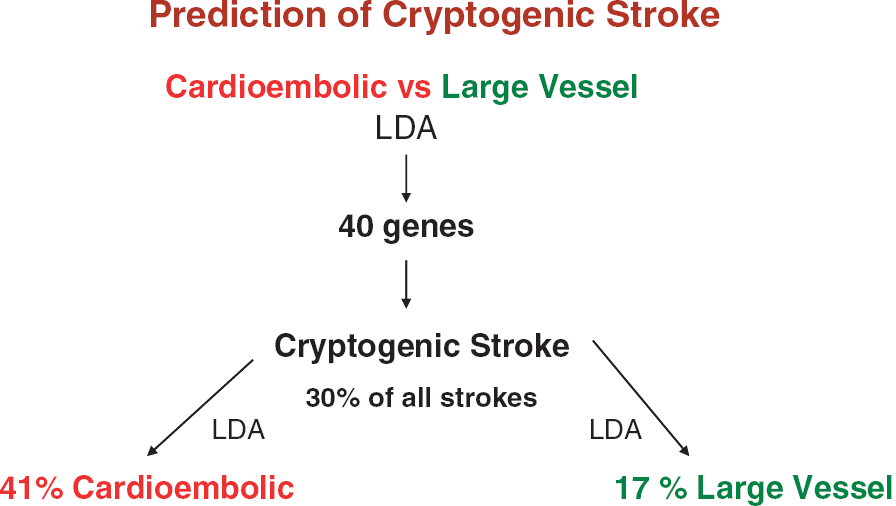
An example of the derivation and use of genes for prediction. Using linear discriminant analysis (LDA), the least number of genes that best differentiate cardioembolic and large-vessel atherosclerotic stroke are derived (
Figure 9 shows how the genes regulated following ischemic stroke change in the interleukin-1A and 1B signaling pathways from 2 to 3 hours (upper panel) compared with 5 hours following stroke (lower panel). Interleukin-1 worsens stroke in most animal models (Allan and Rothwell, 2003; Rothwell and Luheshi, 2000). In humans, it is one of the mediators of the febrile response, which may worsen stroke in and of itself. There are few genes regulated between 2 and 3 hours after stroke whereas by 5 hours virtually every gene in the pathway is regulated (Figure 9; red = upregulated; green = downregulated). This is a little misleading since changes were occurring before 3 hours but these were too small for detection. The data suggest that drugs acting on interleukin-1 pathways could be acting within the therapeutic window for acute human ischemic stroke, i.e., 0 to 4.5 hours.
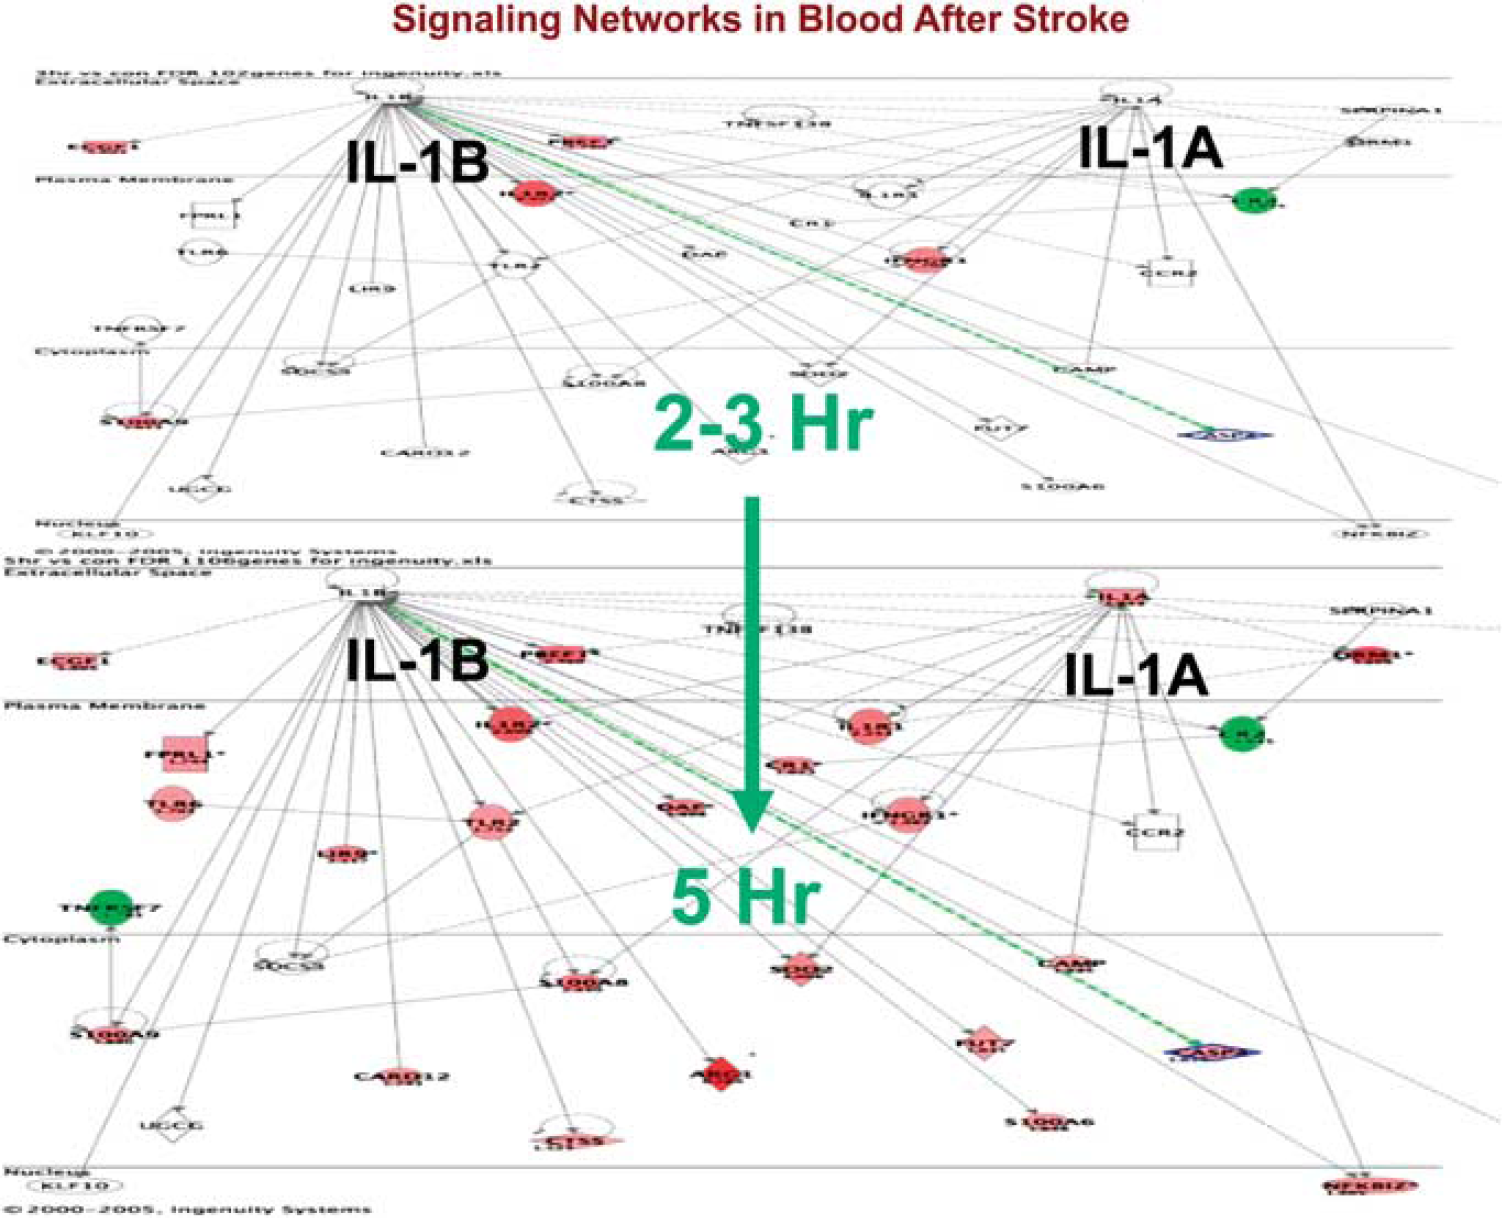
Signaling pathways for interleukin (IL)1A and IL1B at 2 to 3 hours (upper panel) and at 5 hours (lower panel) following ischemic stroke in humans. Data are from Tang et al (2006).
Figure 10 shows how genes that were expressed differentially in cardioembolic versus large-vessel stroke relate to different mechanisms (Xu et al, 2008). For cardioembolic stroke, the main functions were immune response, defense response, response to biotic stimuli, and response to pathogens (Xu et al, 2008). This suggests that inflammation and perhaps even infection might be important in these cardioembolic strokes. In contrast, hemostasis, chemokine activity, and related pathways were the highest ranked functions for large-vessel atherosclerotic stroke. This would be consistent with the observation that antiplatelet agents are useful in decreasing risk from strokes due to large-vessel disease.
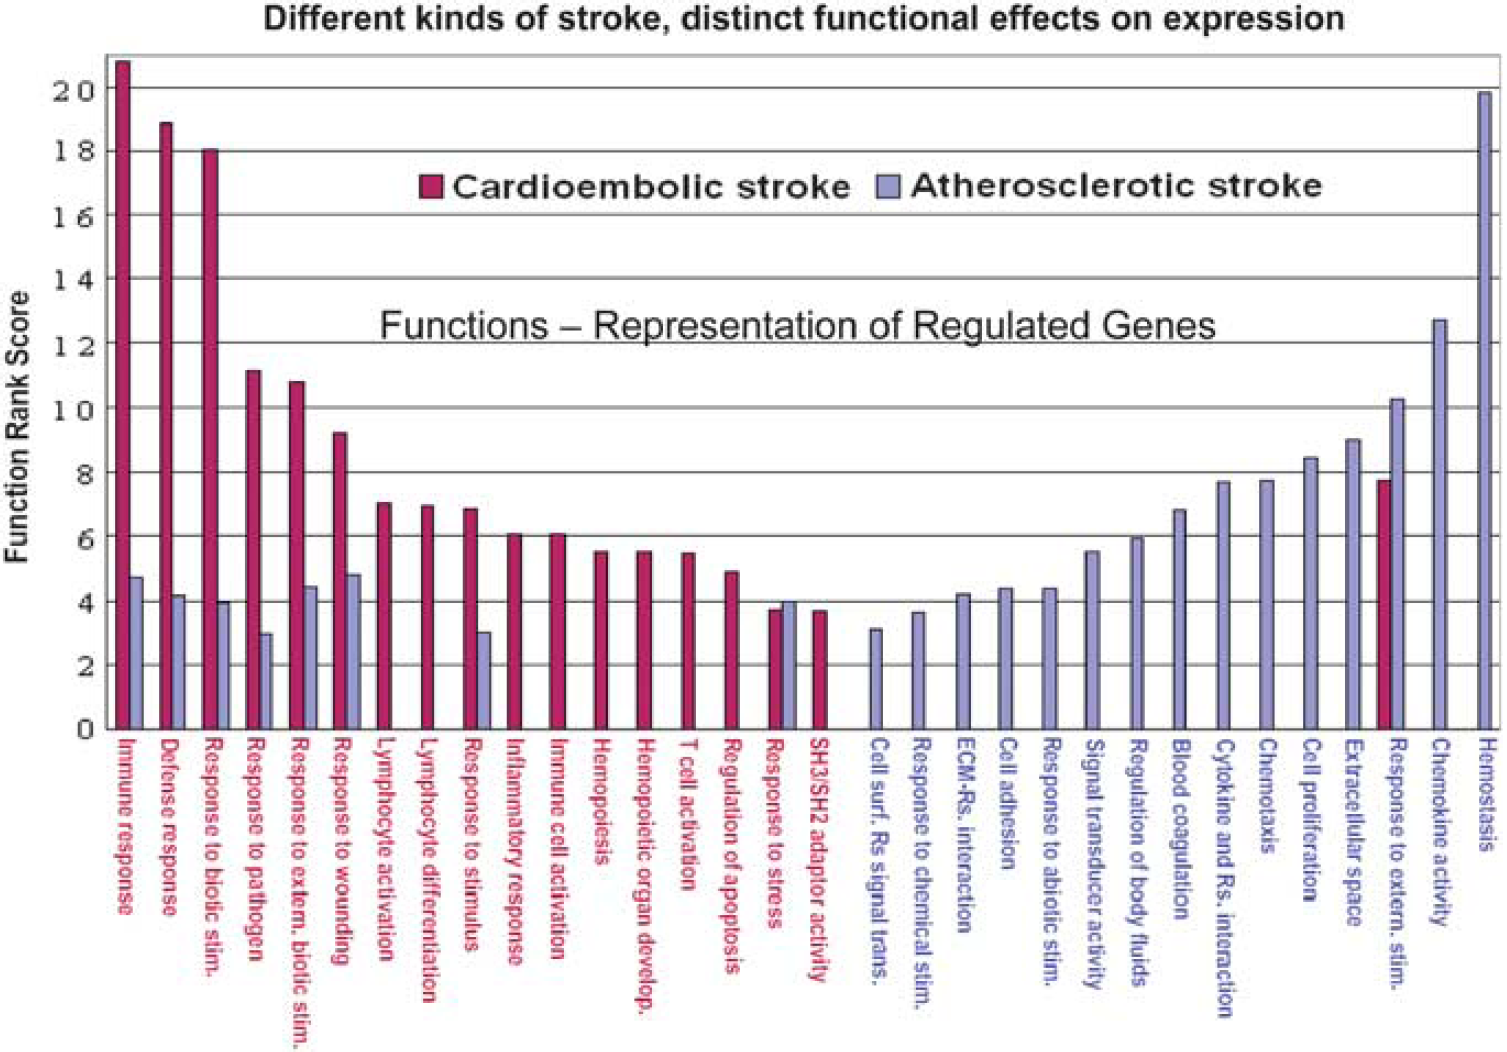
Functional comparisons of cardioembolic stroke-specific genes versus atherosclerotic stroke-specific genes. The function rank score (
White-matter hyperintensities and brain ischemia
RNA expression studies also offer the opportunity to compare with other disease entities and mechanisms shared or not shared with brain ischemia. For example, we recently studied a group of elderly patients with white-matter hyperintensities (WMH) (Xu et al, 2010). White-matter hyperintensities are areas of high signal detected by T2 and fluid-attenuated inversion recovery sequences on brain magnetic resonance imaging. Although associated with aging and vascular risk factors, the pathogenesis of WMH remains unclear. One postulated cause is chronic ‘brain ischemia.’ To address this, 20 subjects with extensive WMH (WMH +), 45% of whom had Alzheimer disease, were compared with 18 with minimal WMH (WMH-), 44% of whom had Alzheimer disease. RNA was processed on HU133 Plus 2.0 microarrays. In all, 241 genes were differentially regulated (fold change > 1.2,
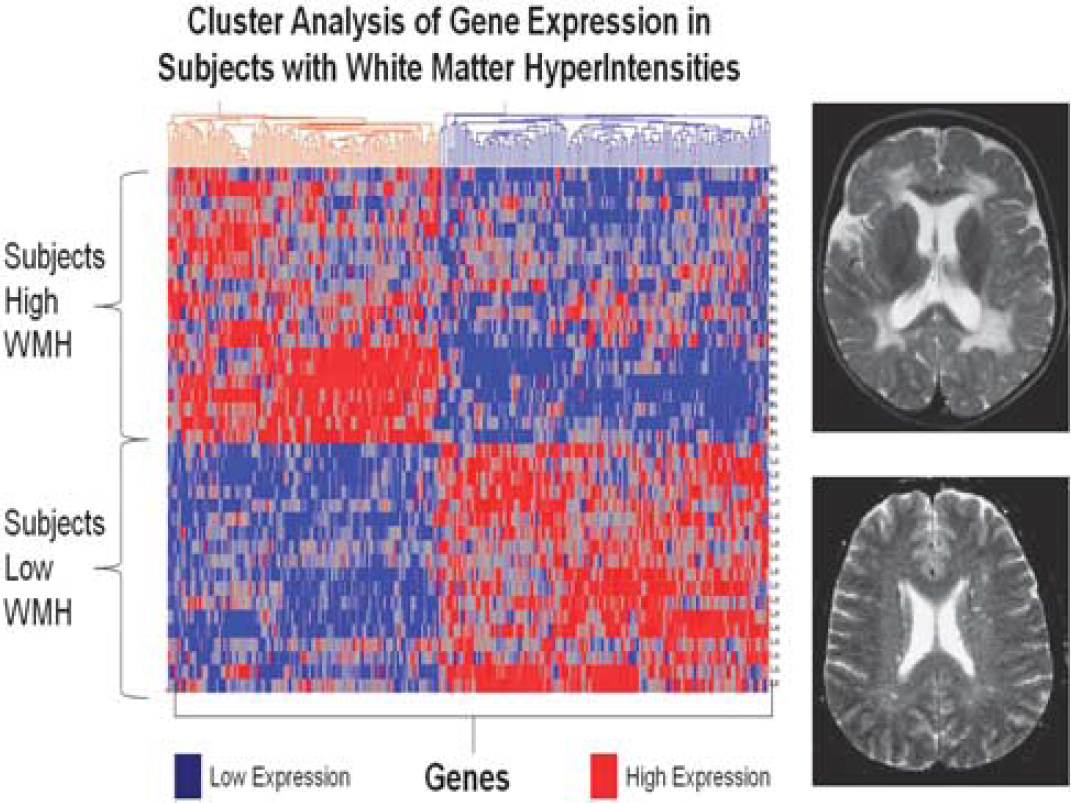
Cluster analysis of white-matter hyperintensity (WMH)-associated genes for normal control subjects and Alzheimer subjects. The 241 genes that were differentially expressed in extensive WMH subjects (high WMH) versus minimal WMH subjects (low WMH) were used for an unsupervised Pearson cluster analysis (
Technical challenges associated with RNA studies
The technical difficulties and multiple methodological and analytical pitfalls associated with these studies cannot be overemphasized. Moreover, the chances for failure are high given the small groups usually being studied, small biological changes that require great technical rigor, and different statistical approaches that can influence study findings.
For those beginning in the field it is critical to read the many reviews that are now available and make critical decisions based upon as much knowledge as possible. Some of the decisions that we have made and why follow. We started with and continue to use Affymetrix arrays. Though expensive, the company has remained in business where others have not. This will be much less of an issue once RNA sequencing is generally used (see below). There have been numerous protocols for RNA isolation and labeling. We have kept with large companies who maintain and support their products with the highest standards. Given the expense of these studies one does not cut corners on reagents. We have avoided major protocol changes unless absolutely necessary. Changes in the protocols that have been made included a DNAase step in RNA isolation, and the use of NuGEN reagents so that very small amounts of RNA can be used for each array (Jickling et al, 2010; Stamova et al, 2010; Xu et al, 2010). If one is contemplating a preliminary study followed by a confirmatory one, one must standardize all methods and arrays across those two studies. Ideally, methods used previously by others should be used if confirmation across studies is desired.
Though now well known in the microarray field, the ‘batch effects' problem is still a major one. This is a problem where one set of samples is run together and then compared with separate samples that are also run together—often separated over some time—or performed in different laboratories. The universal experience is that it is difficult and can be impossible to compare two different ‘batches.’ To combat the batch problem, experimental and control samples must be intermixed, and the samples should be run in the same laboratory and preferably all run at a single time. If samples are to be run at different times or in different locations, there are only a few available approaches.
One approach is to use a reference or standard RNA sample with each batch (Walker et al, 2008). The standard RNA sample is run each time the other samples or groups of samples are run. Spiked RNAs have been used in the past. However, this does not solve the problem. For the control RNA samples, it is critical that the source of the RNA be the same as the source of the target samples (Walker et al, 2008). For example, if ischemic stroke blood samples are compared with control blood samples, then the ‘standard or reference RNA sample’ must be a human blood sample that is identical for every batch and that has been handled and processed in a way identical to that used for the stroke/control samples. This approach allows one to correct across samples on a gene-by-gene basis using a Bayes approach we have published (Walker et al, 2008). The within batch version of this approach is called COMBAT and is publicly available.
Another approach to the batch problem is to use the reference gene approach that we have developed (Stamova et al, 2009). This approach identifies a group of genes that are expressed at similar levels across control and experimental subjects. The control gene approach is similar to the principle applied to reverse transcriptase PCR where a reference gene is run at the same time as the target. The problem with the control gene approach on arrays, however, appears to be that even ‘within array variance’ can be considerable (unpublished data). Rigorous internal reference approaches need to be developed before the results of the data described in this review can be applied in the clinic.
Analytical issues also go beyond the correction for batch effects. In the early gene expression studies of blood, no attempt was made to account for covariates. It has become quite clear, however, that age and gender have large effects on gene expression in blood (Figure 12) (Tang et al, 2004a, b , c, 2005). If there are genetic differences in the cohort, then this alone may segregate subjects based upon gene expression in peripheral blood (Figure 12) (Tang et al, 2004c). Because of the need to account for covariates, analysis of variance approaches are more commonly used now for the statistical analyses. Earlier statistics were based upon permutation approaches, which were excellent at distinguishing groups but often did not account for covariates.
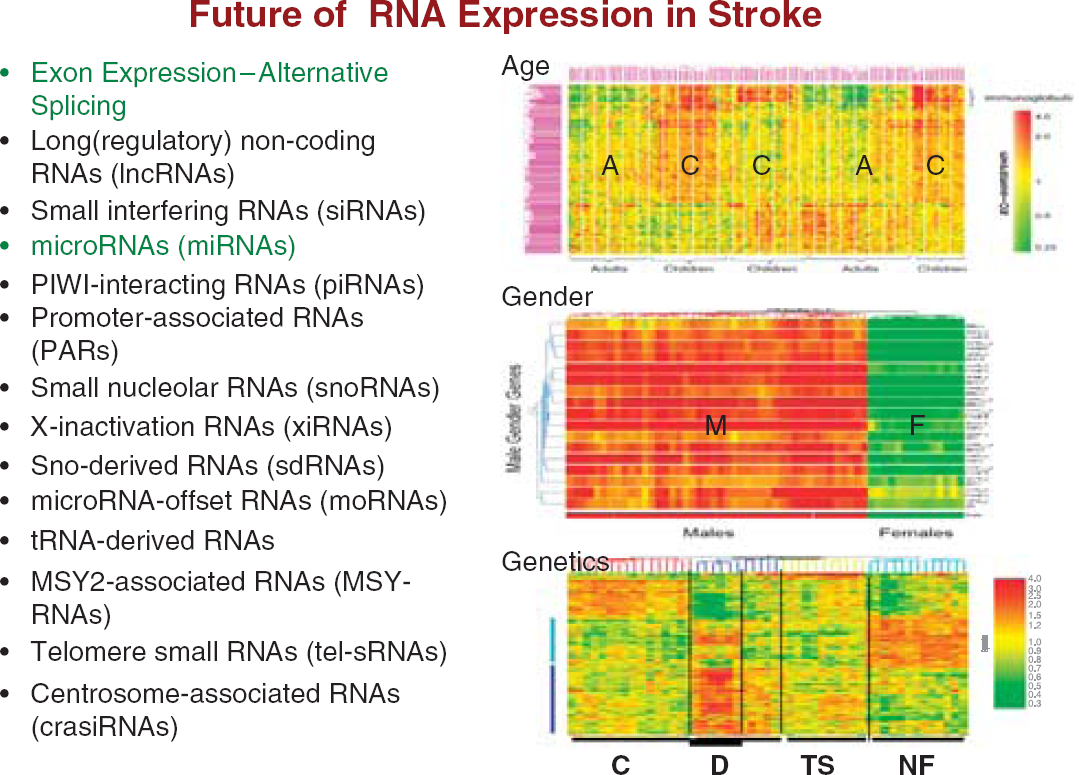
Future studies of RNA expression in blood of subjects with stroke will investigate the effects of age, gender, race, underlying genetic differences in coding and noncoding RNAs. The role of alternative splicing is likely to revolutionize these analyses. Age: A, adults; C, children. Gender: F, females; M, males. Genetics: C, controls; D, Down syndrome; NF, neurofibromatosis; TS, tuberous sclerosis. Figures are adapted from Tang
The next analytical task is to design the study so that marker and mechanism analyses are clear-cut and robust. The first tasks are to identify the ‘regulated genes' between groups. This always requires some sort of within and across chip normalization—RMA, GCRMA, and others. The choice of the normalization method depends upon the array type, group preferences, study goals, and other considerations (Mieczkowski et al, 2010; Millenaar et al, 2006; Shedden et al, 2005; Zakharkin et al, 2005). The statistical criteria for selecting genes are also goal dependent. Some studies have used fold change cutoffs only (Shi et al, 2010), and others have used
Once regulated genes are identified, the tools for deriving biomarkers are excellent. These include prediction analysis of microarrays, support vector machine, linear discriminant analyses, machine learning. and a host of others (Shi et al, 2010). Methods of assessing sensitivity and specificity using receiver operating curves and other approaches are generally used by many and are readily available in various public and private software packages. What is less clear is how ‘to do’ the pathway and network analyses. There are many versions of these approaches—from known protein-protein interaction databases, to information processing-relational databases. One can also assess whether given lists of genes are associated with specific pathways, gene ontologies (molecular function, biological process, cellular compartment), have overrepresentation of transcription factor binding sites, regulated by specific microRNAs, have specific chromosomal distribution, or have other biological features that make them particularly interesting or relevant for a given question (Bammler et al, 2005; Draghici et al, 2003; Hedegaard et al, 2009). Even identifying genes associated with a specific cell type in blood may provide enormous mechanistic information, for example T cells versus B cells versus platelets (Du et al, 2006; Xu et al, 2008). At the present time, these approaches help the researcher distill a very large amount of data into a single word or phrase. They still need to be supplemented by an in-depth review of the literature for each question and study.
Most microarray studies, particularly those of blood, have not replicated single genes. This may relate to the possibility that there may not be a perfect set of predictors for any condition. That is, in our recent replication studies compared with our previously published studies, two different sets of genes predicted the previous study with > 80% sensitivity and specificity, whereas because of the statistical design predicted the current study with > 90% sensitivity and specificity (Jickling et al, 2010; Stamova et al, 2010). Finally, there may be hundreds of predictive genes, and the best predictors might actually vary over different populations at different times.
There are several approaches to validating microarray studies. First, virtually every array study now derives a set of gene predictors and then uses these to perform ‘crossvalidation’ on the same cohort. If this does not produce > 80% sensitivity and specificity, then the prospects for these predictors being useful and replicable are poor. In addition, this is not an acceptable method for accounting for multiple comparisons since it tests the predictors on the gene set from which it was derived.
In order to account for multiple comparisons, the traditional approach is to develop a gene expression profile in a ‘training cohort’ and then validate it in a ‘test cohort’ that is independent of the first. This basic principle is applied to all whole genome studies or any study where multiple parameters are studied.
Currently, the most common way of performing validation studies is to design a study with two cohorts. In the first cohort, the disease of interest is compared with controls and a gene profile derived from this comparison. This gene profile is then used on the second cohort in the same study to predict who has the disease of interest (or other variable) or who is a control. This approach I will refer to as a ‘within study with two cohorts' approach. Though this approach demonstrates that the predictors are reliable and not false positives, the approach does not necessarily account for the problem of batch or between study comparisons. For the within study with two cohorts approach, most laboratories would intermix the two cohorts and the control and experimental samples to eliminate or decrease batch effects. Thus, this approach does not address the question of whether the predictors will work across different studies performed on different cohorts at different sites or at different points in time.
The only way to prove predictors is to use a ‘two study two cohort approach.’ For this approach, the first study uses two cohorts: a gene profile is derived from the training cohort and this profile is then used to predict the individuals in the second ‘test cohort.’ Once done, an independent study is performed: the gene profile from the previous study is used to predict the individuals in this second study, blinded to the clinical disease group. What if the second study fails? Though it is not entirely clear how to solve this, potentially taking half of the individuals in each study to derive a profile for the training set could be used to predict the other half of the individuals. Alternatively, combining the gene profiles in both studies might be successful for predicting subjects in a third study. The reason for performing a two study-two cohort study is to absolutely ensure that the predictors were not dependent upon an unrecognized batch effect or unrecognized bias.
Role of reverse transcriptase polymerase chain reaction and future of isolating single cell types
The majority of initial preliminary studies have used microarrays because they can survey all of the known RNAs. It is still not clear what platform is best for confirming a predictor set of genes derived from a ‘training set’ of individuals on the ‘test set’ of individuals. This could be done using microarrays, reverse transcriptase PCR, Nanostring, next generation sequencing or other emerging technologies. Using microarrays has the advantage of using the same platform to replicate using the same platform the genes were derived from. However, PCR has the advantage of providing a technical replication, focusing the study just on the predictor set of genes to markedly decrease multiple comparison corrections, and precisely identify the RNA of a given gene using specific primers for a gene or exon. The eventual platform that might be used for clinical assessments is unclear since PCR on a large number of genes is still costly, microarrays continue to evolve and new technologies like Nanostring and Next Generation Sequencing are providing viable alternatives.
Most of our own work has focused on whole blood obtained using PAXgene tubes because of the ease of obtaining samples, storing them frozen and processing afterwards. One disadvantage of this approach is that a large portion of the RNA is accounted for by globin so that low abundance RNA transcripts tend to be lost. There are globin reduction methods, which have improved over the years and are commercially available. We have not used these because our preliminary studies had not used globin reduction and early globin reduction methods produced variable results. If globin reduction is to be used, reproducibility and reliability of results needs to be confirmed.
The major disadvantage of PAXgene tubes, however, is that whole blood is assessed. This may be adequate for biomarkers, but is woefully far from understanding mechanisms related to different cell types in blood. The future will require isolation of individual cell types including neutrophils, B and T lymphocytes, monocytes and their many subtypes. We and others have published gene expression profiles for these cell types (Du et al, 2006; Kobayashi et al, 2007; Kotz et al, 2010; Robbins et al, 2008; Wong et al, 2010). The potential problem with these studies is that isolation may affect gene expression (Holmes et al, 2009; Kotz et al, 2010; Lee et al, 2010; Shim et al, 2010). This may be solved by microfluiditic devices that use cell-specific antibodies that isolate specific cell types at the bed side (Kotz et al, 2010).
Future of RNA profiling—exon arrays, splicing, next gen RNA sequencing
Even given the above problems, gene expression studies at the very least will provide enormous insights into the pathophysiology of stroke. Though not reviewed here because of space, microRNA studies of blood and brain, are providing novel insights into how large groups of genes are regulated following brain ischemia (Dharap et al, 2009; Jeyaseelan et al, 2008; Liu et al, 2010; Reid et al, 2010; Tan et al, 2009). A number of studies of gene expression related to atherosclerotic plaques have been published and support the inflammatory nature of these lesions, and provide insights into additional pathways associated with high-risk lesions (Faber et al, 2002; Gagarin et al, 2005; Vemuganti and Dempsey, 2005). Ongoing studies in our laboratory and others are assessing subarachnoid hemorrhage, arteriovenous malformations, intracerebral hemorrhage, lacunar stroke (Jickling
Not considered in this review is the potential impact of exon arrays and next generation RNA sequencing (Taub et al, 2010). Current exon arrays allow one to assess expression of individual exons, and to predict alternative splicing of some genes (Tian et al, 2010, 2011). This is of great interest since exon splicing accounts in part for diversity among cell types and organs. Since there appear to be types of alternative splicing that can be specific for certain tumor types (Werner, 2010), it is possible that the immune response to brain injury might be associated with organ and perhaps even disease-specific alternative splicing due to the cell signaling that is specific for immune cells' response to brain ischemia (Courtney et al, 2010). These studies have yet to be done in stroke in part because they require even more complex and expensive resources.
Microarrays may eventually be replaced by next generation sequencing methods (RNA sequencing) to evaluate gene expression (Hawkins et al, 2010). With this technology, the entire transcriptome (RNAs) of a given individual can be sequenced (Werner, 2010). In theory, alternative splice variants of a given RNA can be quantified, as can the expression at the individual exon level (Hawkins et al, 2010; Werner, 2010). In addition, it will be possible to examine noncoding RNAs, which include the recently discovered microRNAs (Werner, 2010). The names of the many more noncoding RNAs are listed in Figure 12—with the realization that most of the genome codes for RNAs that are not translated into proteins, but instead likely serve regulatory functions many of which are still unknown. This exploding field will likely fuel disease-related research (Hawkins et al, 2010). This may also apply to different types of brain injuries where immune-specific splicing or types of noncoding RNA regulation will be specific for each type of brain injury (Hawkins et al, 2010).