
Abstract
The negative regulator of p53 transactivation, Mdm2, increased in the ischemic territory after 90 minutes of transient middle cerebral artery occlusion in spontaneously hypertensive rats compared to sham controls. Increased mdm2 mRNA was detected by semiquantitative reverse transcriptase polymerase chain reaction by 6 hours of reperfusion in the ipsilateral hemisphere. In situ hybridization histochemistry was used to localize increases in mdm2 mRNA which occurred in neurons of ischemic cortex and dorsolateral striatum. The number of labeled neurons increased by approximately 20-fold and the cells displayed five-fold increases of mdm2 mRNA in the cortex. Immunohistochemical staining for Mdm2 revealed that its mRNA was efficiently translated in the ischemic cortex, but not striatum, by 8 to 24 hours of reperfusion. Western blotting confirmed 30- to 40-fold increases in the full-length protein of 90 kd at these time points without evidence of alternative splicing. Because Mdm2 is a negative regulator of the apoptosis promoting activity of p53, increased expression of Mdm2 may be a component of a repair response in injured neurons, and supports Mdm2 being an indicator of DNA damage in the brain early after an ischemic insult in a similar way to Gadd45.
The product of the tumor suppressor gene p53 serves as a critical regulator of the cell cycle and plays a pivotal role in the surveillance of DNA damage (Levine, 1997). However, a role in postmitotic neurons has also been suggested by the use of p53-null mice where neuronal damage was attenuated after either cerebral ischemia where infarct volume was reduced in both hetero- and homozygous animals (Crumrine et al., 1994), kainic acid treatment (Morrison et al., 1996) or adrenalectomy (Sakhi et al., 1996). In addition, neurons cultured from such p53-deficient animals have less cell death after treatment with either glutamate or genotoxins (Enokido et al., 1996; Xiang et al., 1996). In normal animals, increased expression of p53 in neurons has been shown to be associated with various insults to the brain, e.g., ischemia (Chopp, et al., 1992; Li et al., 1994), excitotoxicity (Sakhi et al., 1994), or adrenalectomy (Schreiber et al., 1994). Excitotoxic lesioning of rat brain with the N-methyl-D-aspartate receptor agonist, quinolinic acid, also induces expression of p53 mRNA and protein in brain areas exhibiting DNA fragmentation (Hughes et al., 1996). In support of a positive role for p53 in inducing neuronal cell death, overexpression of p53 in either cultured cortical, hippocampal, or superior cervical ganglion neurons leads to apoptosis (Jordan et al., 1997; Slack et al., 1996; Xiang et al., 1996), while overexpression of a dominant-negative truncated p53 protein protected neurons from spontaneous apoptotic death (Eizenberg et al., 1996).
As a transcription factor, p53, upregulates the activity of genes such as bax, gadd45, mdm2, and p21 (Holbrook et al., 1996; Levine, 1997). Carcinogenesis can arise from loss of p53 tumor-suppressor function due to mutation, but also to overexpression of the cellular proto-oncogene mdm2 whose product binds to wild-type p53 thereby preventing transactivation in an alternate manner (Momand and Zambetti, 1997). Therefore, the Mdm2 protein regulates the p53 gene at the level of its activity, and the p53 protein regulates the mdm2 gene at the level of transcription, thus forming a p53-Mdm2 autoregulatory feedback loop (Wu et al., 1993; Kussie et al., 1996; Momand and Zambetti, 1997). p53-induced apoptosis has been shown to be prevented by Mdm2 in several cultured cell types (Chen et al., 1996; Haupt et al., 1996) suggesting that its p53 inhibitory effect may be critical in protecting neuronal cells from p53 mediated apoptosis. Deletion of mdm2 in mice causes embryonic lethality, but this lethality can be rescued by the simultaneous knockout of p53 (Jones et al., 1995; Montes de Oca Luna et al., 1995) emphasizing the close functional interaction between Mdm2 and p53. However, an alternative possibility may be that Mdm2 is not protective, but may induce cell death because of its ability to increase the transactivation capability of E2F1/DP1 (Martin et al., 1995) which would exaggerate the capacity of E2F1 itself to promote apoptotic cell death (Field et al., 1996; Kowalik et al., 1995).
Expression of mdm2 is increased in response to many DNA damaging agents, e.g., ultraviolet light (Perry et al., 1993), gamma-radiation (Price and Park, 1994), and cisplatin (Kondo et al., 1995). After cerebral ischemia there is early DNA damage in the form of oxidized bases (PK Liu et al., 1996), and single-strand DNA-breaks (Tobita et al., 1995; Chen et al., 1997; Hou et al., 1997) that could conceivably stimulate mdm2 expression. The appearance of single-strand DNA-breaks is known to induce the accumulation of p53 and stimulate its binding activity (Lee et al., 1995; Jayaraman and Prives, 1995) suggesting that this damage could be the cause of the increased p53 expression after an ischemic insult as well as the increase in gadd45 expression found after focal ischemia (Jin et al., 1996; Hou et al., 1997), and proliferating cell nuclear antigen (PCNA) expression after global ischemia (Tomasavic et al., 1996). Therefore, we undertook to study the expression of mdm2 in ischemic brain. In the present study, the expression pattern of mdm2 was investigated by semiquantitive reverse transcriptase polymerase chain reaction (RT-PCR), in situ hybridization histochemistry, and immunohistochemical detection of Mdm2. These analyses show that mdm2 mRNA and protein expression were upregulated in a reperfusion—time-dependent manner after the ischemic episode.
MATERIALS AND METHODS
Focal ischemia by middle cerebral artery occlusion
All procedures involving animals were approved as meeting acceptable standards by local committees for the Canadian Council on Animal Care. All animals were fasted for 18 hours before surgery. Transient focal ischemia was produced by middle cerebral artery occlusion (MCAO for 90 minutes) in mature male spontaneously hypertensive (SHR, 225- to 250-g) Sprague-Dawley rats (Harlan Sprague -Dawley Inc., Indianapolis, IN) as described by Buchan et al. (1992) where the right common carotid artery was isolated and ligated under halothane anesthesia. Then, the middle cerebral artery (MCA) was exposed and occluded with a microclip for 90 minutes at a site proximal to the point where it crosses the inferior cerebral vein in the rhinal fissure. This procedure reduced regional CBF to 15% of basal level during the ischemic period and returned it to 95% of basal level up reperfusion. Brain temperature was controlled to 37.5±0.5°C both during anesthesia and after recovery. After 1, 3, 6, 8, 18, and 24 hours of reperfusion, rats were killed the brains rapidly removed and either frozen whole in dry ice or, after dissection of right or left cortex and striatum on a cold plate, stored at −80°C. Alternatively, brains were perfusion fixed for immunohistochemical staining (see below).
RT-PCR
Total RNA was extracted from dissected cortical areas of rat brain (n = 4) using TRIzol reagent (GIBCO-BRL Life Technologies, Burlington, ON, Canada). First strand cDNAs were reverse transcribed from 4 μg of total RNA. The same amount of cDNAs were subsequently used for PCR amplification for a total of 25 cycles at 95°C for 1 minute, 60°C for 1 minute, and 72°C for 1 minute of each cycle. These optimal amplification conditions and cycle number were determined experimentally to ensure specific and linear signal generation, and expression of β-actin mRNA was used as an internal standard as described before (Hou et al., 1997) to quantify the relative amount of expression of mdm2. The PCR product was fractionated on a 2% agarose gel, photographed, and quantitated by scanning laser densitometry. The authenticity of every PCR product was confirmed by cloning into a pCR2.1 vector (Invitrogen Corp, San Diego, CA) and sequencing using an automated ABI 373A DNA sequencer.
In situ hybridization histochemistry
The procedure for in situ hybridization histochemistry was followed essentially as described by Robertson et al. (1995) with some modifications. Briefly, the rat brains were removed rapidly and frozen at −80°C after decapitation and dissection. The cryostat sections were cut to a thickness of 12 μm at −20°C and collected on precleaned Superfrost/plus slides (Fisher Scientific, Ottawa, ON Canada). A 35nt antisense oligonucleotide probe corresponding to the 3'-end of the rat mdm2 cDNA sequence (5'-AATCTTCTGAGTCAAGAGACTCAACTTCAAATTCC-3'), and the corresponding sense probe were designed and synthesized using the partial rat mdm2 cDNA sequence obtained by RT-PCR methods (see below). This probe was considered to be specific because no such sequence was found in a search of the GenBank database. About 40 ng of each oligodeoxynucleotide probe was 3'-end labeled with [35S]dATP (DuPont NEN, Dorval PQ, Canada) using terminal deoxynucleotidyltransferase (GIBCO-BRL). The brain sections were prehybridized for 2 hours in a hybridization solution containing salmon sperm DNA (500 μg/mL; Sigma), 50% formamide (Baker), 4x sodium chloride/sodium citrate (SSC) (pH 7.0), 1 × Denhardt's solution, 10% dextran sulfate (pH 7.0; Pharmacia, Canada), 1% sarcosyl (Sigma), 20 mmol/L sodium phosphate (pH 7.0), and 200 mmol/L dithiothreitol (DTT). Each slide was subsequently incubated with 1 times 106 cpm of the labeled probe in the same hybridization solution for 18 hours at 42°C. All sections were stringently washed in 4x SSC, 2x SSC, 1x SSC plus 0.2% mercaptoethanol for 20 minutes, either at room temperature or 35°C. The slides were finally rinsed in 1x SSC at 55°C for 20 minutes, dehydrated, and exposed to Biomax x-ray film (Amersham Life Science, Oakville ON, Canada) for 5 days. Cellular localization of mdm2 mRNA was evaluated by coating slides with nuclear track emulsion (NTB-2, Kodak, Rochester, NY) at 4°C for 3 weeks and counterstaining with 0.01% cresyl violet to visualize cells.
Quantitative assessment of the in situ hybridization signals on the cresyl violet stained brain sections was performed by image analysis of the 256 grey-scale digitized images after the procedures of Gerfen et al. (1991). Sample areas of the brain sections were digitized through a microscope at x200 magnification with a charge coupled device camera to generate images of 256 times 256 pixels. Each sample area (330 times 400 μm) was initially digitized under bright-field illumination (total cresyl violet stained cells) and then under dark-field illumination (silver grains) with the camera settings held constant for all measurements. The matched pair of bright and dark-field images were then analyzed using a redirected analysis routine. With this routine, all neurons in the different areas of the brain sections stained with cresyl violet were selected from the bright-field image using a circular selector of constant size (200 μm2), and the average optical density (OD) of silver grains over neurons containing mdm2 mRNA was measured in the corresponding area under dark-field illumination. Because of the use of the dark-field, an inverse OD was obtained by subtracting the average OD value of each cell from the maximum OD value of 255. The inverse OD value was used as a measure of label per cell with higher values indicating greater labeling, and a cell was considered labeled if its inverse OD value was three times greater than background. A total of six measurements was performed for each brain area (cortex and striatum) using a different tissue section for each measurement.
Statistical analysis
All values are presented as mean±SD. Statistical comparison of data from in situ hybridization histochemistry and Western blotting were made by a two-factor analysis of variance (Duncan's test for multiple comparisons), and a level of P < .01 was considered statistically significant.
Immunohistochemistry
Rats were anesthetized with pentobarbital and transcardially perfused with heparinized sodium phosphate buffer (pH 7.4), followed by 4% buffered paraformaldehyde. The brains were dissected and immersed into fresh fixative for 12 to 24 hours at 4°C. Vibratome sections (30 μm) were cut through the area of MCA distribution. An avidin-biotin complex method was subsequently used to detect Mdm2 protein on sections using a mouse monoclonal antibody directed against the carboxy-terminal portion of Mdm2 (Novocastra Laboratories, Newcastle-upon-Tyne, UK). A suitable antibody dilution was titrated for each lot of antisera to minimize nonspecific background staining. In brief, the vibratome sections floating in citrate buffer (pH 6.0) were microwaved twice for 10 seconds to unmask cryptic antigens (Wasielewski et al., 1994). Endogenous peroxidase activity in the sections was eliminated by immersion in 0.01 mol/L phosphate-buffered solution (PBS) containing 3% hydrogen peroxide. After washing three times with 0.01 mol/L PBS (pH 7.4), the sections were incubated with primary antibody (1:500) for 48 hours at 4°C on a shaking platform. This was followed by incubation in biotinylated goat antimouse secondary antibody (Jackson Immunoresearch, West Grove, PA) at 4°C for 24 hours. The sections were then washed, and incubated with ABComplex (kit from Vector Laboratories, Burlingame, CA) for 30 minutes at room temperature. A color precipitate was formed by reaction of horseradish peroxidase with 3,3'-diaminobenzidine tetrahydrochloride.
Immunoprecipitation and Western blotting
Mdm2 protein was immunoprecipitated by a streptavidin conjugated Dynabeads method (Dynal Inc, Lake Success, NY) following the manufacturer's instructions. Before use, the beads were washed three times with NET buffer containing 50 mmol/L TrisHCl (pH 7.5), 150 mmol/L NaCl, 0.1% nonidet P-40, mmol/L edetic acid (EDTA) (pH 8.0), 0.02% sodium azide and the protease inhibitors 0.2 mmol/L pefabloc, and 1 μg/mL aprotinin. Biotinylated secondary antibody was incubated with the beads in the NET buffer for 30 minutes at room temperature. Excess secondary antibody was removed by washing three times with the NET buffer. Primary mouse monoclonal antibody to Mdm2 (1:500 dilution) and 220 μg of total protein extracted from homogenates of separate cortical hemispheres were then added to the beads in NET buffer and rotated for 48 hours at 4°C. The antigen-antibody-bead complex was then washed three times in ice cold NET buffer. The target protein was dissociated from the antigen-antibody-bead complex by adding 2x sodium dodecyl sulfate (SDS) gel-loading buffer containing 100 mmol/L TrisHCl (pH 6.8), 4% SDS, 0.1% bromophenol blue, 20% glycerol, and 250 mmol/L DTT and heating at 95°C for 5 minutes, before being loaded on to a 8% SDS-polyacrylamide gel for electrophoresis (Laemmli, 1970) and Western blotting. Proteins were thereafter transferred onto a nitrocellulose membrane and probed with Mdm2 antibody (1:1000) for 48 hours at 4°C. After washing with 0.01 mol/:L PBS, horseradish peroxidase conjugated secondary antibody was incubated with the membrane for 2 hours at room temperature. An enhanced chemiluminescence detection method was used to detect the target Mdm2 protein using a LumiGlo substrate kit (KP Laboratories, Gaithersburg, MD) and x-ray film. The intensity of the bands on the film were quantitated by scanning laser densitometry.
RESULTS
Design of primers for PCR amplification of rat mdm2
Because the sequence of the rat mdm2 gene is unknown, a partial rat mdm2 cDNA sequence was obtained by PCR amplification of 601-bp fragment from rat brain cDNAs using a pair of degenerative primers designed from the conserved regions of human (Oliner et al., 1992) and mouse (Fakharzadeh et al, 1991) mdm2 coding sequences (5'-GAT CAR TTY AGY GTR GAA TTT-3' and 5'-CAR ATC ACA CAW GGT TC-3'). The partial rat mdm2 sequence obtained represents about 40% of the sequence of the mouse mdm2 coding region and has a high nt homology (94%) to the mouse sequence. A number of internal rat specific mdm2 PCR primers were subsequently made and their PCR products were cloned and the sequence verified. One pair of these primers was chosen to amplify the rat mdm2 for quantitation with a sequence of 5'-GTC TCT GGA CTC GGA AGA TTA C-3' and 5'-AAA CAA TGC TGC TGG AAG TCG-3'.
RT-PCR reveals increased mdm2 mRNA
Expression of β-actin mRNA was used as an internal standard to quantify the level of mdm2 expression because Northern blotting showed that β-actin expression appeared unchanged within 24 hours of reperfusion in our hands (Hou et al., 1997), or in those of others (summarized by Kumar and Wu, 1995). The band amplified from the mdm2 primers which migrated as 461 bp was authenticated by cloning and sequencing (Fig. 1A). By measuring the relative intensity of this band compared to the internal standard, mdm2 mRNA expression appeared to increase slightly 1 hour after reperfusion in the ischemic neocortex after transient MCAO (n = 4) with maximal increases occurring at 6 hours of reperfusion compared to the contralateral side (Fig. 1B), and the level of expression appeared greater than those of sham animals for at least 24 hours.
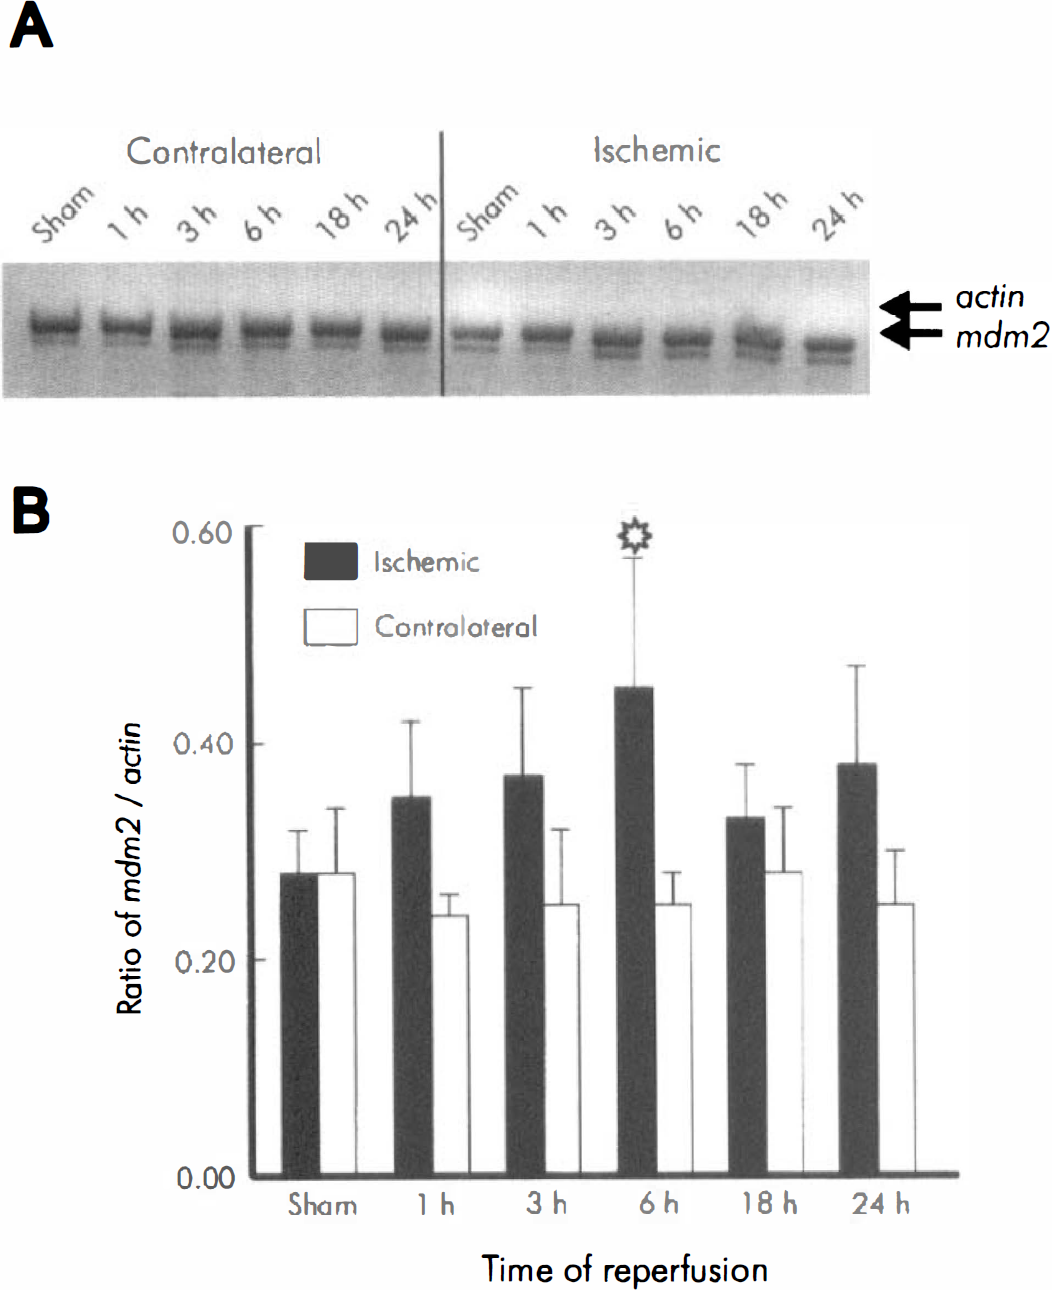
Increase of mdm2 mRNA after ischemia measured by semiquantitative reverse transcriptase polymerase chain reaction (RT-PCR). (
In situ hybridization histochemistry shows increased mdm2 mRNA in neurons
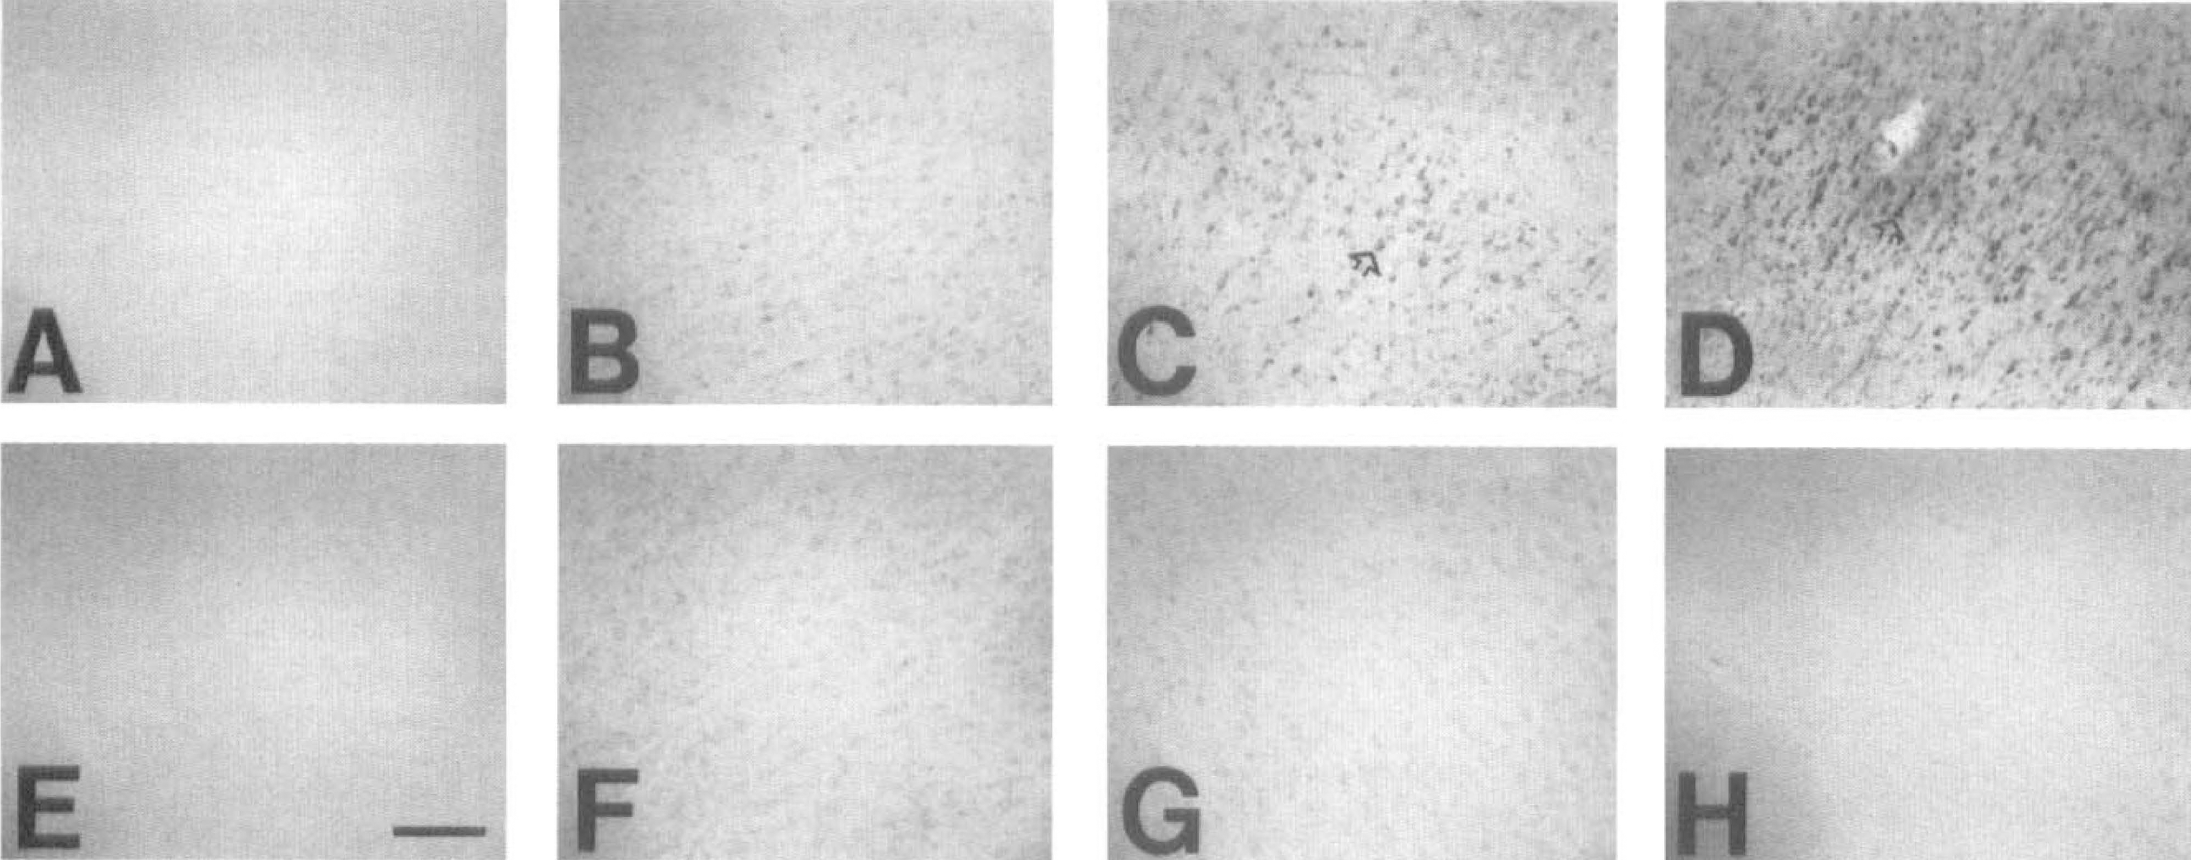
Specific antisense and corresponding sense mdm2 35-mer oligodeoxynucleotide probes were made to the 3'-end of the rat mdm2 cDNA sequence (see Materials and Methods section). Increased in situ hybridization histochemical labeling was observed primarily in the parietal cortex and dorsolateral striatum of the ischemic hemisphere (Fig. 2D) with no signal observed in either the contralateral hemisphere (Fig. 2C) or in sections from sham-operated animals (Figs. 2A and B). Increased silver grains were seen in all layers of the cortex with no evidence of differential expression in the infarct core or penumbral region, and the area used for quantitation of mRNA expression is delineated in Figure 2D. Under higher power, counterstaining with cresyl violet indicated that labeled cells were medium to large (20 to 30 μm in diameter) and therefore most likely neurons. In the ischemic cortex, the level of mdm2 mRNA expression began to increase after 1 to 8 hours of reperfusion after MCAO compared to the contralateral side (compare Figs. 3B and G; and Figs. 3C and H), and the number of labeled cells reached a peak after 18 hours of reperfusion (Figs. 3D and 1), but after 24 hours of reperfusion the signal appeared to be reduced slightly (Figs. 3E and J). The silver grains on sections from six ischemic animals at each time point were quantitated by image analysis and the number of mdm2-positive cells showed a significant increase (P < .001) at 8, 18, and 24 hours of reperfusion compared to sham controls with the maximum of 20-fold at 18 hours (Fig. 4A). There was a small apparent increase in the number of labeled cells in the contralateral hemisphere compared to sham sections, but this was not statistically significant. The density of silver grains per cell also showed a significant increase with a fivefold increase at 18 hours (Fig. 4B). There appears to be a discrepency between the time course of changes in mdm2 mRNA as measured by RT-PCR (Fig. 1B) and by in situ hybridization histochemistry (Fig. 4). This is probably more apparent than real because the RT-PCR was performed on RNA extracted from entire cortical hemispheres which dilutes local changes, whereas the histochemic analysis was highly localized in the infarcted region which emphasises any changes specific to the ischemic territory. In the dorsolateral striatum increased labeling was first observed at 8 hours (Figs. 5B and F), with larger increases occurring at 18 hours (Figs. 5C and G) and 24 hours (Figs. 5D and H). Quantitative analysis gave results similar to Figure 4 (not shown). In sections from sham-operated controls (n = 6) little, if any, labeling could be found in the cortex (Fig. 3A) or striatum (Fig. 5A). In situ hybridization histochemistry performed with the mdm2 sense probe failed to specifically label cells in brain sections at 1, 8, 24, (not shown) or 18 hours (Figs. 3F and 5E) of reperfusion after MCAO.
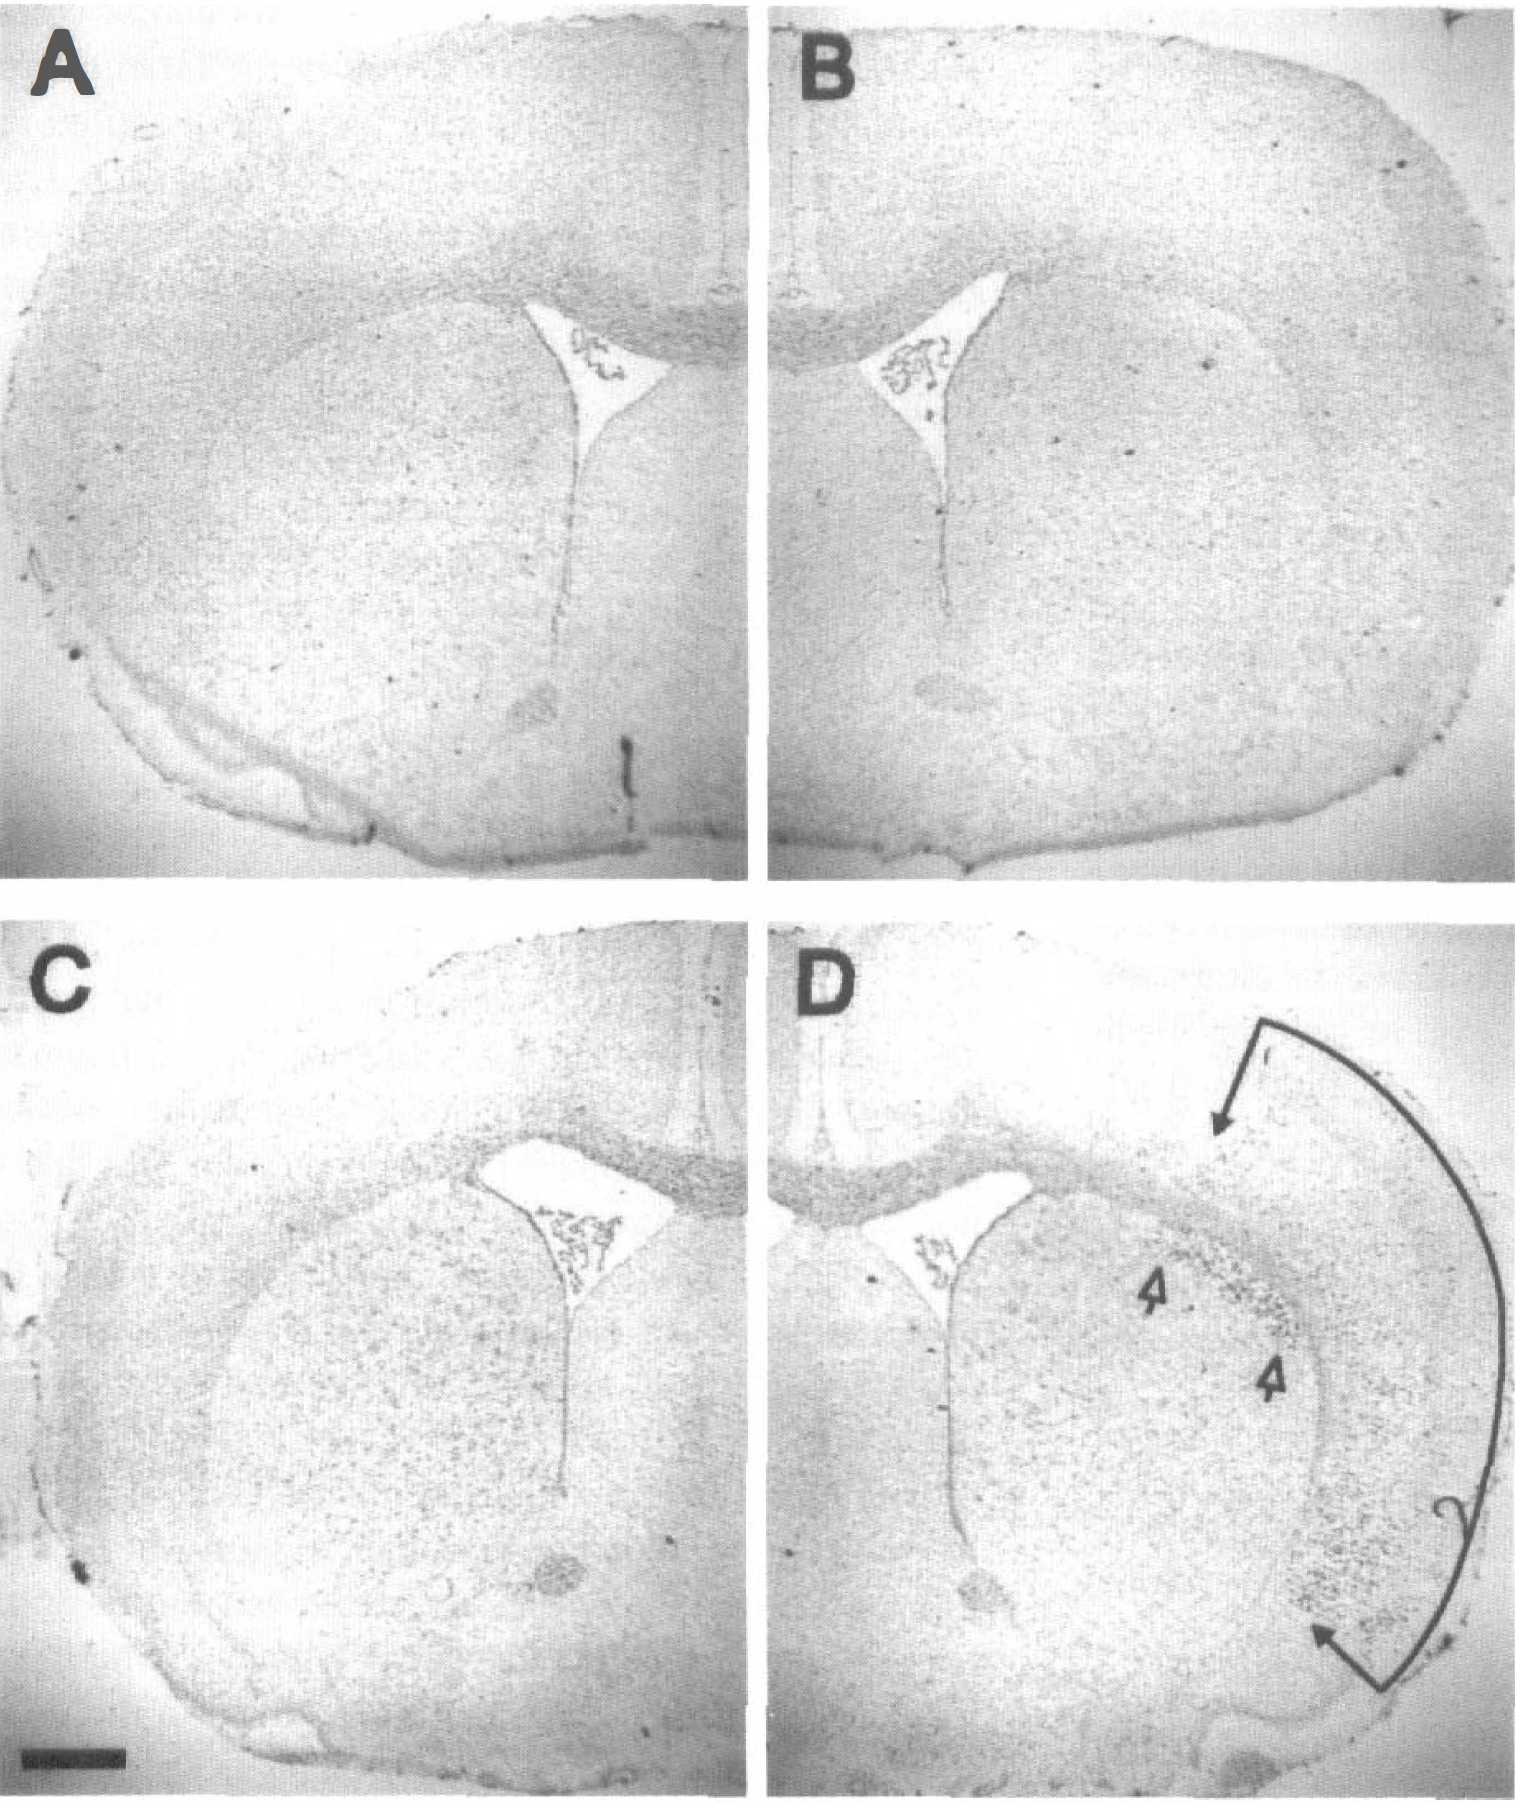
Low-power photomicrograph of coronal sections indicating the location of increased expression of mdm2 mRNA after focal ischemia shown by in situ hybridization histochemistry. (
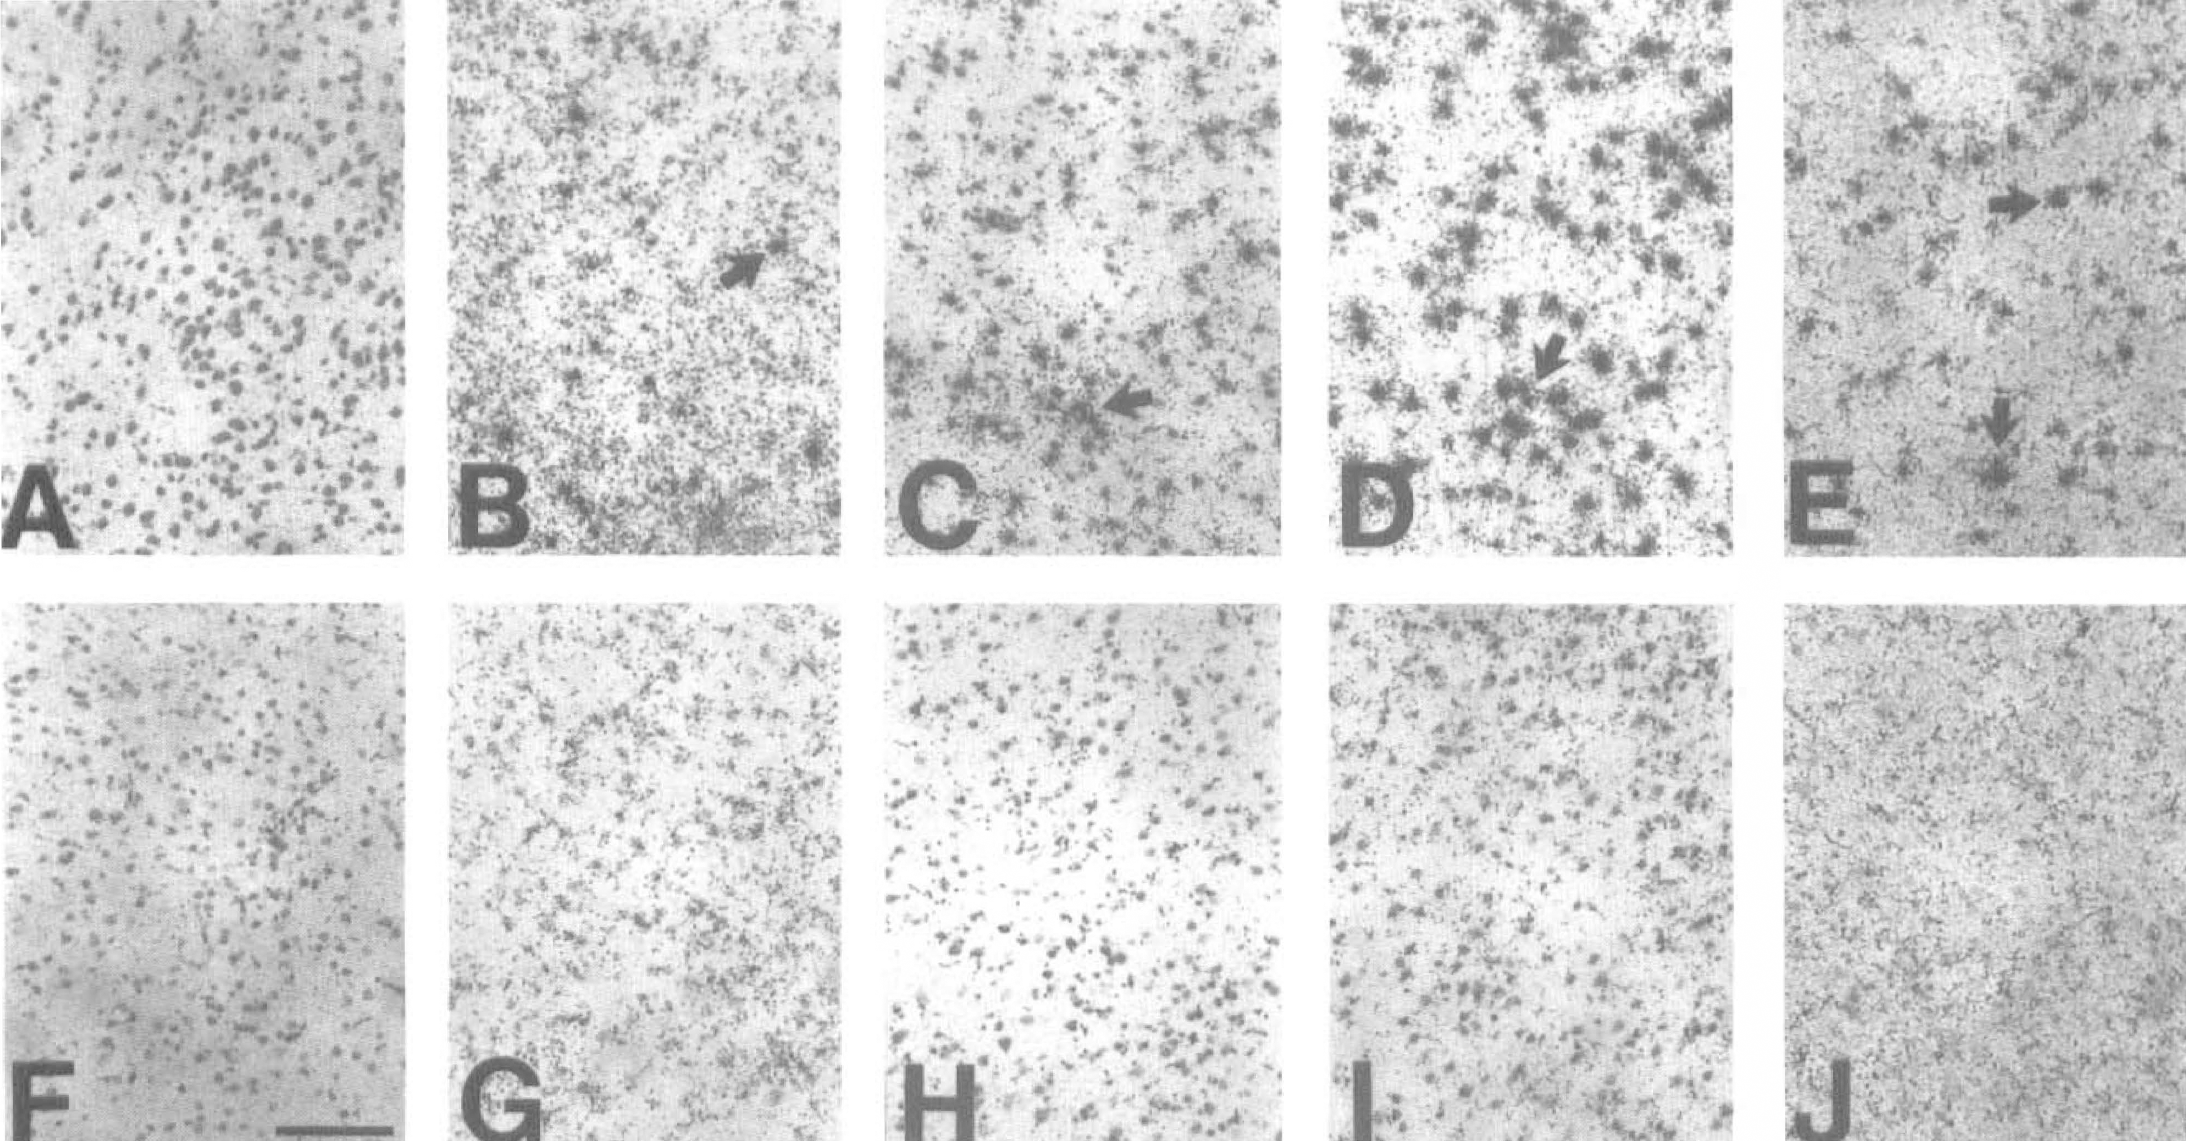
Time course of increased expression of mdm2 mRNA in ischemic cortex shown by in situ hybridization histochemistry (n = 6 for all treatments).
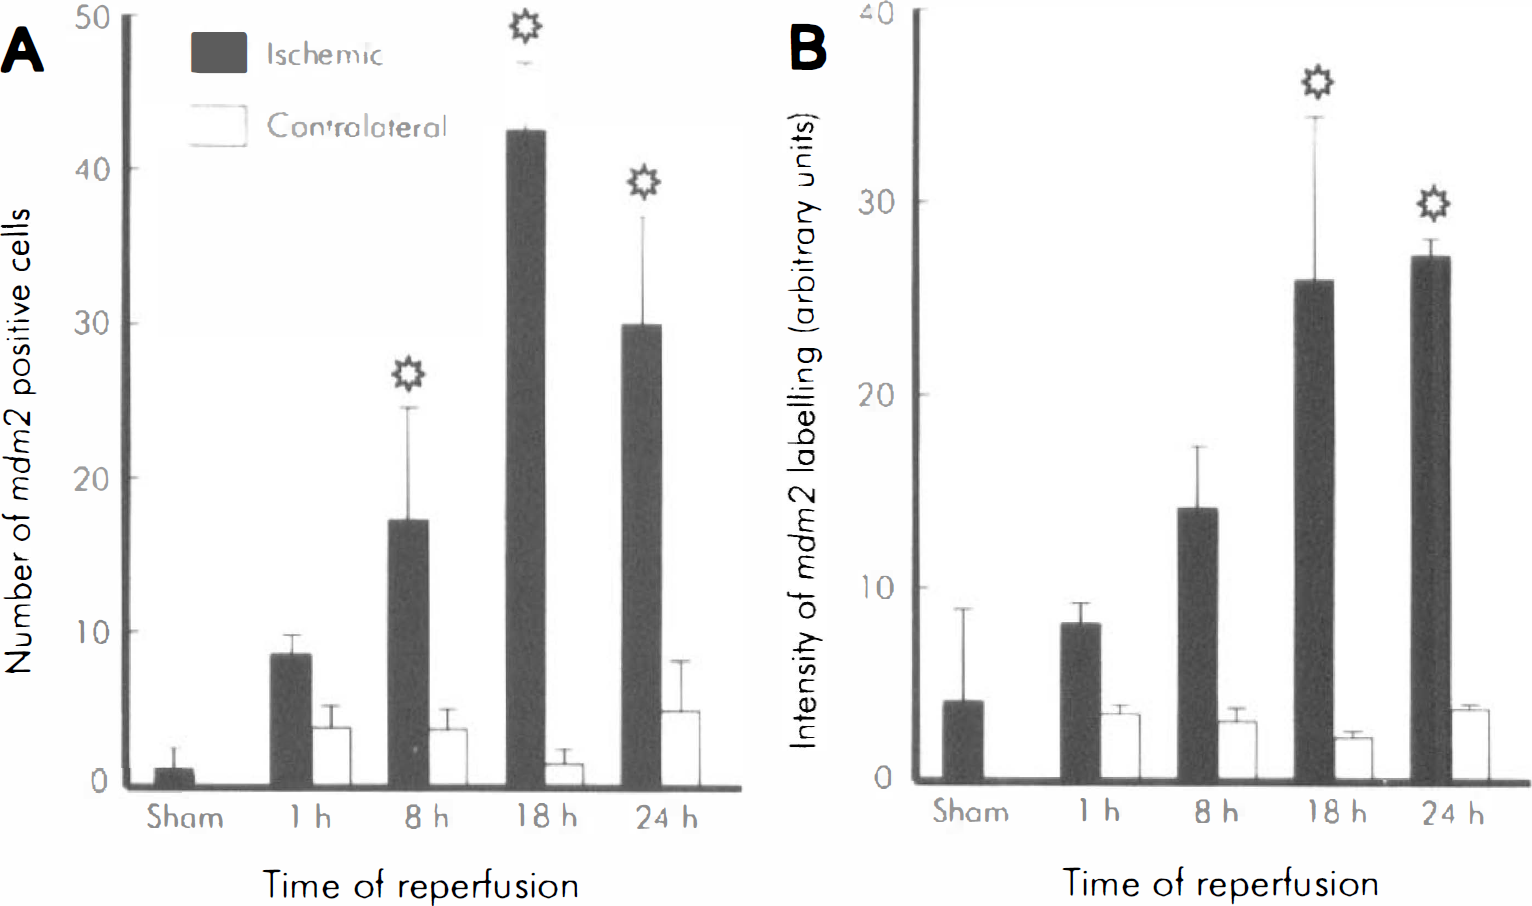
Quantification of the signal from mdm2 in situ hybridization histochemistry of ischemic cortex.
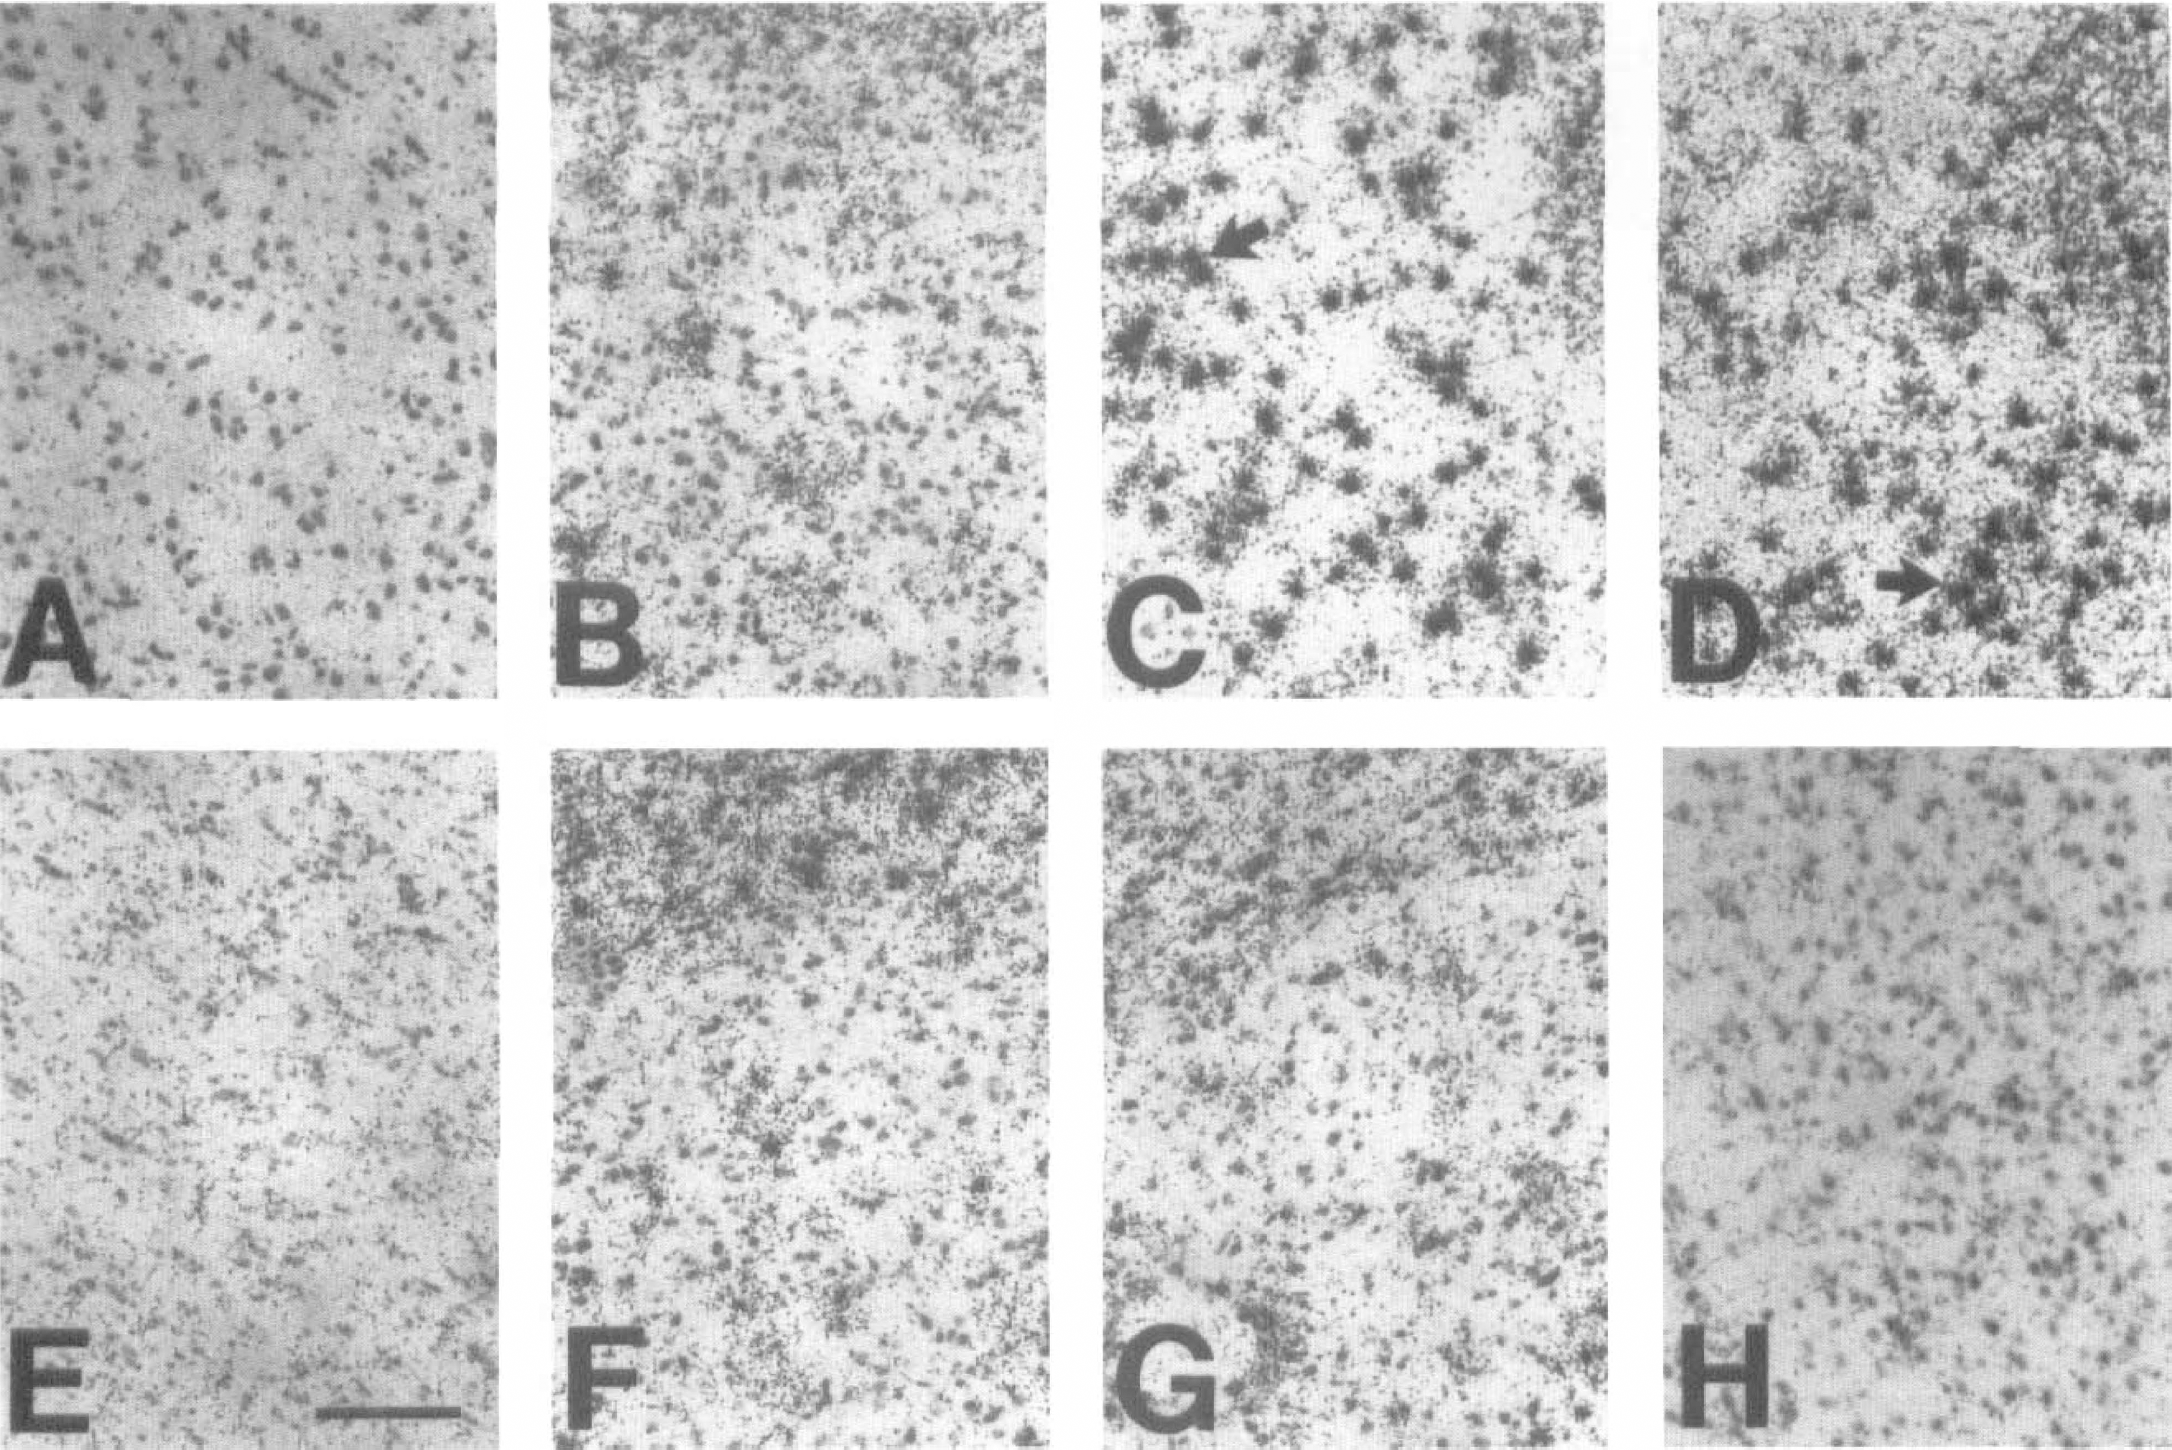
Increased expression of mdm2 mRNA in ischemic dorsolateral striatum shown by in situ hybridization histochemistry (n=6 for all treatments).
Reperfusion-time dependent increase of Mdm2 immunoreactivity
Immunohistochemical detection of Mdm2 was performed on brain sections from sham-operated rats (n = 2), and reperfused rats at 1 hour (n = 2), 8 hours (n = 5), 24 hours (n = 11) and 48 hours (n = 2) after MCAO shown at relatively low magnification to show the extent of the area where increased protein staining was observed (Fig. 6). Mdm2 immunoreactivity was increased in neurons but not glial cells nor blood vessel walls of the ischemic cortex. Moreover, under higher power it was observed that Mdm2 immunoreactivity was localized to the nucleus or perikaryon of neurons (Figs. 7A–C), but also appeared in the processes of some cells (Figs. 7D–F). No Mdm2 immunopositive staining was visible in sham controls (Fig. 6A) or the contralateral nonoccluded side (Figs. 6 F–H). The appearance of Mdm2 immunoreactivity in the ischemic hemisphere occurred in a time-dependent manner. At 1 hour of reperfusion, no Mdm2-positive neurons were detected (Fig. 6B), but a few immunoreactive neurons appeared by 8 hours of reperfusion (Fig. 6C) which increased in number and staining intensity by 24 hours (Fig. 6D). At 48 hours of reperfusion, Mdm2 staining was significantly reduced (not shown). Despite the appearance of mdm2 mRNA in the dorsolateral striatum area seen above (Fig. 5C and D), Mdm2 immunoreactivity was not detected (not shown).
Augmented Mdm2 immunoreactivity in the ischemic cortex.
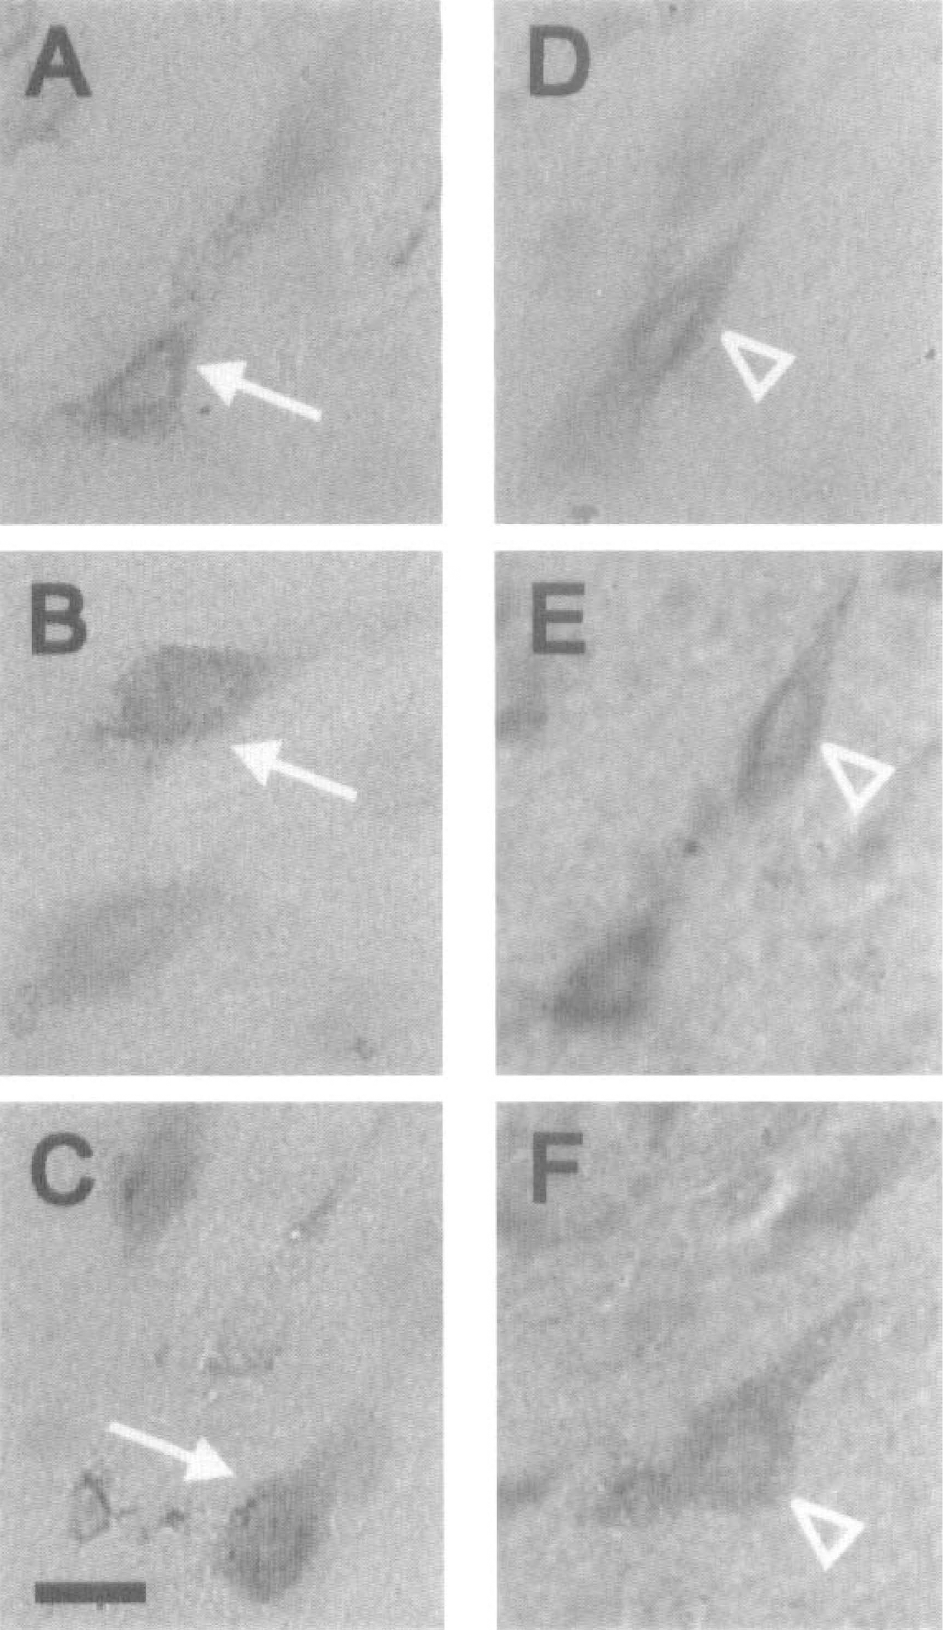
Appearance of Mdm2 immunoreactivity in cortical neurons. Examples of positive Mdm2 immunostaining at 18 h in infarcted cortex (bregma 0.48 mm) showing cells with nuclear and perikarial staining (arrows in
In a further series of experiments, extracts from the entire ipsilateral or contralateral cortical hemispheres were immunoprecipitated with a Mdm2 monoclonal antibody and subjected to analysis by Western blotting. At the same time, extracts from two human pancreatic cancer cell lines COLO-357 and T3M4, which are known to overexpress Mdm2 (Ebert et al., 1994), were used as positive controls. By this technique, Mdm2 protein with an apparent molecular mass of 90 kd similar to that observed in the cancer cells was visualized in the extracts from sham cortex and at 1 hour in the ipsilateral side (Fig. 8A). The amount of protein detected increased by 8 hours, and was further increased by 18 and 24 hours. The intensity of the bands from the separate experiments was quantified by scanning laser densitometry and shown to be consistent with the profile in the representative gel shown in Figure 8A (Fig. 8B). The time course of Mdm2 protein expression in the ischemic cortex (n = 3; Fig. 8B) as detected by Western blotting was in agreement with the results obtained by immunohistochemical staining. When the Mdm2 monoclonal antibody was removed (Fig. 8A) or pre-absorbed with extracts of the COLO-357 or T3M4 cells (data not shown), the antibody was subsequently incapable of detecting any 90-kd mdm2 proteins in the extracts from ischemic rat brains by either Western blotting or by immunohistochemical staining of the brain section.
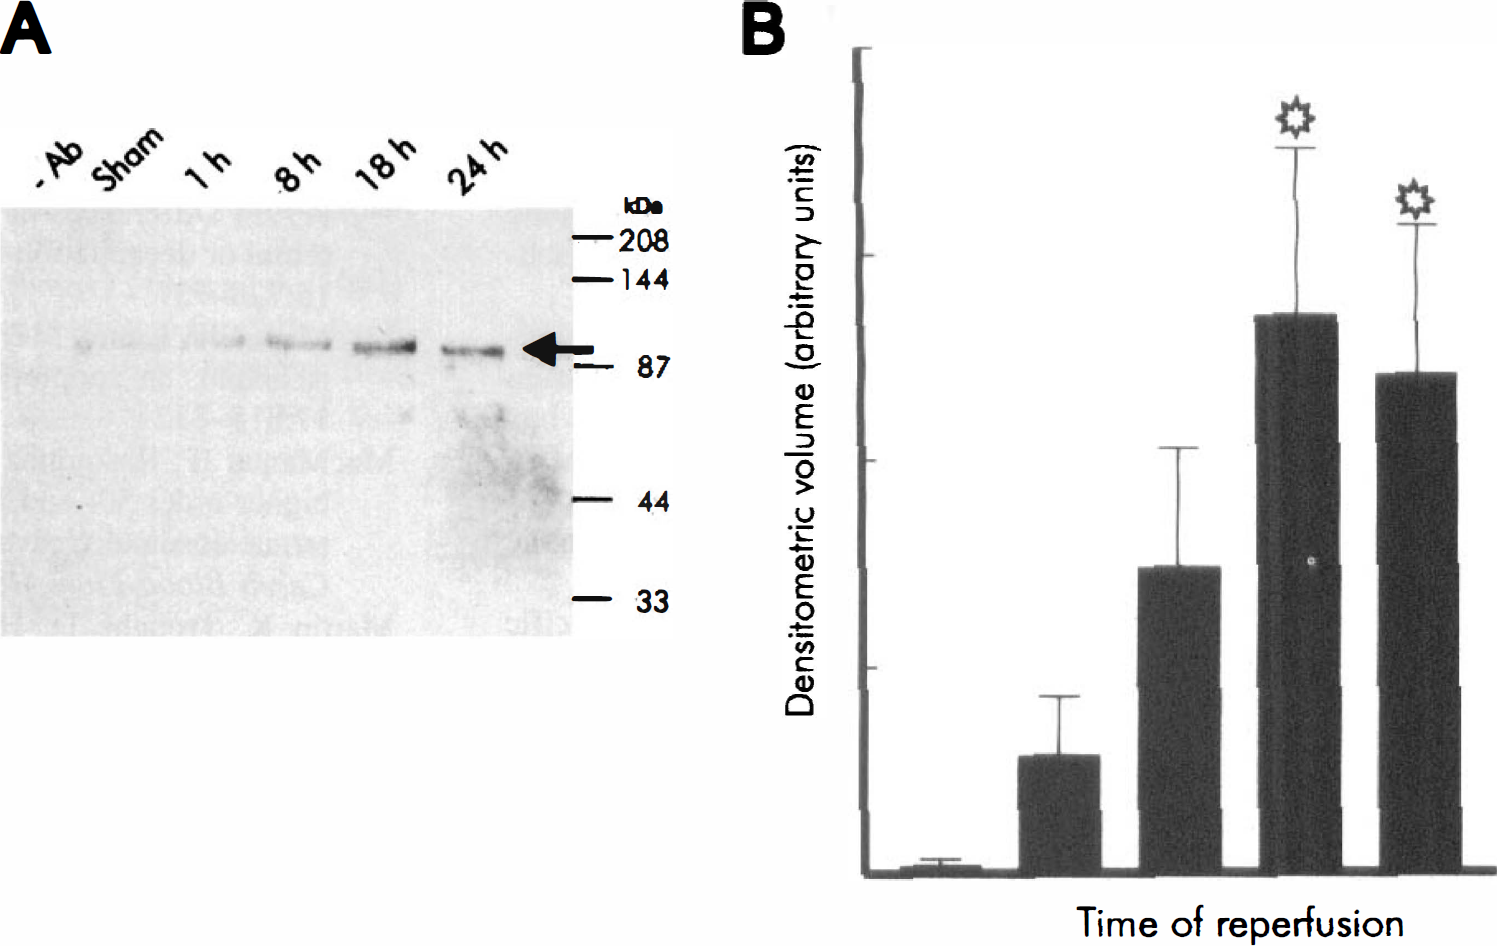
Increased Mdm2 expression demonstrated by Western blotting in extracts of ischemic cortex.
DISCUSSION
Despite an overall decrease in protein synthesis in the brain after an ischemic insult, there is a growing list of genes that have been found to be upregulated by this treatment including bax, bcl2, egr, fos, gadd45, hsp, jun, myc, ngfi-C, nos, nurr, orp150, pcna, and p53 (Akins et al., 1996; Choi, 1996; Chopp and Li, 1996; Honkaniemi et al., 1996; Iadecola, 1997; Linnik, 1996; MacManus and Linnik, 1997; Massa et al., 1996). These genes encode for several varieties of transcription factors, stress or repair proteins, anti-apoptotic proteins, and signal transducers such as nitric oxide synthase. The role of these gene products in the response to ischemia remains undefined, but may be considered to be either part of a protective or repair response, e.g., bcl-2, fos, gadd45, hsp, jun, pcna; or part of the active cell death machinery, e.g., bax, myc, or p53. The transcription factor p53 is of particular relevance here because of its demonstrated ability to induce apoptosis in neurons (Eizenberg et al., 1996; Jordan et al., 1997; Slack et al., 1996; Xiang et al., 1996), and its increase in brain after either ischemia (Li et al., 1994; Tomasevic et al., 1996) or quinolinic acid treatment (Hughes et al., 1996). In p53-null mice, a decrease in neuronal loss after several insults has been reported, e.g., after ischemia (Crumrine et al., 1994), kainic acid treatment (Morrison et al., 1996), or adrenalectomy (Sakhi et al., 1996). How p53 induces cell death is not known, but the genes that p53 transactivates include p21, gadd45, and mdm2. Increases in gadd45 after either cerebral ischemia (Jin et al., 1996; Hou et al., 1997) or quinolinic acid treatment (Hughes et al., 1996) have already been reported. It may be considered odd that genes involved in cell-cycle control are expressed in postmitotic neurons, but the expression of such genes, as elegantly modeled in neurotrophin-deprived cultured sympathetic neurons (Johnson et al., 1995), is echoed in the ischemic brain by the demonstration of increased cyclin D1, cdk4, and c-myc (Guegan et al., 1997; Li et al., 1997; Nakagomi et al., 1996; Wiessner et al., 1996), and after kainic acid treatment by cyclin D1 (W Liu et al., 1996).
In the present experiments after focal ischemia in rat brain, the expression of mdm2 mRNA and protein was increased in the ipsilateral cortex between 6 to 8 hours, and remained increased at 18 to 24 hours of reperfusion (Figs. 1, 3, and 8) with no evidence of preferential expression in either the core or edges (penumbra) of the infarcted territory (Figs. 2 and 6). Increases in mdm2 gene expression have been found in response to DNA damage produced by a variety of genotoxins (Holbrook et al., 1996; Momand and Zambetti, 1997). Irradiation of human fibroblast cells leads to DNA damage and a subsequent increase in mdm2 mRNA (Price and Park, 1994). The mdm2 gene is also inducible in a p53-dependent manner in cells treated with ultraviolet light, and the time of induction of mdm2 correlates with the recovery of normal rates of DNA synthesis (Perry et al., 1993). Cisplatin treatment of human glioblastoma caused p53 and mdm2 overexpression and apoptosis while mdm2 antisense oligonucleotide increased the susceptibility of the cells to the cisplatin-induced apoptosis (Kondo et al., 1995). After cerebral ischemia, both DNA damage in the form of oxidized bases and single strand breaks (Chen et al., 1997; Hou et al., 1997;PK Liu et al., 1996; Tobita et al., 1995) combined with evidence of DNA repair in the form of increased expression of PCNA (Tomasevic et al., 1996) have been documented. This suggests that ischemically induced genomic damage may be the signal for the observed increased mdm2 gene expression in injured brain.
The mdm2 (murine double minute) oncogene was originally identified as a gene that was amplified and overexpressed in a tumorigenic derivative of mouse 3T3 cells, with the amplified sequences located on extrachromosomal double-minute particles (Cahilly-Snyder et al., 1987), which subsequently can integrate into different chromosomes, such as chromosome 12q13–14 in neuroblastoma (Corvi et al., 1995). The normal function of Mdm2 is to negatively regulate the transcriptional activity of p53 with the N-terminal 130 amino acids of Mdm2 required to physically block the transactivation domain of p53 thereby preventing downstream regulation of target genes (Chen et al., 1993; Leng et al., 1995; Momand and Zambetti, 1997). An additional component of the anti-p53 actions of Mdm2 is the ability of Mdm2 to target p53 for proteolytic destruction thereby ensuring termination of p53 signaling (Haupt et al., 1997; Kubbutat et al., 1997). The necessity of this negative regulation can be seen by the lethality of knockout of mdm2 which can be overcome by concomitant knockout of p53 (Jones et al., 1995; Montes de Oca Luna et al., 1995). Overexpression of mdm2 by gene amplification (Landanyi et al., 1993) can be seen as functionally equivalent to knockout of p53 suggesting that mdm2 acts as an oncogene in its own right (Levine 1997; Momand and Zambetti, 1997). The human and mouse mdm2 genes encode polypeptides of 491 and 489 amino-acids, respectively, with an estimated molecular weight of 58 kd. Because of the large acidic domain in the C-terminal region of the protein, the full-length Mdm2 protein migrates as a single band with apparent molecular mass of 90 kd during denaturing gel electrophoresis (Chen et al., 1993). In cancer cells, splice variants of mdm2 have been described that yield many smaller proteins lacking the N-terminal region that may be associated with more aggressive tumor behavior (Gorgoulis et al., 1996; Haines et al., 1994; Olson et al., 1993; Sigalas et al., 1996). However, in our present study using immunoprecipitation with a monoclonal antibody to the C-terminus of Mdm2, we show that only the 90-kd product was expressed in response to the reperfusion insult and its level increased significantly by 8 hours of reperfusion reaching maximum expression by 18 h (Fig. 8). This 90-kd protein is comparable in size to the full-length protein detected in human and mouse tissues, and is confirmed by data using Northern blotting of total RNA which also showed only the expression of the full-length mRNA transcript (not shown). This suggests that the upregulated Mdm2 in ischemic brain has the potential to inhibit the apoptotic activities mediated by p53. Evidence of neuronal apoptosis after either global or focal ischemia has been presented from many laboratories including our own (Charriault-Marlangue et al., 1996; Choi, 1996; Chopp & Li, 1996; Linnik, 1996; MacManus et al., 1994, 1995; Nitatori et al., 1995), but it remains unclear as to whether this really is archetypal apoptosis with the requisite morphologic and DNA fragmentation hallmarks (reviewed in MacManus and Linnik, 1997). However, as indicated above, gene expression associated with apoptosis (e.g., bax, myc, and p53) in other cell types does occur in ischemic brain and so upregulated Mdm2 may be a brake on the cell death machinery in injured neurons. Such a protective role was proposed for another p53-related protein, Gadd45, which increases in nondamaged neurons after a period of focal ischemia (Jin et al., 1996; Hou et al., 1997). In cultured cells, the ability of Mdm2 to repress cell death induced by p53 has been shown in both lung carcinoma and osteosarcoma cells (Chen et al., 1996) or Hela and H1299 cells (Haupt et al., 1996). In addition, overexpression of Mdm2 protein by transfection into glioblastoma cells induced cellular resistance to cisplatin (Kondo et al., 1995).
Because there was no preferential appearance of Mdm2 in the core or the edges (penumbra) of the ischemic tissue, and because more than 90% of the Mdm2-positive cells were shown to be dead at 18 to 24 hours by TdT-mediated dUTP-biotin nick-end labelling staining (not shown), an alternative to a protective role for Mdm2 has to be considered. Mdm2 can act in the complete absence of p53 and pRb to increase growth of human osteosarcoma cells (Dubspoterszman et al., 1995). Since the N-terminal half of Mdm2 is all that is required as the counter-weight to the actions of p53, additional functions may reside in the C-terminal half of the protein that contains a highly conserved acidic domain and putative DNA-binding zinc-finger regions (Levine, 1997; Momand and Zambetti, 1997). Mdm2 can interact with the retinoblastoma tumor suppressor pRb (Xiao et al., 1995), and transcription factor E2F1 (Martin et al., 1995), which in turn can also bind pRb (Nevins, 1992). This highly interactive group of proteins have normally been considered to be principally involved in cell cycle regulation. However, an alternative view is emerging in which E2F1 suppresses cell proliferation and induces apoptosis even in quiescent cells (Field et al., 1996; Kowalik et al., 1995). Therefore, it is of interest that Mdm2 can increase the transactivation efficiency of E2F1 and thereby induce apoptosis (Martin et al., 1995). It is clear that there are complex direct and indirect interactions between Mdm2 and the products of many genes such as p53, p21, Gadd45, and PCNA in cycling cells whose expression also is changed after cerebral ischemia (Choi, 1996; Chopp and Li, 1996; MacManus and Linnik, 1997; Tomasevic et al., 1996). Whether Mdm2 is protective or promotes cell death via E2F1 may depend on the context of the mixture of these other interactive proteins in which Mdm2 finds itself. The relevance of the changes in Mdm2 shown herein to the ultimate demise of neurons is at present unclear, but several questions arise: Does Mdm2 respond in the presence of neuroprotective circumstances such as postischemic hypothermia; or is Mdm2 upregulation just an epiphenomen? Unfortunately, the direct experiment of production of cerebral ischemia in mdm2-null mice to answer this latter question is not possible due to embryonal lethality of the gene knockout (Jones et al., 1995; Montes de Oca Luna et al., 1995).
The exact balanced contribution of each of the interactive proteins mentioned above to the ultimate death of postmitotic neurons in the ischemic brain awaits much future work including the need for in vitro experiments with cultured neurons to directly manipulate gene expression. Whatever the outcome, it is now apparent that cell death after cerebral ischemia is at least partly gene directed. This at least offers the hope of future novel therapeutic avenues based on modulation of apoptotic signaling. Finally, our findings indicate that mdm2 can be added to the expanding list of ischemically upregulated genes in the brain such as bax, bcl2, egr, fos, gadd45, hsp, jun, myc, ngfi-C, nos, nurr, orp150, pcna, and p53.
Footnotes
Acknowledgments
The authors thank Joe J. Michniewicz for assistance with DNA sequencing, Teena Walker for photo-microscopy, and Tom Deveseri and Lise Bramall for illustrative material.