
Abstract
The authors studied the effects of altering global cerebral blood flow on both blood oxygen level–dependent (BOLD) response and perfusion response to finger-thumb apposition. A PICORE/QUIPSS II protocol was used to collect interleaved BOLD-weighted and perfusion-weighted images on eight finger-thumb apposition trials. Subjects were studied on a drug-free day and on a day when acetazolamide was administered between the second and third trials. After acetazolamide administration, resting cortical perfusion increased an average of 20% from preadministration levels, whereas the BOLD response to finger-thumb apposition decreased by an average of 35% in the S1M1 hand area. Contrary to predictions from the exhausted cerebrovascular reserve hypothesis and the oxygen limitation model, an effect of acetazolamide on cerebral blood flow response in the S1M1 hand area was not observed. Across the acetazolamide trials, BOLD response was inversely correlated with resting cortical perfusion for individual subject data. These results suggest that resting perfusion affects the magnitude of the BOLD response and is thus an important confounding factor in fMRI studies, and that the physiologic systems that increase cerebral blood flow in response to acetazolamide administration and systems that increase cerebral blood flow in response to altered neural activity appear to have additive effects.
Keywords
Most functional magnetic resonance imaging (fMRI) studies use blood oxygen level–dependent (BOLD) contrast to measure changes in neuronal functioning associated with alterations of behavioral state (Kwong, 1995; Ogawa et al., 1992). BOLD contrast reflects variation in the deoxyhemoglobin content of cerebral vessels induced by changes in the level of neuronal activity. Ultimately, deoxyhemoglobin levels depend on CMRo2, CBF, and cerebral blood volume (CBV) (Buxton et al., 1998). Thus, changes in neural activity are transduced through a hemodynamic response system to produce the observed BOLD effect. Most analyses of BOLD contrast do not correct for global levels of blood flow and blood volume. However, several recent papers have discussed the use of the global T2*-weighted signal as a covariate in BOLD contrast studies (Aquirre et al., 1998; Desjardins et al., 2001). The issue of whether BOLD response is independent of the global signal is central to the question of how to account for the effects of global signal variation on local BOLD response to varying experimental conditions (Aquirre et al., 1998; Cohen et al., 2002). In the current study, we examined the more circumscribed issue of whether the BOLD and perfusion responses to behavioral challenge are independent of manipulations of global, resting, cortical perfusion.
Results of the few fMRI studies that have manipulated baseline brain perfusion are contradictory. One set of findings indicated a reduction of BOLD response to behavioral challenge with an increase in baseline signal (Bandettini et al., 1995; Bruhn et al., 1994; Cohen et al., 2002), whereas a study by Corfield et al. (2001) found no interaction between BOLD response to visual stimulation and the partial pressure of carbon dioxide (Pco2) when comparing normocapnia and hypercapnia. In another study, BOLD contrast to visual stimulation peaked during mild hypercapnia (Posse et al., 2001).
Like the results of Corfield and et al.'s BOLD study, several human studies have found no effect of the manipulation of global flow on the size of the CBF response associated with behavioral challenges. The independence of CBF response and global flow has been found using 133Xe-inhalation CBF measurements (Maximilian et al., 1980), positron emission tomography (Ramsay et al., 1993), and perfusion-weighted magnetic resonance imaging (Li et al., 2000). That manipulations of global flow do not alter the magnitude of CBF response to behavioral activation was also observed between normocapnic and hypercapnic conditions (Shimosegawa et al., 1995) and among 40, 50, and 60 mm Hg CO2 conditions (Kemna et al., 2001). A coupling of global perfusion and CBF response to behavioral activation may exist at extreme values of Pco2, adding to the complexity of results (Kemna et al., 2001; Shimosegawa et al., 1995). It appears that the independence of experimentally manipulated global flow and CBF response to behavioral activation occurs within a window ranging from normocapnia to moderate hypercapnia.
Two issues underlie much of the contradiction described above: (1) the untested assumption that alterations of basal CBF ought to have similar effects on perfusion response and BOLD response to behavior challenge, and (2) the comparison of simple change scores (ΔCBF) with percent signal change (%BOLD) data. In the present study, we measured cortical cerebral perfusion and BOLD response to behavioral challenge under drug-free and acetazolamide conditions. We used multislice PICORE/QUIPSS II to obtain interleaved perfusion-weighted and BOLD-weighted images (Wong et al., 1998). Acetazolamide has cerebrovascular effects similar to CO2. It is a selective inhibitor of erythrocyte carbonic anhydrase (EC 4.2.1.1) that inhibits the removal of CO2 in the brain (Vorstrup et al., 1984), decreases tissue pH (Vorstrup et al., 1984), and increases both CBF (Ehrenreich et al., 1961; Vorstrup et al., 1984) and venous oxygen saturation (Vorstrup et al., 1984). Yet acetazolamide appears to have little effect on CMRo2 and little effect on neuronal function (Vorstrup et al., 1984). Acetazolamide has been shown to reliably increase cerebral perfusion in studies using magnetic resonance methods (Yen et al., 2002). The effects of acetazolamide on BOLD and perfusion response to finger apposition was measured using both simple and percent-change scores.
MATERIALS AND METHODS
Subjects
Five healthy volunteers (two women and three men) with a mean (SD) age of 32.2 (8.3) years participated in the study. All were right handed and had earned graduate and/or undergraduate degrees. To minimize risks associated with acetazolamide exposure, subjects were excluded if they had a history of abnormal potassium or calcium blood levels, kidney or liver disease, glaucoma, heart disease, allergic reaction to sulfonamides, migraine, or if they were currently pregnant. Subjects gave written informed consent to participate. The University of California San Diego Institutional Review Board approved the study.
Procedure
On each study day, an axial localizer scan of thirteen 5-mm slices was acquired to assure that the subject's head was aligned in the transverse plane. Sagittal localizer images (thirteen 5-mm slices) were then acquired to identify the locations of the functional slices to be acquired. Five contiguous axial functional slices (8-mm thick) were chosen to cover the motor strip for each subject and generally spanned from the most superior point of the arch of the corpus callosum to the most superior point of the brain. A neuroradiologist then obtained and reviewed a magnetic resonance angiogram of the Circle of Willis to screen for vascular abnormalities that would contra-indicate acetazolamide injection.
Eight functional runs, spaced about 5 minutes apart, were acquired on each occasion. During each run, 110 interleaved control and inversion-tagged images were acquired for each of five slices over a 3-minute 40-second time period using the multislice PICORE/QUIPSS II protocol (Wong et al., 1998). The image-acquisition protocol weighted mean images (control + tag) towards BOLD contrast and difference images (control – tag) towards perfusion contrast. Subjects alternated between 24 seconds of rest and 24 seconds of right-handed, sequential, finger-to-thumb apposition performed at a brisk but comfortable pace. Auditory cues signaled the start of each rest or tapping period. On the acetazolamide day, two runs (pre-ACZ) were acquired before acetazolamide administration. The remaining six runs (post-ACZ) were acquired starting approximately 5 minutes after acetazolamide injection and were spaced 5 minutes apart.
We acquired interleaved control and inversion-tagged images using PICORE tagging with the QUIPSS II modification and single-shot blipped echo planar imaging (25-millisecond echo time, 2,000-millisecond repetition time, TI1/TI2 = 600/1,200 milliseconds) (Wong et al., 1998). The in-plane resolution was 3.75 × 3.75 mm with a 240-mm field of view. The inversion pulse was a 15-millisecond adiabatic hyperbolic secant (μ = 10, β = 800 s−1). A 10-cm tag inversion band was used, with a 1-cm gap to the edge of the imaging region.
Image construction
Dependent variables
A reference vector representing the experimental design (zero coded rest, one coded figure-thumb apposition) was convolved with a two-step impulse-response function, yielding a simple trapezoidal model of the hemodynamic response with a graded lag of two repetition time periods. For each subject, this hemodynamic model and a linear term to adjust for linear drifts across the time series were fit to the BOLD time series in each voxel using least-squares estimation. The fit coefficient associated with the hemodynamic model measured the BOLD response to finger-thumb apposition in imager signal units. With the previously described coding scheme, the hemodynamic fit coefficient for the BOLD time series is equal to ΔS, the difference of the mean image signal averaged over rest trials subtracted from the mean image signal averaged over finger-thumb apposition trials, expressed in local magnetic resonance intensity units. The fit coefficient (ΔS) maps were normalized to Talairach coordinates and resampled into 1-mm3 voxels before further analyses (Talairach and Tournoux, 1988). Because the large majority of voxels in the functionally defined S1M1 hand area were in the gray matter, we calculated mean ΔS for positive fit coefficients across all voxels in the S1M1 hand area rather than cortically segment this volume as described previously. Percent BOLD response (%BOLD) was calculated by dividing mean ΔS by the average magnetic resonance signal in the S1M1 hand area obtained during the rest trials.
Statistical analyses
We analyzed the mean %BOLD, %CBF, ΔS, and ΔCBF in the S1M1 area of the left hemisphere, the global resting cortical perfusion values, and global resting cortical magnetic resonance signal values. Because the distribution of these variables tended to be skewed, we analyzed the natural logarithm of these values (Miller, 1986). Effects of acetazolamide and trial on study measures were analyzed in a two (condition) by two (mean of the pre-ACZ trials versus mean of the post-ACZ administration trials) within-subjects repeated-measures analysis of variance, treating subjects as a random factor. Partial η2 was used to measure effect sizes as the amount of variance accounted for by the acetazolamide condition and by its interaction with the trial factor (Cohen, 1973).
RESULTS
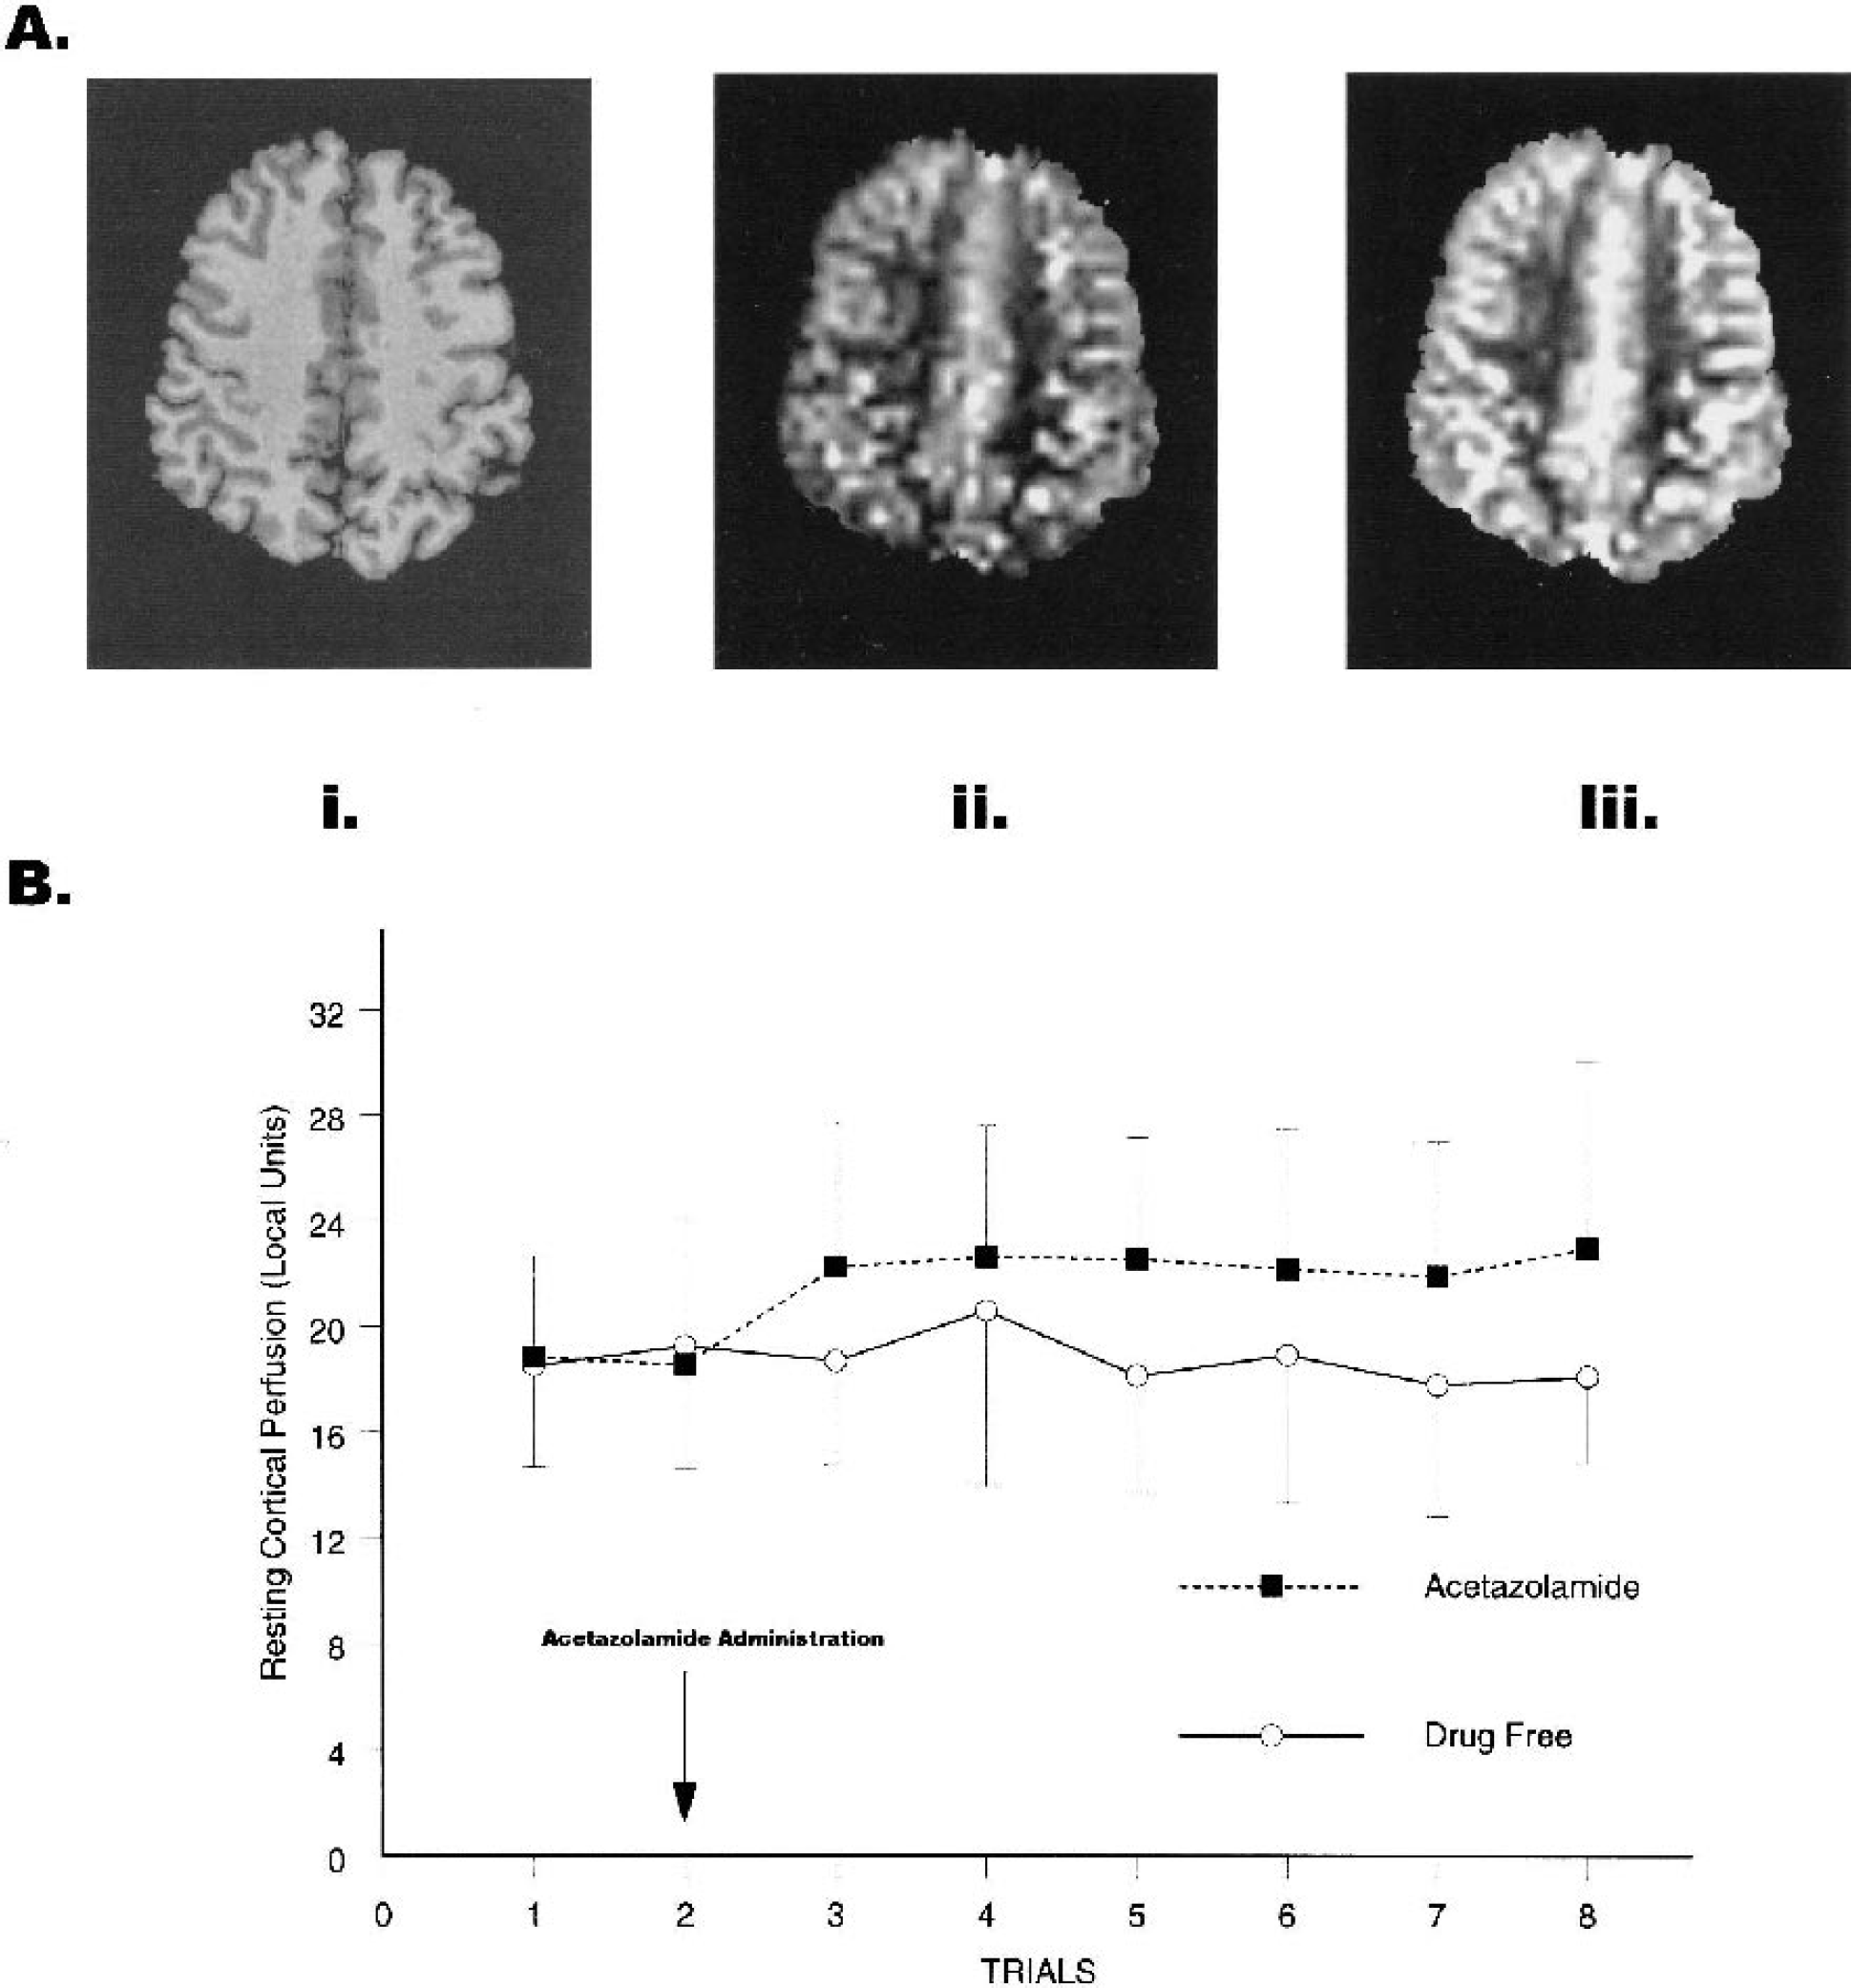
Five minutes after acetazolamide administration in trial 2, global resting cortical perfusion increased 19% from preadministration values and averaged 20% above preadministration resting values throughout the entire postadministration period (F1,4 = 20.68, P = 0.01, partial η2 = 0.84; Fig. 1B). Similarly, global resting cortical-image values, S, were significantly greater after acetazolamide administration than in the drug-free condition (F1,4 = 9.44, P = 0.037, partial η2 = 0.70; Fig. 1A).
(
Although acetazolamide increased resting cortical perfusion, it had no significant effect on the magnitude of perfusion response (ΔCBF) to finger-thumb apposition in the S1M1 hand area of the left hemisphere (F1,4 = 0.044, P = 0.845, partial η2 = 0.01; Fig. 2A). Furthermore, acetazolamide administration did not significantly influence relative perfusion (%CBF: F1,4 = 1.078, P = 0.358, partial η2 = 0.21; Fig. 2B). To determine whether the PICORE/QUIPSS II measure of perfusion was insensitive to physiologic manipulations, we tested whether perfusion differed from zero during finger-thumb apposition. Both the ΔCBF and %CBF measures showed robust finger-thumb apposition effects averaged over trials and drug condition (ΔCBF: F1,4 = 686.86, P<0.001, partial η2 = 0.99; %CBF: F1,4 = 1,272.96, P<0.001, partial η2 = 0.99).
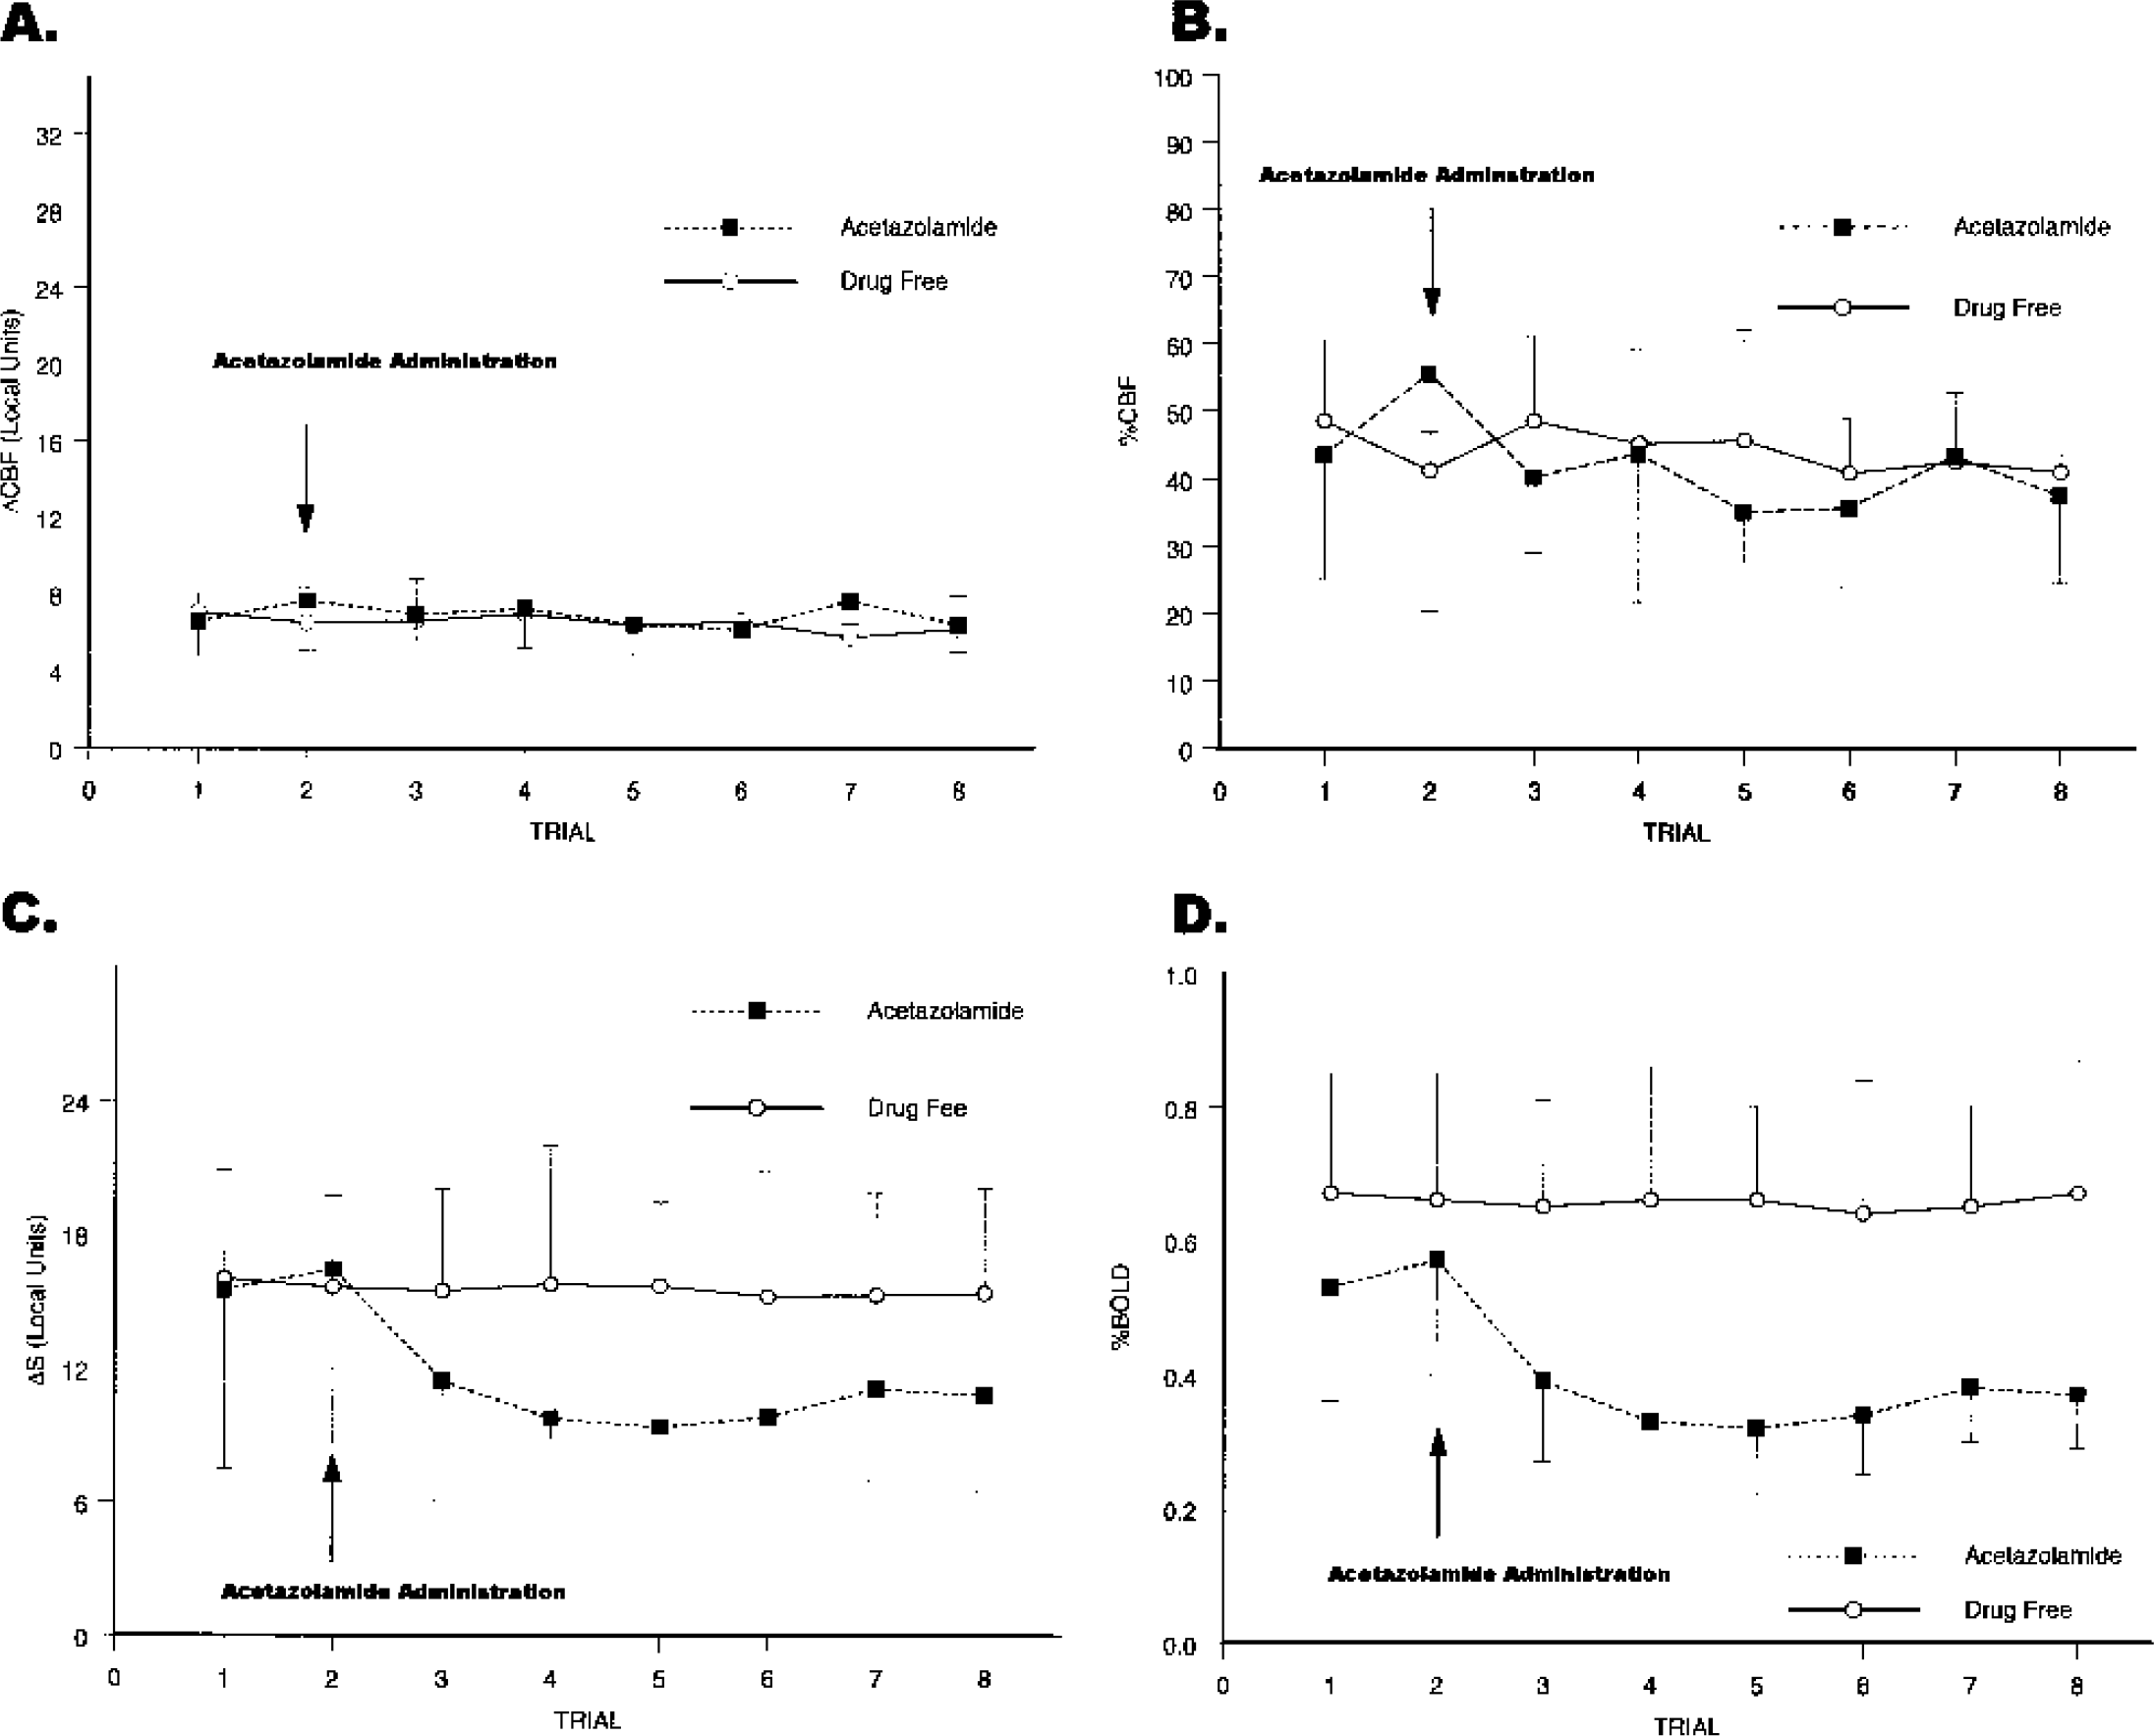
Effects of acetazolamide and trial on the perfusion and BOLD response to finger-thumb apposition compared with rest in the primary sensorimotor hand area of the left hemisphere. (
Although acetazolamide did not significantly affect CBF response, it did decrease the BOLD response expressed either as raw magnetic resonance signal change (ΔS) or as percentage signal change (ΔS/Sresting) in the S1M1 hand area (drug by trial interaction, ΔS: F1,4 = 9.05, P = 0.04, partial η2 = 0.69; %BOLD: F1,4 = 11.34, P = 0.028, partial η2 = 0.74; Figs. 2C and 2D). Five minutes after acetazolamide administration, ΔS decreased 28% from preadministration values and %BOLD decreased 29%. Averaged across all acetazolamide trials, both ΔS and %BOLD declined 35% from preadministration values.
To observe how global resting cortical perfusion and %BOLD response were related across trials in individual participants, we regressed individual %BOLD values onto resting cortical perfusion. All five regression weights were negative; greater resting global cortical perfusion was associated with smaller %BOLD values in the acetazolamide condition. Regression of ΔS onto resting global cortical perfusion produced the same pattern of association. That all five regression weights would be less than zero is unlikely to occur by chance (sign test: P = 0.031, one-tailed). Median correlation between %BOLD and resting cortical perfusion among the five subjects during the acetazolamide run was −0.73.
DISCUSSION
An intravenous bolus of 1 g acetazolamide reduced the BOLD response by about 35% and increased global resting cortical perfusion by 20%, though perfusion response was unaltered by acetazolamide administration. These findings confirm Bruhn et al.'s (1994) prediction that the reduction of BOLD response after acetazolamide injection would be related to increased cerebral perfusion. An inverse correlation between global cortical perfusion and BOLD response is compatible with the increased BOLD response observed in the somatosensory region of Sprague-Dawley rats when hyperventilation-induced hypocapnia was compared with normocapnia (Hsu et al., 1998) and with evidence that caffeine ingestion reduces baseline CBF and increases BOLD response (Mulderink et al., 2002). The finding that ΔCBF and %CBF values were unaltered by manipulations of global resting cortical perfusion adds to the growing literature showing the independence between pharmacologically or physiologically induced changes in global brain perfusion and local CBF response to behavioral challenge (Li et al., 2000; Maximilian et al., 1980; Ramsay et al., 1993; Shimosegawa et al., 1995). Given that the effects of 1 g acetazolamide on global CBF are similar to the effects of mild to moderate hypercapnia (Cotev et al., 1968; Severinghaus and Cotev, 1968), the independence of global CBF and perfusion response to behavioral challenge observed in our study is compatible with the Pco2 window found in the study conducted by Kemna et al. (2001). Acetazolamide administration also increased the resting T2*-weighted signal compared with the drug-free condition, replicating findings from other laboratories of widespread T2*-weighted signal activation associated with hypercapnia (Corfield et al., 2001; Posse et al., 2001).
The exhaustion of cerebrovascular reserve hypothesis (Bruhn et al., 1994) and the oxygen limitation model (Buxton and Frank, 1997) have been advanced to explain the dependence of BOLD response on global perfusion. A nearly exhausted cerebrovascular reserve would produce a ceiling effect on the CBF response to behavioral activation, and the constrained CBF response would in turn constrain the BOLD response. The oxygen limitation model is based on the observation that there is little oxygen reserve for neurons to use when increased neural activity increases oxygen demand (Buxton and Frank, 1997; Fennema et al., 1989). Consequently, increased cerebral oxygen consumption during behavioral activation would require an increased flux of oxygen from the capillaries to neural tissue (Raichle, 1998). Furthermore, the rate of oxygen delivery to mitochondria in neurons and glia depends on partial pressure of oxygen (Po2) gradients. If CBF in the resting baseline were increased by pharmacologic means without altering CMRo2, the Po2 gradient would increase and smaller changes in CBF would be required to deliver a sufficient amount of oxygen to meet the increased metabolic demand produced by increased behavioral activity. The diminished change in CBF would attenuate the change in oxygenated hemoglobin delivery and lead to smaller BOLD responses. Like the exhaustion of cerebrovascular reserve hypothesis, the oxygen limitation model predicts a joint alteration of BOLD and perfusion response with acetazolamide-induced increases in resting cortical perfusion. However, the prediction of a coupled BOLD and perfusion response to acetazolamide administration was not supported by the current study.
If neither the oxygen limitation model nor the exhausted cerebrovascular reserve hypothesis can account for the inverse relationship between BOLD response and global cortical perfusion, how can an inverse coupling between BOLD response and perfusion be explained? An understanding of this coupling involves an analysis of the transverse relaxation parameter,
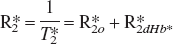
In this model, the total relaxation rate constant is taken to be the sum of an intrinsic relaxation rate (R*2o) and a second term, R*2dHb, due to the local concentration of deoxyhemoglobin. Specifically, in the absence of deoxyhemoglobin the relaxation rate would be R*2o. For simplicity, we will refer to the deoxyhemoglobin dependent term as R*2 with the understanding that the full relaxation rate constant includes an additive term. Monte Carlo simulations (Boxerman et al., 1995a), analytical computations (Yablonsky and Haacke, 1994), and model-system experiments (Weiskoff et al., 1994) confirm a simple proportional relationship between R*2 on the one hand, and deoxyhemoglobin concentration in blood (dHb) and blood volume (V) on the other:
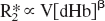
When β>1, the superlinear effects of deoxyhemoglobin concentration on the transverse relaxation rate account for the diffusion of water molecules through magnetic field gradients around blood vessels, especially capillaries, and for intravascular magnetic field offsets (Boxerman et al., 1995b; Davis et al., 1998; Grubb et al., 1974). The change in the transverse relaxation rate, ΔR2*, due to behavioral, pharmacologic, or physiologic challenge is proportional to the difference between the activated relaxation rate, aR2*, and the baseline resting rate, bR2*. Reexpressing ΔR in terms of Eq. 1 and assuming signal relaxation is small leads to the following approximation (Davis et al., 1998):
where m and f are the ratio of activated to resting baseline CMRo2 and CBF, respectively. We assume that CBV and CBF are related by the power law CBV = CBFα.
The BOLD response in Eq. 2 is determined by a scaling parameter, M, which depends on the baseline resting state, and by a dynamic term representing activation changes. Because changes in CMRo2 due to neural activation tend to be small compared with CBF changes, the dynamic term in Eq. 2 is dominated by changes in flow (Davis et al., 1998). Given the usual values of β = 1.5 and α ≂ 0.38 at 1.5 T for normal physiologic conditions (Boxerman et al., 1995b; Grubb et al., 1974), f (α–β) is roughly the reciprocal of the flow ratio, making %BOLD approximately proportional to the fractional change in flow from resting to activated levels. For a fixed flow response to behavioral challenge, the ratio of baseline resting flow to activated flow, CBFrest/(CBFrest + ΔCBF), approaches unity as resting CBF levels increase. As Eq. 2 shows, the BOLD response decreases as the ratio of resting to activation flow approaches 1. The preceding discussion formalizes the intuitive argument that if the hemodynamic response to behavioral activation, Δresponse, remains constant after acetazolamide administration while the resting flow signal increases, then the ratio of Δresponse to the resting value will decrease. Notice that this account of the uncoupling of BOLD and perfusion response explains how %BOLD and ΔCBF can become uncoupled. Yet the account, which depends on the dynamic term in Eq. 2, fails to explain how %BOLD and %CBF might become uncoupled, as observed in the current study, because the argument predicts smaller changes in %CBF as resting perfusion increases.
A more satisfactory explanation of the relationship between baseline resting perfusion levels and BOLD response operates through parameter M in Eq. 2. M, the fractional reduction of the local signal at baseline from what it would be if no deoxyhemoglobin was present, modulates the dynamic range of BOLD response to behavioral challenge. Increases in resting CBF decrease deoxyhemoglobin content and M, whereas increases in resting CBV increase deoxyhemoglobin content and M. Thus whether alteration of M drives

up or down depends on relative changes in resting CBF and CBV and not on changes in %CBF, which would operate through the dynamic term in Eq. 2. Because the exponential term in Grubb's power law relating flow to blood volume is less than 1, the finding that acetazolamide alters CBF more than CBV (Okazawa et al., 2001) implies that acetazolamide administration would reduce M, causing %BOLD to decline. The restricted dynamic range account of the relationship between %BOLD and resting perfusion explains the diminished BOLD response as a result of a floor effect for deoxyhemoglobin concentration under conditions of high resting CBF. Our data suggest that this floor effect is reached before perfusion response to behavioral challenge becomes constrained by an exhausted cerebrovascular reserve.
Because ΔS = S·M{1–(f−((β–α) mβ)}, the effects of acetazolamide on the simple magnetic resonance signal difference between baseline resting and activation conditions, ΔS, is determined by resting baseline levels of S, in addition to baseline CBF, and CBV, and by behaviorally driven changes in CBF, CBV, and CMRo2. Because acetazolamide increases S, the impact of acetazolamide on ΔS is determined by a balance of its effect on S and its effect on the model's physiological parameters. Given the multiplicity of determinants of ΔS, it is not surprising that studies of the effects of altered perfusion levels on behaviorally driven BOLD response have produced somewhat contradictory results. Whereas some studies have found no effect of perfusion level on ΔS (Corfield et al., 2001), some find increases in ΔS with presumed increased perfusion (Posse et al., 2001) and others find an inverse relationship of ΔS with measured or presumed perfusion levels (Bruhn et al., 1994; Hsu et al., 1998; Mulderink et al., 2002), as in the current study.
The gradient-recalled arterial spin labeling protocols typically used to obtain interleaved BOLD/perfusion images do not always separate BOLD effects from flow effects (Buxton, 2002). When averaging tagged and control images to obtain the BOLD signal, flow weighting of BOLD contrast can occur as inverted spins in the tagged image are averaged with fully relaxed spins from the control images. As spins flow into a slice, longitudinal magnetization is reduced in perfused vessels. Less longitudinal magnetization leads to smaller transverse magnetization after the longitudinal component has been tipped towards the transverse plane. With basic EPISTAR and PICORE protocols, higher rates of flow into an imaging slice would reduce BOLD contrast, producing a method-induced dependence of BOLD response on global perfusion (Buxton, 2002). To minimize flow weighting of BOLD images, the net magnetization delivered by flow must match the magnetization of the tissue across the image slice throughout the image-acquisition period. Fortunately, the temporal dynamics of the net magnetization flowing into the slice is known; it follows a saturation recovery curve (Buxton, 2002). The PICORE/QUIPSS II protocol minimizes flow weighting of the average signal by delivering a 90° saturation pulse to the image plane before applying the tag (Buxton, 2002; Wong et al., 1998). The saturation pulse matches the recovery of longitudinal magnetization to the flow weighting of BOLD images.
The validity of flow estimates for multislice arterial spin labeling methods can be corrupted by poorly chosen control images and by spatially varying delays in the transit of blood from the tagging region into the imaging slice (Buxton, 2002; Wong et al., 1998). The PICORE/QUIPSS II method used in the current study applies saturation pulses to the image slice in both the tagged and control states to minimize differences in slice profile and tissue magnetization that might be caused by differences in the pulse protocols generating the tagged and control states (Buxton, 2002; Wong et al., 1998). The dual saturation of the image slice minimizes errors in the subtraction of the slice images in tagged and control states. To minimize errors related to spatially varying transit delays, PICORE/QUIPSS II applies a saturation pulse to the tagged region after a specified inversion interval (TI1) has elapsed, effectively trimming the tail of the inversion bolus flowing out of the tagged region (Buxton, 2002; Wong et al., 1998). The sharp temporal demarcation of the tagged input bolus simplifies the timing of successive slice acquisitions so that tagged spins are delivered equally to each of the successively acquired slices.
Because factors that affect brain CBF separately from neural activity can alter the magnitude of regional BOLD response to a behavioral challenge, the interpretation of differences in BOLD response across experimental conditions needs to account for differences in baseline CBF (Cohen et al., 2002). This caveat applies most obviously to studies comparing healthy individuals and patients who are taking medications that could alter cerebrovascular tone or to those studied on and off a vasoactive medication (Bertel et al., 1987; Goldman et al., 1996; Miller et al., 1997; Shimamoto and Shimamoto, 1995). Although the vascular and neural effects of psychoactive drugs are hard to disentangle, our results suggest that the potential vascular effects of pharmacologic interventions need to be considered in drug-treatment studies of psychotropic medications using fMRI methods. Furthermore, given the complexity of factors that determine the relationship between BOLD response and perfusion levels, no one approach to adjusting BOLD response by perfusion level might work in all cases. However, by combining CBF data with a model of the BOLD signal, the effects of various adjustments can be evaluated quantitatively. This approach will be explored in future work.
Footnotes
Acknowledgments:
The authors thank Elizabeth Yoder for her critical review of an earlier version of this paper.