
Abstract
The authors studied the effects of a standardized mild-moderate hypoglycemic stimulus (glucose clamp) on brain functional magnetic resonance imaging (fMRI) responses to median nerve stimulation in anesthetized rats. In the baseline period (plasma glucose 6.6 ± 0.3 mmol/L), the MR signal changes induced by median nerve activation were determined within a fixed region of the somatosensory cortex from preinfusion activation maps. Subsequently, insulin and a variable glucose infusion were administered to decrease plasma glucose. The goal was to produce a stable hypoglycemic plateau (2.8 ± 0.2 mmol/L) for 30 minutes. Thereafter, plasma glucose was restored to euglycemic levels (6.0 ± 0.3 mmol/L). In the early phase of insulin infusion (15 to 30 minutes), before hypoglycemia was reached (4.7 ± 0.3 mmol/L), the activation signal was unchanged. However, once the hypoglycemic plateau was achieved, the activation signal was significantly decreased to 57 ± 6% of the preinfusion value. Control regions in the brain that were not activated showed no significant changes in MR signal intensity. Upon return to euglycemia, the activation signal change increased to within 10% of the original level. No significant activation changes were noted during euglycemic hyperinsulinemic clamp experiments. The authors concluded that fMRI can detect alterations in cerebral function because of insulin-induced hypoglycemia. The signal changes observed in fMRI activation experiments were sensitive to blood glucose levels and might reflect increases in brain metabolism that are limited by substrate deprivation during hypoglycemia.
Severe hypoglycemia produces profound neurologic impairments in keeping with the brain's obligatory requirement for glucose derived from the circulation (Sjesjo, 1988). It is presently appreciated that even mild to moderate hypoglycemia can impair performance during a variety of cognitive tasks and electrophysiologic measurements of cortical and brainstem function in humans (Jones et al., 1990). This exquisite sensitivity of the brain to mild-moderate glucose deprivation is also observed in rodents (Weber et al., 1994). Relatively mild reductions in plasma glucose to 2.8 of 3 mmol/L have been reported to significantly delay conduction through the auditory pathway in conscious rats using electrodes implanted in the inferior colliculus region of the brainstem (Weber et al., 1994; Jacob et al., 1995). Although evoked potential measurements during hypoglycemia have been useful in demonstrating impaired central nervous system (CNS) responses, they provide little information on the precise nature and localization of the CNS changes, and for many brain regions electrophysiologic responses have not been demonstrated.
The advent of neuroimaging techniques, such as positron emission tomography (PET) and functional magnetic resonance imaging (fMRI), has made it possible to generate high resolution maps of blood flow and oxygenation responses to neuronal activity (Fox et al., 1988; Kwong et al., 1992). The blood oxygen level-dependent (BOLD) contrast, depicted by MRI, has been a subject of great interest since Ogawa et al. (1990) demonstrated that varying levels of oxygen saturation can change contrast in T2*-weighted images. Although these effects have been successfully exploited in the development of fMRI techniques, the relations between alterations in metabolism, cerebral hemodynamic blood oxygenation, and fMRI signal changes are not well understood. In fMRI several factors may affect image contrast, including alterations of blood flow, blood volume, and intravascular magnetic susceptibility arising from blood hemoglobin (Kennan et al., 1994). In an attempt to better define the origins of the changes in fMRI signal contrast, physiologic models have been developed to relate BOLD signal changes to physiologic parameters such as blood flow and oxidative metabolism (Buxton and Frank, 1997;van Zijl et al., 1998; Hyder et al., 1998, 1999). A common feature of these models of BOLD contrast is that it reflects a local increase in blood flow that accompanies increases in oxidative metabolism caused by increases in neuronal activity. This blood flow increase overcompensates for the local oxygen demands, leading to a relative increase in the amount of venous oxyhemoglobin and a decrease in venous deoxyhemoglobin in tissue (Roy and Sherrington, 1890). The development of animal models for fMRI have been useful in understanding the origins of fMRI signal contrast (Hyder et al., 1994, 1996; Gyngell et al., 1996; Kennan et al., 1998; Mandeville et al., 1998) and for new approaches for functional assessment based on, for example, blood volume changes (Kennan et al., 1997) and oxidative metabolism (Hyder et al., 1996).
Neglecting blood volume changes, the theoretical relation between the changes in BOLD fMRI signal (S) and cerebral blood flow (CBF) and cerebral metabolic rate of oxygen consumption (CMRO2) is given by Hyder et al. (1998) as
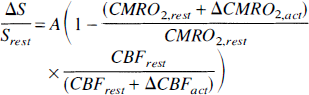
where A is a constant and Δ represents the difference between active and resting states (that is, ΔCBFact = CBFact − CBFrest). Equation 1 reiterates that when all other parameters are fixed, the BOLD signal increases with blood flow (less venous deoxyhemoglobin) and decreases with oxygen consumption (more venous deoxyhemoglobin). The usual increase in fMRI signal during neuronal stimulation implies that blood flow changes are greater than the oxidative metabolism changes (CBFact/CBFrest > CMRO2,act/CMRO2,rest). Recent work using forepaw stimulation in the rat at 9.4T shows a linear correlation between blood flow and BOLD response (Silva et al., 1999).
In the normal brain, oxidative glucose metabolism consumes 4 to 6 moles of oxygen for each mole of glucose (Fox et al., 1988; Sokoloff, 1977; Hyder et al., 1994). This is somewhat lower than the theoretical limit of 6 moles oxygen per mole glucose because glucose can enter other nonoxidative pathways (Sokoloff et al., 1977; Hyder et al., 1994). The coupling between glucose metabolism and oxidative metabolism is less clear when the brain is in an active state. Early work using PET indicated that during visual stimulation the ratio of percent metabolism increase (ΔCMRO2/CMRO2,rest) to percent blood flow increase (ΔCBF/CBFrest) is approximately 0.1:1 (Fox et al., 1988). This report concludes that the ratio of oxygen consumption to glucose consumption was 0.4:1, which is much less than expected from the resting brain data (Fox et al., 1988). More recently, MR based methods in rat models (Kida et al., 1999) and human studies (Hoge et al., 1999) indicate significantly larger changes in oxidative metabolism during periods of increased neuronal activity. For example, Kida et al. (1999) show that when brain activity is altered through anesthetics in the rat, the ratio of percent oxidative metabolism changes to percent blood flow changes is approximately 0.8:1, whereas the work of Hoge et al. gives a ratio of 0.5:1 in the human brain during visual stimulation. Thus, during periods of increased neuronal activity there is greater oxidative metabolism, which in turn relies on glucose metabolism. The goal of the current work is to investigate in an animal model of activation whether fMRI can detect changes in the BOLD response to forepaw stimulation during mild hypoglycemia that may serve as signatures of functional impairment caused by decrements in glucose delivery to the brain.
MATERIALS AND METHODS
Animal model
Healthy female Sprague Dawley rats weighing 250 to 360 g were initially anesthetized with 0.8% halothane, then tracheotomized, and artificially ventilated using oxygen:nitrogen mixtures (40:60). Throughout, the rats lied supine on a hot water blanket to maintain body temperature. A venous catheter was inserted into the tail vein for infusion of propofol, which allowed for gradual discontinuation of halothane. The propofol infusion rate was adjusted slowly, depending upon respiratory rate and the level of responsiveness to footpad pinch. During the acquisitions, the infusion rate ranged from 0.21 to 0.35 mg/kg·min. Three additional catheters were placed to infuse glucose and insulin solutions (femoral vein), to draw blood samples and monitor blood pressure (femoral artery), and to administer a paralytic agent, tubocurarine chloride (intraperitoneal). Two needle electrodes were inserted subdermally at the wrist, proximal to the footpads of either the left or right forepaw in random order. Median nerve stimulation was applied as a square wave (positive only) using a Tektronix 2620 constant current stimulus isolator (6 Hz with a stimulus duration of 0.3 milliseconds). This stimulus intensity was sufficient to elicit partial contraction of the forepaw, which varied from 2 to 3 mA. Blood gases were monitored hourly to ensure relatively stable levels of oxygen (>120 mm) and carbon dioxide (maximum range of 28 to 44 mm over the course of the experiment). Blood pressure and heart rate were monitored through the femoral artery catheter. Further details of the animal model are described elsewhere (Scanley et al., 1997).
Magnetic resonance imaging
All studies were performed at 2.0T on a GE CSI/Omega imaging system. Images were obtained using a 1-cm diameter surface coil placed under the head. Horizontal scout images were first acquired parallel to the dorsal surface of the cerebral hemispheres (Zillies, 1985), and from these sections were prescribed through cortex approximately 0.5 to 1.0 mm deep. Functional MRI images were obtained using a spoiled GRASS sequence with a FOV of 40 mm, and a slice thickness of 1 mm. The repetition time (TR) was 100 milliseconds, and the echo time (TE) was 30 milliseconds. High resolution anatomic 64 × 128 images were obtained with 2 averages, whereas lower resolution 32 × 64 images (zerofilled to 64 × 64 pixels with inplane resolution of 0.63 × 0.63 mm) were obtained with 4 averages such that the total time per image was 12 seconds. The lower resolution images were used for all euglycemia and hypoglycemia evaluations because they had an intrinsically higher signal-to-noise (over 200:1 at TE = 30 milliseconds). Images were acquired continuously for an alternating stimulus pattern of two images “off” and two images “on”. Image sets were acquired with 32 images per set.
Insulin clamp and activation protocol
After the insertion of catheters and electrode placement, all animals were allowed to equilibrate for 60 minutes. Thereafter, a series of preinfusion forepaw stimulations and fMRI measurements were conducted. Those animals with cardiac parameters, plasma glucose, and fMRI that were within normal limits at baseline were then used in the following two protocols. Both groups received a 20 mU/kg·min infusion of Regular human insulin (Humalin R, Eli Lilly, Indianapolis, IN, U.S.A.) starting at t = 0. In the first group (n = 6), plasma glucose concentration was allowed to decline over a period of ∼20 minutes. Plasma glucose was then maintained at 2.8 to 3.0 mmol/L for an additional 20 to 40 minutes using a variable dextrose infusion that was adjusted based on 10 minutes blood glucose measurements. Forepaw stimulation and fMRI were performed in the intervals between blood sampling (3 × 10 minutes). Afterwards, the dextrose infusion was increased to restore plasma glucose levels to baseline levels for 30 minutes while fMRI data were acquired. In group 2 (n = 5), plasma glucose values were clamped at baseline levels using a variable glucose infusion throughout a 60-minute insulin infusion, whereas the same fMRI stimulus was performed. To prevent hemodynamic changes caused by blood loss, donor blood was given to replace sample volumes.
Data analysis
RESULTS
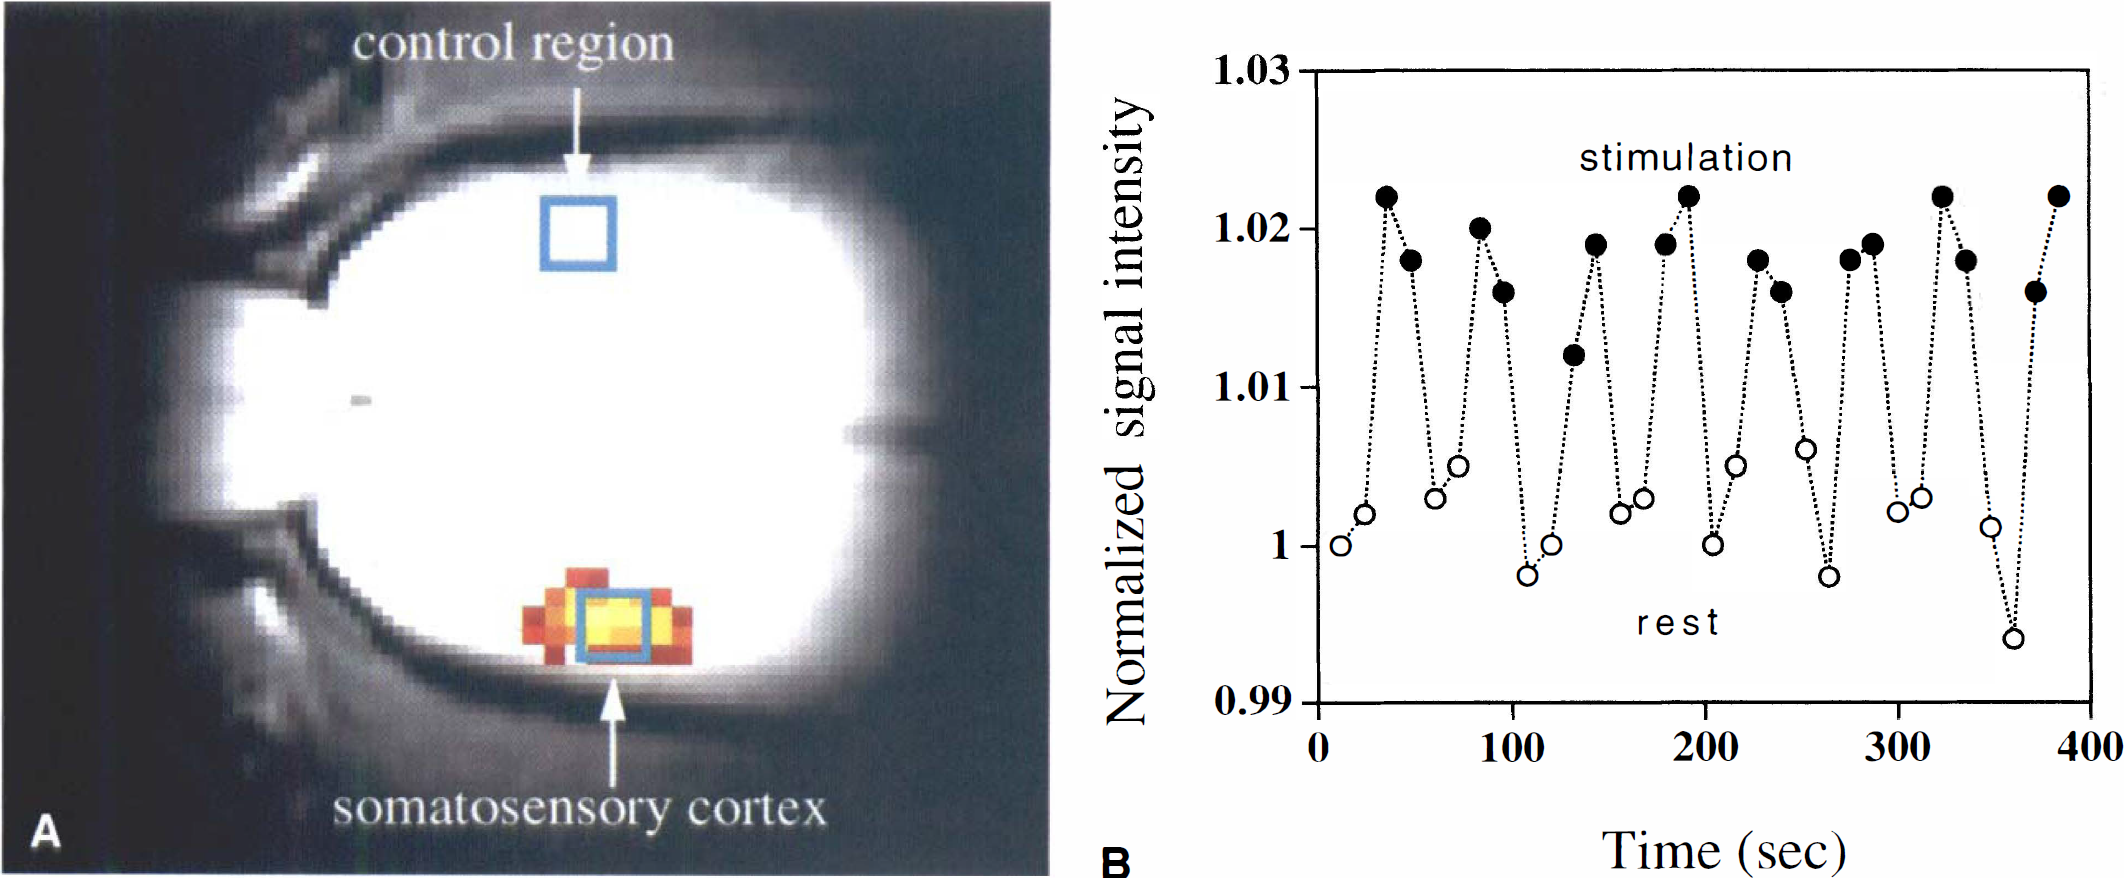
The mean signal increase for the contralateral ROI (as shown in Fig. 1A) caused by neuronal stimulation during the baseline period was ΔS0/S = 0.03 ± 0.01, with a TE of 30 milliseconds, a response similar to that previously reported in the anesthetized rat at this magnetic field strength (Scanley et al., 1997). When insulin was infused, the decrement in plasma glucose was accompanied by a decrease in activation signal relative to the preinfusion state. Restoration of euglycemia almost entirely restored the activation response. This is illustrated in a single animal in Fig. 2A that shows activation maps overlaid on long TE anatomic images (those used for generating the activation map) during 3 sequential portions of the study, that is, plasma at 5.7 mmol/L, 2.9 mmol/L, and 5.2 mmol/L, respectively. The maps shown are thresholded to the same level of significance (P < 0.04) to illustrate the effect of lowered plasma glucose. Fig. 2B shows the corresponding temporal evolution of the fMRI signal intensity and blood glucose.
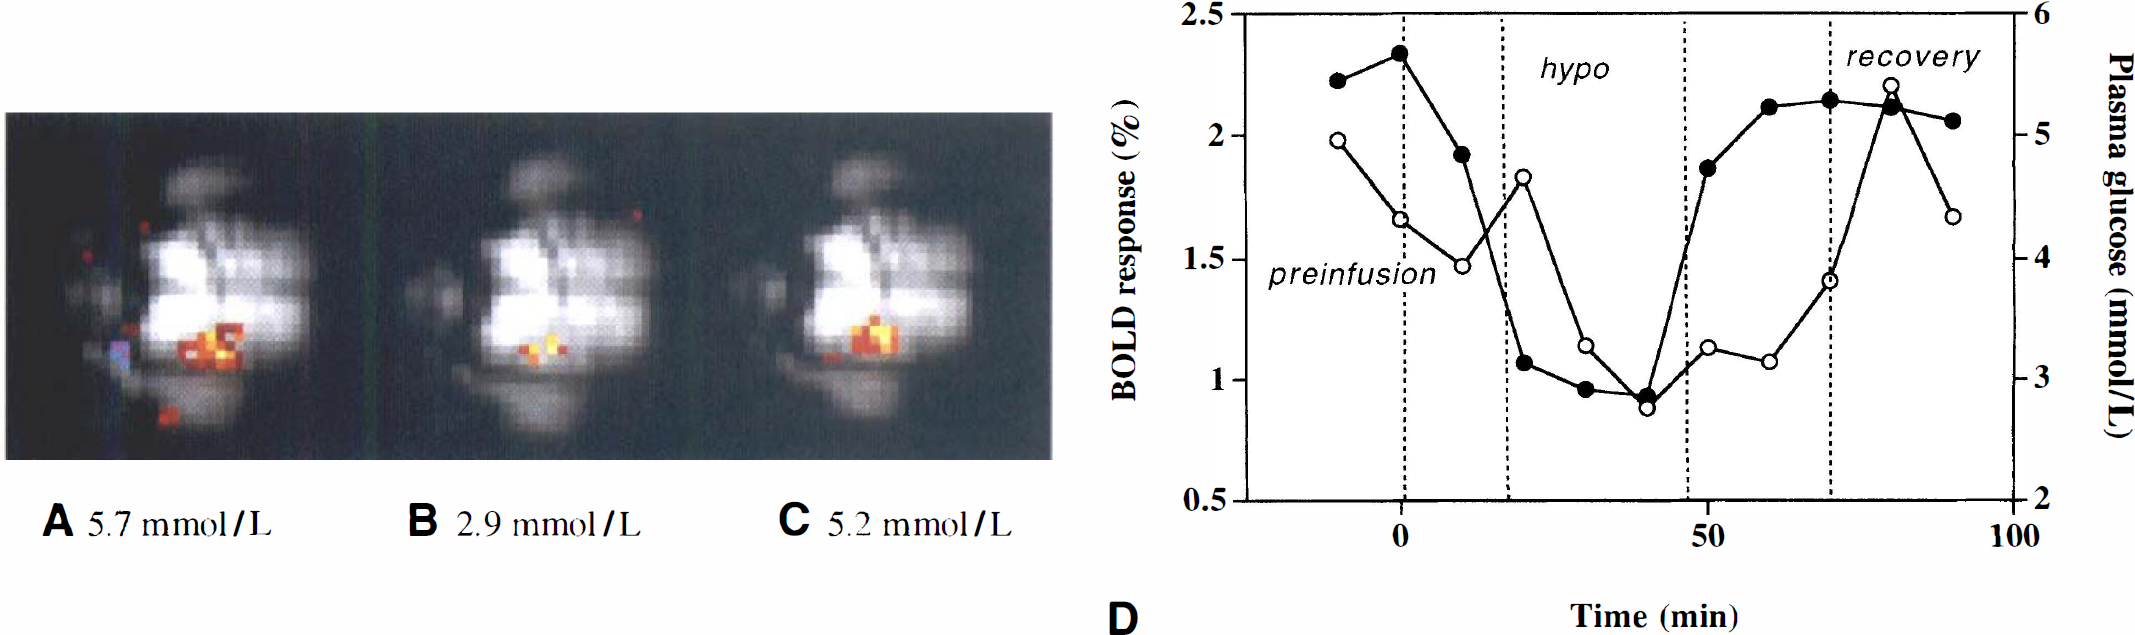
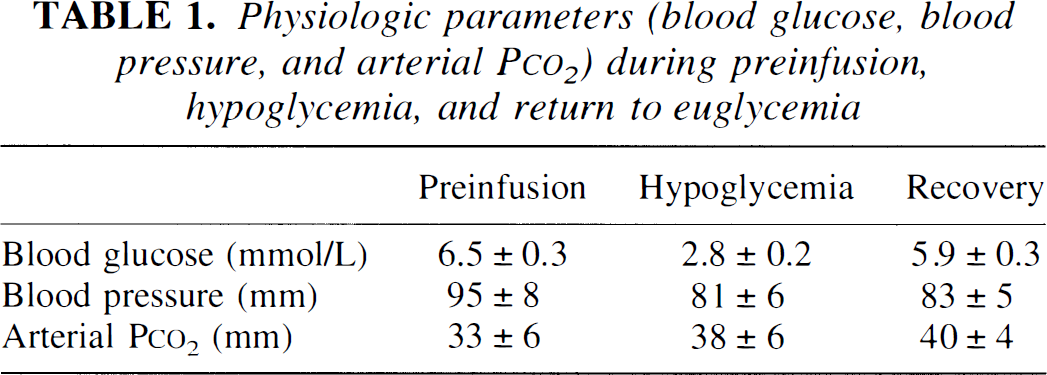
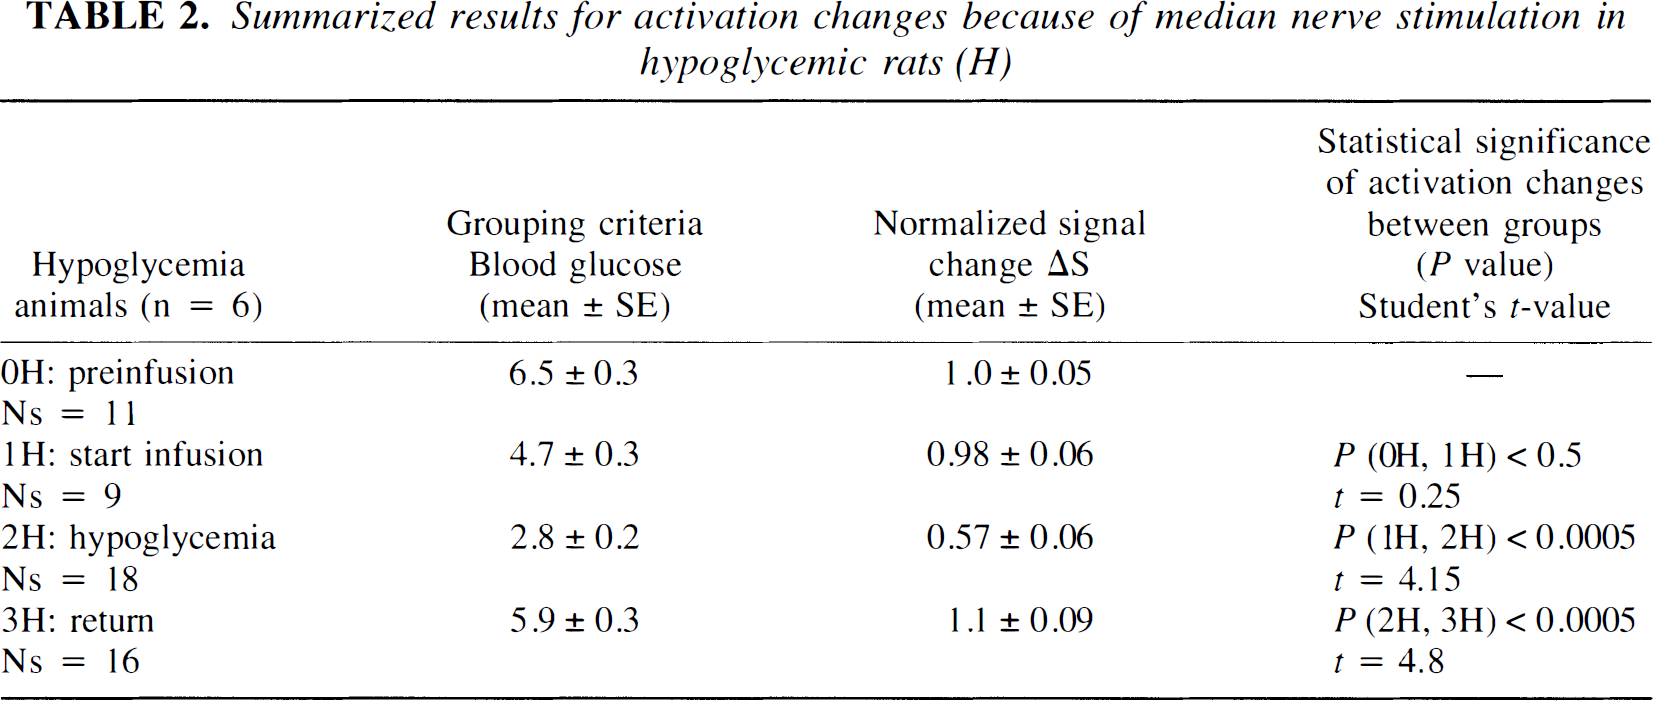
Fig. 3 summarizes the results of the ROI analysis during neuronal stimulation for the hypoglycemia studies (n = 6 rats, with a total of 64 stimulation sets). At baseline, the blood plasma glucose averaged 6.6 ± 0.3 mmol/L and was always above 5.2 mmol/L. During the insulin infusion period, the data were grouped as follows: (1) the prehypoglycemia phase, that is, plasma glucose >4 mmol/L (mean = 4.7 ± 0.2 mmol/L); (2) the hypoglycemia phase (mean = 2.8 ± 0.2 mmol/L); and (3) the euglycemic restoration period at which time the glucose was >4 mmol/L (mean = 5.9 ± 0.3 mmol/L). Data at intermediate glucose levels between 3.6 mmol/L and 4 mmol/L were discarded from analysis. Table 1 shows the stability of physiologic parameters over the course of the experiment. In general, there was a small drift of decreasing blood pressure and increasing arterial Pco2. These changes were not correlated with blood glucose. Fig. 3 shows the mean signal change (ΔS) during neuronal stimulation for the contralateral somatosensory ROI normalized to the preinfusion value (ΔSpreinf). In the prehypoglycemia phase (group 1), there was no significant reduction in activation signal as compared with the preinfusion state. However, when plasma glucose was reduced to less than 3.6 mmol/L during the hypoglycemia phase, the activation signal was 43% less than the preinfusion value, a difference that was highly significant (P < 0.0005). Restoration of euglycemia caused a rapid increase in the activation intensity (P < 0.0005) that slightly, but not significantly, overshot the basal intensity by 10%. These results are summarized in Table 2. Changes in the intensity of the activation signal induced by changes in plasma glucose levels were relatively rapid; the lag was generally less than 20 minutes. Fig. 4 shows the result of ROI analysis in the control region throughout the hypoglycemia infusion study. There were small changes in global cerebral oxygenation (and hence, blood flow and metabolism) in the brain before, during, and after hypoglycemia was produced. Although the mean changes during hypoglycemia (< 0.3%) were insignificant (P < 0.5), those during the recovery period showed an increase of 1.3% relative to the preinfusion signal that approached statistical significance (P < 0.07). This signal increase during recovery might be because of reactive hyperemia as the glucose infusion rate was increased.
Physiologic parameters (blood glucose, blood pressure, and arterial P
Summarized results for activation changes because of median nerve stimulation in hypoglycemic rats (H)
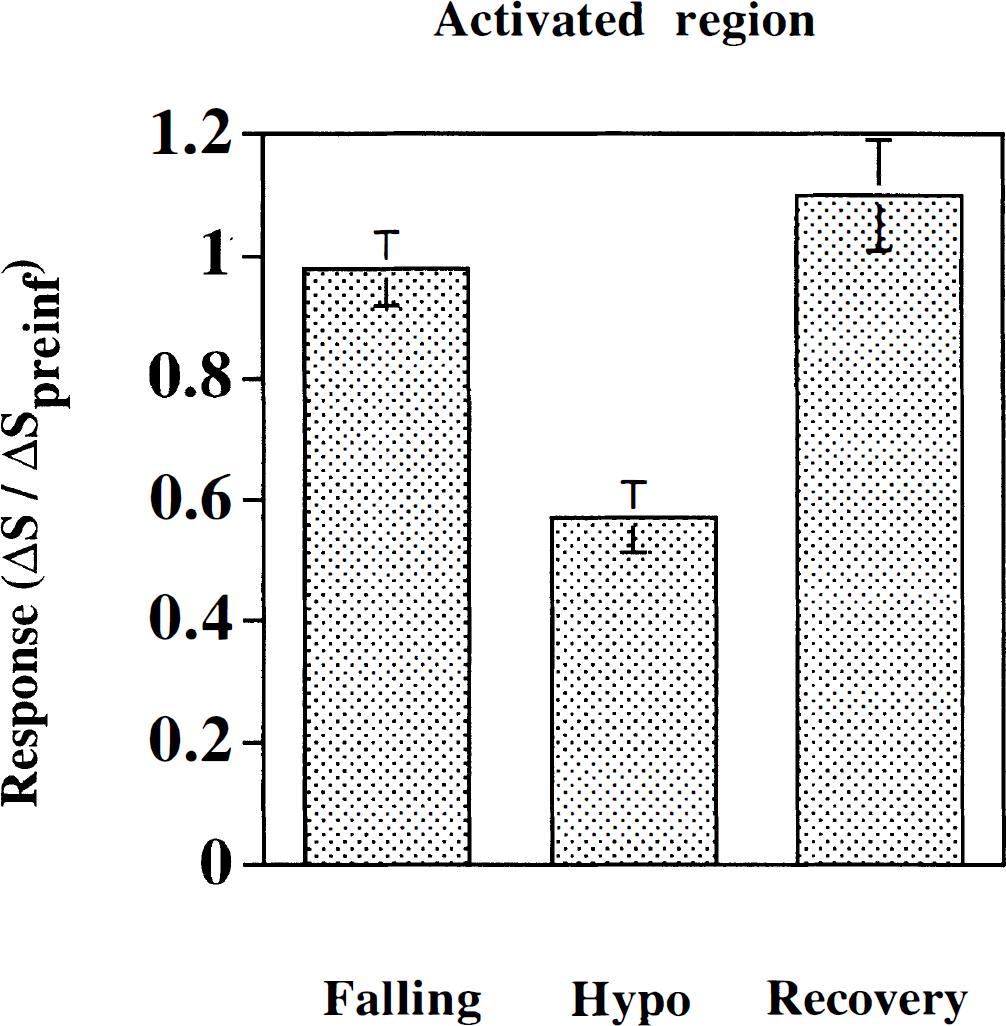
Region of interest analysis during mild hypoglycemic clamp. The x-axis denotes mean blood glucose level as discussed in the text (Falling, CplGlu = 4.7 ± 0.3 mmol/L; Hypoglycemic (Hypo), CplGlu = 2.8 ± 0.2 mmol/L; Recovery, CplGlu = 5.9 ± 0.3 mmol/L). The y axis denotes the mean percent signal change during neuronal stimulation ΔSact, normalized to the preinfusion signal change during neuronal activation, ΔS0act.
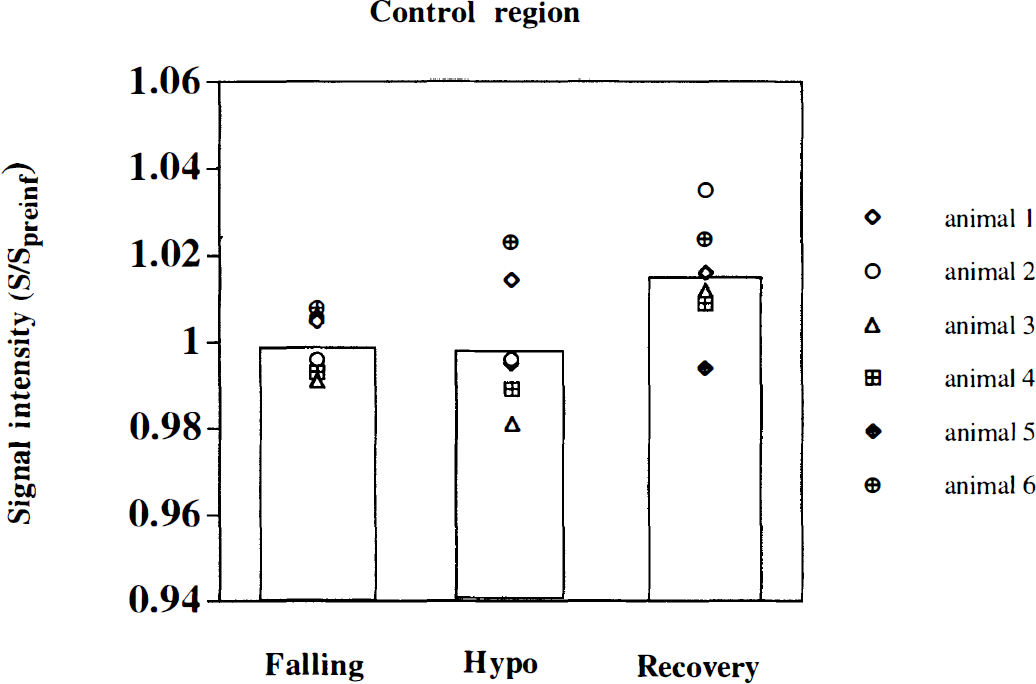
Region of interest analysis during mild hypoglycemic clamp. Normalized signal in nonactivated control region versus mean blood glucose levels (Falling, CplGlu = 4.7 ± 0.3 mmol/L; Hypoglycemic, CplGlu = 2.8 ± 0.2 mmol/L; Recovery, CplGlu = 5.9 ± 0.3 mmol/L). Average time courses for each animal and group averages (bars) are shown.
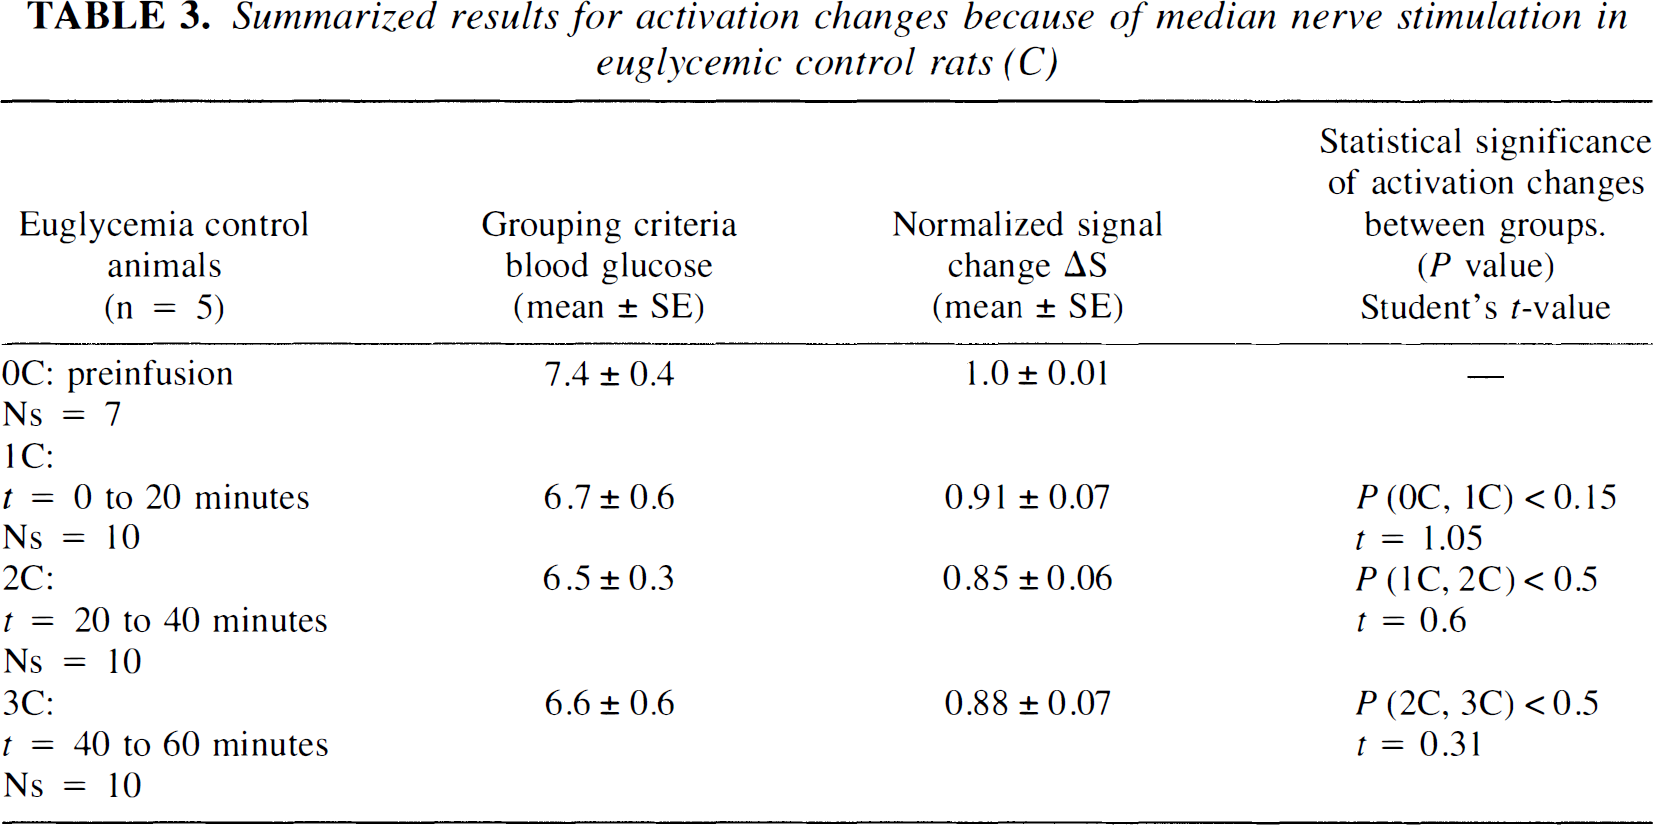
Fig. 5 and Table 3 show the cumulative results in the euglycemic control animals (n = 5 rats). Six stimulation data sets were evaluated for each animal over the course of 60 to 90 minutes. After the preinfusion period (plasma glucose, 7.42 ± 0.4 mmol/L), 6 stimulation data sets were evaluated during the euglycemic hyperinsulinemia (mean plasma glucose of 6.5 ± 0.5 mmol/L). Data were grouped sequentially in 20-minute periods. There was a small but insignificant (P < 0.15) decrease in the activation signal in the initial 10 to 20 minutes of euglycemic hyperinsulinemia, but no significant changes occurred thereafter. Thus, although there may be some temporal degradation of the activation-related signal during the infusion, there was no evidence of temporal fluctuations that could account for the changes observed during the hypoglycemic clamp study.
Summarized results for activation changes because of median nerve stimulation in euglycemic control rats (C)
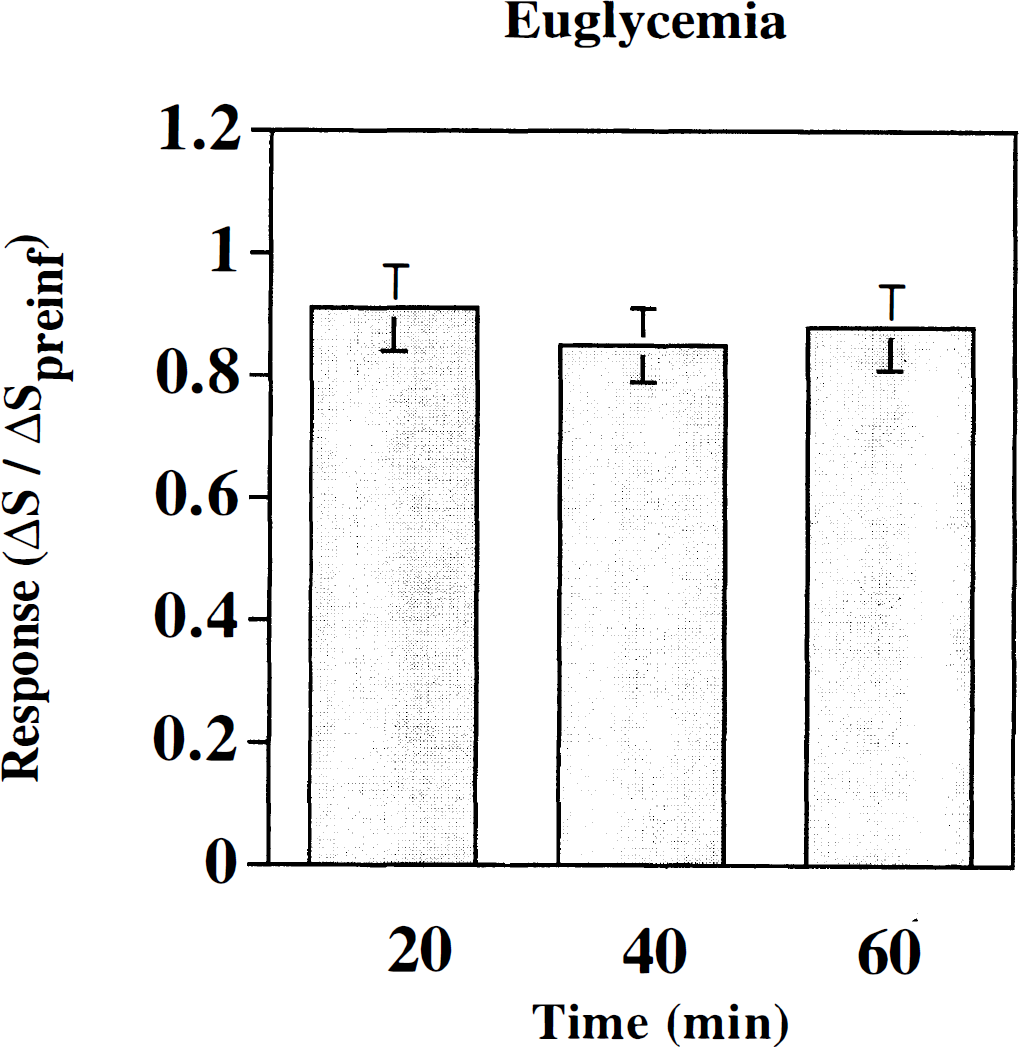
Region of interest (ROI) analysis for euglycemic controls. The x-axis denotes mean blood glucose level as discussed in the text (20 minutes, CplGlu = 6.6 ± 0.7 mmol/L; 40 minutes, CplGlu = 6.5 ± 0.2 mmol/L; 60 minutes, CplGlu = 6.55 ± 0.3 mmol/L). The y-axis denotes the mean signal change, ΔS, for ROI during neuronal stimulation, ΔSact, normalized to the preinfusion mean signal change during neuronal stimulation, ΔS0act, during 60 to 90 minutes clamp. Mean data are grouped consecutively (∼20 to 30 minutes per group) with two activation sets per group.
DISCUSSION
The current study demonstrated that during mild, controlled hypoglycemia the fMRI response caused by median nerve stimulation was significantly decreased. This hypoglycemia-induced change was rapidly reversed when euglycemia was restored. Although small but insignificant changes in the fMRI signal were associated with euglycemic hyperinsulinemia, this cannot account for the response changes observed during hypoglycemia. Furthermore, there were no apparent signal changes during the hypoglycemic episode within a control brain region not involved in activation. Although previous fMRI studies have shown that hyperglycemia had little effect on visual stimulation response (Gruetter et al., 1997), to the authors' knowledge there have been no reported results on the effects of hypoglycemia on fMRI.
Several potential effects of hypoglycemia must be considered to explain the observed changes in the fMRI response. Equation 1 shows that the BOLD signal change is proportional to the fractional change in blood flow and oxidative metabolism during activation. Four possible scenarios that could explain a decrease in BOLD response during hypoglycemia are summarized below. These four cases can be grouped as changes in flow–metabolism of the resting state (while the active state is unaffected by hypoglycemia) and changes in the flow–metabolism coupling in the active (rest + Δ) state.
First, if this degree of hypoglycemia was sufficient to produce an increase in brain blood flow, or vasodilation, or both, then the additional effects of neuronal activation could have been attenuated, leading to a reduced BOLD effect by virtue of an increase in the term CBFrest in Eq. 1. This mechanism is, for example, the explanation for the reduction in BOLD signals seen during CO2 administration (Bandettini et al., 1995). The authors believe this possibility is however unlikely for their observations during hypoglycemia. No global changes in the MRI signal were observed during hypoglycemia in keeping with several reports demonstrating no changes in cerebral flow during mild hypoglycemia of a similar degree in humans (Powers et al., 1993) and rodents (Hornika et al., 1997). However, it should be emphasized that more severe hypoglycemia (mean plasma glucose of < 2.0 mmol/L) does significantly increase blood flow in humans as observed by single photon emission computed tomography techniques (Tallroth et al., 1992, 1993). Thus, the presence of global blood flow changes cannot be completely excluded because simultaneous blood flow measurements were not performed. Unfortunately, the authors were unable to perform such measurements with sufficient signal-to-noise at 2.0T, though this may be possible at higher field strengths or with customized coil designs.
Second, if the basal oxidative metabolism decreased during hypoglycemia (CMRO2,rest decreases), the authors would expect a decrease in the BOLD response in Eq. 1. Such a global decrease in metabolism should also cause an increase in the resting signal during hypoglycemia that the authors did not detect. Alternatively, hypoglycemia could have decreased the BOLD effect if the flow, or metabolism, or both, in the active state were altered. A decrease in BOLD signal could be accounted for if oxygen use in the activated state was stimulated (ΔCMRO2,act increases during hypoglycemia), thereby maintaining higher levels of deoxyhemoglobin. However, this is highly unlikely given the presence of glucose deficiency, thereby requiring an alteration of the stoichiometry of oxidative metabolism. Finally, a decrease in the blood flow response to neuronal stimulation (ΔCBFact decreases) might have occurred that would decrease the activation signal. The degree by which local oxidative metabolism can increase upon stimulation is itself likely to be limited by the reduced availability of glucose from the circulation. Although the mechanism underlying the link between limited glucose availability, impaired oxidative metabolism, and the local blood flow response remains uncertain; the authors favor the last scenario because they did not observe resting signal changes during hypoglycemia, and it is unlikely that metabolism in the active state would increase during hypoglycemia. It is also possible that some combination of these effects could lead to the observed response. Future studies using quantitative flow fMRI (Schwarzbauer et al., 1996; Kim and Tsekos, 1997), quantitative blood volume fMRI (Kennan et al., 1997, 1998; Mandeville et al., 1998), and near infrared spectroscopy (Maki et al., 1995; Obrig et al., 1996) may clarify the interpretation of the data.
It should be noted that a previous study using PET to monitor the motor activation blood flow response in humans showed no significant effect when plasma glucose was decreased to similar hypoglycemic levels (Powers et al., 1996). It is most likely that differences between these findings and those reported in the current are because of the type of stimulus used. The much more intense 6 Hz electrical stimulus used in the current study is likely to invoke greater metabolic changes in the brain than the motor task involving finger tapping used in that previous study. Functional magnetic resonance imaging might also have provided increased sensitivity because of high spatial resolution that allow the detection of small localized activation regions, which may be averaged out in PET. Other possible explanations include an indirect coupling of the effects of blood glucose to the level of anesthesia; however, the authors did not note any systematic changes in blood pressure or heart rate during hypoglycemic episodes. Alternately, there simply could be a basic physiologic difference between the metabolic responses of the rat brain and the human brain. However, previous studies in rat models have shown similar effects of hypoglycemia on neurologic function as measured electrophysiologically and observed in humans (Jacob et al., 1995). Also, the authors observed changes in the activation signal within 20 to 30 minutes of establishing mild hypoglycemic conditions. This was significantly faster than when observed through electrophysiology (Jacob et al., 1995), thus it may be possible that the coupling mechanism between blood flow and metabolic demand is affected before the deterioration of neuronal response.
In summary, the authors have found that fMRI can detect dynamic changes in cerebral function because of insulin-induced mild hypoglycemia, which are reversible upon the restoration of euglycemia. The fMRI effect is localized to the region of activation and is likely not related to global changes in cerebral blood flow. The implication of these experiments is that fMRI may reflect increases in local brain glucose metabolism that under conditions of hypoglycemia may be substrate limited.