
Abstract
Measurement of cerebrovascular reactivity (CVR) can give valuable information about existing pathology and the risk of adverse events, such as stroke. A common method of obtaining regional CVR values is by measuring the blood flow response to carbon dioxide (CO2)-enriched air using arterial spin labeling (ASL) or blood oxygen level-dependent (BOLD) imaging. Recently, several studies have used carbogen gas (containing only CO2 and oxygen) as an alternative stimulus. A direct comparison was performed between CVR values acquired by ASL and BOLD imaging using stimuli of (1) 5% CO2 in air and (2) 5% CO2 in oxygen (carbogen-5). Although BOLD and ASL CVR values are shown to be correlated for CO2 in air (mean response 0.11 ± 0.03% BOLD, 4.46 ± 1.80% ASL,
Keywords
INTRODUCTION
Over the past few decades, magnetic resonance imaging (MRI) has become an indispensable tool in health care, which is used for clinical diagnosis, treatment planning, and ground-breaking research. Recently, there has been a gradual move from solely using images (susceptible to subjective interpretation) toward acquiring quantitative data that can give more specific information on a per-subject basis, and that allows for better comparison between subject populations. One quantifiable measure of localized brain physiology is cerebrovascular reactivity (CVR), a measure of the ability of vasculature in the brain to respond to a stimulus. High CVR indicates the ability of the vasculature to provide a substantial increase in cerebral blood flow (CBF) and cerebral blood volume (CBV) in response to a given stimulus, both of which increase the rate at which freshly oxygenated blood perfuses the capillary networks in the brain. Cerebrovascular reactivity varies both between subjects and across different regions of an individual's brain. Reduced CVR has long been considered as a marker for cerebrovascular pathology and as a risk factor for stroke;1-3 although CVR naturally decreases with age, 4 it can be further reduced as a result of stroke, 5 dementia,6,7 diabetes, 8 or severe depression.9,10
To be clinically feasible, methods of measuring CVR must be repeatable, tolerable for patients, and relatively quick to perform. Inhalation of carbon dioxide (CO2) acts as an immediate vasodilatory stimulus with few contraindications and minimal associated cost. Mandell
Measuring Cerebrovascular Reactivity
Arterial spin labeling can be used to acquire perfusion-weighted images without the necessity of injecting a contrast agent. By magnetically tagging inflowing arterial blood in the neck it is possible to track the tagged blood's path through the cerebral vasculature. If the
To overcome these issues, BOLD imaging has been increasingly investigated as an alternative method of measuring CVR. 11 The magnitude of a BOLD signal is reduced in the presence of deoxyhemoglobin, so BOLD imaging is an indirect measure of the local rate of blood delivery to the brain. This method has been used extensively to investigate which areas of the brain are involved in particular cognitive tasks; however, it can also be used to measure the reactivity of the cerebral vasculature to an external stimulus.
In this study, subjects breathed increased concentrations of CO2, known to increase both CBF and CBV. There is some indication that a mild hypercapnic stimulus induces a small change in cerebral metabolic rate of oxygen (CMRO2) consumption in humans, 18 although this effect is not yet confirmed and has been disputed by some researchers. 19 Because the BOLD signal is sensitive to CBF and CBV, the BOLD response to a vasodilatory stimulus, such as CO2, can be used as a measure of CVR. However, the magnitude of the BOLD signal also depends on a number of additional parameters, including the equipment used and the chosen pulse sequence as well as resting CBF, CBV, venous oxygen saturation, and cerebral metabolic rate of oxygen. As a result, particular care must be taken when interpreting BOLD CVR data.
Some recent studies15-17 have used carbogen gas that consists of CO2 with balance oxygen for CVR quantification. However, during carbogen inhalation the arterial partial pressures of both CO2 (PaCO2) and oxygen (Pao2) are significantly increased, causing the BOLD signal to be elevated through more than one mechanism; increased blood flow due to CVR
The Bohr and Haldane effects, respectively, describe the impact of CO2 concentration on oxygen binding to hemoglobin (Hb), and the reciprocal impact of oxygen concentration on CO2 transport in the blood. In a high-oxygen/low-CO2 environment (such as the lungs), Hb has an increased affinity for oxygen and the ability to transport CO2 is reduced. These effects are reversed in low-oxygen/high-CO2 environments such as those found in the tissues. Thus, Hb's transport abilities are finely tuned to effectively transport oxygen from the lungs to the tissues, and CO2 from the tissues to the lungs. During hyperoxia, the tissues effectively become high-oxygen environments, affecting both the release of oxygen from Hb and the ability of the blood to transport CO2. During carbogen breathing, the situation is complicated even further as the lungs become a high-CO2 environment (
Although the Bohr and Haldane effects are individually well understood, the interaction between them when both oxygen and CO2 concentrations are simultaneously increased is exceptionally difficult to determine. Thus, the change in end-tidal measures of oxygen and CO2 between air and carbogen breathing is not necessarily indicative of the change in the arterial or tissue partial pressures, which are driving the vasoactive effects.
MATERIALS AND METHODS
Nine healthy, nonsmoking volunteers were recruited for this study, mean age 25 ±4 years, two females. Murphy
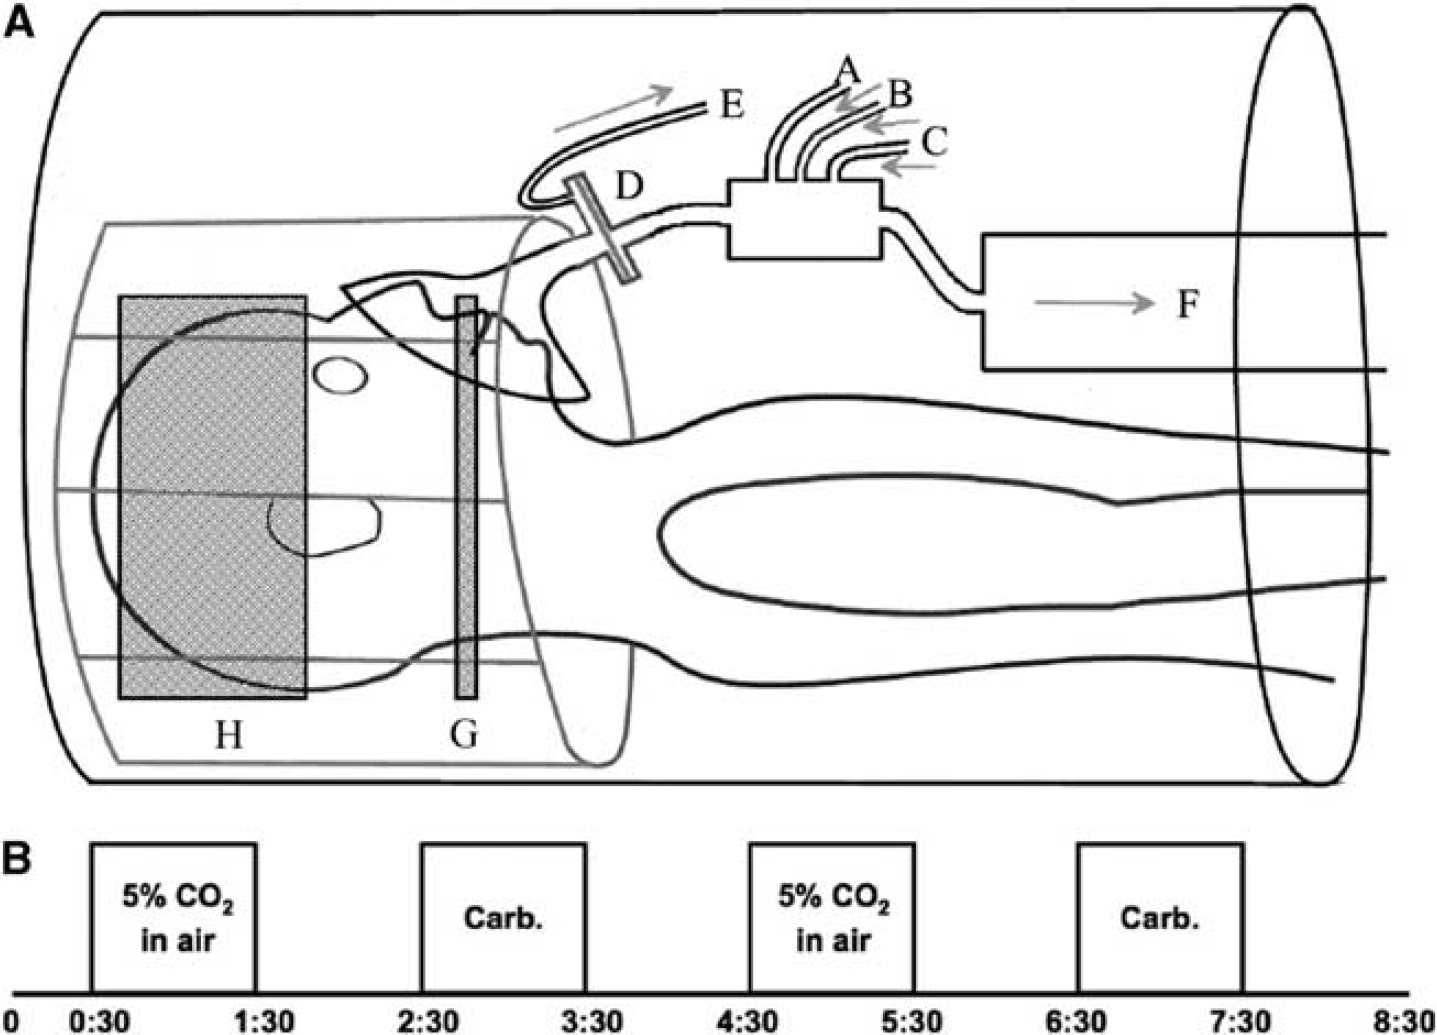
The study was performed on a 3-T Siemens Verio scanner (Siemens, Erlangen, Germany) using a 32-channel receive-only head coil. A single TI dual echo pulse sequence was used, allowing acquisition of data for both ASL and BOLD after a single radio frequency excitation (a short echo time gives an optimum signal for ASL, and a slightly longer echo time allows for BOLD imaging). A pseudo-continuous ASL scheme was used to magnetically tag spins at a labeling plane in the neck 22 (tag duration (τ) of 1.4 seconds and postlabel delay time of 0.8 second). The labeling plane was placed between the upper and lower contortions of the vertebral arteries near the top of the neck, as shown in Figure 1A. An echo planar imaging readout was used for fast data acquisition, with the following parameters: repetition time = 4 seconds, echo time (TE) (1) = 16 ms, TE(2) = 35 ms. In all, 23 slices were acquired for each subject (slice thickness 5.0 mm with an interslice gap of 0.5 mm; in plane resolution 64 × 64 voxels). A voxel size of 3.0 × 3.0 × 5.0 mm was used where this was sufficient for the field of view to cover the whole brain. In two cases, voxel dimensions were increased to 3.4 × 3.4 × 5.0 mm to ensure full brain coverage.
(
Subjects wore a close fitting gas mask (8930 series; Hans Rudolph Inc., Kansas City, MO, USA) over the mouth and nose, which was connected to gas delivery apparatus as shown in Figure 1A. Medical air, 5% CO2 in medical air, and carbogen-5 were delivered from compressed cylinders and gas flow (through tubes labeled as A, B, and C) was managed from the MRI control room such that gas delivery was kept at 25L/min at all times. A sampling tube (
Values for end-tidal partial pressure of CO2 (PetCO2)—the concentration of CO2 measured at the very end of expiration—were extracted from respiratory data as an average of the last three full breaths taken during each stimulus block. Average baseline PetCO2 was visually determined for each subject. It has been shown that the change in PetCO2 is a good proxy for the change in PaCO2, 24 so this information was used to deduce the change in PaCO2 in units of millimeters of mercury (mm Hg), the standard unit in the field of physiologic pressure measurements.
An in-house MATLAB (MathWorks, Natick, MA, USA) script was used to separate the acquired data into distinct ASL and BOLD files. Features from the FMRIB Software Library (http://www.fmrib.ox.ac.uk/fsl/)25-27 were used for brain extraction (BET, Brain Extraction Tool) and motion correction (MCFLIRT, Motion Correction using FMRIB's Linear Image Registration Tool). High-resolution (1 mm isotropic) structural scans of each subject were used to register each brain to MNI (Montreal Neurological Institute) standard space, using the MNI 152.2 mm template. This allowed each data set to be split into separate hemispheres, thus doubling the sample size to better examine any potential correlations (see for example Mandell
While the percentage change in signal acquired by the ASL method may be equated to that of CBF under normoxic conditions, a correction is necessary when the fraction of inspired oxygen is increased significantly, as discussed by Bulte
RESULTS
In general, participants responded well to the protocol, with only mild discomfort reported due to the slight resistance to breathing induced by the mask and the filter. One subject (4) requested the scan to be stopped toward the end of the final carbogen block. Although sufficient data had already been taken to perform the analysis, CVR values to carbogen gas for this subject, calculated in both hemispheres, were found to be outliers (defined as being more than twice the standard deviation from the group mean). Thus, both carbogen and CO2 data from this subject were excluded from quoted group averages and further statistical tests. None of the subjects exhibited significant changes in breathing rate between the three gas mixtures.
Table 1 contains respiratory data collected from the subjects during the scanning session. The PetCO2 was increased by an average of 12.1 ± 2.2 mm Hg during breathing blocks of CO2 in air and by 10.2 ±2.5 mmHg during carbogen blocks. The time courses of end-tidal pressures of CO2 and oxygen from one representative subject are shown in Figure 2, along with the BOLD signal changes. Maps of CVR for the same subject can be seen in Figure 3.
Respiratory data
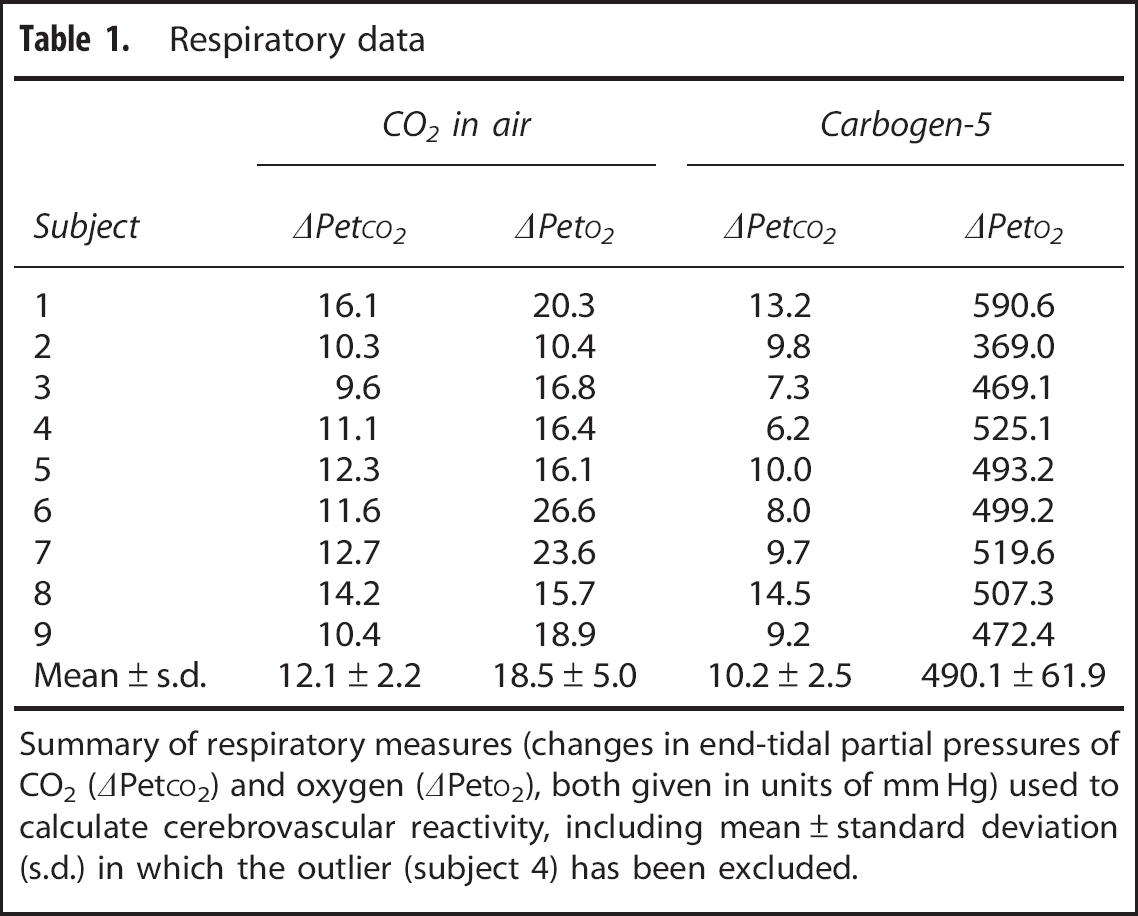
Summary of respiratory measures (changes in end-tidal partial pressures of CO2 (ΔPetCO2) and oxygen (ΔPetO2), both given in units of mm Hg) used to calculate cerebrovascular reactivity, including mean ± standard deviation (s.d.) in which the outlier (subject 4) has been excluded.
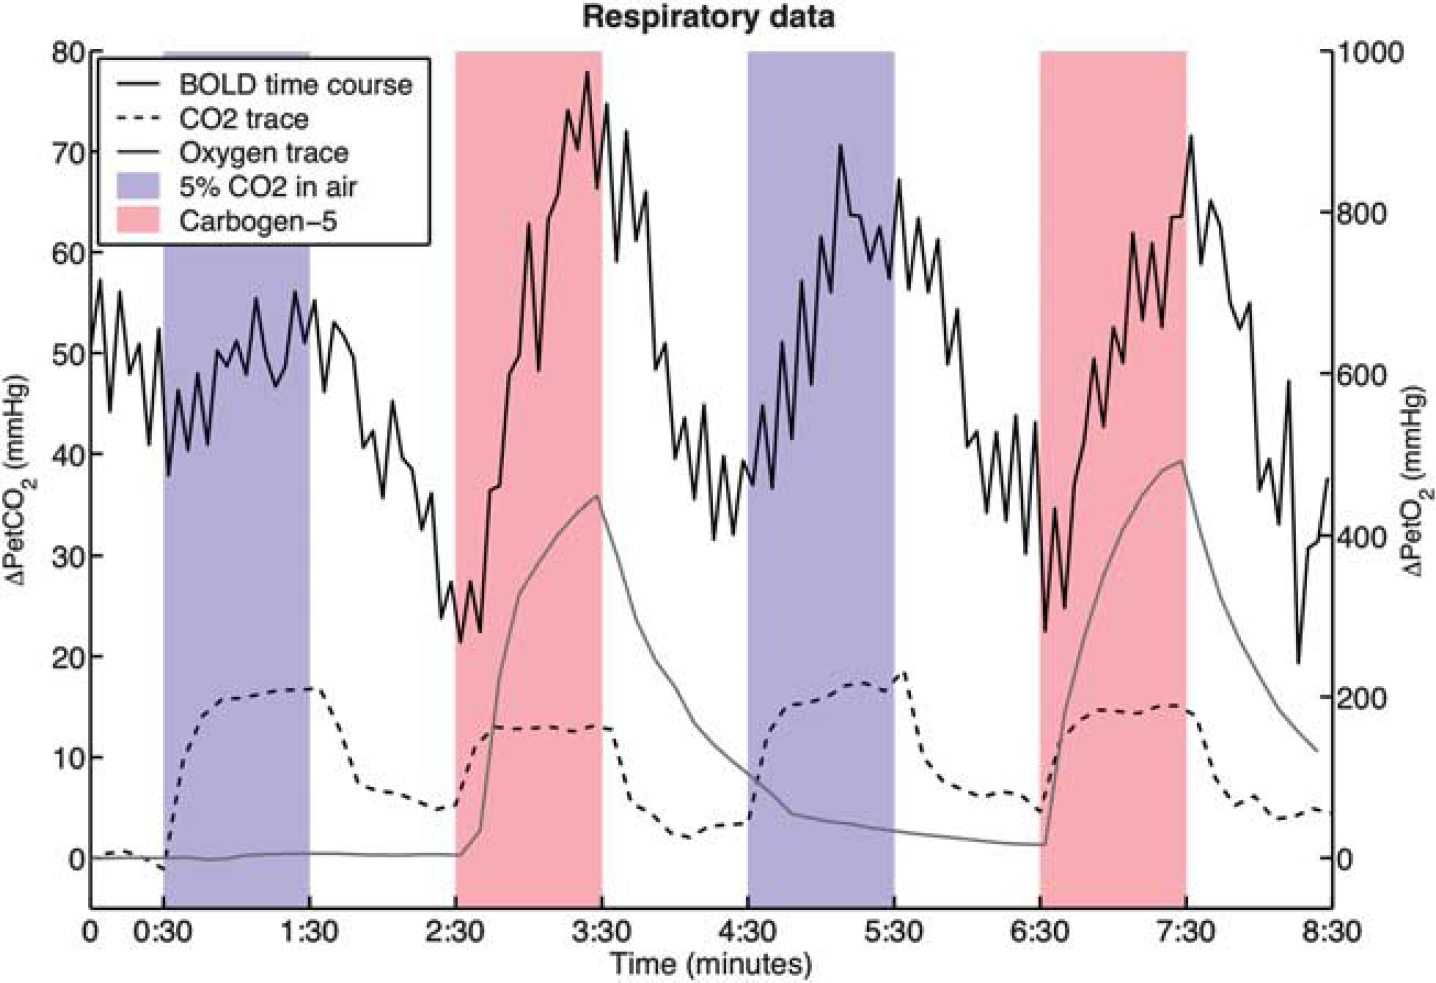
Traces of end-tidal respiratory data from a representative subject (subject 3) and the corresponding BOLD signal time course of one voxel. The smooth black line is the BOLD signal change in arbitrary units, the dashed line shows the change in end-tidal partial pressure of carbon dioxide (CO2) (ΔPetCO2) with respect to baseline where each point is the maximum within an 8-second window; and the smooth gray line shows the change in end-tidal partial pressure of oxygen, defined as the minimum (also within the 8-second window). Note that the oxygen trace appears smoother because of the much smaller scale. Blue areas indicate periods of CO2 exposure, red areas indicate periods of carbogen breathing. BOLD, blood oxygen level-dependent.
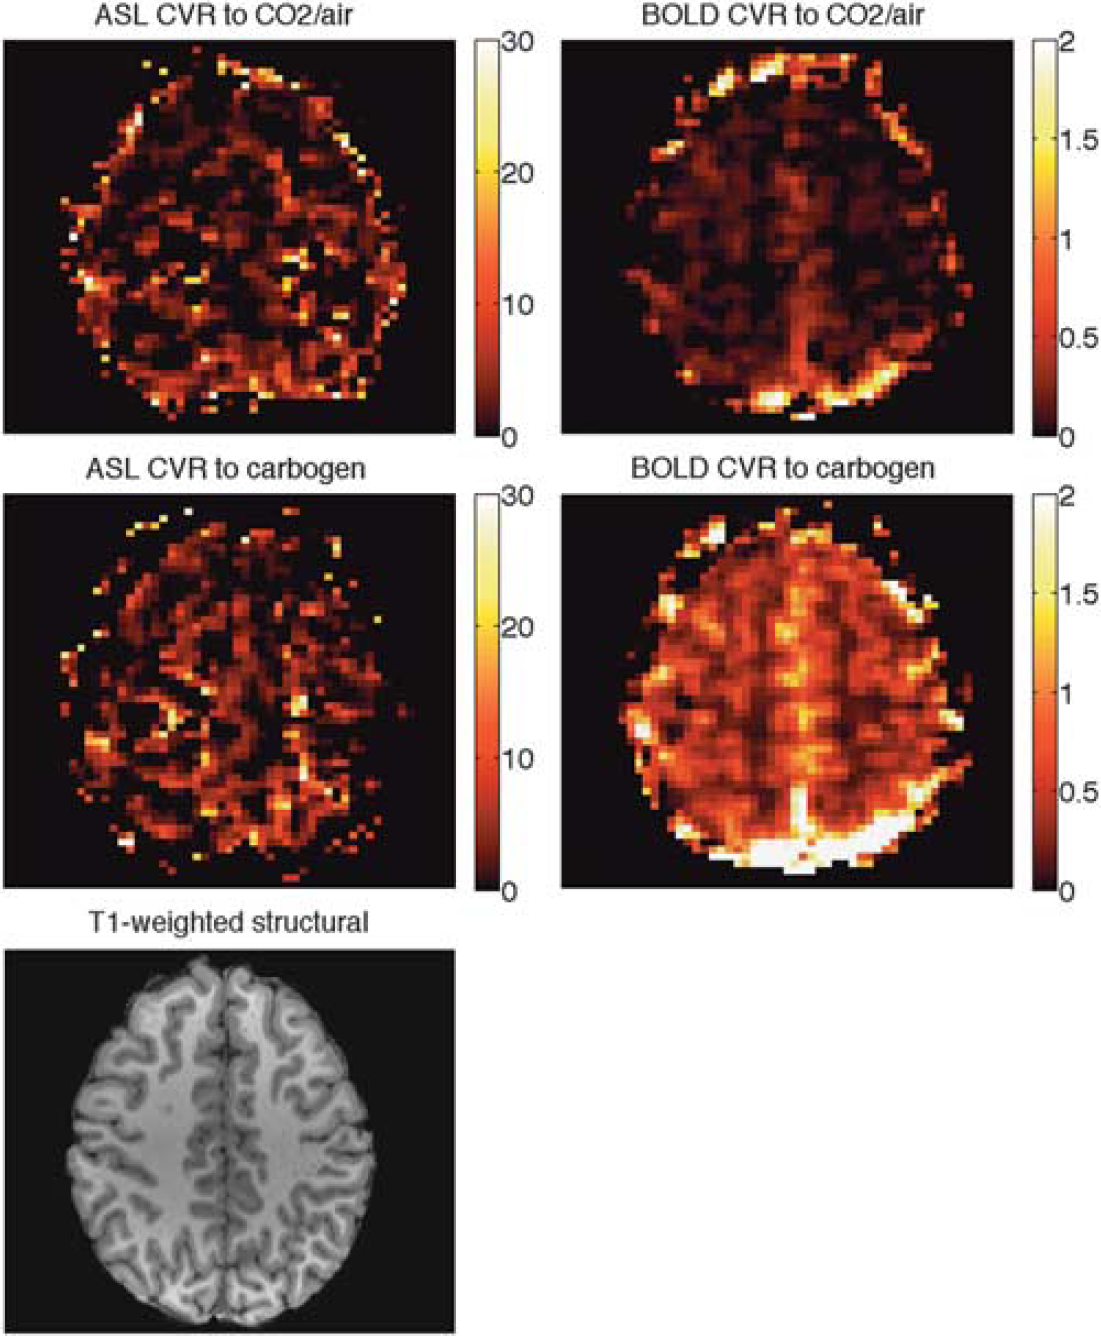
CVR maps of a representative subject (subject 3). The corresponding slice in the high-resolution
Using a raw ASL signal, the average flow response to the CO2 in air mixture appeared to be 34.1 ± 21.5%; after performing the flow correction described above this was adjusted to 54.6 ±26.1%. For carbogen, the uncorrected flow increase was 21.5 ± 18.9% and the corrected flow increase was 52.4 ±25.0%. Final results are summarized in Tables 1 and 2 and Figures 4 and 5. All values of CVR are reported as a percentage change in BOLD signal or in CBF during the stimulus versus baseline, per mm Hg change in PetCO2. Group mean values ± standard deviations are given at the bottom of the tables. Under stimulus of 5% CO2 in air, mean values of CVR were 0.11 ±0.03% BOLD, 4.46 ±1.80% corrected ASL and under carbogen stimulus were 0.36 ±0.06% BOLD and 4.97 ±1.30% corrected ASL.
Key results
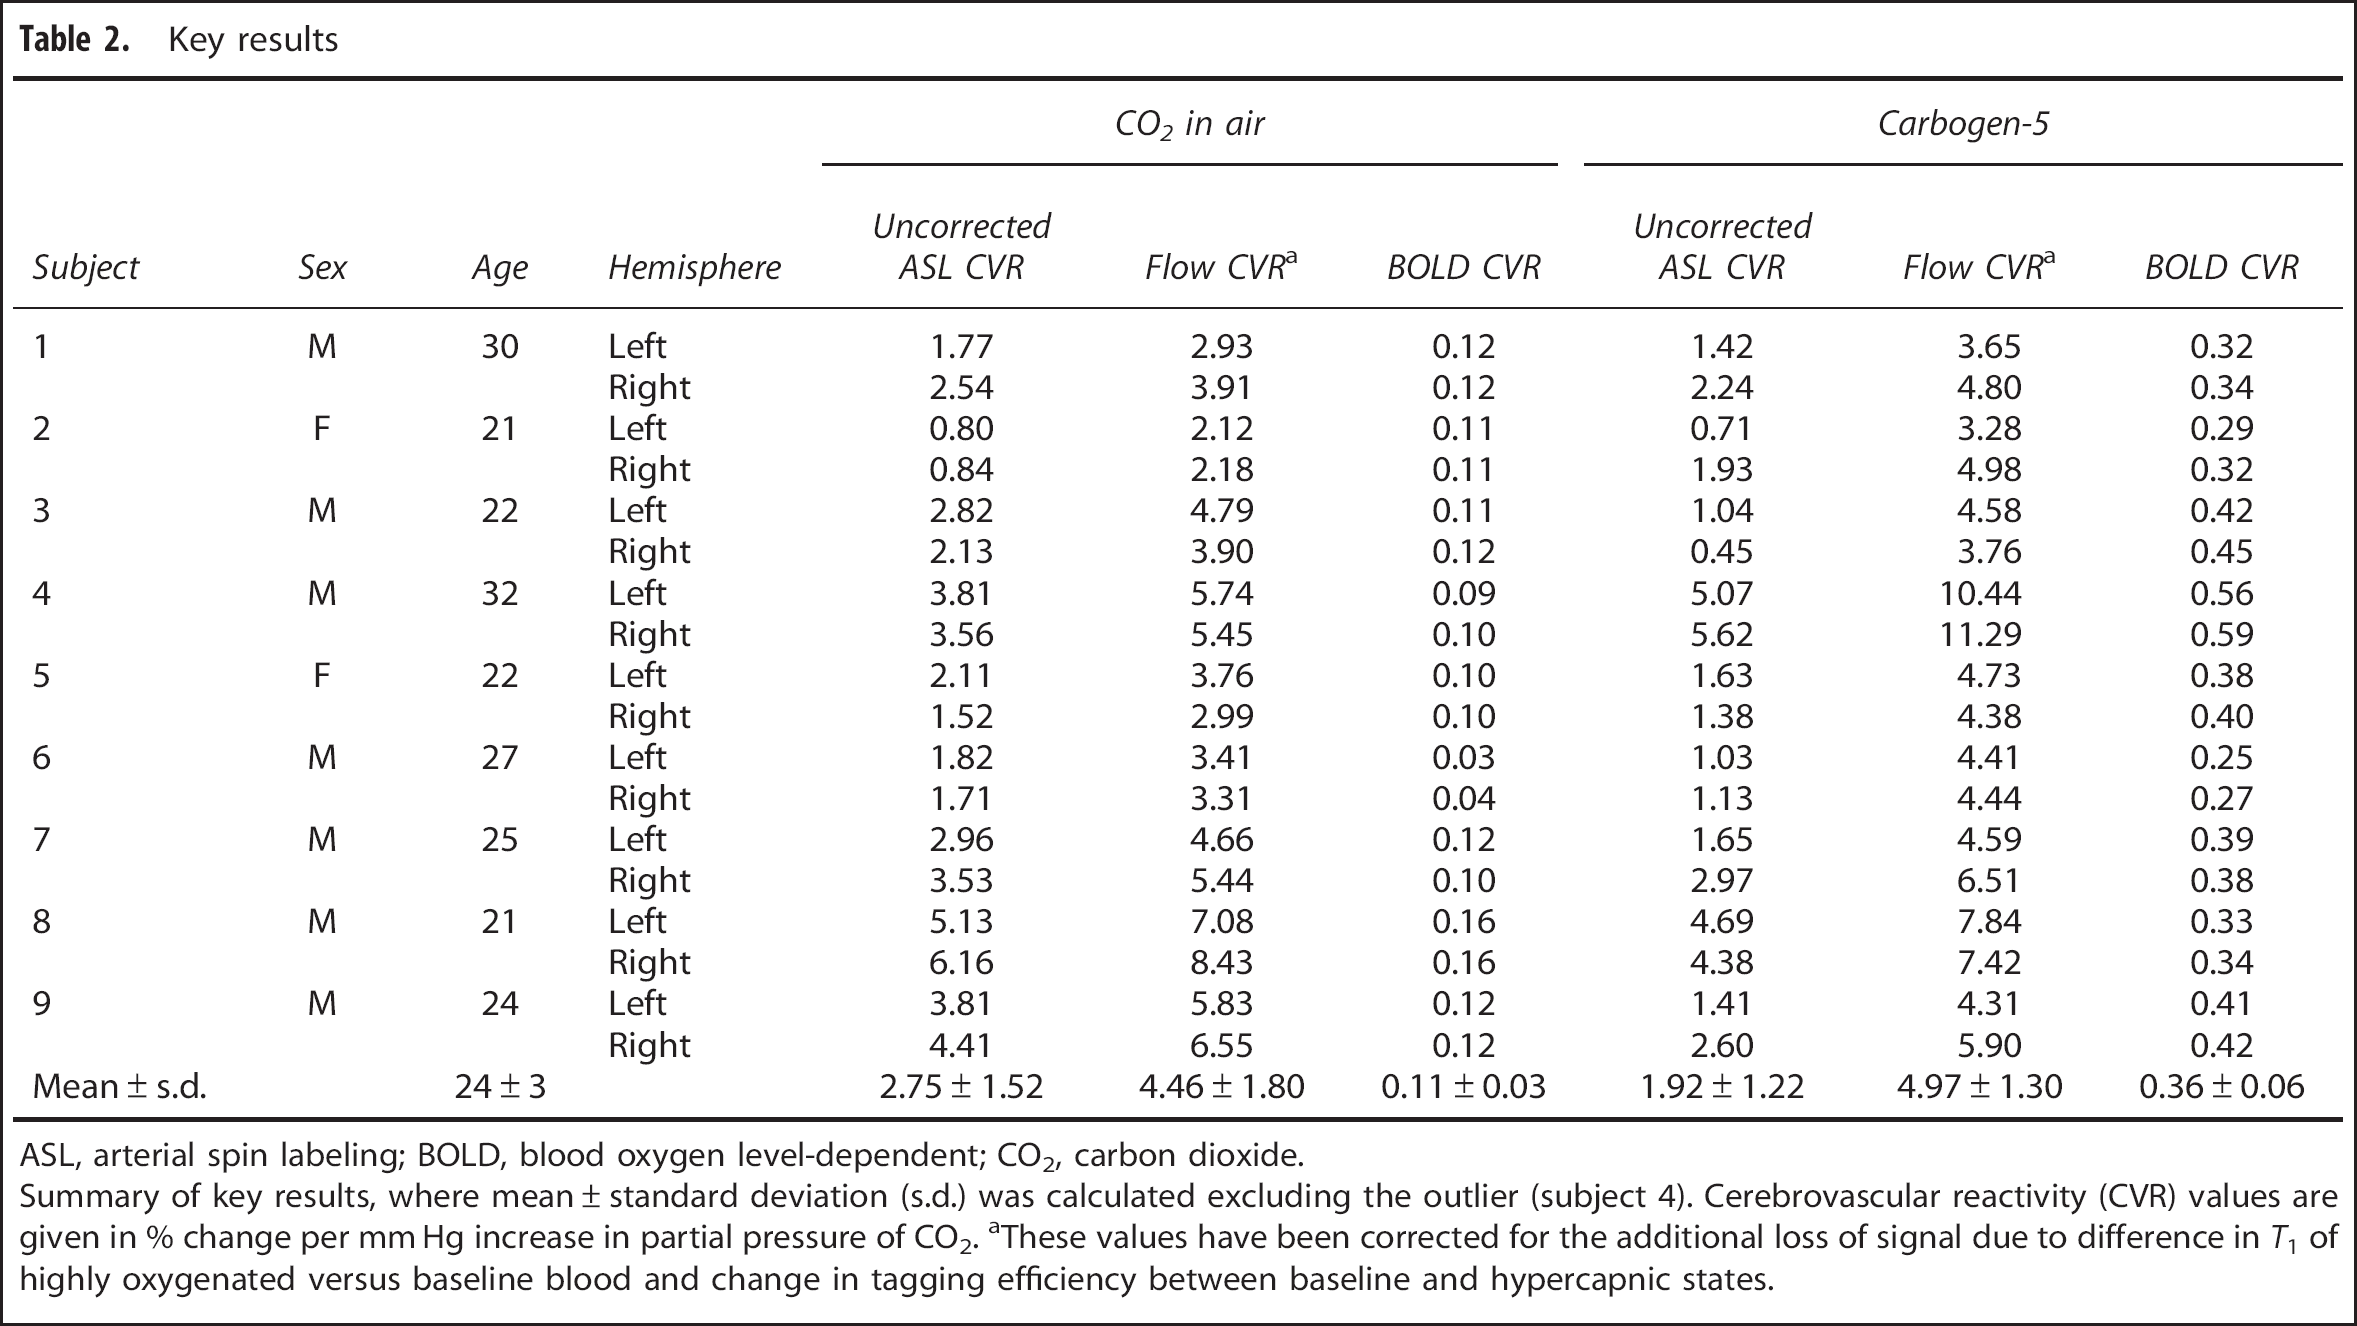
ASL, arterial spin labeling; BOLD, blood oxygen level-dependent; CO2, carbon dioxide.
Summary of key results, where mean±standard deviation (s.d.) was calculated excluding the outlier (subject 4). Cerebrovascular reactivity (CVR) values are given in % change per mm Hg increase in partial pressure of CO2. aThese values have been corrected for the additional loss of signal due to difference in
As shown in Figure 4, CVR values calculated from BOLD and ASL acquisitions (after correction for variable
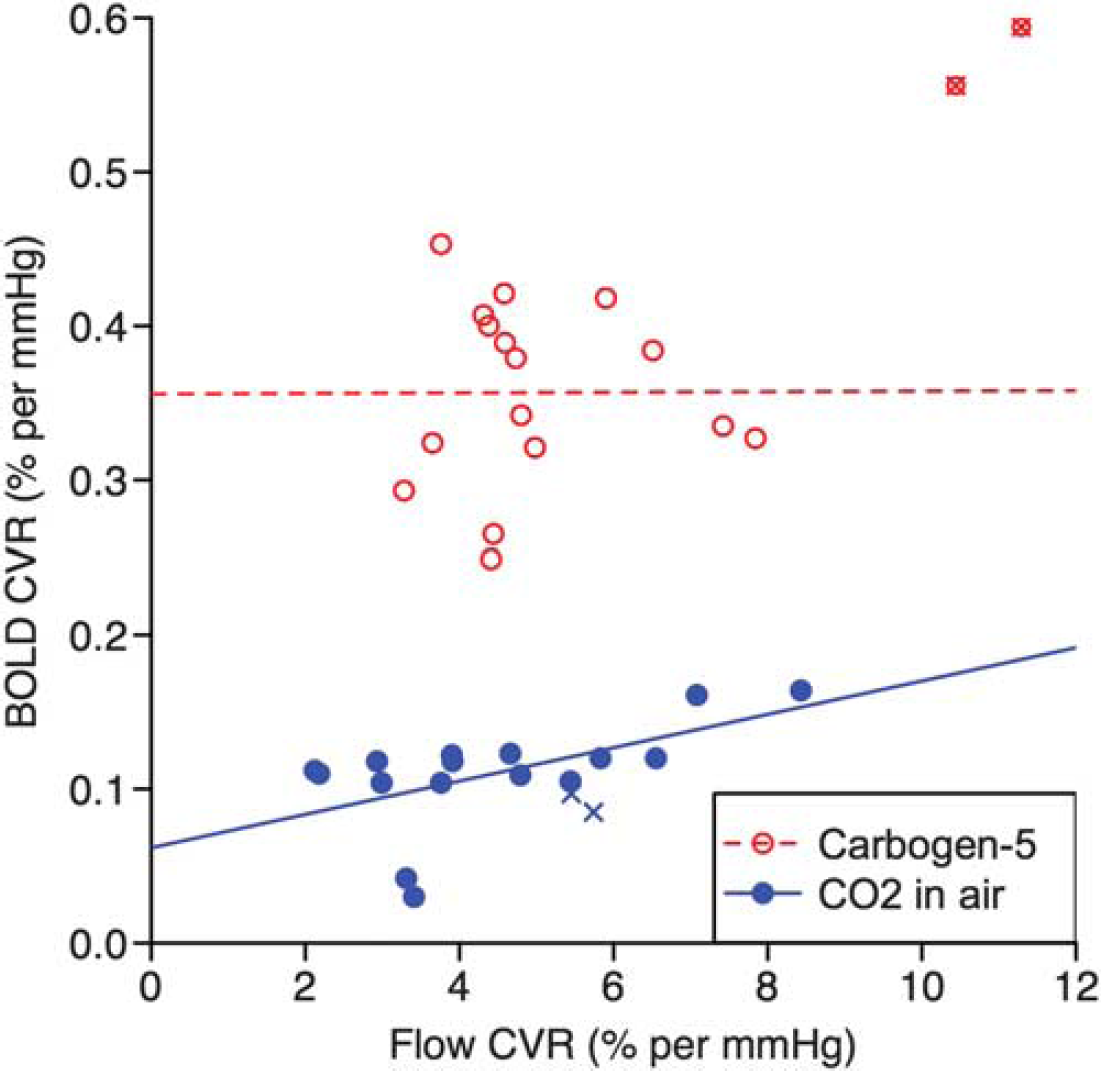
Comparison of CVR values as measured by flow and BOLD response. For carbogen-5 (red, open circles)
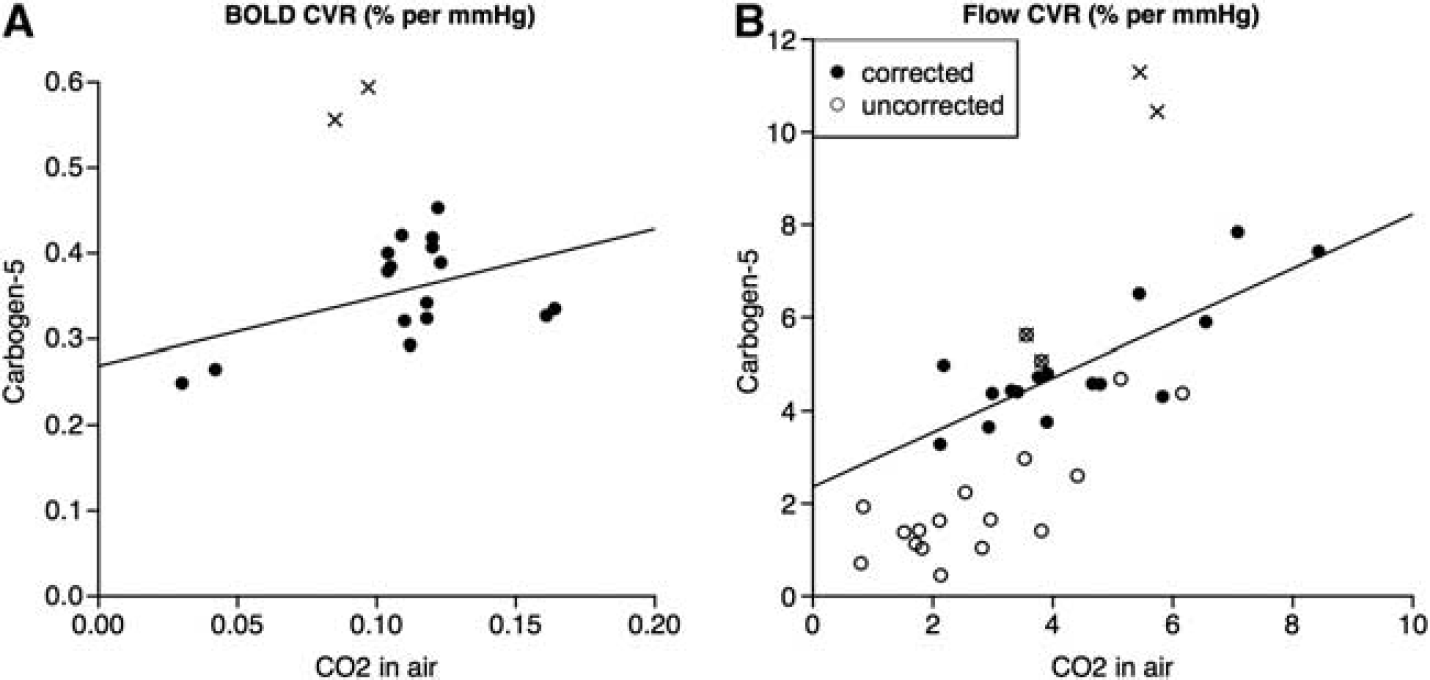
Comparison of CVR values during stimuli of carbon dioxide (CO2) in air versus carbogen-5, as calculated by (
DISCUSSION
The key findings of this experiment are that (1) the correlation observed between flow and BOLD CVR to a CO2 in air gas mixture breaks down during carbogen breathing and (2) intrasubject flow CVR as measured by ASL is affected by the partial pressure of oxygen dissolved in the blood (PO2) and is not consistent between the two gas stimuli.
Mean flow CVR to CO2 in air in our study was 4.46±1.80%. Some values obtained from gray matter in previous studies are 3.09 ±2.41% (25 subjects, 50 hemispheres), 11 3.35 ±1.63% (10 subjects), 32 and 4.5 ±1.3% (8 subjects), 33 all of which were performed under comparable conditions.
Values of BOLD CVR are more difficult to compare as the absolute BOLD signal recorded is strongly dependent on several parameters, including field strength of the scanner and TE; in our study, we recorded 0.11 ±0.03% with TE −35 ms under similar conditions to 0.21 ±0.12% (25 subjects, 50 hemispheres), 11 0.87 ±0.29% (11 subjects), 32 and 0.31 ±0.08% (9 subjects), 23 all of which used 3-T scanners and TE −30 ms.
Figure 4 shows that for the CO2 in air gas mixture, there is some correlation between CVR as measured by BOLD and ASL. This is in agreement with the findings of Mandell
There are very good theoretical reasons why BOLD signal response to carbogen inhalation should not be used to try to measure CVR. Cerebrovascular reactivity is a physiologic response to an increase in PCO2, and when using BOLD imaging during CO2 exposure, the principal factor influencing the BOLD signal change is the concentration of deoxyhemoglobin in the blood due to an increase in CBF, giving an indirect measure of CVR. However during carbogen inhalation, PaO2 also increases significantly, causing the BOLD signal to increase from its baseline value due to (1) increased CBF due to higher PaCO2 and (2) an increase in the arterial oxygen concentration PaO2, both of which lead to higher venous oxygen saturation via independent mechanisms, as previously discussed by Prisman
Arterial Spin Labeling and Carbogen
The remaining question is whether ASL can be used to reliably measure CVR to CO2 during carbogen inhalation. From Figure 5B, there does not appear to be a simple 1:1 relationship between flow CVR to CO2 in air and flow CVR to carbogen, although with
Naïvely, as the CO2 content of both gas stimuli was the same at 5%, one might assume that both gas mixtures would cause an equal increase in CBF due to CO2, and that the additional oxygen in carbogen would act as a vasoconstrictor. Thus, one might expect flow CVR to carbogen to be consistently lower than that to CO2 in air. Figure 5B shows that for our data this is not the case; in fact, average flow CVR to carbogen (4.97 ± 1.30%) is slightly higher than that to CO2 in air (4.46 ± 1.80%). This emphasizes the complex nature of the interaction between the Bohr and Haldane effects and the pitfalls of treating oxygen and CO2 content of gas mixtures as separate properties that can be considered in isolation.
Potential Concerns and Future Work
A potential confound of using carbogen gas in any study is that the interplay between the Bohr and Haldane effects is likely to influence the arterial-alveolar diffusion gradient in the lungs and thus affect the process of gas exchange. In this situation, recorded end-tidal partial pressure values may no longer be accurate indicators of PO2 and PCO2 of arterial blood (as has been assumed). Furthermore, arterial partial pressures will have a different relationship to partial pressures in the tissues, the latter being the actual variables of interest.
In this study, we estimated a value of the calibration constant
We have used the Buxton model
29
to correct for the changes in
In conclusion, BOLD imaging should not be used in conjunction with a carbogen stimulus to measure CVR because the high oxygen content of carbogen makes it impossible to identify what proportion of the ensuing increase in BOLD signal is due to increased blood flow (as opposed to simply an increase in venous oxygen saturation). The complex and unknown interactions between the individually well-documented Bohr and Haldane effects become significant during carbogen inhalation, with the result that PetCO2 may no longer be a good proxy for tissue Pco2. In addition, hyperoxia reduces the T1 of blood so an additional correction must be applied to obtain CBF values from ASL data. We have found that intrasubject flow CVR as measured by ASL is affected by PO2 and is not consistent between CO2 in air and carbogen. Although the possibility remains that this inconsistency could be a result of imperfect estimation of tissue pressure of CO2 and CBF under a combined hyperoxia and hypercapnia regime, particular care should be taken when comparing flow CVR values obtained from stimuli containing different fractions of oxygen.
DISCLOSURE/CONFLICT OF INTEREST
The authors declare no conflict of interest.
Footnotes
ACKNOWLEDGEMENTS
The authors are grateful to the EPSRC and the MRC for funding this research.