
Abstract
A general mathematical model for the delivery of O2 to the brain is presented, based on the assumptions that all of the brain capillaries are perfused at rest and that all of the oxygen extracted from the capillaries is metabolized. The model predicts that disproportionately large changes in blood flow are required in order to support small changes in the O2 metabolic rate. Interpreted in terms of this model, previous positron emission tomography (PET) studies of the human brain during neural stimulation demonstrating that cerebral blood flow (CBF) increases much more than the oxygen metabolic rate are consistent with tight coupling of flow and oxidative metabolism. The model provides a basis for the quantitative interpretation of functional magnetic resonance imaging (fMRI) studies in terms of changes in local CBF.
Blood flow to the brain has been thought to be tightly coupled to the metabolic requirements of the tissue for glucose and oxygen (Siesjo, 1978). However, Fox and coworkers challenged this view for flow changes during neural stimulation (Fox and Raichle, 1986; Fox et al., 1988). In positron emission tomography (PET) studies of somatosensory and visual stimulation in humans, they found focal increases in cerebral blood flow (CBF) and cerebral glucose metabolic rate (CMRglc) of 30–50% while the oxygen metabolic rate (CMRO2) increased by only about 5%. Because of this imbalance, less oxygen is removed from the blood (the net O2 extraction fraction, OEF, decreases). Other PET studies have shown the same phenomenon, with CBF changes of 30% during somatosensory stimulation but smaller increases in CMRO2 of 13% (Seitz and Roland, 1992) and no change (Kuwabara et al., 1992). This disproportionate change in CBF compared to CMRO2 was interpreted as an uncoupling of flow and oxidative metabolism (i.e., during neural stimulation the blood flow increases to serve a need other than oxidative metabolism) (Fox and Raichle, 1986; Fox et al., 1988).
The reduction of OEF is critical for the interpretation of recent work showing a small increase in the magnetic resonance (MR) signal in the brain during neural stimulation (Kwong et al., 1992; Frahm et al., 1992, 1993; Ogawa et al., 1992; Bandettini et al., 1992; Turner et al., 1993). The origin of this signal change is thought to be related to the fact that deoxyhemoglobin is paramagnetic, so that changes in the local deoxyhemoglobin concentration alter the magnetic susceptibility of the blood. A difference in susceptibility between blood and the surrounding extravascular space leads to microscopic magnetic field gradients in the vicinity of the blood vessels, which in turn lead to a small loss in signal in MR images acquired with pulse sequences sensitive to field variations. Typical pulse sequences used are gradient recalled echoes with long echo times (30–50 ms) in order to increase the sensitivity to changes in T2*, the effective transverse relaxation rate. If the net extraction of O2 decreases, so that the local deoxyhemoglobin concentration also decreases, then the MR signal will increase.
Functional MRI (fMRI) is a potentially powerful tool for noninvasively investigating the working brain with higher spatial resolution than existing PET methods. Studies using several forms of sensory, motor, or cognitive activation have demonstrated focal signal increases in brain structures associated with these tasks (Kwong et al., 1992; Frahm et al., 1992, 1993; Ogawa et al., 1992; Turner et al., 1993; Constable et al., 1993; Connelly et al., 1993; Menon et al., 1993; Schneider et al., 1993; Engel et al., 1994). However, the quantitative relation between the observed MR effect and changes in local physiological variables (CBF, CMRO2, etc.) is incompletely understood. In particular, because the MR signal change depends on the relative changes in CBF and CMRO2, any quantitative interpretation of fMRI data requires, first, a theory of the physiological relationship between CBF and CMRO2 changes during neural stimulation.
In this paper we reconsider the question of the uncoupling of CBF and CMRO2 and argue that the observed large imbalance of flow and O2 metabolism changes may, in fact, reflect a tight coupling in the presence of a limitation of O2 availability. [A preliminary version of this argument was presented previously in abstract form (Buxton and Frank, 1993)]. This hypothesis is motivated by two lines of thought. First, there is accumulating evidence that CBF increases are accomplished primarily by increased flow velocity rather than by capillary recruitment (Klein et al., 1986; Gobel et al., 1989, 1990; Vetterlein et al., 1990; Bereczki et al., 1993; Wei et al., 1993). Second, direct measurements of the kinetics of the uptake of O2 in the brain (Kassissia et al., 1995), and the low measured O2 concentration found in brain tissue (Metzger and Heuber, 1977; Fennema et al., 1989; Lubbers et al., 1994) suggest that the rate of return of unmetabolized O2 from the tissue to the capillary is small. The interpretations of PET studies of O2 metabolism are, in fact, based on the assumption that O2 metabolism is perfectly efficient, so that all of the O2 that is made available to the tissue (i.e., leaves the capillary) is metabolized (Mintun et al., 1984; Ohta et al., 1992).
Specifically, we argue that with the two assumptions that: (a) there is no capillary recruitment, and (b) oxygen metabolism is efficient, then the O2 extraction fraction must decrease as flow increases and therefore a relatively large change in flow is required to support a small increase in O2 metabolism. In the Theory section below we formalize this idea by modeling the O2 transport process in order to define the quantitative relationship between flow and O2 extraction. We have found by numerical calculations that a relatively simple model for O2 extraction is accurate for a wide range of transport conditions. The model demonstrates disproportionate flow changes if flow is tightly coupled to O2 metabolism and suggests a reinterpretation of the PET data. The model also provides a quantitative relationship between the change in OEF and the change in CBF and can thus provide a basis for the quantitative interpretation of fMRI signal changes in terms of changes in CBF.
THEORY
The delivery of O2 to the brain is a complicated dynamic process that involves several physiological parameters related to blood flow, oxygen transport, and characteristics of the capillary bed. The basic parameters needed to model this process are described in the first section below. In the second section we derive a simple model that relates the oxygen extraction to the flow, and in the third section we show that this model is likely to be accurate for a wide range of transport conditions. In the fourth section the model is used to calculate how much the blood flow must increase in order to increase oxygen metabolism. In the final section the model is applied to the interpretation of fMRI data.
Basic parameters and relationships governing O2 transport
The following parameters define the local delivery, transport out of the capillary, and metabolism of O2:
f = the local perfusion rate (CBF). The normal units of CBF are (milliliters of blood per 100 g of tissue per minute), but it is convenient to express f in units of milliliters per milliliter per minute;
En = net O2 extraction fraction (OEF);
E(f) = the unidirectional extraction fraction of O2. E is distinct from En: E is the fraction of O2 molecules that cross the capillary wall and thus become available for tissue metabolism, while En is the fraction that is extracted and metabolized. E is in general a nonlinear function of the flow f;
K1 = E(f)f, the rate parameter which governs delivery of O2 to tissue and thus sets the maximum possible oxidative metabolic rate;
ε = En/E, the efficiency of O2 metabolism (i.e., the fraction of extracted O2 molecules which are metabolized);
Ca = total arterial O2 concentration;
Cp = capillary plasma O2 concentration;
CT = total capillary O2 concentration;
h(t) = the distribution of capillary transit times t; and
CBV = the cerebral blood volume, which consists of an arterial component (Va), a capillary component (Vc), and a venous component (Vv).
The local O2 metabolic rate can be written in a general way as:

In order to increase local metabolism either the rate parameter K1 governing delivery of O2 to the tissue must be increased or the fraction of extracted O2 that is metabolized (ε) must be increased. Based on the low O2 concentration found in brain tissue (Metzger et al., 1977; Fennema et al., 1989; Lubbers et al., 1994), it is usually assumed that ε = 1 in PET models of O2 metabolism (Mintun et al., 1984; Ohta et al., 1992). Recently Kassissia et al., (1995) provided direct evidence supporting this assumption in canine studies. Using the multiple indicator dilution technique, they found that a large fraction of labeled O2 never leaves the capillary, and that the fraction of extracted O2 that returns to the vasculature is very small. In the following, we assume that ε is near one and cannot be increased, so that En ≅ E. Then K1 must be increased in order to increase CMRO2, and the degree to which K1 can be increased by increasing / hinges on the flow dependence of E. The extraction fraction primarily depends on the capillary transit time t, and by the central volume principle (Stewart, 1894; Meier and Zierler, 1954; Zierler, 1962) the mean capillary transit time τ is related to the flow by:

The delivery of a substrate to the tissue is characterized by its unidirectional extraction fraction E at rest. For E = 1, the rate of delivery is limited by flow and so should increase approximately in proportion to flow. At the other extreme, E ≪ 1, delivery is limited by transport out of the capillary and cannot be increased by increasing flow (Gjedde, 1991). In humans at rest, however, the local extraction of O2 is 30–55% (Marchal et al., 1992), so neither of these extreme cases applies. In order to define the quantitative relationship between the cerebral blood flow f and the oxygen extraction fraction E, it is thus necessary to model the flow dependence of E based on a microscopic description of the transport process.
A simple model for E(f)
Our model for E(f) is based on the following assumptions:
At rest, all or nearly all of the brain capillaries are perfused, so that increases in f are primarily due to increased flow velocity rather than capillary recruitment. In this model the observed changes in total CBV (Grubb et al., 1974) are attributed to changes in the larger venous volume Vv in response to changes in f.
Oxygen metabolism in the brain is highly efficient, so that essentially all of the O2 molecules that leave the capillary, and are thus made available for metabolism, are in fact metabolized (ε = 1) (Kassissia et al., 1995).
Exchange of O2 between the pool of dissolved O2 in plasma and O2 bound to hemoglobin in the erythrocytes is very rapid (Groebe and Thews, 1992), so that the ratio of the concentrations of these two pools is always described by the equilibrium oxyhemoglobin saturation curve.
Each O2 molecule in plasma has a probability per unit time k of being extracted. The description of the transport by a probability per unit time could apply to a number of transport mechanisms. For example, if the blood is well mixed as it moves down the capillary and the permeability P of the capillary wall is the major limitation to transport, k would be proportional to P/a, where a is the capillary radius.
With these assumptions, an element of blood moving down a capillary loses O2 by extraction at a rate proportional to the plasma O2 concentration Cp(t). The total capillary O2 concentration CT(t) is then given by the solution of:
with CT(0) = Ca. The extraction fraction for a transit time t is Et(t) = [CT(0) – CT(t)]/CT(0), and the extraction fraction is then an average over the transit time distribution h(t):
Equations 2–4 lead to an analytic expression for E(f) for the simple case when: (a) the ratio r = Cp/CT is constant, so that Eq. 3 implies a simple exponential decay, and (b) all capillaries have the same transit time. For this simple case, E = 1 – e–rkt, which is mathematically identical to the well known model of Crone (1963). Solving for k in terms of resting values E0 and f0 leads to Eq. 5:
(Because we have assumed that there is no capillary recruitment, the capillary volume is constant.) Thus, even for this simple model the extraction fraction is a nonlinear function of the fractional flow change f/f0.
Numerical tests of the accuracy of the simple model
When E(f) is expressed in the simple form of Eq. 5, the only additional parameters are the resting flow, f0, and extraction, E0. However, this equation was derived with several restrictive assumptions. Because of the nonlinear shape of the oxyhemoglobin dissociation curve, r is not a constant and depends on other parameters such as the blood pH. In addition, there is likely to be a range of capillary transit times, due either to intrinsic capillary heterogeneity or to the large volume averages associated with imaging measurements. In order to test whether Eq. 5 is an accurate approximation for these more realistic models, Eqs. 3 and 4 were solved numerically based on the pH-dependent oxyhemoglobin saturation curve and several forms of h(t).
Dependence of E(f) on oxyhemoglobin dissociation curve.
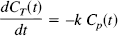
The effects of the nonlinear oxyhemoglobin saturation curve were calculated by integrating Eq. 3 using an algorithm that includes the curve-shifting effect of pH (Buerk and Bridges, 1986) to relate CT and Cp. Models were calculated for pH 7.4 and 7.2. Although Cp/CT does not remain constant as CT varies (inset graph of Fig. 1), the resulting curves of E(f) which pass through the resting value E0 = 40% are very similar to the simple model of Eq. 5.
The oxygen extraction fraction (OEF) as a function of cerebral blood flow (CBF): effect of the oxyhemoglobin saturation curve. The accuracy of the simple model given by Eq. 5 was tested against a numerical solution of Eq. 3, which takes into account the nonlinear oxyhemoglobin saturation curve. Based on the algorithm of Buerk and Bridges (1986), the ratio of the capillary plasma O2 concentration, Cp, to the total capillary blood O2 concentration, Ct, was calculated for pH 7.4 and 7.2 (inset graph). When the resulting curves are anchored to the same resting extraction fraction (40% in this example), the curves are nearly identical.
When the curves are anchored in this way to normal resting values, the details of the transport apparently have little effect on the shape of the curve E(f), and Eq. 5 is an accurate approximation even for 50% flow increases. The fact that the shape of E(f) is relatively independent of the details of the transport does not mean that effects such as the pH-dependent shift of the oxyhemoglobin curve are ineffective in promoting O2 transport. The curves that pass through a particular point (E0, f0) correspond to different values of k for the different assumptions used for the capillary pH changes. The pH shift allows a given extraction to be achieved with a smaller value of k. For this reason, estimates of k from experimental measurements of E and f must be based on a detailed model of the transport.
Dependence of E(f) on distribution of capillary transit times.
In order to test the importance of the distribution of transit times, the curves of E(f) shown in Fig. 2 were calculated for three radically different forms of h(t) (inset graph of Fig. 2) based on a gamma distribution h(t) = β–αe–t/βtα–1/Γ(α) with different choices of the parameters α and β. The parameter α adjusts the shape of the distribution, while β sets the time scale. For these calculations we assumed that the shape remained the same as flow increased (constant α) but the mean transit time (τ = αβ) decreased according to Eq. 2. The parameter α was chosen to approximate: (a) a Gaussian distribution (α = 20); (b) a Weibull distribution (α = 3), which has been suggested for capillary beds based on experimental and theoretical grounds (Pawlik et al., 1981); and (c) an exponential distribution (α = 1), which is unlikely physiologically but serves as a useful test of the sensitivity of Eq. 5 to h(t). There is very little difference among the curves for flow increases up to 100%, and only the exponential distribution shows any significant deviation from the simple model when flow decreases. (An exponential form corresponds to modeling the capillary blood as a single well-mixed compartment in exchange with the tissue).
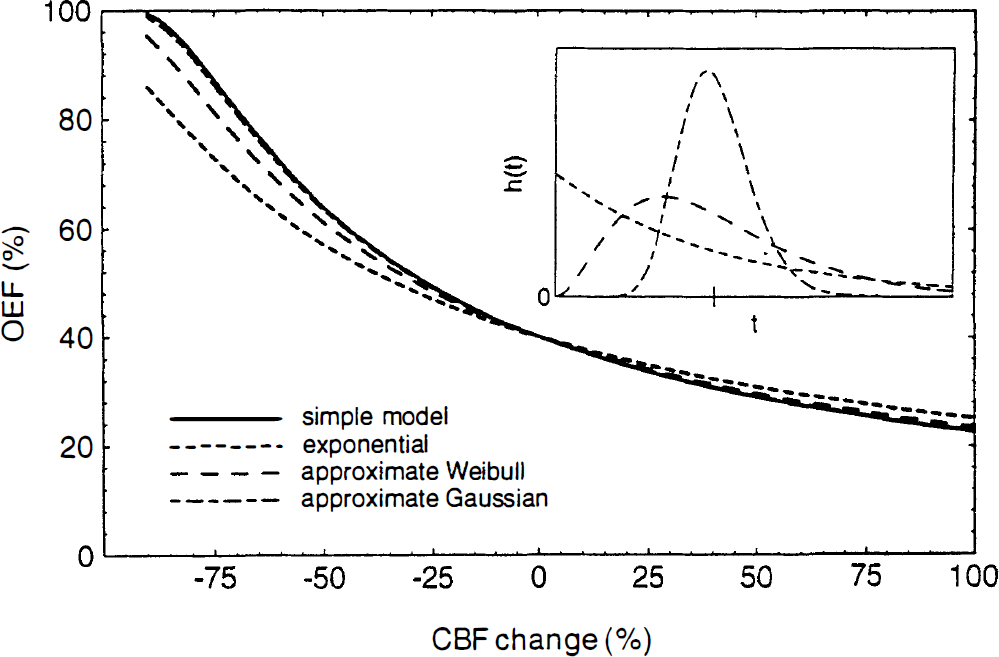
The oxygen extraction fraction (OEF) as a function of cerebral blood flow (CBF): effect of the capillary transit time distribution. Curves were calculated from Eq. 4 for several forms of the capillary transit time distribution h(t) (inset graph). The analytic form of h(t) was a gamma distribution with parameters chosen to approximate exponential, Weibull, and Gaussian distributions. The mean transit time is the same for each distribution (indicated by the tick mark on the inset graph). When anchored to a resting extraction of 40%, the only curve that substantially differs from Eq. 5 is the exponential distribution.
Required change in CBF necessary to increase CMRO2
The numerical calculations above indicate that Eq. 5, even though it was initially derived for a very simple transport model, is likely to be accurate for a wide range of transport conditions and capillary bed geometries. Based on this equation, the fractional increase in f required to produce a given fractional increase in K1 (= Ef) was calculated (Fig. 3). Disproportionately large increases in flow are required to produce a small increase in CMRO2, but the magnitude of the CBF increase depends strongly on the resting oxygen extraction fraction. The flow change required for a 5% increase in CMRO2 ranges from 19% to 40% as the resting OEF varies from 50% to 30%. The PET data of Fox and Raichle (1986) is in good agreement with the calculated curves for a fully perfused capillary bed at rest with a resting extraction fraction of 40%.
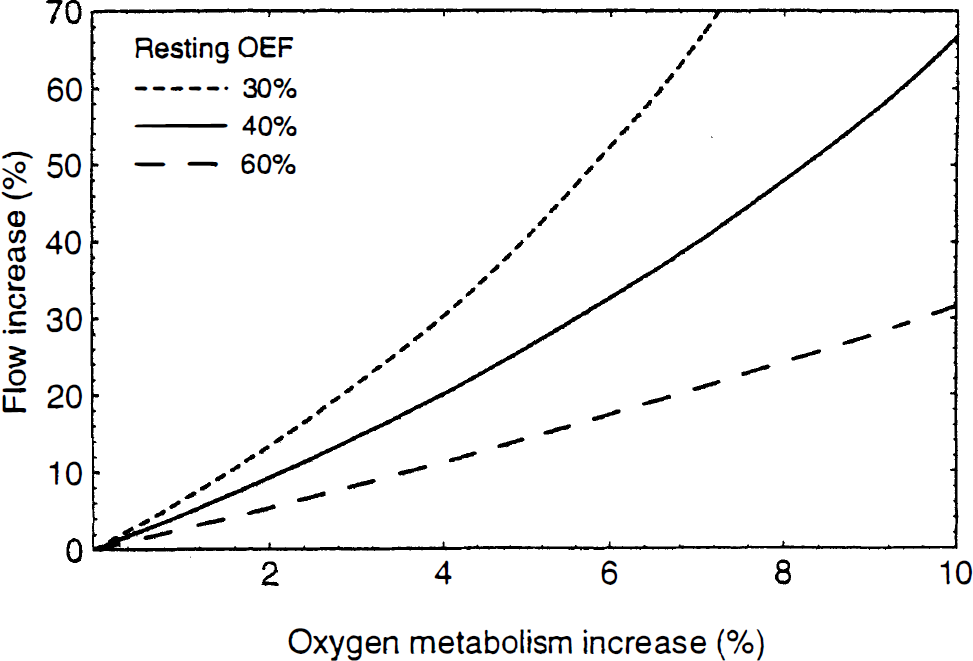
Fractional change in cerebral blood flow required to produce a given fractional change in the rate of delivery of O2 to the tissue, calculated from Eq. 5 for three values of the resting oxygen extraction fraction. Tight coupling of flow and metabolism requires a large change in flow in order to produce a much smaller change in oxygen metabolism, but the exact relationship depends strongly on the resting OEF.
The above argument is based on a dynamic view of oxygen delivery: the amount of O2 delivered to the tissue is the result of a competition between diffusion transporting O2 across the capillary wall and flow carrying O2 out the venous end of the capillary. Oxygen delivery is then naturally described in terms of the extraction fraction, but we can also consider a more static viewpoint that further clarifies the need for an imbalance in flow and metabolism changes. When flow and metabolism are in a steady state, the capillary O2 concentration will be constant in time but will decrease along the length of the capillary. Neglecting the effects of hemoglobin binding, we then expect the local O2 flux out of the capillary to be proportional to the local capillary concentration, and the total flux will be proportional to the average capillary concentration Cavg. Again we assume that all of the extracted O2 is metabolized, so there is no back-flux of O2 and there is no reserve pool of O2 in the tissue that can be mobilized to increase O2 metabolism. Then in order to increase O2 delivery, the mean capillary concentration must be increased by a corresponding amount.
Based on the simple model for O2 extraction developed above, we can calculate the increase in the average capillary O2 concentration as flow increases. In this model the capillary concentration decreases exponentially from Ca at the capillary entrance to ECa at the venous end of the capillary. The average concentration can then be written as:
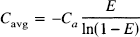
When the expression of E(f) given in Eq. 5 is substituted in the denominator of Eq. 6, the fractional increase in Cavg is.
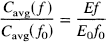
Thus, following a large change in flow, the small fractional increase in the delivery of O2 to the tissue is exactly equal to the fractional increase in the mean capillary concentration.
Relation of fMRI signal changes to changes in CBF and CMRO2
In fMRI studies the change in signal is thought to be primarily due to susceptibility changes following changes in the local deoxyhemoglobin concentration [although flow effects may also be important at lower magnetic fields (Frahm et al., 1993)]. In order to apply the current model for the coupling between CBF and CMRO2 changes (Eq. 5) to the interpretation of fMRI data, we can develop a simple model for the relationship between MR signal changes and CBF changes. We assume that the MR signal changes occur in the extravascular space and are primarily due to magnetic susceptibility changes in the venous vessels. This assumption neglects signal changes in the blood itself, which may be an important contribution at lower magnetic fields (Boxerman et al., 1994). The venous vessels are likely to have the strongest effect on gradient recalled echo fMRI because they account for a large part of the blood volume fraction and suffer the largest changes in O2 concentration. Furthermore, the calculations are simplified because the effects of diffusion are not as important for the veins as for the capillaries.
Ogawa et al. (1993) studied numerically the MR signal loss produced in the surrounding medium by a collection of randomly oriented magnetic cylinders (representing blood vessels). Following their work, we can characterize the magnitude of the magnetic field perturbations by the maximum resonant frequency offset v (in Hertz) at the surface of a long cylinder oriented perpendicular to the main magnetic field. The magnetic field is B0 (Tesla) and the magnetic susceptibility difference between fully oxygenated blood and fully deoxygenated blood is Δχ (parts per million). The susceptibility of fully oxygenated blood is assumed to be the same as the extravascular tissue water. Then, the frequency offset for fully deoxygenated blood is vmax (Hz) = 267.5 B0 Δχ. The susceptibility of blood varies linearly with blood oxygenation (Weisskoff et al., 1992), so for venous blood the frequency offset is proportional to the local net oxygen extraction fraction: v = vmax En.
The MR signal S is assumed to be of the form S = S0exp[–R2* TE], where R2* is the transverse relaxation rate for a gradient recalled echo image, and TE is the echo time. Then for small signal changes, the fractional signal change δS between the signal in an activated state (Sa) and a resting state (Sr) is:
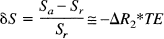
where ΔR2* is the change in R2* produced by the change in blood oxygenation. Based on their numerical Monte Carlo simulations for different values of v and V, the blood volume fraction, Ogawa et al. (1993) found that the transverse relaxation rate is well described for larger (noncapillary) vessels by the equation: R2* = 4.3 v V, where R2* and v are in units of inverse seconds. The MR signal change is then:
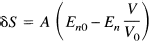
where En and En0 are the activated and resting net extraction fractions, respectively, V and V0 are the activated and resting blood volumes, and A = 4.3 vmax TE V0.
During brain activation both En and V change with increasing flow, but in a counteracting way as far as the MR signal change is concerned: the blood volume increases while En decreases. Thus, in order to estimate MR signal changes, we must also model the blood volume dependence on flow. Grubb et al. (1974) found that their data could be well described by a nonlinear relationship which can be written in the form:

and from their data γ = 0.38. In the following calculations we assume this dependence of the volume on flow.
We can now consider two basic models for the relationship of the oxygen extraction fraction to the flow: (a) Tight coupling of O2 metabolism and flow with limited delivery of O2; then En = E, and E(f) is given by Eq. 5. (b) Uncoupled O2 metabolism and flow, with no increase in O2 metabolism during activation; then during activation E n = En0f0/f. The second model has been assumed in previous analyses of the fMRI signal change [e.g., Ogawa et al. (1993); Boxerman et al. (1994)]. Figures 4 and 5 show how δS depends on flow and the resting oxygen extraction fraction for the two models. For these calculations we assumed B0 = 4 T, Δχ = 0.1 ppm, TE = 40 ms, and V0 = 0.03. For the coupled model proposed in this paper, the MR signal change varies approximately linearly with the flow change and is relatively independent of the resting oxygen extraction fraction in the range 30–60%. This is illustrated in Fig. 5 by plotting the fMRI signal dependence on resting OEF for a fixed 30% increase in flow. For low extractions, there is very little increase in oxygen metabolism with the coupled model, so the curve is similar to the uncoupled model. For larger extractions the two curves diverge, with the coupled model reaching a peak around 50% and then decreasing. For large extractions the oxygen metabolism change is comparable in magnitude to the flow change, so the deoxyhemoglobin concentration is relatively constant and there is less of an fMRI effect. Note that at the extreme high extraction values, the coupled curve becomes negative, indicating that the volume change (γ = 0.38 in this example) becomes the dominant effect. In contrast to this behavior, the assumption of no oxygen metabolism change leads to a slightly more nonlinear dependence on flow and a much stronger linear dependence on the resting OEF.
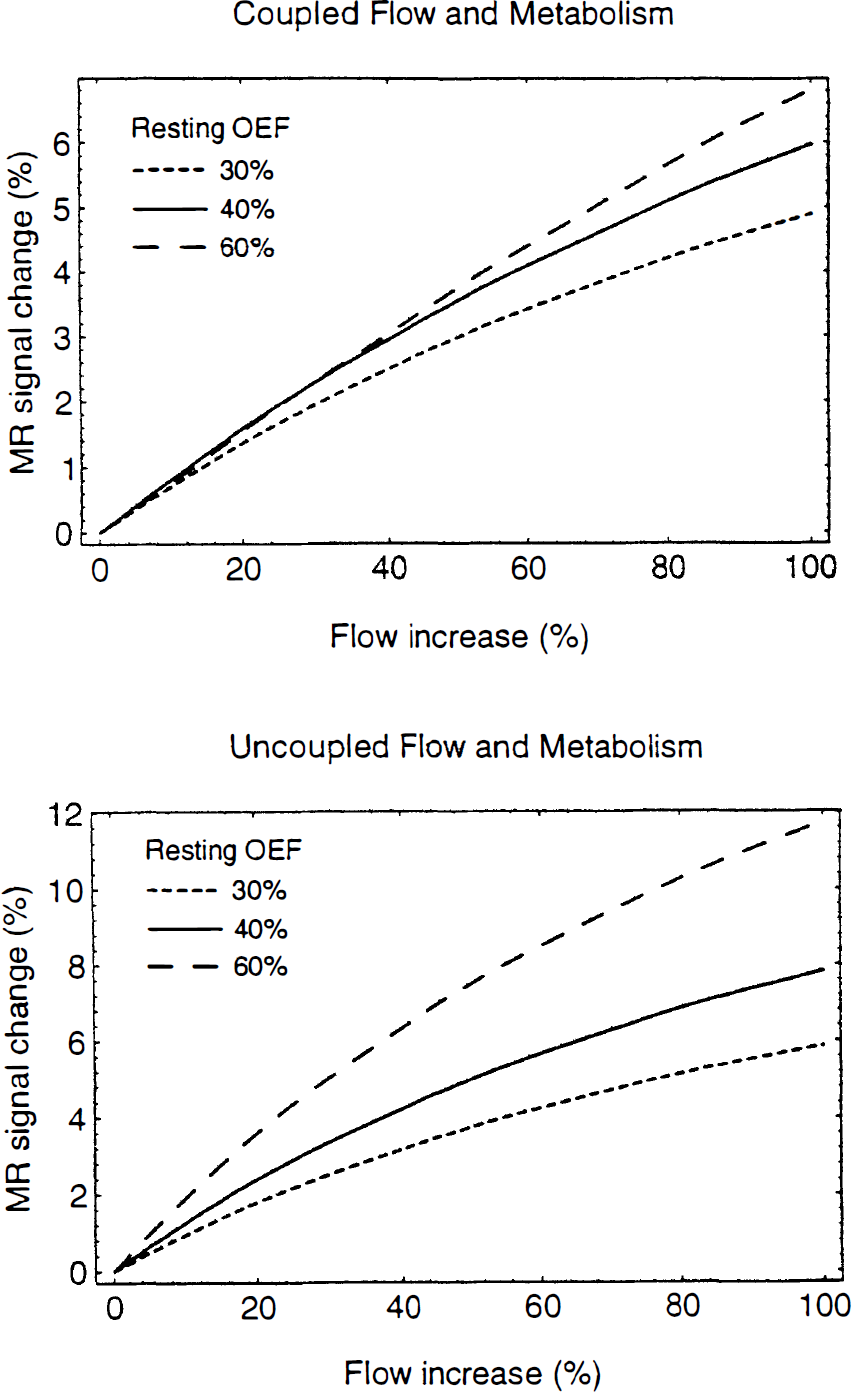
Theoretical curves for the fMRI signal change as a function of the change in flow for two models for the change in oxygen metabolism. Parameters used in the calculations were B0 = 4 T, Δχ = 0.1 ppm, TE = 40 msec, and V0 = 0.03, and separate curves correspond to resting OEF of 30, 40, and 60%. Top: Coupled flow and metabolism according to Eq. 5. Bottom: Uncoupled flow and metabolism, with no change in oxygen metabolic rate.
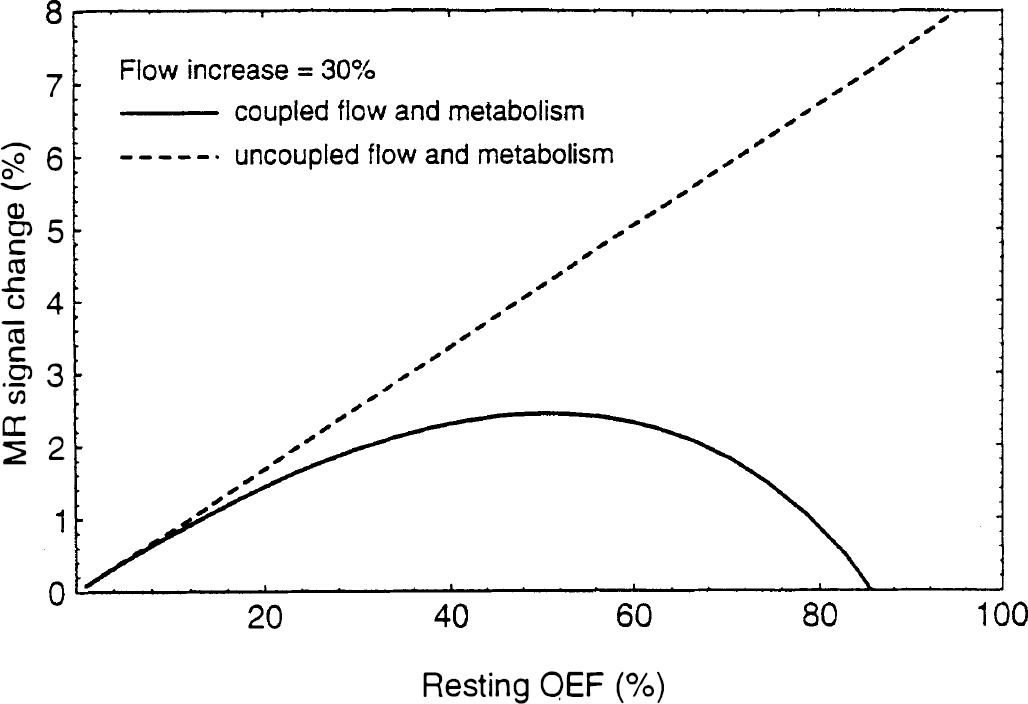
Theoretical curves for the fMRI signal change as a function of the resting OEF for a fixed change in CBF (30%) for the same parameters as in Fig. 4. If flow and oxygen metabolism are uncoupled (no change in oxygen metabolism as flow increases), the fMRI signal change depends strongly on the resting OEF. However, if flow and metabolism are tightly coupled according to Eq. 5, the fMRI signal change is relatively independent of resting OEF in the range 30–60%.
DISCUSSION
In this paper we have examined the quantitative implications of two common assumptions for which there is experimental support: (a) That all of the brain capillaries are perfused at rest, and (b) That essentially all of the O2 molecules that leave the capillary are metabolized. The key implication of the first assumption is that an increase in CBF must require an increase in capillary blood velocity and a resulting decrease in capillary transit time. The key implication of the second assumption is that the observed net extraction fractions of 30–50% are in fact unidirectional extraction fractions, and that O2 metabolism is thus limited by the rate of transport of O2 out of the capillary. Taken together, these assumptions imply that the rate of delivery of O2 to tissue (Ef) will increase much more slowly than the increase in flow because E decreases with increasing f. Interpreted in terms of this model, the disproportionately large changes in CBF compared with CMRO2 found during neural stimulation are consistent with tight coupling of flow and O2 metabolism, contrary to the earlier interpretation of this imbalance as uncoupling (Fox and Raichle, 1986; Fox et al., 1988). That is, by this model, flow increases by a large amount in order to provide a small increase in the rate of delivery of O2 to the tissue and thus increase oxidative metabolism of glucose.
The assumption of a limitation on the unidirectional O2 extraction in the brain is supported by the recent work of Kassissia et al. (1995). They concluded that oxygen distribution is “functionally barrier limited” in the canine brain, based on indicator dilution studies demonstrating that a large fraction of labeled O2 passes through the brain without being extracted and that very little of the extracted O2 returns to the blood. This barrier-limited behavior is not due to a permeability limitation of the blood–brain barrier nor to a limitation of the rate of unbinding of O2 from hemoglobin to plasma, which is quite rapid (Groebe and Thews, 1992). Instead it follows directly as a consequence of the large effective volume of distribution of O2 in blood due to hemoglobin binding. That is, the O2 must diffuse out of the capillary as dissolved gas in plasma, and the net flux will be proportional to the plasma concentration. However, because nearly all of the O2 carried by blood is bound to hemoglobin, the plasma concentration, and thus the effective transport rate of O2, is much reduced from what it would be if all of the O2 was dissolved in plasma.
In order to increase the local blood flow, either the capillary volume must increase (capillary recruitment), or the transit time must decrease, or both (Eq. 2). The question of whether capillary recruitment occurs in the brain during neural stimulation is an unresolved and controversial issue, with different experimental techniques producing contradictory results (Gobel et al., 1990). Some studies have found evidence for substantial variations in the fraction of the capillaries that are perfused in different physiological states (Weiss, 1988; Shockley and LaManna, 1988; Anwar et al., 1990; LaManna and McCracken, 1990; Sinha et al., 1991; Frankel et al., 1992), but a number of studies have suggested that capillary recruitment is a small effect (Pawlik et al., 1981) if it occurs at all (Klein et al., 1986; Gobel et al., 1989, 1990; Vetterlein et al., 1990; Bereczki et al., 1993; Wei et al., 1993). Our assumption that capillary recruitment is a minor effect is thus a working hypothesis until this issue is resolved.
The observed large increase in glucose metabolic rate (comparable to the flow increase) during neural stimulation could be viewed as an indication of capillary recruitment. Because the unidirectional extraction fraction of glucose at rest is normally less than 30% (Oldendorf, 1971), an increase in flow with a fixed capillary volume should not significantly increase the rate of delivery of glucose to the tissue. That is, the limitations on increasing glucose delivery are even more severe than those on oxygen delivery. Thus, if there is no capillary recruitment, the observed large increase in glucose metabolism during neural stimulation cannot be accomplished by a comparable flow increase. However, unlike O2, less than half of the extracted glucose is metabolized (ε < 0.5) (Gjedde, 1987), so in principle CMRglc can be increased substantially during neural stimulation independently of flow changes by increasing the ε for glucose. A possible mechanism for increasing ε is stimulation of phosphofructokinase by changes in the cellular levels of ATP and ADP due to increased neural activity (Siesjo, 1978). Thus, the observed substantial increase in glucose metabolism does not require capillary recruitment.
Because the change in CMRglc is much larger than the change in CMRO2, most of the increased glucose consumption is presumably by anerobic glycolysis (Fox and Raichle, 1986; Fox et al., 1988), and the measurement of increased lactate levels during neural stimulation supports this view (Prichard et al., 1991; Sappey-Marinier et al., 1992; Lear et al., 1993). Nevertheless, the bulk of the increase in energy production (i.e., production of ATP) is likely due to oxidative metabolism even for a large imbalance of CMRglc and CMRO2 because the ATP yield per glucose molecule of oxidative metabolism is normally about 16 times that of anerobic glycolysis (Siesjo, 1978). Thus, for example, if CMRglc increases by 30% and CMRO2 increases by 5%, the production of ATP increases by about 6.6%, but 75% of this change is due to the increased oxidative metabolism.
Functional MRI studies of brain activation have demonstrated that the MR signal is sensitive to the physiological changes that occur during neural activation. These methods are currently in wide use for mapping brain activation, but a quantitative interpretation of these signal changes in terms of physiological changes is still lacking. This is due in part to the complexity of the physical processes (e.g., susceptibility effects, diffusion, flow effects) that contribute to the MR signal. Nevertheless, the quantitation problem also depends on basic physiological questions: Why is the flow increase during brain activation so large? How much does oxygen metabolism increase? In previous theoretical models for the fMRI signal change, it was assumed that oxygen metabolism is uncoupled from flow and does not change during stimulation (Ogawa et al., 1993; Boxerman et al., 1994).
The curves of MR signal change as a function of flow were compared for the model of uncoupled flow and metabolism and for the model proposed here for the coupling between flow and oxygen metabolism. When combined with experimental data on blood volume changes with increasing flow (Grubb et al., 1974) and numerical studies of the dependence of the MR signal on blood oxygenation and blood volume (Ogawa et al., 1993), the two models lead to somewhat different predictions. If flow and metabolism are uncoupled, the curves are slightly nonlinear and depend strongly on the resting oxygen extraction fraction. With coupled flow and metabolism, the curves are nearly linear and relatively independent of the resting OEF, but the expected signal change for the same change in flow is less than for the uncoupled model. These results suggest that if flow and metabolism are uncoupled, the quantitative interpretation of fMRI signal changes may be compromised by variability in the resting OEF within the brain and across subjects. On the other hand, if flow and metabolism are strongly coupled, as proposed here, the fMRI signal changes should provide a robust quantitative measure of the flow change.
Our central hypothesis is that if delivery of oxygen to the brain is effectively barrier-limited at rest, and if increased flow necessarily shortens the capillary transit time, then a large flow increase is required to accomplish a small increase in oxygen delivery. This requirement is a constraint on the physiological system set by the nature of oxygen delivery and does not depend on the particular mechanism by which the coupling between flow and oxygen metabolism is accomplished (i.e., the specific chemical agents involved in producing vasodilation). However, the tight coupling we hypothesize during neural stimulation may not hold in other physiological states. Blood flow serves many purposes, including heat regulation and clearance of metabolic waste products, such as carbon dioxide and lactate, and in other physiological states these demands may have a more decisive influence on flow regulation. Our hypothesis is that during neural stimulation the dominant influence on blood flow regulation is the required increase in the rate of delivery of oxygen.
The proposed model for the relationship between CBF and CMRO2 changes during neural stimulation provides a consistent framework for understanding O2 metabolism in the brain. Although relatively simple in structure, the theory reveals a plausible mechanism by which the experimentally observed imbalance in flow and metabolism changes can be produced by a physiological model in which flow and metabolism are tightly coupled, but in a nonlinear fashion. However, although there is experimental support for the two central assumptions of the model (no capillary recruitment and efficient metabolism), their validity has not been definitively established. Further experimental work and theoretical modeling is necessary to test these assumptions. In particular, more detailed modeling of the diffusive transport and metabolism of O2 are necessary to test whether the predicted imbalance of flow and metabolism remains when the assumptions are relaxed (i.e., incorporating small amounts of capillary recruitment or metabolic inefficiency). Nevertheless, the simplicity and explanatory power of the model suggest that it is a good starting point for understanding cerebral O2 metabolism and interpreting functional MRI studies in terms of physiological changes.
Footnotes
Acknowledgment:
The authors would like to thank Dr. Eric C. Wong for his thoughtful comments during the preparation of this paper.