
Abstract
The cerebral blood flow (CBF) and cerebral metabolic rate of oxygen (CMRO2) are major determinants of the contrast in functional magnetic resonance imaging and optical imaging. However, the coupling between CBF and CMRO2 during cerebral activation remains controversial. Whereas most of the previous models tend to show a nonlinear coupling, experimental studies have led to conflicting conclusions. A physiologic model was developed of oxygen transport through the blood–brain barrier (BBB) for dynamic and stationary states. Common model simplifications are proposed and their implications for the CBF/CMRO2 relation are studied. The tissue oxygen pool, the BBB permeability, and the hemoglobin dissociation curve are physiologic parameters directly involved in the CBF/CMRO2 relation. We have been shown that the hypothesis of a negligible tissue oxygen pool, which was admitted by most of the previous models, implies a tight coupling between CBF and CMRO2. By relaxing this hypothesis, a real uncoupling was allowed that gives a more coherent view of the CBF/CMRO2 relation, in better agreement with the hypercapnia data and with the variability reported in experimental works for the relative changes of those two variables. This also allows a temporal mismatch between CBF and CMRO2, which influences the temporal shape of oxygenation at the capillary end.
Keywords
Neuroimaging techniques such as functional magnetic resonance imaging (fMRI), or optical imaging, often use a vascular oxygenation contrast as an indirect measure of cerebral activity. A better understanding of the physiologic mechanisms that induce oxygen variations will help interpretation of neuroimaging data. The vascular oxygen content results from the balance between intake from the cerebral blood flow (CBF) and consumption by the cells. The possible variations of CBF and cerebral metabolic rate of oxygen (CMRO2) during cerebral activation are thus of primary importance.
Until now, there has been no agreement on the quantitative relation between those two variables. The question whether they are coupled or not has been debated in many previous studies [see (Raichle, 1998) for a review]. The ratio of relative changes of CMRO2/CBF varies among the studies. A ratio of approximately 0.5:1 has been observed for visual stimulation (Hoge et al., 1999; Davis et al., 1998; Vafaee et al., 1999) and for vibratory stimulation (Seitz and Roland, 1992), whereas no significant variations in CMRO2 were detected for vibrotactile stimulation (Fox and Raichle, 1986; Fujita et al., 1999; Ohta et al., 1999). Vafaee and Gjedde even reported a CMRO2 increase with no CBF increase in the putamen during finger motion (Vafaee and Gjedde, 2001). This ratio may even change during continuous visual stimulation (Mintun et al., 2002).
Parallel to those experimental works, a model approach is helpful to give some a priori knowledge on the CBF–CMRO2 relation. Buxton and Frank (1997) have derived a simple model of the extraction of oxygen by capillaries where CBF and CMRO2 are coupled by a nonlinear relation so that during activation, CMRO2 increases in much smaller proportion than CBF does. However, this model cannot explain all the discrepancies between experimental data. Gjedde et al., using a compartmental model (Gjedde, 1997), have shown that changes in the diffusivity parameter could modulate the CBF/CMRO2 relation (Gjedde et al., 1999; Vafaee and Gjedde, 2000). A more indirect way has been used by Hyder et al. (1998), who introduce an extra parameter Ω depending on CBF, capillary diffusivity, and the hemoglobin dissociation curve. The objective is similar: a more modular CBF/CMRO2 relation. However, even if some parameters modulate the relation, those models still predict a tight coupling between CBF and CMRO2, which means that the CMRO2 is entirely determined by the CBF.
The CBF/CMRO2 coupling proposed by those models directly results from the hypothesis of a null tissue oxygen concentration. However, the latter hypothesis is questionable as pointed out recently by model considerations (Valabregue et al., 2000; Buxton, 2001; Mayhew et al., 2001; Aubert et al., 2001; Aubert and Costalat, 2002) and by the experimental work of Ances et al. (2001), who show a significant increase in tissue oxygen concentration during a prolonged stimulation. We thus propose a more general model of oxygen transport in which we relax the hypotheses of a null tissue oxygen concentration. This allows more variability between CMRO2 and CBF at stationary state, in agreement with experimental studies. CMRO2 and CBF become two independent variables in a given range. We will first present the model equations and point out the physiologic parameters implied in the transport of oxygen and their relations. We will then present how our model can be related to previous published models. Finally, we will present the effect of parameters both on the steady state and on the dynamics of oxygen exchange between capillaries and tissue.
THEORY: MODEL OF OXYGEN EXCHANGE
Hypotheses
Given the geometric complexity of the capillary network in the brain, a realistic modeling of oxygen diffusion is beyond the scope of this article. We have chosen a compartmental approach (Fig. 1) in which the physiologic variables introduced in the model represent the local mean value normalized to 100 g of tissue. We also make the following hypotheses:
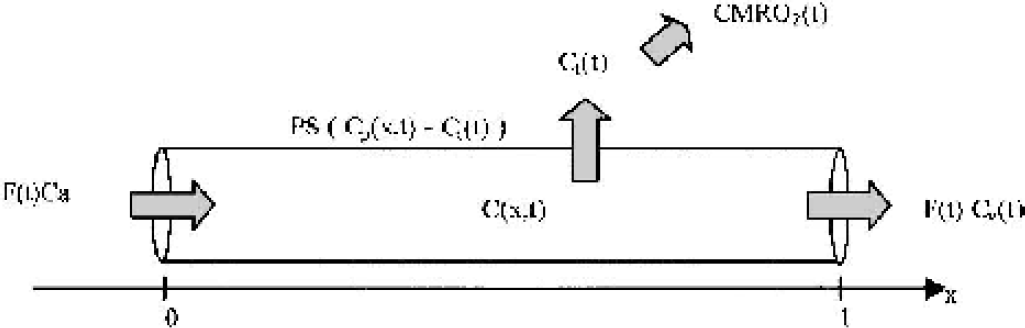
Schema of compartment model of the oxygen exchange between capillaries and tissue. PS: P, oxygen permeability, S, exchange area; CMRO2, cerebral metabolic rate of oxygen.
The O2 extraction is limited by the blood–brain barrier. Conventionally, one assumes that the diffusion barrier is at the capillary wall, although it might include tissue diffusion as well.
A passive oxygen exchange occurs between a single axially distributed capillary compartment and a wellmixed tissue compartment. Blood oxygen concentration depends on capillary axial direction.
Blood is considered a homogeneous solution of hemoglobin.
The constant O2 arterial pressure is set to 100 mm Hg; we assume there is no precapillary loss of oxygen.
We suppose neither capillary recruitment nor capillary volume changes during cerebral activation (Bereczki et al., 1993; Hudetz, 1997).
Notations and parameter values
CMRO2(t): The cerebral metabolic rate of oxygen (we use the following conversion between standard units: × mL · min−1 · (100 g)−1 = x/0.0224 μmol · min−1 · (100 g)−1).
CBF(t) or F(t): The local cerebral blood flow (mL · min−1 · (100 g)−1).
x: coordinate along the capillary axis, which is normalized to the capillary length: × ∈ [0 1].
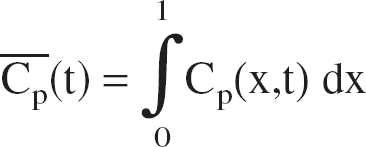
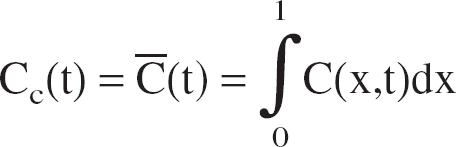
C(x,t), Cp(x,t), and Ct(t), respectively, refer to: total blood, plasmatic, and mean tissue, oxygen concentrations (mmol · L−1). Ca, Cv(t): total arterial and venous O2 concentrations at the capillary entry and capillary end, respectively (mmol · L−1).
Vc and Vt: volume of the capillary and tissue compartments (mL · (100 g)−1).
E(t): oxygen extraction fraction, E(t) = [Ca – Cv(t)]/Ca.
P: permeability, S: surface of capillary exchange. (PS = 7,020 (Kassissia et al., 1995) or 3,000 mL · min−1(100 g)−1).
We use the subscript “ini” for the initial values.
Transport equations
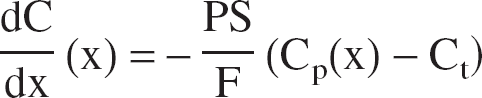
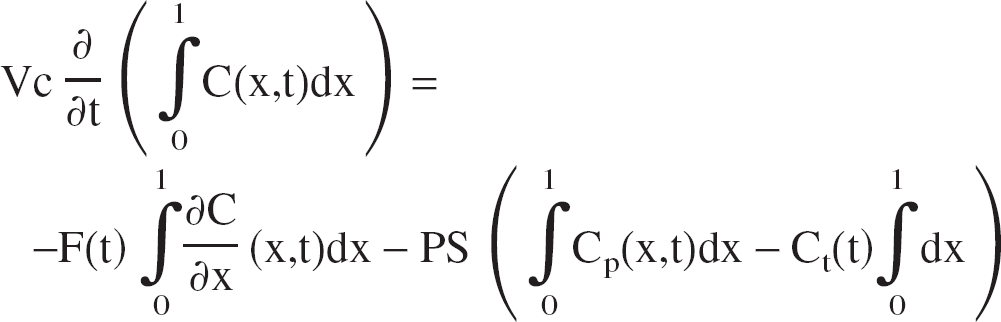
The transport of oxygen is reduced to the problem of the exchange between two compartments and derived directly from mass conservation and Fick's diffusion law (Fig. 1). The variation of oxygen in capillaries is caused by the blood flow supply (Eq. 1, first right term) and to the passive diffusion through the blood–brain barrier, which is proportional to the gradient of concentration between the two compartments (Eq. 1, second right term). The variation of O2 in the tissue is caused by the intake from the capillaries (Eq. 2, first right term) and to the consumption by the cells (Eq. 2, second right term).
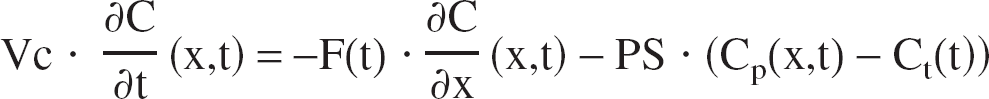
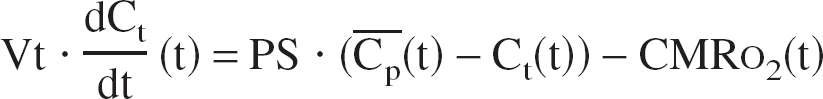
where

With initial and boundary conditions:
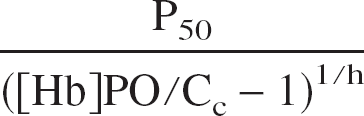
The Fick diffusion across the blood–brain barrier depends on the plasma oxygen concentration Cp(x,t), whereas the mass balance equation concerns the total oxygen concentration C(x,t), which includes plasmatic and hemoglobin bound oxygen. Cp(x,t) is directly related to C(x,t) via the oxyhemoglobin dissociation curve (ODC). Because of the rapid time constant of the hemoglobin oxygen uptake [around 30 milliseconds to take up half of the oxygen content (Clark et al., 1985)], one can assume a quasiequilibrium and take the empirical Hill equation, which has been shown to fit well for physiologic values (Sharan et al., 1989).
With the following notation: [Hb]: tetramer hemoglobin concentration (2.3 mmol · L−1), PO: oxyphoric power (4), h: Hill coefficient (2.73), P50: value of PO2 at which hemoglobin is 50% saturated (26 mm Hg), α: solubility coefficient (1.39 10−3 mmol · L−1 · mm Hg−1) used for Henry's law: Cp = α PO2.
At stationary state, we just set the temporal derivatives to zero and Eqs. 1 and 2 become


where

Those equations have been solved numerically using programs we have developed in C language (see Appendix 1 for details on the numerical scheme used). We have obtained a system of three coupled equations, 1, 2, 3, for the dynamic case and 3, 4, 5, for the steady state. The permeability and the parameters from the ODC are fixed physiologic properties and we thus consider them as input parameters of the system. The distribution of oxygen (C, Cp, Ct) depends then on two input variables, F and CMRO2. This means that for a given flow and a given oxygen consumption, the distribution of oxygen in the capillary and tissue compartment can be computed by solving the equations. This also implies that F and CMRO2 are two independent functions. As we will see in the “Results” section, this is partially true because too large a CMRO2 will lead to a negative tissue oxygen concentration Ct. So the CMRO2 is independent of CBF below a certain range.
However, if one supposes a fixed tissue oxygen concentration Ct, there is only one more input variable: F or CMRO2. This means that for a given flow, the capillary oxygen distribution and the CMRO2 are given by the system. In this case, F and CMRO2 are coupled by oxygen transport.
Let us note that for the dynamic case there are two more parameters—the capillary and tissue volume—which only influence the temporal shape. Except for this, the dependence between the other variables remains the same for dynamic and stationary states.
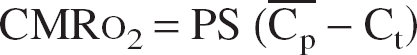
For the stationary state, Eq. 4 can be directly integrated and combined with Eq. 5 to give
This relation does not add anything from a mathematical point of view, but it is useful because it simply links the three parameters CMRO2, F, and E. It is only valid at the stationary state.
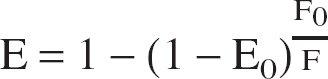
We also compute the blood oxygen level-dependent (BOLD) fMRI relative signal variations as another output of the model because it is directly related to the oxygen extraction and blood volume. We choose the relation given by Buxton and colleagues (Buxton et al., 1998):
where E0 is the oxygen extraction fraction at rest, V0 is the resting venous blood volume fraction (0.03), and q and v are, respectively, the total deoxyhemoglobin content and the venous volume, both normalized to their value at rest. For all simulations presented, we did not consider any venous volume change during activation in order to focus on the influence of the oxygenation on the BOLD signal.
Relation to other models
The model proposed by Buxton and Frank (1997) can be directly derived from our steady-state model by making two more hypotheses: a null tissue oxygen concentration (Ct = 0) and a linearization of the ODC (Eq. 3): Cp(x) = r.C(x).
This greatly simplifies Eq. 4 so that one can get an analytic solution and deduce the oxygen extraction, E = (C(0) – C(1))/C(0) = 1 – exp (−PS · r/F), which can lead to Eq. 5 in Buxton and Frank (1997):

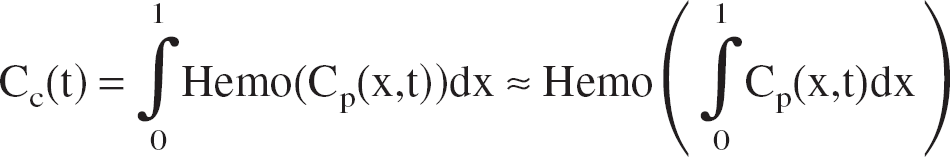
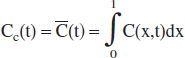
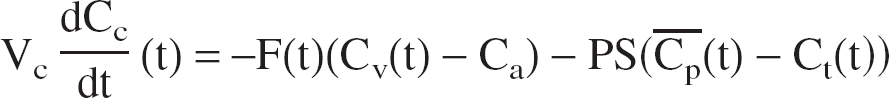
Another possible simplification is to consider a homogeneous capillary compartment with a mean concentration defined as: Cc = (Ca + Cv)/2 (Gjedde, 1997; Vafaee and Gjedde, 2000). Then, using Eqs. 1 and 2, we obtain (see Appendix 2 for more details and Aubert et al., 2001):

where Hemoinv(Cc) =

The same simplification can be made on the stationary states equations.
Equation 11 is the model presented by Gjedde (1997) and Vafaee and Gjedde (2000), except that they assume a null tissue oxygen concentration.
RESULTS
The stationary state
Parameters influence.
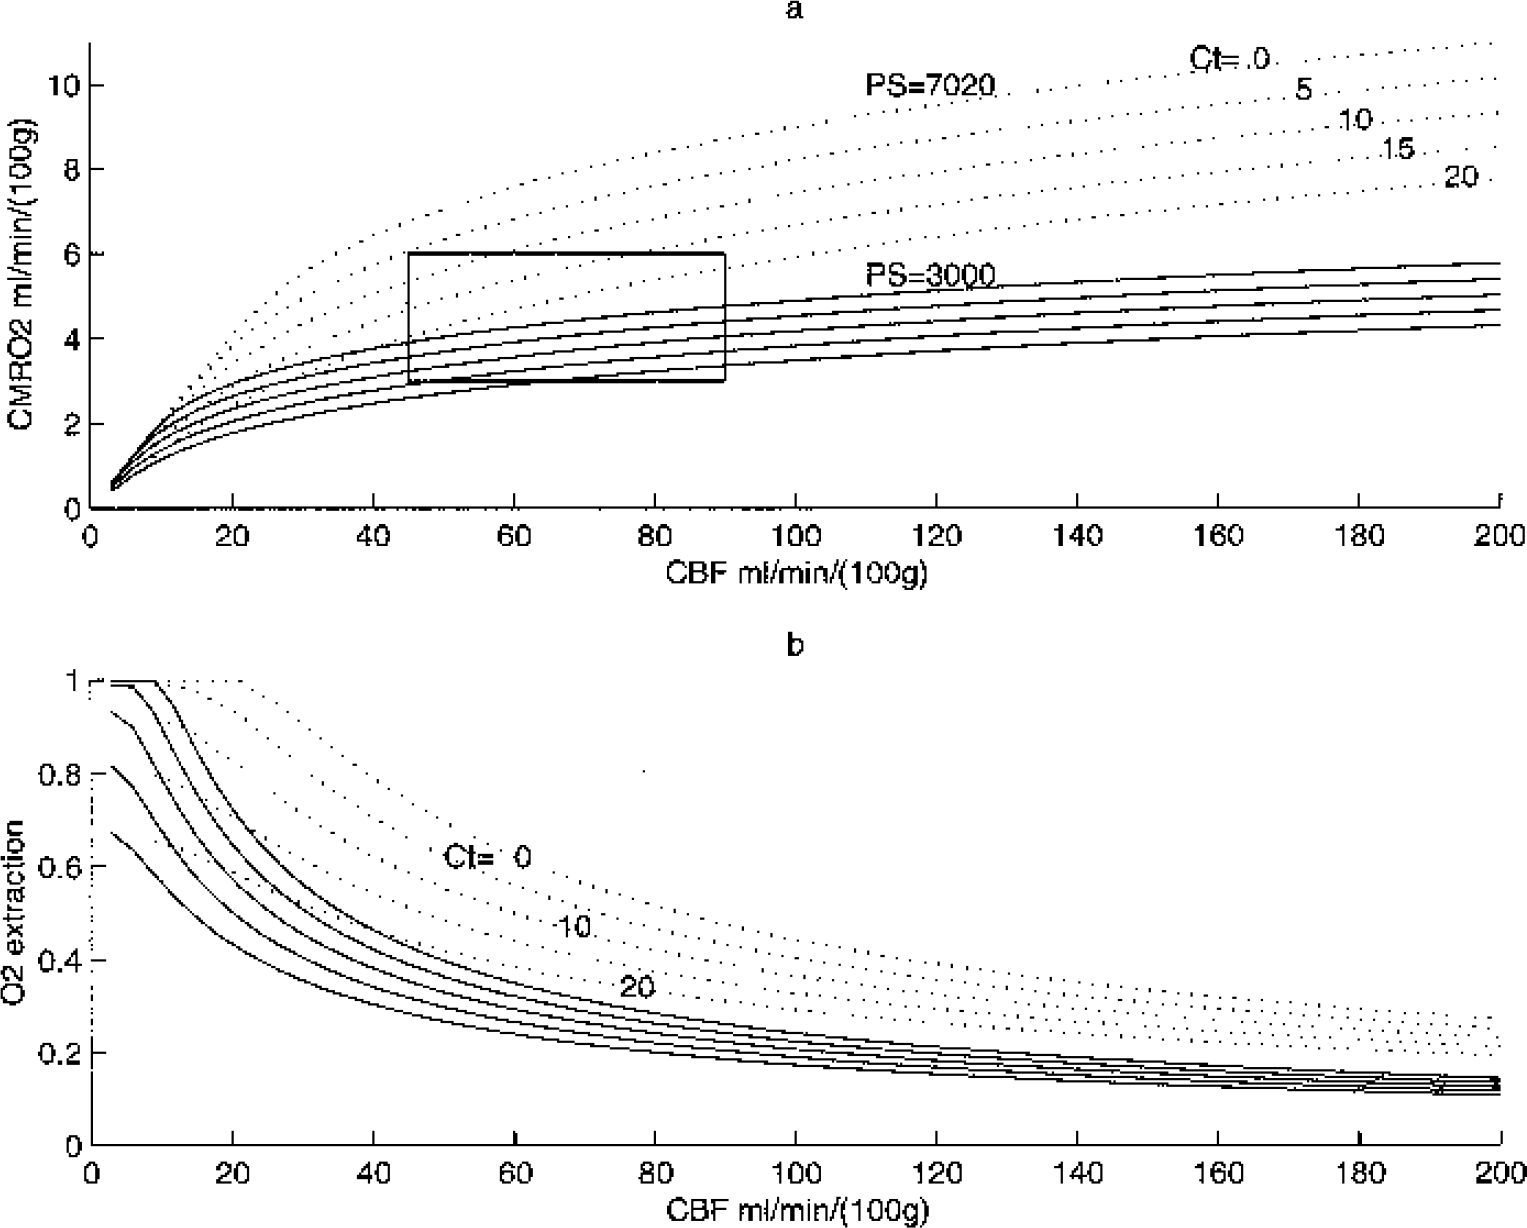
Let us first look at the CBF/CMRO2 relation when considering PS and Ct as fixed input parameters. As pointed out in the previous section, the distribution of oxygen depends then only on the parameters F, PS, and Ct (and on the hemoglobin parameters): this implies a tight coupling between F and CMRO2. This latter relation and the influence of the parameters PS and Ct are shown in Fig. 2. The CBF/CMRO2 relation is highly nonlinear, so that large changes in CBF are required in order to support small changes in CMRO2.
Cerebral metabolic rate of oxygen (CMRO2)
If one relaxes the hypothesis of a fixed Ct, the CMRO2 becomes an independent parameter and it is only limited by the availability of oxygen. The CMRO2 can take any value in the plane CBF/CMRO2 under the curve CMRO2lim defined for Ct = 0.
The hypothesis of a fixed PS implies that there is no capillary recruitment and no change in permeability (the flow increase is only because of an increase in blood velocity). However, a pure capillary recruitment implies that PS is proportional to the flow. In this case, the oxygen extraction is always constant for a fixed Ct because it only depends on the PS/F ratio (Eq. 4) and so the CMRO2 is directly proportional to the flow (Eq. 6).
Variations of CMRO2 between two stationary states
Large differences among experimental studies have been reported for the ratio of relative changes of CMRO2 and CBF during activation (rCMRO2: rCBF). According to this model, there are two parameters that influence the relative change of CMRO2 for a given change in CBF: PS and Ct. In Fig. 3 we estimate the influence of the tissue oxygen concentration on this ratio: a decrease in Ct allows much larger CMRO2 variations. Of course, the same could be predicted for an increase in PS, but it means that the CBF increase occurs with capillary recruitment.
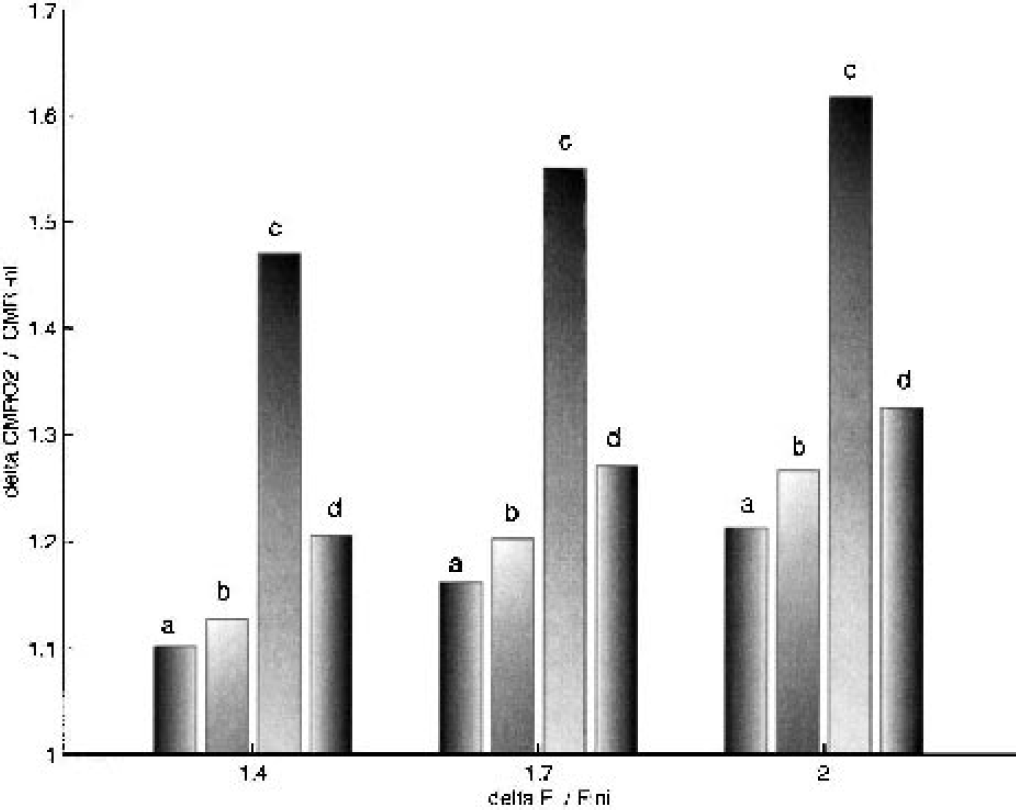
Relative changes of oxygen consumption versus relative flow increase for different variations in Ct during activation. For each cerebral blood flow (CBF) increase, the four bins correspond, respectively, to
Model comparison
We have compared the CBF/CMRO2 relation at steady state for Ct = 0 for the three models presented (Buxton and Frank, Gjedde and Vafaee, and our model). For the Buxton and Frank model, we have taken different values for the slope of the linearized ODC (Fig. 4). Each value gives a curve where the CBF/CMRO2 relation is more nonlinear compared to our model. It shows that the linearization of the ODC has nonnegligible quantitative effects. However, the simplifications made by Gjedde and Vafaee do not significantly affect the CBF/CMRO2 relation relative to our model. This has a practical interest, because the system of Eqs. 9 and 10 is much easier to solve.
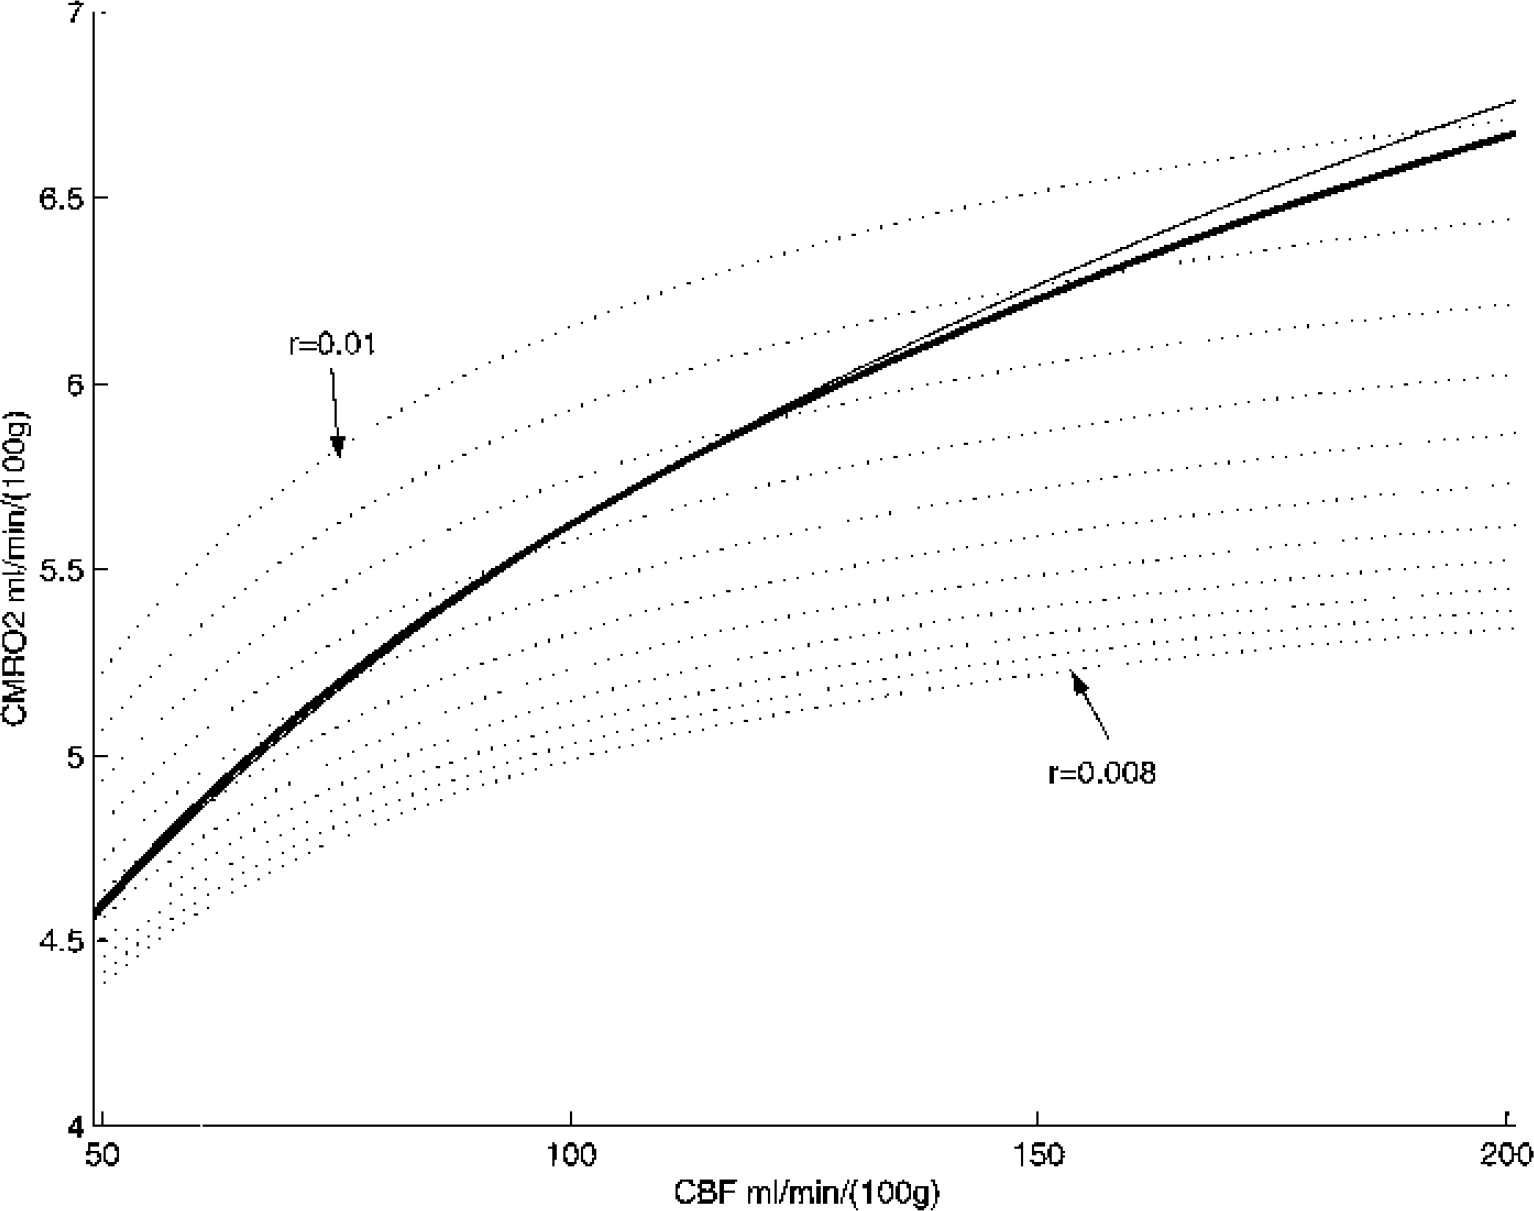
Comparison of the cerebral blood flow (CBF)–cerebral metabolic rate of oxygen (CMRO2) relation for the three different models. The dashed curves are derived from the Buxton and Frank model with different values of the coefficient of the linearization of hemoglobin dissociation curve. The solid line is the Vafaee and Gjedde “like” model and the heavy solid line is our model. We chose a null tissue oxygen Ct and a PS (P, oxygen permeability; S, exchange area) of 3,600 mL · min−1(100 g)−1
Dynamic states
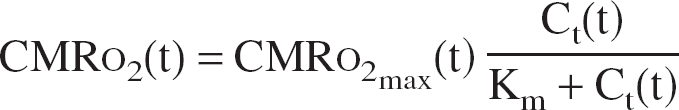
To take into account the physiologic limitation of a positive tissue oxygen concentration, we have introduced a Michaelis–Menten dependence of CMRO2 on Ct,
where Km is the Michaelis constant (0.1 mm Hg), CMRO2max the CMRO2 at saturating Ct.
CMRO2max(t) depends actually on all metabolic factors, other than oxygen, which can modify mitochondrial respiration, e.g., the ATP/ADP ratio or pyruvate intracellular concentration (Aubert et al., 2001; Aubert and Costalat, 2002). However, we just consider CMRO2max(t) as a command term. The CMRO2 is thus independent in a certain range: although Ct is high enough (>Km), the CMRO2 matches the command term CMRO2max, but if Ct is too low, the CMRO2 is reduced because of the limitation of available oxygen.
During activation, an increase in the CBF is supposed to occur without capillary recruitment or capillary volume change (Bereczki et al., 1993; Hudetz, 1997). We have simulated an activation by a flow increase of 70% with a ramp of 2 seconds (Krüger et al., 1999; Conrad and Klingelhfer, 1989). We have chosen the resting state value of CBF of 50 mL · min−1 (100 g)−1 and a resting CMRO2 of 4.56 mL O2 min−1 (100 g)−1 to match an oxygen extraction of 60% according to Eq. 6. The value of PS will then determine the tissue oxygen concentration Ct. We have taken two values of PS—7,020 and 3,000 mL · min−1 (100 g)−1—which give a Ct of 15 and 5 mm Hg, respectively. The two remaining parameters, Vc and Vt, only influence the temporal dynamics.
An interesting point about our model is that CMRO2 and CBF can be two independent variables. Thus, we may look at different temporal dynamics of those two variables. Figure 5 shows the results for two different CMRO2 dynamics: a prior and a later increase in comparison to the flow increase. A prior increase induces an initial dip in the BOLD signal. A later increase induces an overshoot on the BOLD signal, which then reaches a lower plateau value. As mentioned in the Theory section, we did not consider any venous volume variation, and this may explain why the amplitude of the initial dip and the undershoot are similar, which is not the case in experimental data (Krüger et al., 1998).
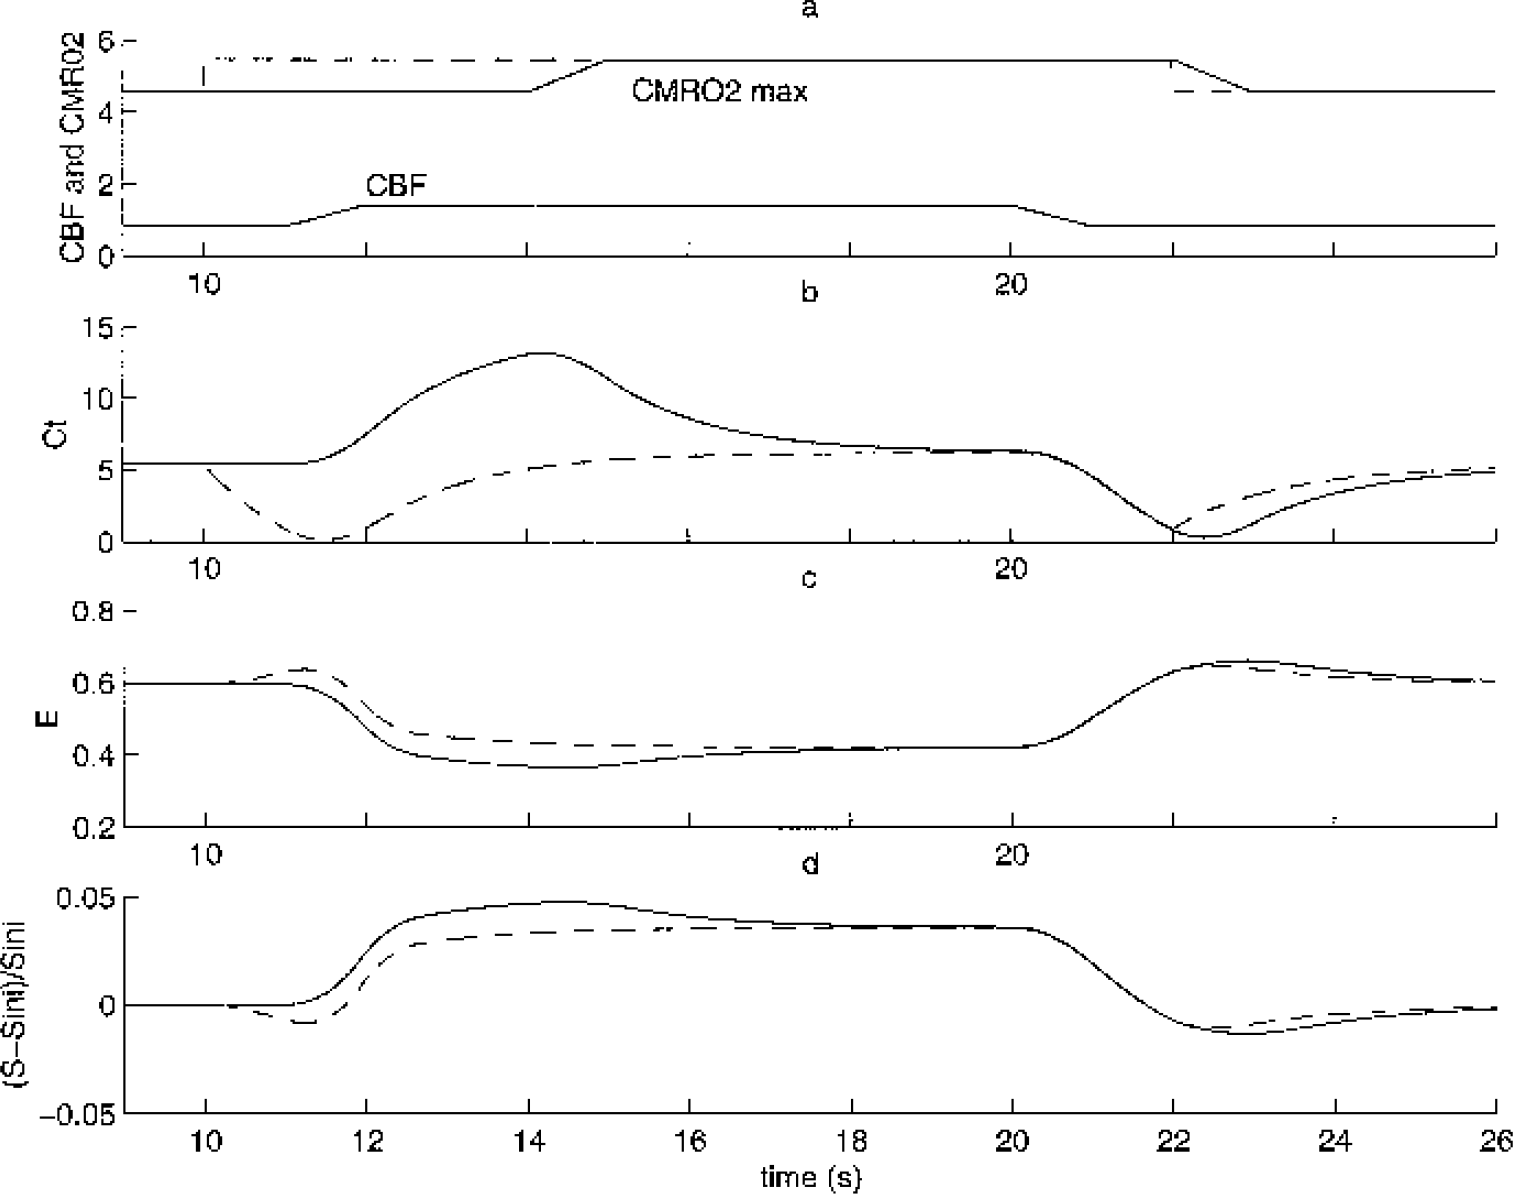
We solved our model (Eqs. 1, 2, 3) for two different cerebral metabolic rate of oxygen (CMRO2)max inputs. The parameter used are as follows: Fini = 50 mL·min−1(100 g)−1 with increase of 70%, CMRO2max ini = 4.56 mL · min−1(100 g)−1 and increase of 20%
Figure 6 shows the influence of the capillary volume on the temporal shape: the response is delayed with increasing capillary volume. The true parameter responsible for this is in fact the transit time (τ). It is directly related to the capillary volume by the following relation: τ = Vc/F. If we increase the steady-state flow value in the same proportion as the capillary volume, then we reobtain the first curve (results not shown). We must note that this effect is different from the balloon effect (Buxton et al., 1998), which supposes a late temporal variation of the vascular venous volume, but assumes that the steady state is achieved for oxygen exchange. Here we show that the dynamic of oxygen exchange is not negligible and is influenced by the capillary transit time.
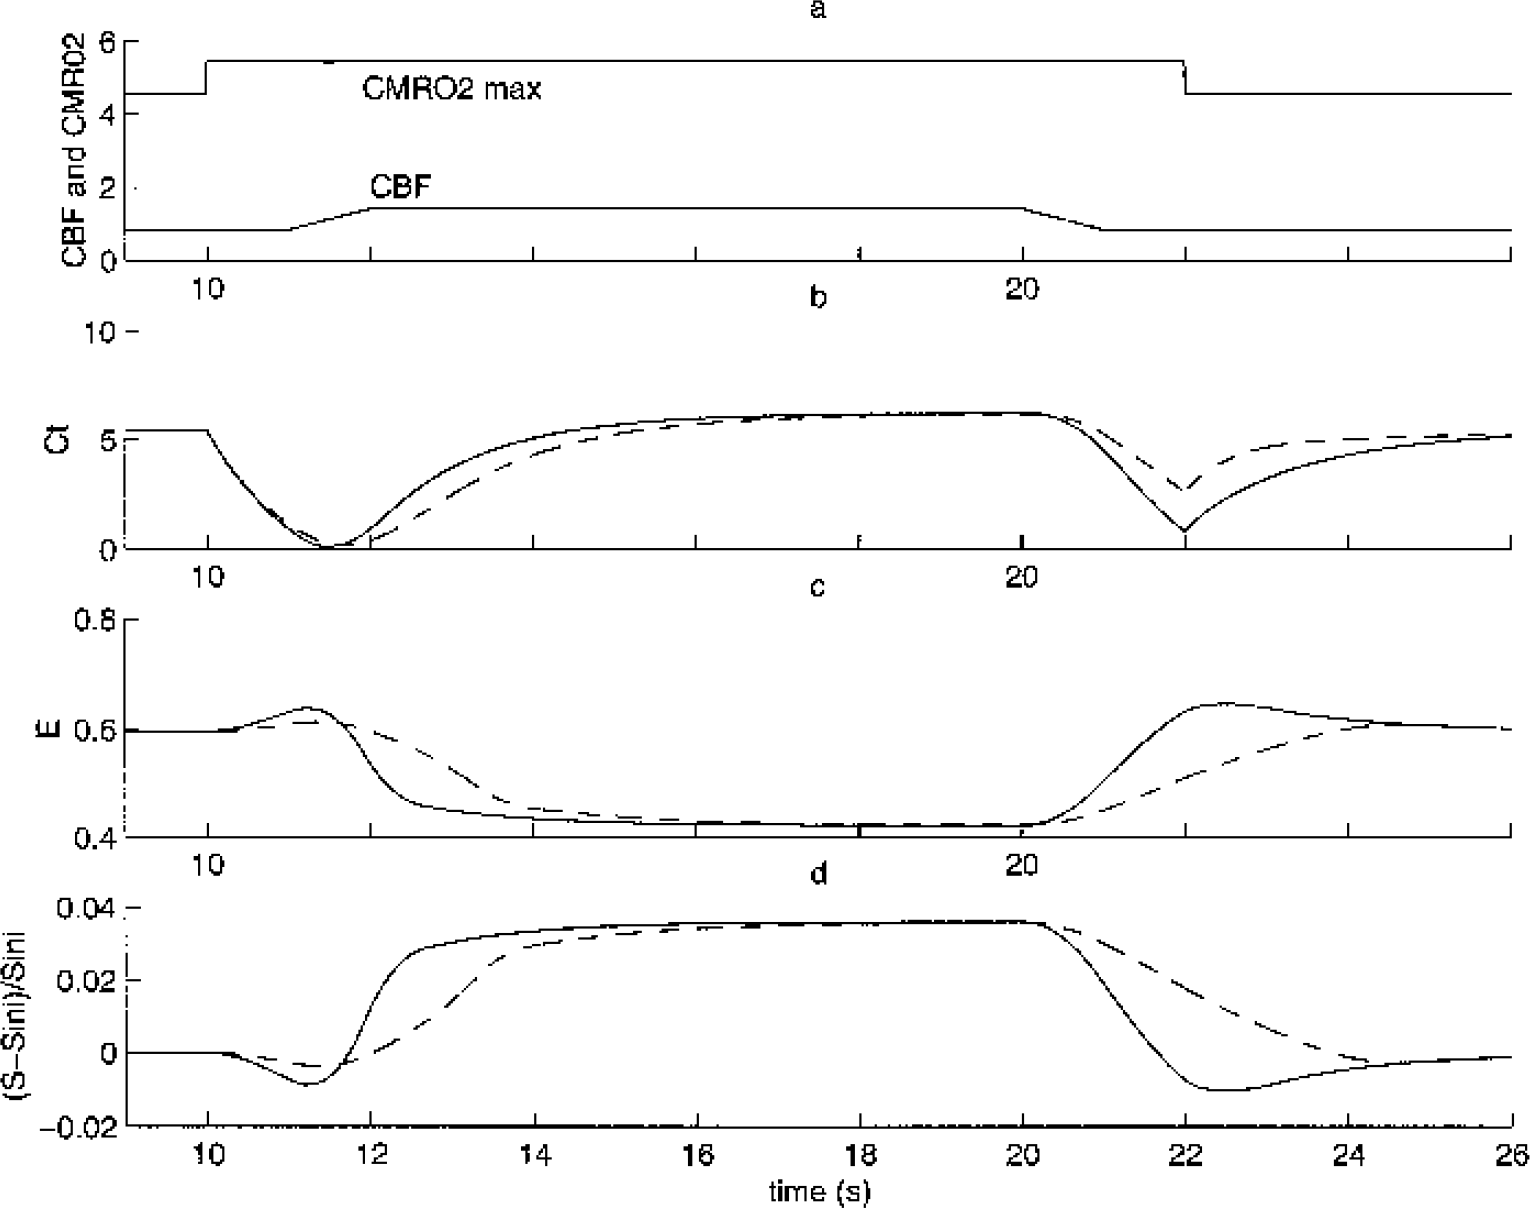
We solved our model (Eqs. 1, 2, 3) for two different capillary volumes: Vc = 1 (solid line) Vc = 3 (dashed line). The parameters used are as follows: Fini = 50 mL · min−1(100 g)−1 with increase of 70%, cerebral metabolic rate of oxygen (CMRO2)max ini = 4.56 mL · min−1(100 g)−1 and increase of 20%
DISCUSSION
There is a long history of models of oxygen extraction beginning with the work of Krogh (1919). They were first developed to study the conditions of hypoxia (Groebe, 1995; Reneau et al., 1977). In these models, the diffusion of oxygen is solved in a tissue cylinder around the capillary. This approach has been used recently to study the CBF/CMRO2 relation in the brain (Hudetz, 1999; Mintun et al., 2001). Although we agree with Mintun et al. (2001) on the importance of tissue oxygen, this modeling approach has some important drawbacks. The tissue oxygen distribution given by a Krogh-like model depends very much on geometric parameters such as the radius of tissue cylinder. Even for muscles, where the capillaries following the fibers are parallel, the Krogh's approach is not correct (Goldman and Popel, 2000), and this is even more the case in the brain, where blood vessels show a great tortuosity. An attempt to use a realistic geometrical model has been made by Secomb et al. (1998), but they have chosen a particular vessel geometry and had to solve the three-dimensional diffusion equations with the use of Green functions to get a realistic oxygen distribution. The compartment approach presents the advantage to be independent of the capillary geometry, but it only gives information on the mean tissue oxygen concentration. The question about which model gives the better quantitative results is not easy to answer, given the lack of precise experimental data. However, the compartment approach seems to be quite robust because the Gjedde and Vafaee model, which reduces the geometry by one step by neglecting the oxygen distribution along the capillary axis, does not affect the CBF/CMRO2 relation much (Fig. 4).
Even if we do not know the exactitude of the quantitative prediction, the compartmental model is useful for understanding the importance of physiologic parameters involved in oxygen transport. The PS parameter has to be considered if one compares different regions. Indeed, the model predicts for the case of a pure capillary recruitment that the CBF and the CMRO2 are linearly correlated. This is coherent with data at steady state: linear relation between CBF and CMRO2 is observed when one compares various regions of the brain at rest (Baron et al., 1984; Roland, 1993). The major difference between the regions should then be capillary density, with the flow velocity remaining the same. Gjedde et al. (1999) also conclude that the capillary density is adjusted to satisfy the average steady-state oxygen requirement when they compare their model to their previous experimental measurements of CBF, CMRO2, and capillary density.
Previous compartmental models (Gjedde, 1997; Buxton and Frank, 1997; Hyder et al., 1998; Vafaee and Gjedde, 2000) tend to show a tight nonlinear coupling between CBF and CMRO2. We have seen that this is closely related to the hypothesis of a null tissue oxygen concentration. This hypothesis is based on the experimental work of Kassissia et al. (1995), who show a limitation of diffusion through the capillary wall. This experiment is relatively indirect and depends on a radiotracer theory, whereas other studies using electrodes to measure tissue oxygen concentration report a mean tissue PO2 of 15 mm Hg with a wild heterogeneity (Lubbers et al., 1994; Metzger and Heuber, 1977). Even if the large electrode includes a vascular contribution, the oxygen tissue concentration is not negligible because the vascular compartment is only about 3% of the tissue volume. Recent measures directly argue for our model by showing a tissue PO2 baseline of 23 Torr and temporal variation during activation (Ances et al., 2001). It can be emphasized that mitochondrial oxygen tension can be much lower than the mean tissue oxygen tension. To know which of those two variables is important for oxygen extraction would require more modeling developments, which is beyond the scope of this article. However, our model shows that a tissue oxygen buffer is necessary to allow transient uncoupling between CBF and CMRO2.
A consequence of “oxygen limitation” models is that the transport of oxygen does always impose the oxygen consumption to the tissue. However, this cannot be always true, as pointed by Mayhew et al. (2001): for example, in the case of hypercapnia, the flow is known to increase without concomitant CMRO2 increase (Horvath et al., 1994; Yang and Krasney, 1995). A model of tight coupling is no more valid, whereas our model simply predicts an increase in tissue oxygen. Even for normal activation the CBF may be uncoupled to the CMRO2. The mechanism for blood flow regulation during cerebral activation is still a subject of controversy, and Gjedde (2001) reviews the different physiologic factors involved in the regulation of CBF. Attwell and Iadecola (2002) argue to show that the flow response is driven by neurotransmitter-related signaling rather than directly driven by local energy needs.
Furthermore, a difficulty encountered by the previous models was to take into account the experimental variability observed for the ratio of relative changes of CBF/CMRO2 during activation. Previous investigators explain the greater CMRO2 increase observed as a change in the capillary diffusivity during activation (Gjedde et al., 1999; Vafaee and Gjedde, 2000; Hyder et al., 1998). However, this is not biologically evident if one supposes neither capillary volume change nor recruitment. We have pointed out that the tissue oxygen pool is also a possible alternative to explain the same effect because even small variations of 5 Torr in Ct allow a greater CMRO2 increase (Fig. 4). Another debate in which this model can give insight is about the different temporal shapes of the BOLD signal and their interpretation. On the one hand, Frahm et al. (1997) observe, during a long visual stimulation, an overshoot of the BOLD signal followed by a progressive decrease, which they interpret as a late increase of CMRO2. On the other hand, the balloon model gives an alternative interpretation: they attribute those changes to late volume variations (Buxton et al., 1998; Mandeville et al., 1999). We show that the mismatch between flow and CMRO2 is still a possible interpretation coherent with the theory of oxygen extraction (Fig. 5), but a model approach cannot confirm either interpretation.
Our model points out that if an uncoupling exists, there should be some transient variation of tissue oxygen. This has recently been shown by the experimental work of Ances et al. (2001), where they observe a poststimulus undershoot that was not present in the CBF. This observation cannot be attributed to vascular volume changes because it is a measure of tissue oxygen concentration. Furthermore, the model shows that considering the dynamic of oxygen transport has some nonnegligible effect on the temporal shape of venous oxygen concentration.
APPENDIX 1
The difficulty in solving the system consisting of partial differential Eq. 1 together with Eqs. 2 and 3 comes mainly from the nonlinearity introduced by the ODC (Eq. 3), which disables an analytic solution for Eq. 1. We thus use the following numerical scheme to solve the system.
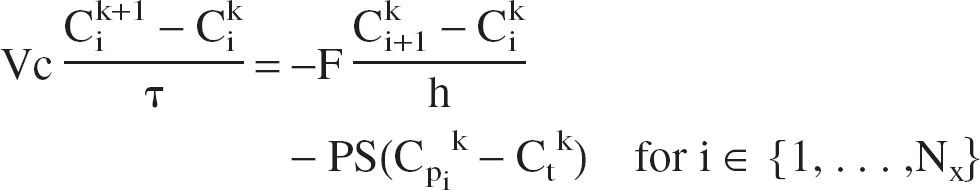
We choose time step τ = 0.01 second, and a space step h = 0.01. This means that we divide the x-axis into Nx – 100 points. Let us take the notation Cik = C(xi, tk) (and also for Cp or Ct).
At each time step tk with k ∈ {1, …, Nt}, we do the following: At t = 0, C(x,0) is known (we choose a null function).
For each Cik, i ∈ {1, …, Nx}, we solve Eq. 3 by finding the zero with the Newton method to compute Cpik
We compute the mean
We compute Ctk+1 with Eq. 2 by using the 4-order Runge-Kutta method. We suppose Cp constant between tk and tk+1
We then solve Eq. 1 with the following scheme
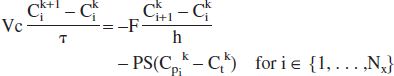
for i ∈ {1,…, Nx}
We thus obtain a tridiagonal linear system of Nx equations, which we solved using a standard LU decomposition method with a backward resolution.
APPENDIX 2
By integrating Eq. 1 along the capillary length we obtain
With the notation for the mean capillary concentration
it becomes

The relation between Cp and Cc is given by the oxyhemoglobin dissociation curve, but we will introduce two more simplifying assumptions, as follows.
First, the plasmatic oxygen concentration is negligible relative to the total oxygen concentration (simplification of Eq. 3):
Second, we assume that
Thus we obtain
This can be inverted:
We then use the other simplifying hypothesis
This is true if C(x,t) decays linearly along the capillary length. Finally, we obtain Eqs. 9 and 10.