
Abstract
The discrepancy between the increases in cerebral blood flow (CBF) and CMRO2 during neural activation causes an increase in venous blood oxygenation and, therefore, a decrease in paramagnetic deoxyhemoglobin concentration in venous blood. This can be detected by functional magnetic resonance imaging (fMRI) as blood oxygenation level-dependent (BOLD) contrast. In the present study, changes in the cerebral oxygen extraction fraction (OEF) that corresponds to the ratio of CMRO2 to CBF, and in the BOLD signal during neural activation, were measured by both positron emission tomography (PET) and fMRI in the same human subjects. C15O, 15O2, and H215O PET studies were performed in each subject at rest (baseline) and during performance of a right-hand motor task. Functional magnetic resonance imaging studies were then performed to measure the BOLD signal under the two conditions. During performance of the motor task, a significant increase in CBF and a significant decrease in OEF were observed in the left precentral gyrus, left superior frontal gyrus, right precentral gyrus, right cingulate gyrus, and right cerebellum. A significant positive correlation was observed between changes in the CBF and the BOLD signal, and a significant negative correlation was observed between changes in the OEF and the BOLD signal. This supports the assumption on which BOLD contrast studies during neural activation are based.
Introduction
Positron emission tomography (PET) and magnetic resonance imaging (MRI) studies of human cerebral hemodynamics indicate that cerebral blood flow (CBF) and cerebral blood volume (CBV) increase during neural activation (Belliveau et al, 1991; Fox and Raichle, 1984, 1985) and that the increase in CBF is greater than that in CBV (Ito et al, 2001b). Positron emission tomography studies of human cerebral oxygen metabolism show that CBF and CMRO2 increase during neural activation. The increase in CBF is greater than that in CMRO2, resulting in a decrease in the cerebral oxygen extraction fraction (OEF), which corresponds to the ratio of CMRO2 to CBF (Fox and Raichle, 1986; Seitz and Roland, 1992; Vafaee and Gjedde, 2000).
The discrepancy between the increases in CBF and CMRO2 during neural activation causes an increase in venous blood oxygenation and, therefore, a decrease in the paramagnetic deoxyhemoglobin concentration in venous blood. This decrease can be detected as blood oxygenation level-dependent (BOLD) contrast by means of functional magnetic resonance imaging (fMRI) (Ogawa et al, 1990, 1992). The measurement of BOLD contrast by means of fMRI is used widely to study brain activation (Turner et al, 1998).
The relation between CBF and blood oxygenation during neural activation has been established theoretically in a mathematical model (Hathout et al, 1995). However, the relation between OEF and BOLD contrast during neural activation has not been shown directly in the human subjects (Raichle, 1998). We sought to confirm this relation by measuring changes in OEF and BOLD signal by both PET and fMRI during neural activation in the human subject.
C15O, 15O2, and H215O PET studies were performed in volunteers at rest (baseline) and during performance of a motor task. Functional magnetic resonance imaging studies were then performed in the same volunteers to measure the BOLD signal under the same two conditions.
Methods
Subjects
Seven healthy men (20 to 22 years of age) were recruited and gave written informed consent to participate in the study. The subjects were judged to be healthy on the basis of their medical history, a physical examination, blood screening test, and MRI of the brain. All subjects were strongly right-handed according to the Edinburgh Handedness Inventory (96%±11%, mean±s.d.) (Oldfield, 1971). The study protocol was approved by the Ethics Committee of the Akita Research Institute of Brain and Blood Vessels.
Positron Emission Tomography Procedures
The Headtome-V PET system (Shimadzu Corp., Kyoto, Japan) used for all studies provides 47 slices with center-to-center distances of 3.125 mm (Iida et al, 1996). The intrinsic spatial resolution was 4.0 mm in plane and 4.3 mm full-width at half-maximum (FWHM) axially. Reconstruction with a Butterworth filter resulted in a final in-plane resolution of approximately 8 mm FWHM. Data were acquired in the two-dimensional (2D) mode.
C15O, 15O2, and H215O PET studies were performed in each subject after transmission scanning under two conditions: at rest (baseline) and during performance of a motor task with the eyes closed. The interval between studies was at least 15 mins. Studies were performed first at rest and then during the motor task in four subjects. The studies were performed first during the motor task and then at rest in the other three subjects. A head fixation system with individualized molds for each subject was used to minimize head movement during PET scanning. The motor task consisted of a finger-tapping activity in which each finger of the right hand was sequentially touched to the thumb (Allison et al, 2000). The frequency was self-paced, approximately 2 seconds per cycle. The neural activation condition (motor task performance) started 1 min before scanning and continued until the end of scanning.
C15O Positron Emission Tomography Study
The C15O PET studies were performed to measure CBV (Martin et al, 1987). Static PET scanning was started 3 mins after 1 min of continuous inhalation of C15O gas (a total of approximately 5 GBq supplied by mouth). Scanning lasted 4 mins. Three arterial blood samples were taken during PET scanning to measure the whole blood radioactivity and blood gases. The cerebral-to-large vessel hematocrit ratio was assumed to be 0.85. C15O PET data was also used to correct for radioactivity in cerebral blood vessels during measurement of OEF and CMRO2 (Lammertsma and Jones, 1983).
15O2 Positron Emission Tomography Study
The 15O2 PET studies were performed to measure OEF and CMRO2 (Herscovitch et al, 1985; Mintun et al, 1984). The scanning protocol consisted of 180 seconds of static scanning after 1.5 mins of slow bolus inhalation of 15O2 gas (a total of approximately 5 GBq supplied by mouth). The arterial input function was determined by continuous beta probe measurement of radioactivity in arterial whole blood taken from the radial artery. Dispersion and delay occurring in the beta detector system and in the internal arterial line were corrected as reported previously (Iida et al, 1988, 1986). Blood gases were measured in two arterial blood samples, one taken at the beginning and one taken at the end of scanning. The arterial plasma concentration of 15O-labeled metabolic water was calculated as previously described (Iida et al, 1993).
H215O Positron Emission Tomography Study
The H215O PET studies were performed to measure CBF. The protocol consisted of 180 seconds of static scanning after 2 mins of continuous intravenous infusion of H215O. The total dose of radioactivity was 1.1 to 2.0 GBq at the start of scanning. The arterial input function was determined by continuous beta probe measurement of radioactivity in arterial whole blood taken from the radial artery. Dispersion and delay in the beta-detector system and in the internal arterial line were corrected as reported previously (Iida et al, 1988, 1986). Cerebral blood flow was calculated by the autoradiographic method (Iida et al, 1998; Kanno et al, 1987; Raichle et al, 1983). Blood gases were measured in two arterial blood samples, one taken at the beginning and one taken at the end of scanning.
Functional Magnetic Resonance Imaging Procedures
After the PET studies were completed, fMRI studies were performed with a 1.5 T. MRI scanner (GE, Milwaukee, WI, USA). The BOLD signal at rest (baseline) and during performance of the motor task with the eyes closed was acquired by gradient echo-type echo planar imaging (TR=3000 ms, TE=60 ms, flip angle=70°) with a 64 × 64 matrix (pixel size, 3.75 mm), 19 slices, 5-mm slice thickness, and 1-mm interslice gap. Functional magnetic resonance imaging scanning comprised five cycles of a 30-sec resting phase, followed by 30 secs of motor task performance. The same motor task was used in fMRI as in PET studies.
Data Analyses
All PET and fMRI images were transformed into the standard brain size and shape by linear and nonlinear parameters with the statistical parametric mapping (SPM99) system for anatomic standardization (Friston et al, 1990). Thus, the brain images of all subjects had the same anatomic format. From standardized CBF images, three-dimensional Z-score maps of the motor task condition measurement minus the baseline measurement, and the baseline measurement minus the motor task condition measurement were created on a pixel-by-pixel basis. Areas on these maps showing a P-value of <0.001 with no correction were considered to be statistically significant. The extent threshold was set at 64 voxels (1 voxel: 2 × 2 × 2 mm3) for the Z-score map of the motor task condition measurement minus the baseline measurement and 27 voxels for the map of the baseline measurement minus the motor task condition measurement. Regions of interest (ROIs) were drawn on all standardized images. Circular ROIs (10 mm in diameter) were defined for the statistically significant areas on the Z-score maps.
Results
Average PaCO2, PaO2, pH, blood pressure, and heart rate during each PET study are given in Table 1. Mean±s.d. arterial hemoglobin concentration and hematocrit during these studies were 14.5±0.7 g/dL and 42.9%±2.0%, respectively. No significant differences were observed in PaCO2, PaO2, pH, or blood pressure values between the baseline and neural activation studies.
PaCO2, PaO2, pH, blood pressure (BP), and heart rate (HR) during PET scanning (n=7)
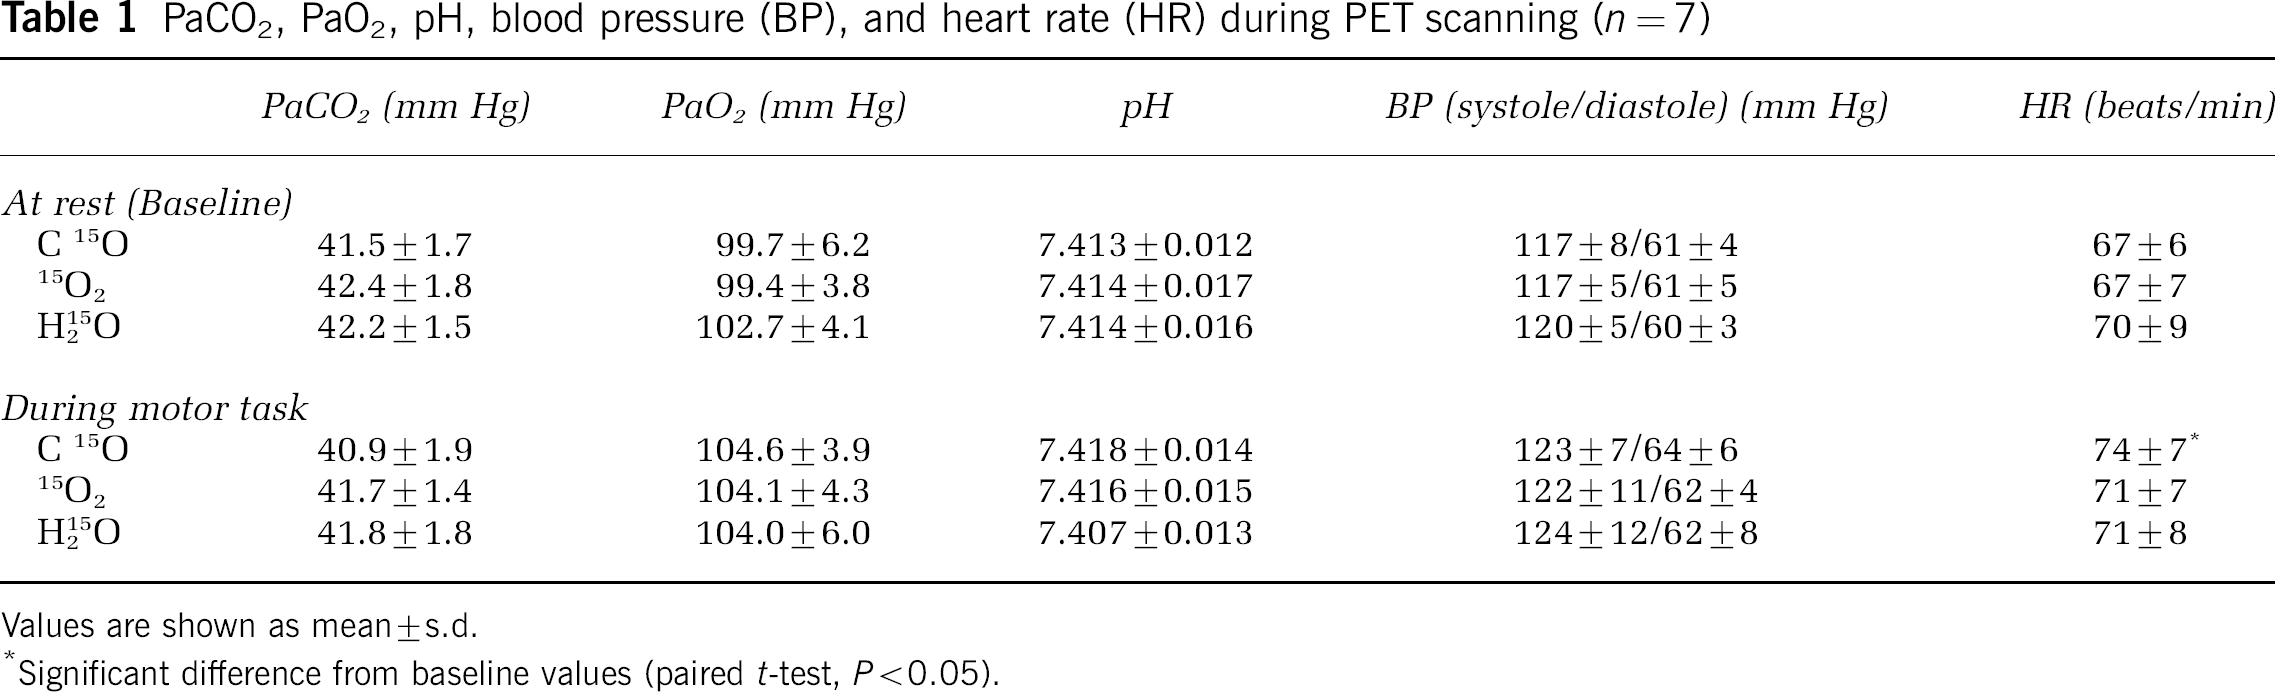
Values are shown as mean±s.d.
Significant difference from baseline values (paired t-test, P<0.05).
The coordinates of pixels depicting a significant relative increase or decrease in CBF are given in Table 2. Significant relative hyperperfusion indicating neural activation during the motor task activity was observed in the left precentral gyrus, left superior frontal gyrus, right precentral gyrus, right cingulate gyrus, and right cerebellum. Significant relative hypoperfusion indicating neural deactivations during the motor task activity was observed in the left anterior part of cingulate gyrus and right occipital cuneus.
Coordinates of pixels depicting a significant relative increase or decrease in CBF
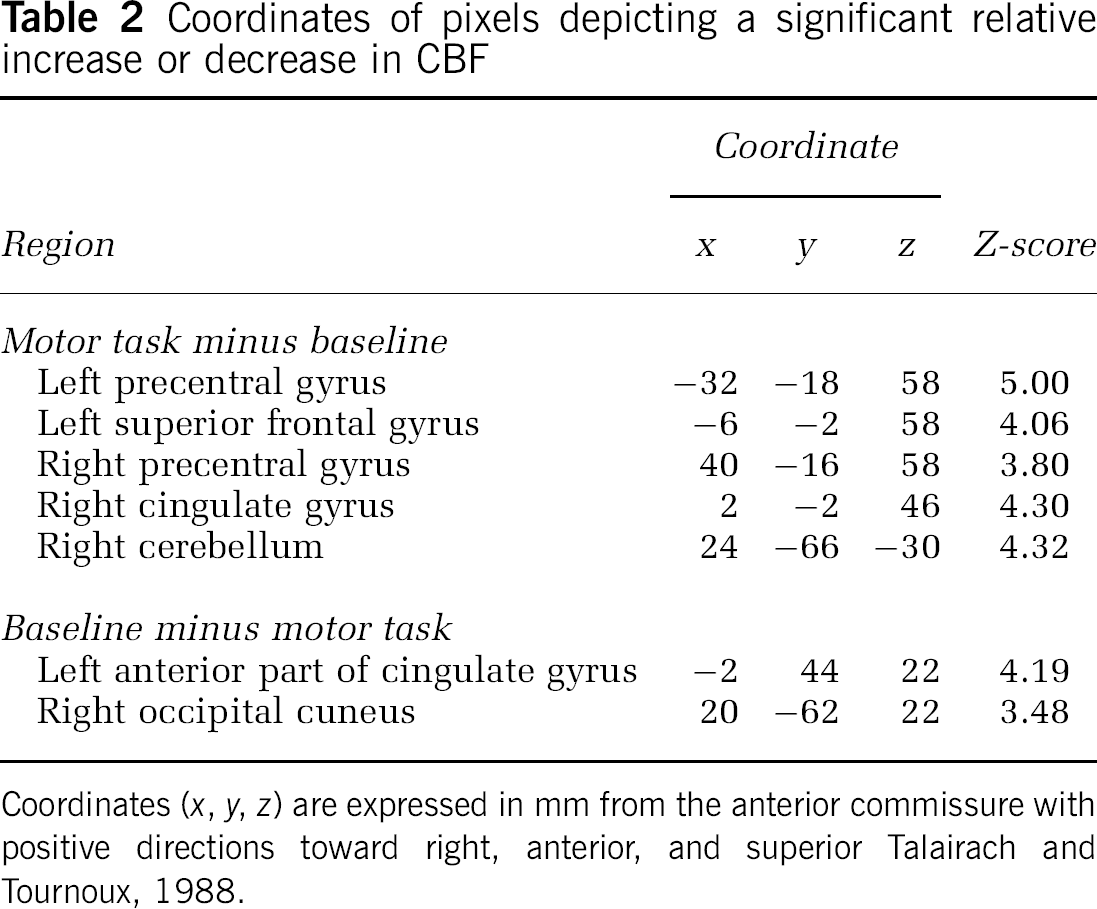
Coordinates (x, y, z) are expressed in mm from the anterior commissure with positive directions toward right, anterior, and superior Talairach and Tournoux, 1988.
Cerebral blood flow, CBV, OEF, CMRO2, and the BOLD signal at the baseline study and during the motor task for each ROI are given in Table 3. Percentage changes during motor task from baseline values are also given. In all regions showing neural activation (left precentral gyrus, left superior frontal gyrus, right precentral gyrus, right cingulate gyrus, and right cerebellum), a significant increase in CBF was observed. In the left precentral gyrus and left superior frontal gyrus, a significant increase in the BOLD signal and a significant decrease in OEF were observed. In regions showing neural deactivation (left anterior part of cingulate gyrus and right occipital cuneus), a significant decrease in CBF was observed.
CBF, CBV, OEF, CMRO2, and the BOLD signal at the baseline study and during the motor task for each ROI
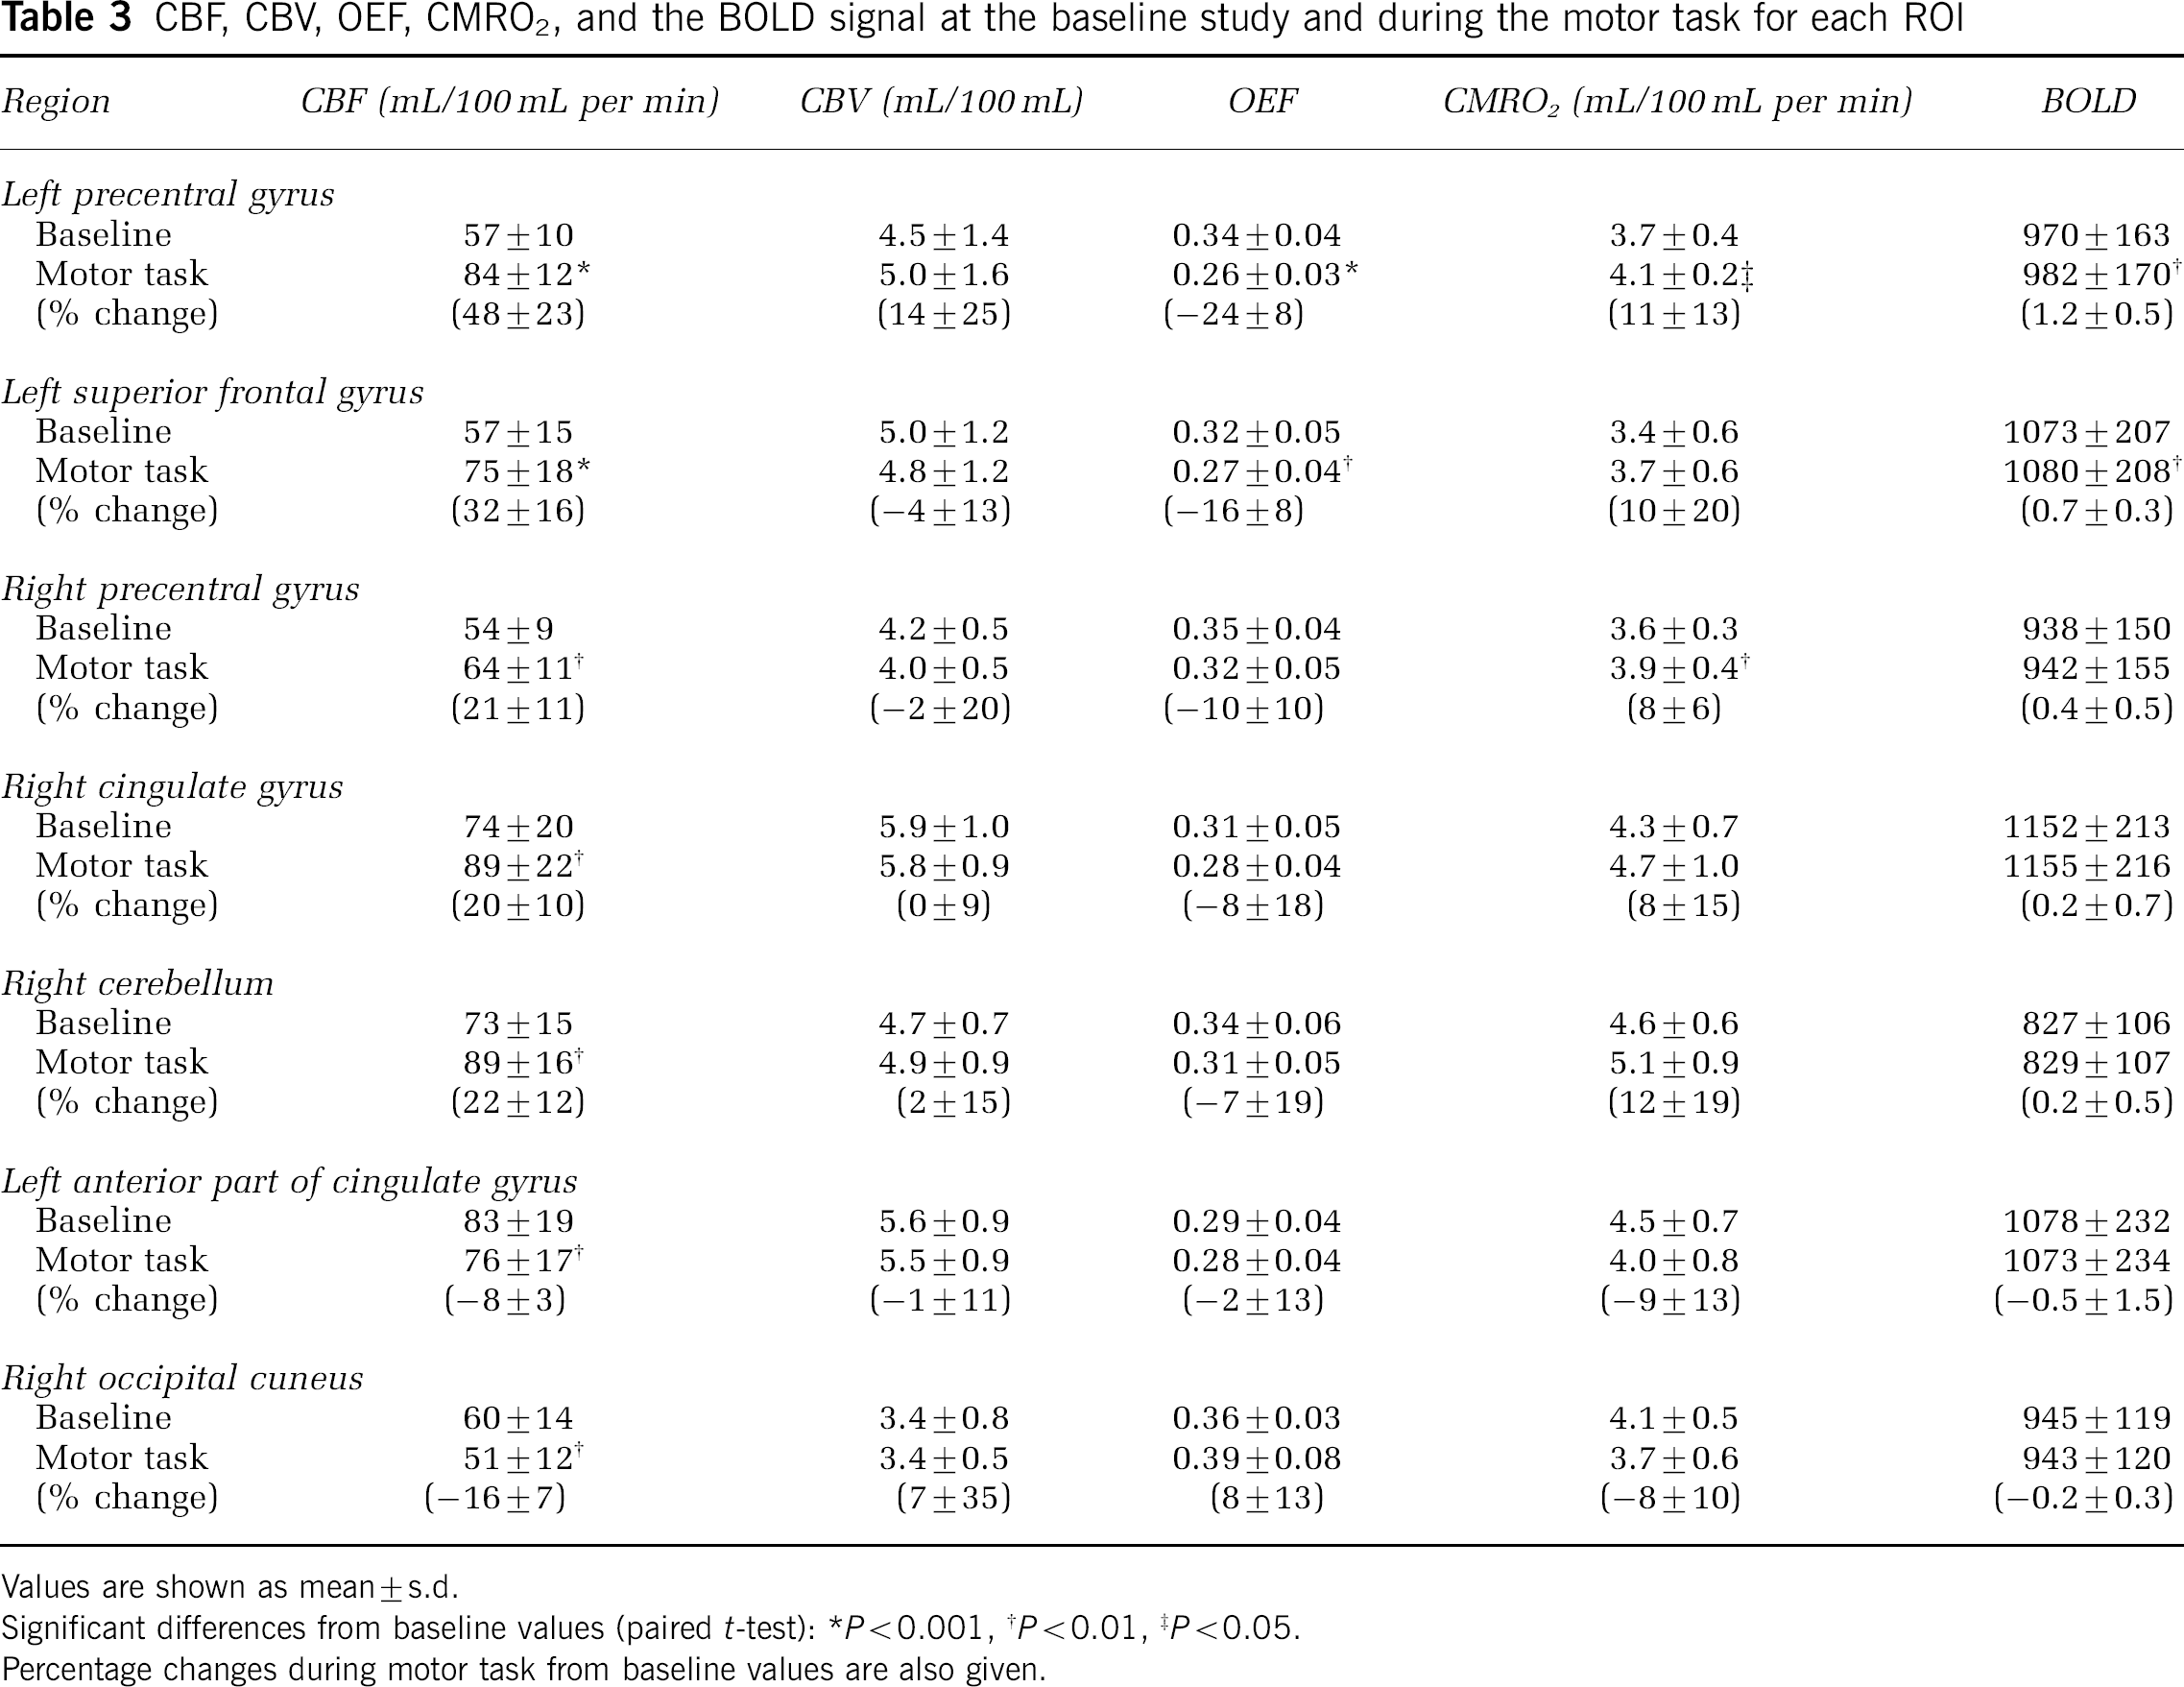
Values are shown as mean±s.d.
Significant differences from baseline values (paired t-test):
P<0.001,
P<0.01,
P<0.05.
Percentage changes during motor task from baseline values are also given.
Average images of CBF, CBV, OEF, CMRO2, and BOLD at the baseline study and during performance of the motor task are shown in Figure 1. The Z-score image for the motor task condition measurement minus the baseline measurement is also shown. Increases in CBF and CMRO2 and a decrease in OEF are apparent in the left precentral gyrus and left superior frontal gyrus.
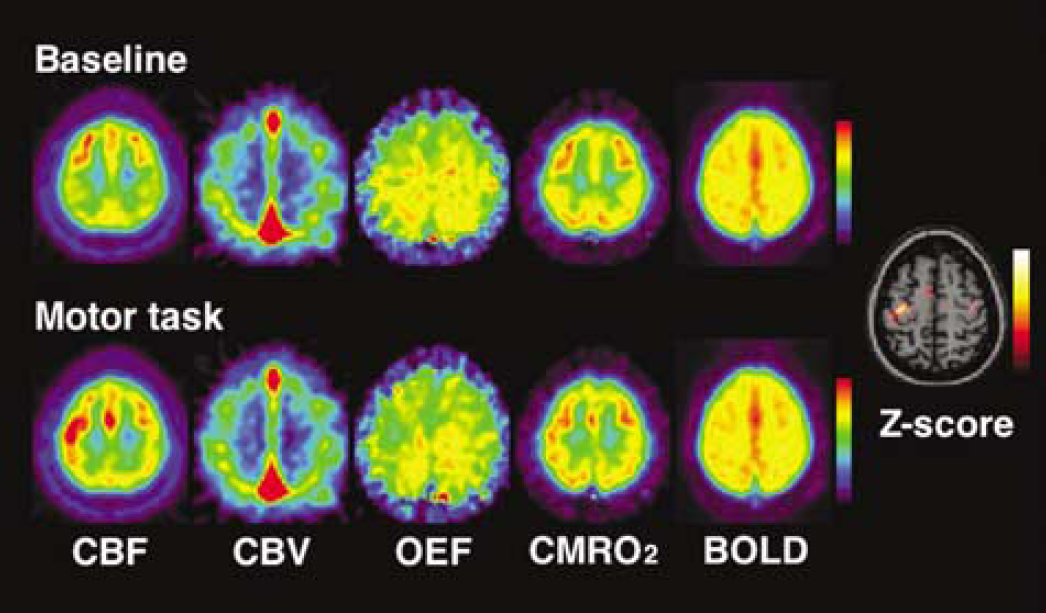
Average images of CBF, CBV, OEF, CMRO2, and BOLD at the baseline study and during performance of the motor task. Scale maximum and minimum values are 90 and 0 mL/100 mL per minute for CBF; 12 and 0 mL/100 mL for CBV; 0.5 and 0 for OEF; 5.5 and 0 mL/100 mL per minute for CMRO2; and 1300 and 0 for the BOLD signal, respectively. The Z-score image for the motor task condition measurement minus the baseline measurement is also shown. Scale maximum and minimum values for Z-score are 20 and 0, respectively.
The relations between average percentage changes in CBF, CBV, OEF, and CMRO2 and average percentage changes in the BOLD signal for all ROIs are shown in Figure 2. Significant positive correlation was observed between CBF and the BOLD signal, and between CMRO2 and the BOLD signal. Significant negative correlation was observed between OEF and the BOLD signal.
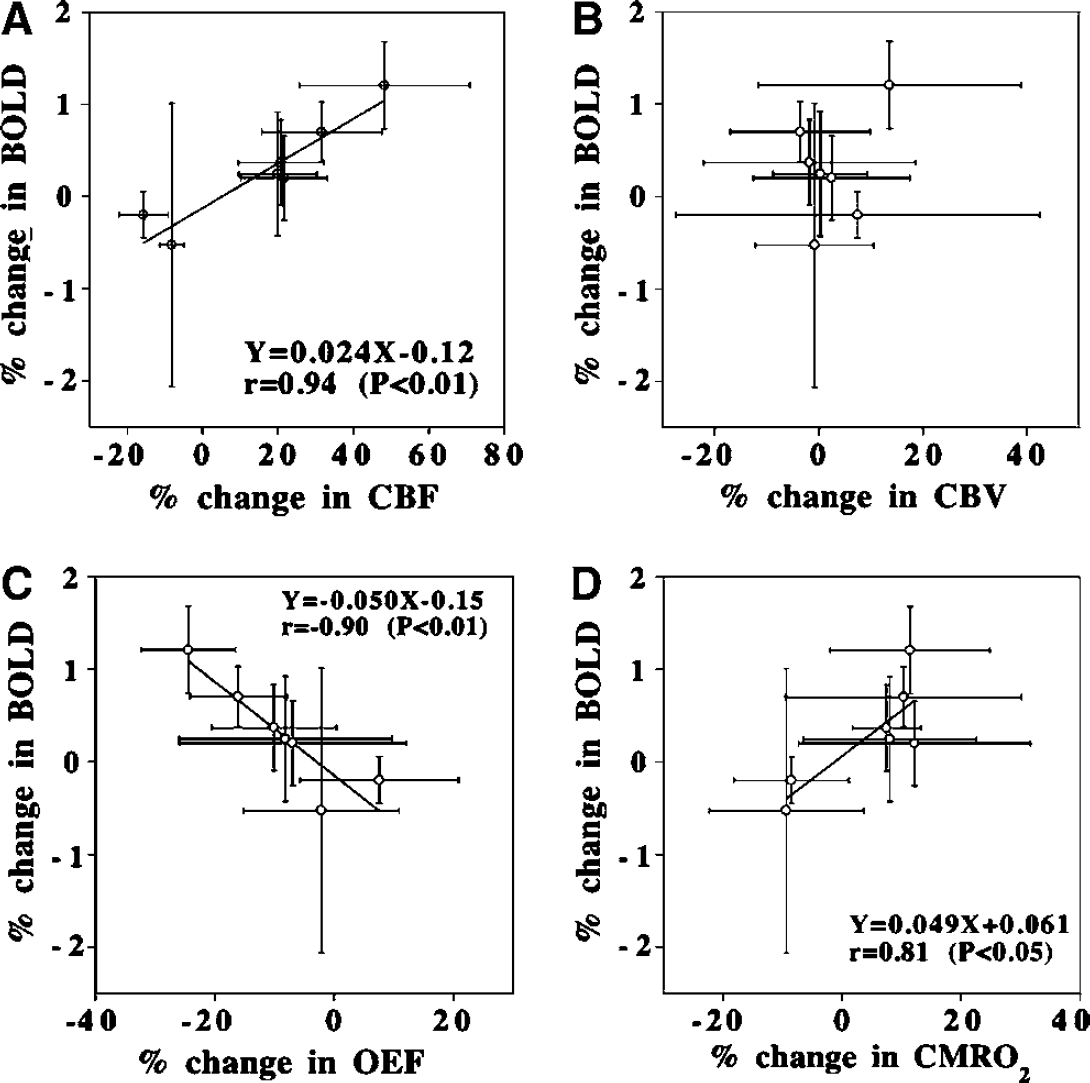
The relations between average percentage changes in CBF, CBV, OEF, and CMRO2 and average percentage changes in the BOLD signal for all ROIs. Values are mean±s.d. for each region. (
Discussion
During performance of the motor task, neural activation was observed on CBF images in the left precentral gyrus, left superior frontal gyrus, right precentral gyrus, right cingulate gyrus, and right cerebellum. These findings are in agreement with previously reported findings (Allison et al, 2000; Kawashima et al, 1993). A significant decrease in OEF was observed in the left precentral gyrus and left superior frontal gyrus. During neural activation, the increase in CBF is reported to be greater than that in CMRO2, resulting in a decrease in OEF (Fox and Raichle, 1986; Seitz and Roland, 1992; Vafaee and Gjedde, 2000). Our findings are consistent with the reported findings; however, ours is the only investigation in which three kinds of PET study (C15O, 15O2, and H215O) were performed under two conditions (at rest and during a motor task). During performance of the motor task, neural deactivation was observed on CBF images in the left anterior part of cingulate gyrus and right occipital cuneus. No significant change in OEF was observed in these regions. In another study, we conducted, an increase in OEF was observed during neural deactivation caused by crossed cerebellar diaschisis (Ito et al, 2002).
The discrepancy between the increases in CBF and CMRO2 during neural activation causes an increase in venous blood oxygenation that can be detected as BOLD contrast (Ogawa et al, 1990, 1992; Schwarzbauer and Heinke, 1999). In the present study, neural activation sites, that is, the left precentral gyrus and left superior frontal gyrus, showed a significant increase in the BOLD signal with a significant decrease in OEF, which corresponds to the ratio of CMRO2 to CBF. In neural deactivation sites, the BOLD signal decreased with no significant change in OEF. In all regions, a significant positive correlation was observed between changes in CBF and the BOLD signal, and a significant negative correlation was observed between changes in OEF and the BOLD signal. The relation between CBF and blood oxygenation during neural activation has been confirmed theoretically (Hathout et al, 1995). Our findings offer direct evidence of the relation between OEF and BOLD contrast during neural activation in humans and thereby support the assumption on which BOLD contrast studies are based (Raichle, 1998).
Changes in oxygen metabolism during neural activation have been investigated by measuring the BOLD signal by means of fMRI (Davis et al, 1998; Hoge et al, 1999; Kim et al, 1999; Kim and Ugurbil, 1997; Oja et al, 1999; Schwarzbauer and Heinke, 1999). The change in BOLD signal (T2*) can be expressed as follows (Davis et al, 1998; Ogawa et al, 1993; Schwarzbauer and Heinke, 1999):
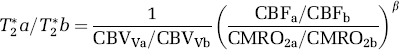
where the subscripts ‘b’ and ‘a’ denote the baseline and activation conditions; CBVV is the venous cerebral blood volume; and β is a scaling factor. Simulation studies suggest that this scaling factor, β, is 1<β<2 (Boxerman et al, 1995; Ogawa et al, 1993); however, no actual measurement of β has been reported. When CBV is used instead of CBVV (Ito et al, 2001a; Lammertsma and Jones, 1983; Mintun et al, 1984), β can be calculated from the present data. In the left precentral gyrus, β was 0.41, a value smaller than that estimated by the simulation studies.
In conclusion, changes in cerebral oxygen extraction fraction (OEF), which corresponds to the ratio of CMRO2 to CBF, and BOLD signal during neural activation were measured by PET and fMRI in the same human subject. A significant positive correlation was observed between changes in CBF and the BOLD signal, and a significant negative correlation was observed between changes in OEF and the BOLD signal. This supports the assumption on which BOLD contrast studies are based, that the discrepancy between increases in CBF and CMRO2 during neural activation causes an increase in venous blood oxygenation.
Footnotes
Acknowledgements
The assistance of members of the Akita Research Institute of Brain and Blood Vessels in performing the PET experiments is also gratefully acknowledged.