
Abstract
Neuronal activation results in increases in blood-oxygen-level-dependent (BOLD) signal increases in magnetic resonance images, increases in cerebral blood flow (CBF), and changes in tissue oxygenation. We hypothesized that transient hypertension concurrent with neuronal activation would interfere with the normal physiological responses to neuronal activation potentially leading to additive responses. Anesthetized rats were prepared for functional magnetic resonance imaging studies in which increases in BOLD signal were measured in response to: (1) electrical forepaw stimulation, (2) different graded levels of transient hypertension produced with norepinephrine, and both 1 and 2. In other experiments with a similar protocol, changes in CBF and cortical oxyhemoglobin (oxyHb) and deoxyhemoglobin (deoxyHb) were measured using Laser Doppler Flowmetry and near-infrared (IR) spectroscopy. BOLD signal within the sensory-motor cortex increased during forepaw stimulation. These matched increases in CBF and oxyHb and decreases in deoxyHb. During moderate or severe transient hypertension, there was a blood pressure-dependent increase in BOLD signal, CBF, and oxyHb; and a decrease in deoxyHb. When transient hypertension and forepaw stimulation were combined, the responses of oxyHb, deoxyHb, or BOLD signal were generally a summation of each response. In contrast, the CBF response to forepaw stimulation was relatively unaffected by transient hypertension. We conclude that during stimulation with concurrent hypertension, the normal changes in tissue oxygenation that accompany neuronal activation are enhanced by the increases produced by hypertension despite an excellent autoregulation of CBF. The latter could reflect highly transient decreases in oxygen consumption or likely a redistribution of flow through more nonexchange vessels.
Introduction
Functional magnetic resonance imaging (fMRI) continues to expand as a powerful technique for the study of the central nervous system (CNS), including clinical and experimental research areas of cognition or motor-sensory function in health and neurologic disease (Collette et al, 2006; Amaro and Barker, 2006). The ability of fMRI imaging to map brain function arises from the fact that neuronal activation is accompanied by changes in MRI signal intensity as a result of changes in tissue deoxy-hemoglobin (deoxyHb), termed blood-oxygen-level-dependent (BOLD) signal intensity changes. The neuronal activation evokes an increase in cerebral blood flow (CBF) that exceeds the increase in the rate of cerebral oxygen consumption (CMRO2), resulting in a decrease in the concentration of deoxyHb and consequently in an increase in BOLD signal (Buxton et al, 2004; Lauritzen, 2005; Nair, 2005). Thus, as with other functional brain-mapping methods, fMRI investigates central nervous system function via an indirect measure of changes in CBF produced by neuronal activation.
Many factors other than changes in neuronal activation can affect cerebral perfusion. A change in perfusion pressure is one such factor, yet the influence of blood pressure (BP) changes on the physiological response to neuronal activation remains poorly understood. We recently demonstrated that, with increasing levels of hypertension, there are significant numbers of voxels with changes in BOLD intensity that correlate to the transient hypertension. Furthermore, if moderate transient hypertension accompanied electrical forepaw stimulation, then there was also an enhancement of the activation detected (Wang et al, 2006). We suggested that this reflected an inefficient autoregulation of CBF that produced changes in tissue oxygenation and changes in BOLD signal independent of changes in tissue metabolism.
Presently, we hypothesize that transient hypertension concurrent with neuronal activation significantly interferes with the physiological responses due to neuronal activation and may even lead to additive responses. The response to neuronal activation was investigated by determining the forepaw stimulation-induced changes in BOLD signal intensity (measured using fMRI), the alterations in CBF (measured using Laser Doppler Flowmetry), and the alterations in deoxyHb and oxyHb (oxyhemoglobin, measured using near-Infrared Spectroscopy). We also examined systematically the effect of hypertension on these responses. The results show that changes in BOLD intensity, CBF, and oxy/deoxy Hb are produced in response to forepaw stimulation or an episode of moderate or extreme hypertension. When transient hypertension and forepaw stimulation are combined, the oxyHb, deoxyHb, and BOLD responses are essentially additive, whereas the CBF response to forepaw stimulation is much less affected by a change in BP.
Materials and methods
Functional Magnetic Resonance Imaging Experiment
Experiments were performed in accordance with guidelines provided by the Canadian Council on Animal Care and approved by the Animal Care Committees from National Research Council and the University of Calgary. Male Sprague—Dawley rats (310 to 335 g) (n = 15) were prepared for fMRI as described previously (Tuor et al, 2000). Briefly, the animal was prepared under isoflurane anesthesia (2% to 3% in 30% oxygen in nitrogen). Catheters in the femoral vein and artery were used to administer fluids, obtain arterial blood samples, and monitor mean arterial BP under isoflurane anesthesia. Rectal temperature was maintained at 37 ± 0.5°C with a circulating water blanket. The animal was ventilated via a cannula inserted into the trachea to maintain near normal arterial blood gases (e.g. PO2 of 90 to 120 mm Hg and PCO2 of 38 to 48 mm Hg) throughout the study. After completion of surgery, anesthesia was converted to α-chloralose (initial 80 mg/kg intravenous, supplemental 20 mg/mL every 45 mins; SIGMA, Oakville, Canada) and muscle relaxation was provided (pancuronium, 0.5 mg/kg every hour, intravenous, Sabex 2002 Inc., Boucherville, Canada). The animal was placed in a plastic cradle and the head was immobilized using ear pins and an incisor bar. Two silver needle electrodes were positioned beneath the skin of the dorsal and ventral forepaw and connected to a Grass Stimulator and isolation unit.
The animal was positioned in the centre of a 9.4 T 20 cm bore magnet (Magnex, UK) equipped with an Avance Bruker console (Bruker, Germany). Magnetic resonance imaging experiments were performed using an elliptical surface coil (24 mm × 18 mm) positioned over the forebrain. A scout image was used to select transverse slices through the sensory-motor and frontal cortex. Functional magnetic resonance imaging scans were acquired using a fast gradient echo sequence with
Baseline scans were acquired under normotensive conditions. The baseline BP scan consisted of a set of 32 images acquired without interventions. The baseline stimulation scan (Figure 1A) consisted of a set of 32 images that included two periods of electrical stimulation of the forepaw using a constant-current rectangular pulse of 3 Hz with 0.3 ms in duration. Stimulation was applied in an on/off sequence for six images off, seven on, six off, five on, and eight off. Stimulus amplitude was set at 3 to 6 mA according to the strength needed to produce a small twitch of the forepaw.
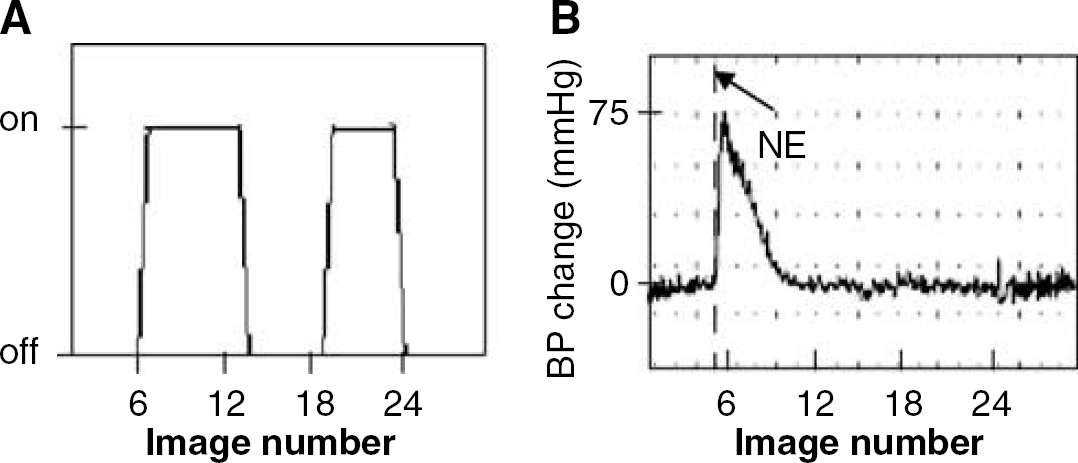
Examples of experimental paradigms for the electrical stimulation scan (
A change in BP scan (Figure 1B) consisted of a set of 32 images, where norepinephrine (NE, a vasoconstrictor, 0.15 to 1.2 μg/kg intravenous) was administered at the start of fifth image to produce a transient BP increase that reached a maximal level during the acquisition of images 6 to 8 with a subsequent gradual return to normal. The magnitude of BP change was randomized and subsequently analyzed within ranges of BP changes consisting of 1 to 30, 31 to 45, 46 to 60, > 60 mm Hg.
A Stimulation + BP change scan involved a simultaneous combination of the stimulation and change in BP scan. Again the ranges of BP increase varied randomly and were grouped as 1 to 30, 31 to 45, 46 to 60, > 60 mm Hg.
The region of interest chosen for fMRI analysis was the sensory-motor cortex. This region was selected to correspond to that of the Laser Doppler experiments. A correlation analysis was used to define voxels within sensory motor cortex with MR signal intensity changes correlating to the off/on/off/on/off stimulation paradigm (P < 0.001). The centroid time-course of the active voxels provided a measure of BOLD signal changes over time course which were presented as a percentage of the average intensity at each time instance with respect to a baseline computed as the average of the mean values of all cluster member time courses.
Laser Doppler and Near-Infrared Experiments
In a separate group of animals (n = 7), Laser Doppler and simultaneous Near-IR experiments were performed on the bench outside the magnet. Animals were prepared exactly as for the fMRI experiments except that during the surgical preparation, the skull was thinned with a drill during continuous irrigation with saline. Bleeding was stopped with bone wax. Cortical perfusion was measured using a Laser Doppler flowmeter (PF2b, Perimed, Stockholm, Sweden, wavelength of 632.8 nm) and a 1 mm diameter flow probe placed against the thinned skull over the sensory-motor cortex. For near-IR measurements, a transmit probe (Oriel, Stratford, USA), was positioned over the skull at bregma to transmit white light through the skull and cortex to a receiver probe placed ~ 3.5 to 4.0 mm lateral to bregma over the thinned skull. Thus, the two probes spanned the sensory-motor cortex and received light was sent to a near-IR spectrometer (Control Development Inc., South Bend, USA).
Laser Doppler Flow measures were collected continuously for each scan/experiment. At the same time, near-infrared spectra were averaged and acquired every second for a total of 320 secs corresponding to the same length of time as the fMRI scans. Exactly as for the fMRI experiments, four types of flow and spectral scans were acquired at increased BP values which ranged from 1 to 30, 31 to 45, 46 to 60, and > 60 mm Hg.
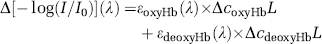
The near-IR spectra were analyzed using the components of the absorption spectra in the 750 to 1050 nm range. By far the strongest contributors in this near-IR range are oxyHb, deoxyHb, and water. The following expression was used only as the basis to estimate the optical pathlength:
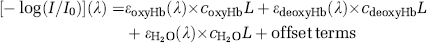
where the measured spectrum is [–log(I/I0)](λ)] and I is the measured single-beam spectrum and I0 the background spectrum collected with a reflectance standard in place of the sample. By using published absorptivity spectra εoxyHb, εdeoxyHb, and εH2O (Kou et al, 1993; Matcher et al, 1995) (http://omlc.ogi.edu/spectra/water/abs/index.html) and assuming the effective optical pathlength ʻLʼ to be constant with respect to both wavelength and time, we performed a least-squares reconstruction of the experimental spectrum from its components. The fitting coefficients are the products coxyHbL, cdeoxyL, and CH2O
This spectral component fitting program has been implemented following the procedure described by Matcher et al (1994, 1995) and validated by comparison of the reconstructed spectra with their measured counterparts.
Data Analysis
The responses to forepaw stimulation or hypertension were measured from the continuous traces as the maximal changes in BOLD signal, CBF, oxyHb, or deoxHb above baseline observed during either the first and second stimulation period or during the fluctuation produced by transient hypertension. For these measurements, levels were compared with the baseline measured in the 10 secs immediately before the start of stimulation or injection of norepinephrine. The sum of the changes in deoxyHb and oxyHb provided a measure of total hemoglobin concentration (tHb). Differences between mean fMRI BOLD signal intensity changes within the different BP ranges were assessed using statistical analysis software (Statistica, Tulsa, USA) and a one-way analysis of variance followed by a Duncan's multiple comparison versus a control level (the respective baseline group). A repeated analysis of variance was not possible for the fMRI experiments because data for all the BP ranges were not obtained for all animals. For Laser Doppler and Near-IR experiments, a repeated analysis of variance was possible and this was followed by a Duncan's multiple test against the respective baseline group (control). A Pearson correlation analysis was used to assess the relationship between changes in BP and changes in BOLD intensity, CBF, or oxyHb/deoxyHb. All data are presented as the mean ± s.d. Differences were considered significant at P < 0.05.
Results
The physiological parameters of the animals in the two different experimental preparations were within a normal range. Mean body weights were somewhat less in the fMRI group than the Doppler/Near-IR groups (327 ± 23 and 354 ± 32 g, respectively, P < 0.04). Before NE injection, mean arterial PO2 was 110 ± 15 and 103 ± 9 mm Hg, mean arterial PCO2 was 37 ± 6.5 and 41 ± 3 mm Hg, and mean arterial BP was 97 ± 11 and 89 ± 9 mm Hg in the fMRI and Doppler/Near IR groups, respectively (P > 0.05, comparison between preparations). The parameters measured remained rather stable during the experiments. For example, in the Near-IR group of animals, average PaO2 and PaCO2 and mean arterial BP, in mid-study were 103 ± 12, 44.6 ± 6 and 88 ± 14 mm Hg, respectively, and near the end of the study they were 98 ± 7, 45.6 ± 4, and 88 ± 17, respectively (P > 0.2, compared with that before NE injections).
Blood-Oxygen-Level-dependent, Cerebral Blood Flow, and Tissue Oxygenation Changes in Response to Forepaw Stimulation
Under baseline conditions, BOLD signal in sensory-motor cortex, cortical CBF, and cortical oxy/deoxy Hb levels were relatively steady. When there was an electrical stimulation of the forepaw, all rats demonstrated an activation response in the sensory motor cortex with a time course of BOLD signal changes that correlated to the stimulation paradigm (e.g. Figure 2A and Figure 2B). They also demonstrated alterations in their CBF and cerebral oxy/deoxy Hb in synchrony with the stimulation paradigm (Figure 2C and Figure 2D). Quantitatively, the BOLD signal during the first peak of stimulation period increased by 7.4% ± 2% over the level immediately before the start of stimulation and the amplitude changes were significantly greater than those of baseline without stimulation (P < 0.01). CBF and oxyHb increased, whereas deoxyHb decreased during the period of stimulation (changes of 49.2% ± 22%, 8.3 ± 5 μmol/L and 6.4 ± 4 μmol/L, respectively) (P < 0.05 versus baseline without stimulation). In comparison with the alterations in deoxyHb and oxyHb, the increase of tHb was less but significantly greater than baseline levels (1.9 ± 1 μmol/L, P < 0.05).
Blood-Oxygen-Level-Dependent, Cerebral Blood Flow, and Tissue Oxygenation Changes in Response to a Transient Hypertension
Blood pressure increased 4 to 75 mm Hg within 10 to 20 secs after administration of NE. In the fMRI experiments, analysis of the response within the sensory motor cortex demonstrated that there were a significant number of voxels that correlated to the BP time course, particularly when there were substantial increases in BP (e.g. Figure 2E and Figure 2F). In the Doppler and Near-IR experiments, all rats also had responses to hypertension consisting of an increase in CBF, an increase in oxyHb, and a decrease in deoxyHb with time courses corresponding to the change in BP profile (Figure 2G and Figure 2H). Unlike the profiles of oxyHb and deoxyHb, changes in tHb during hypertension were slight if detectable (Figure 2H).
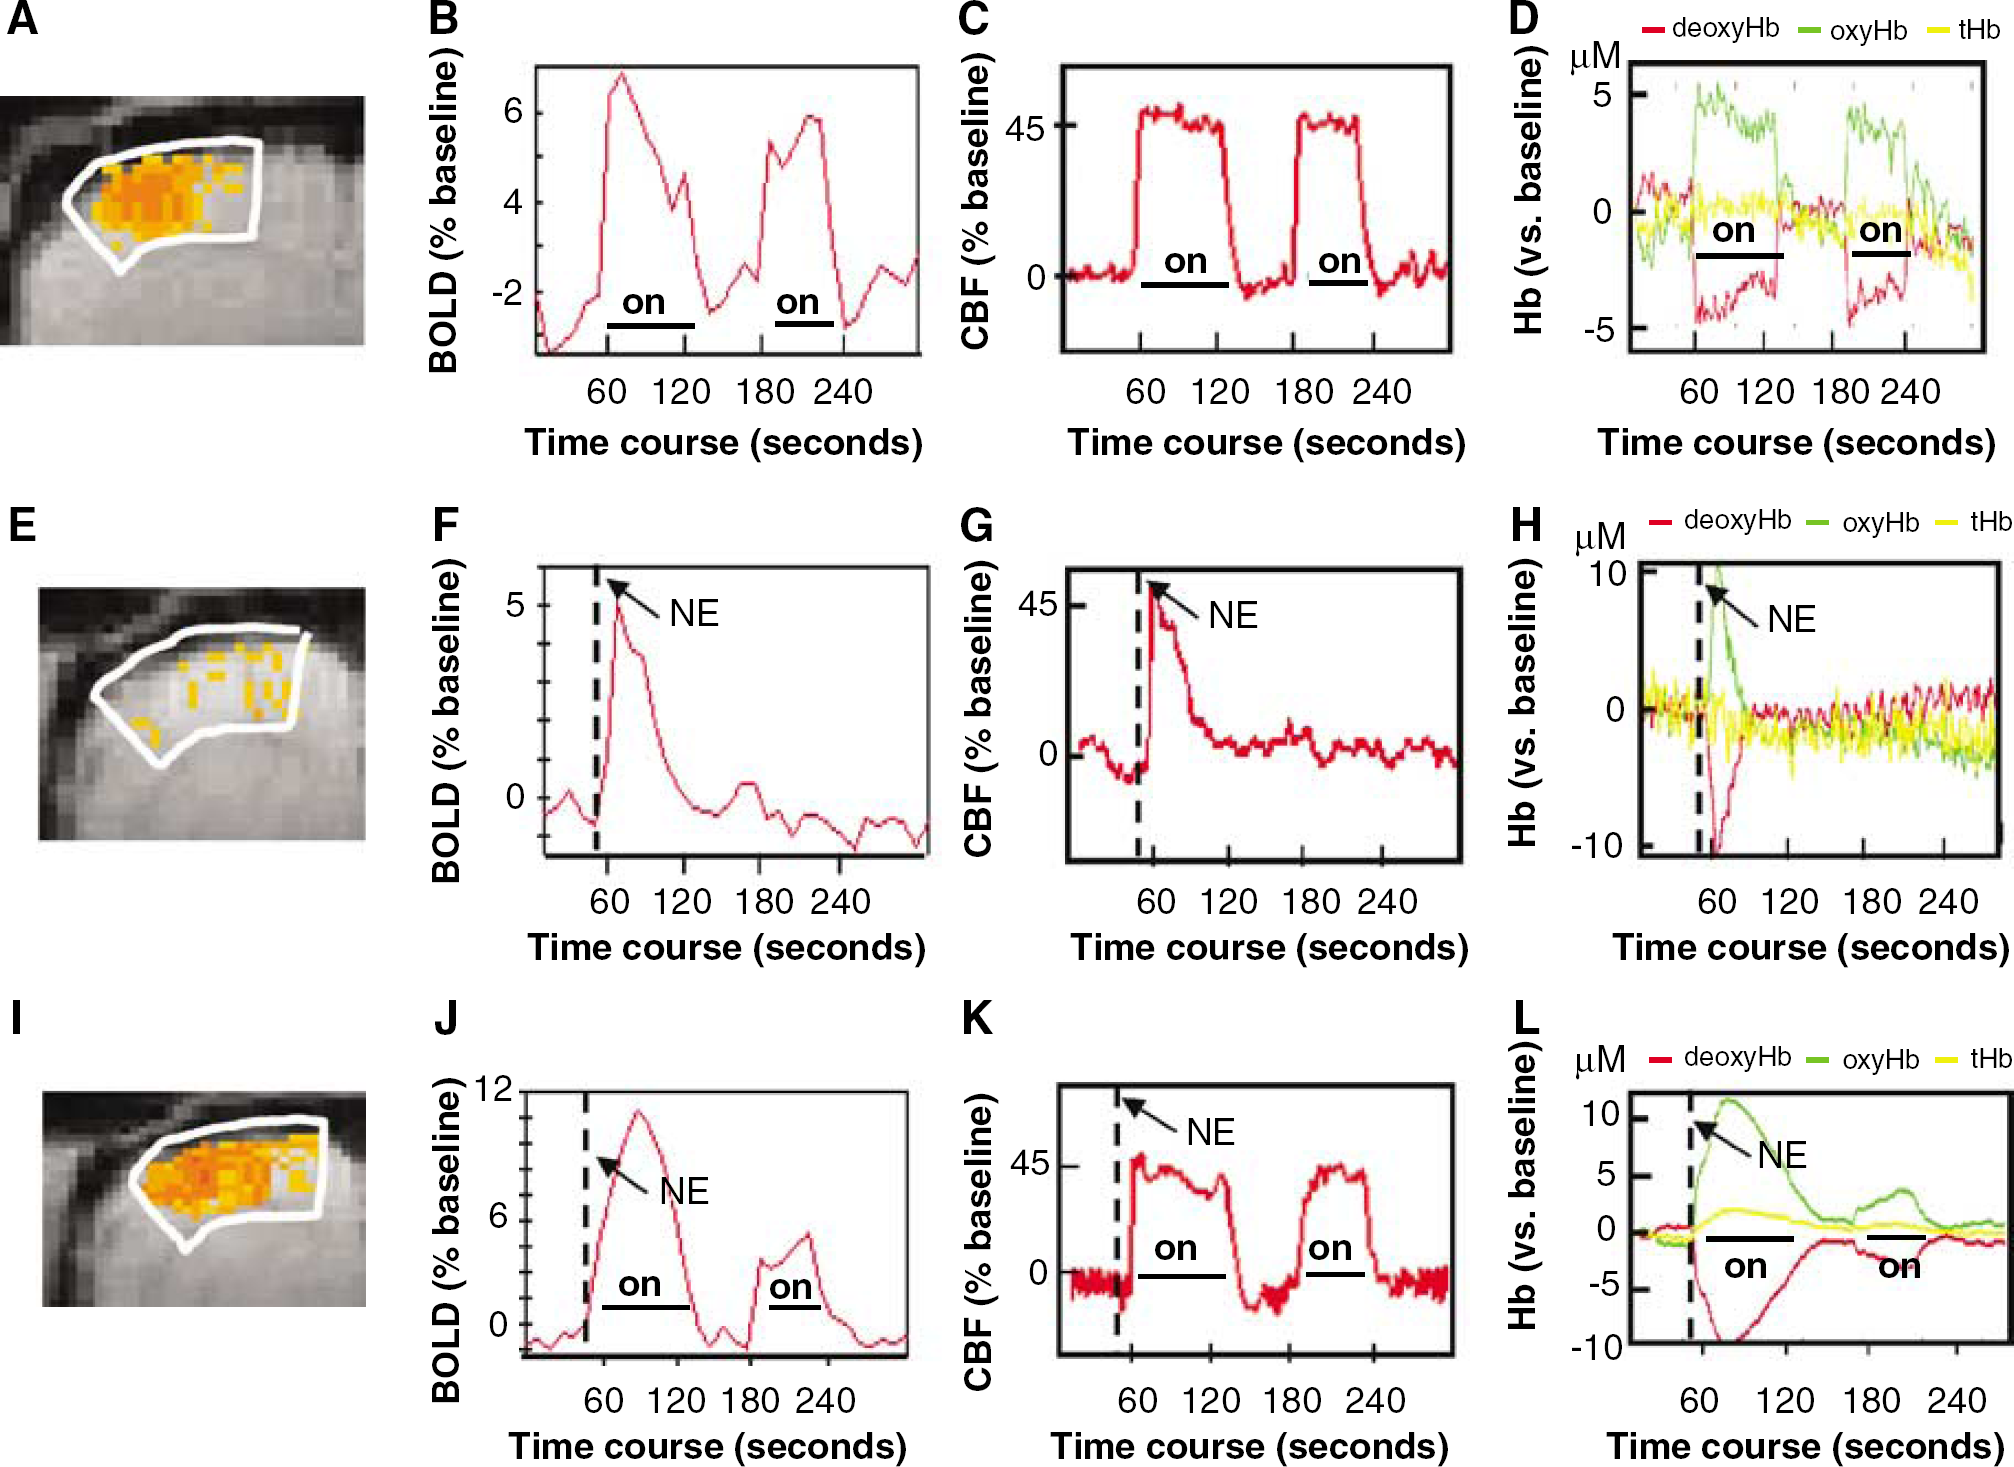
Representative responses to forepaw stimulation (
A quantitative analysis of the transient hypertension experiments demonstrated a dependence of the responses on the magnitude of the BP change (Figure 3). For the majority of BP ranges, mean BP was similar for the near IR and fMRI groups, the exception being the 1 to 30 and greater than 60 mm Hg ranges (P < 0.05). Changes in BOLD signal, CBF, and cortical oxy/deoxy Hb observed in response to transient hypertension were all dependent on the magnitude of the transient BP change. These responses to transient hypertension were generally significant already with moderate (31 to 45 mm Hg) changes in BP. In contrast, the amplitude of changes in tHb were much smaller and not significant until BP increased beyond 60 mm Hg.
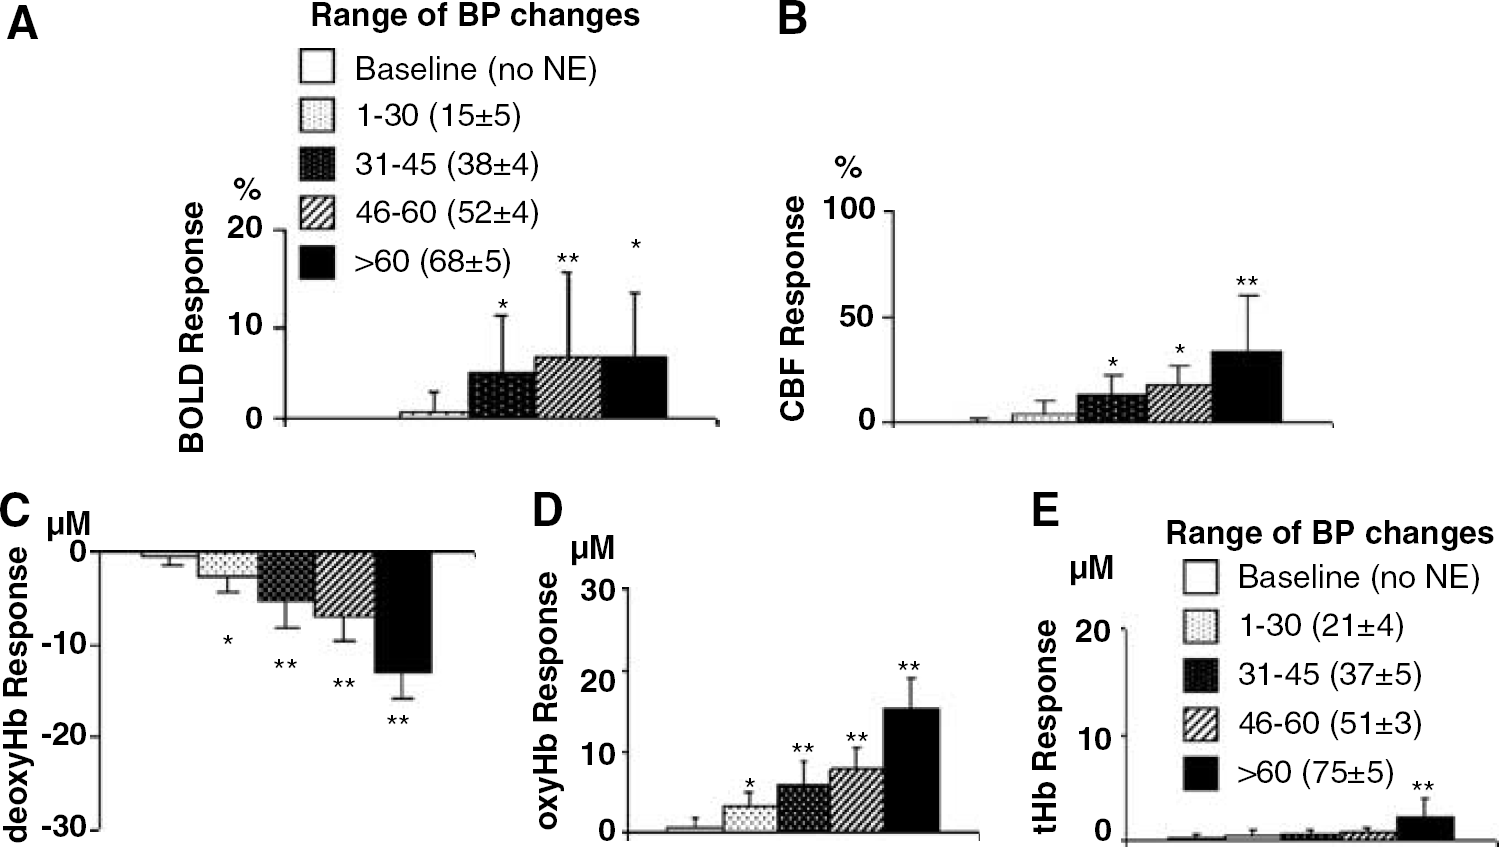
Mean responses to various levels of transient hypertension (blood pressure (BP) ranges of 1 to 30, 31 to 45, 46 to 60, > 60 mm Hg). There were pressure-dependent increases in BOLD signal (
Blood-Oxygen-Level-Dependent, Cerebral Blood Flow, and Tissue Oxygenation Changes in Response to Simultaneous Hypertension and Forepaw Stimulation
Norepinephrine was administered 10 secs before the start of the first period of stimulation so that the peak pressure increase overlapped with the first simulation. The profiles of changes in BOLD and oxy/deoxyHb followed a paradigm that approximated a combination of the BP and stimulation paradigms (Figure 2I and Figure 2J). In contrast, the time profile of the changes in CBF matched better the stimulation paradigm alone rather than a combination of the stimulation and BP paradigms (Figure 2K).
Quantitative comparison of the data grouped into mean BP ranges resulted in mean values in each range that were similar in the near IR and fMRI groups (Figure 4). Blood-oxygenation-level-dependent intensity changes seen with forepaw stimulation alone increased as the magnitude of transient hypertension increased (Figure 4A) (positive linear correlation, r = 0.6, P < 0.01). The BOLD intensity changes appeared to be a combination of the responses observed with transient hypertension and forepaw stimulation. For example, when BP changes exceeded 60 mm Hg, the maximal increase in BOLD signal intensity during the first peak reached 13% ± 5% which exceeded by 6% to that observed with stimulation alone, where this amount is similar to that observed with transient hypertension of > 60 mm Hg. Similarly, in the near-IR experiments, the response of oxyHb and deoxyHb to both stimulation plus hypertension was pressure dependent and together appeared to be a combination of each separate response (correlation of change to both stimuli with change in BP is r = 0.5, P < 0.01 and r = -0.5, P < 0.01, respectively) (Figures 4C and Figure 4D). In contrast, for the CBF response, there was no additional increase in CBF during forepaw stimulation with concurrent hypertension. Furthermore, the changes in BP and CBF were uncorrelated (r = 0.06, P = 0.7) (Figure 4B).
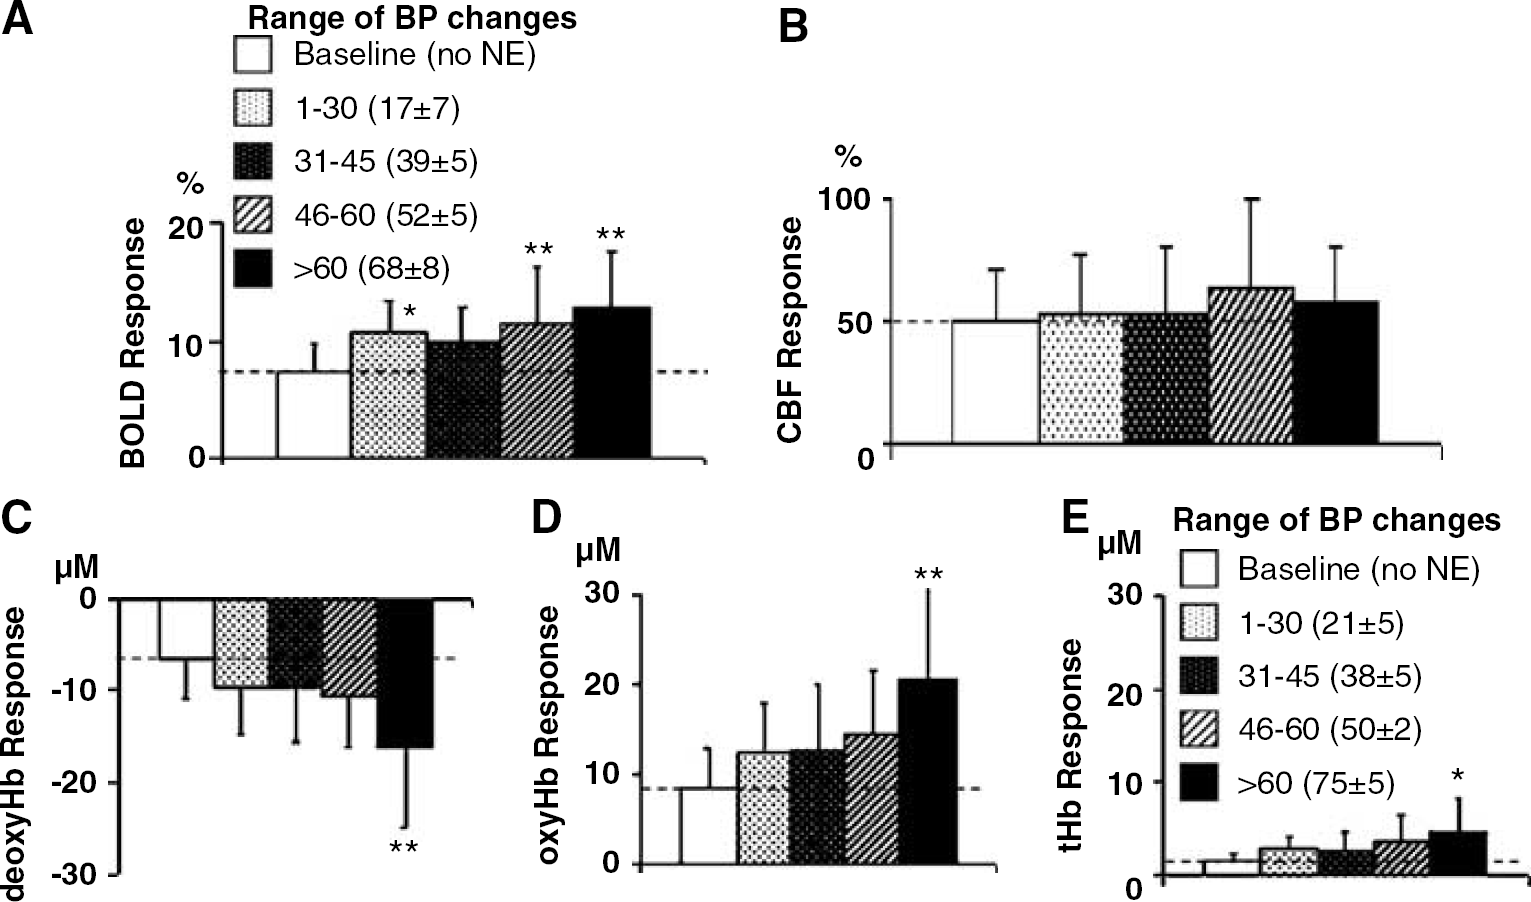
Mean responses to forepaw stimulation when combined with various levels of transient hypertension (blood pressure (BP) ranges of 1 to 30, 31 to 45, 46 to 60, > 60 mm Hg). Responses to forepaw stimulation alone (open bar, dashed line) were enhanced by transient hypertension for several of the measures including the maximal changes in BOLD signal (
To further assess the effect of BP on the responses with stimulation, the differences between the maximal responses observed for the first and second peaks from each individual animal were analyzed (Figure 5). As the magnitude of the BP change increased, the differences in responses between the first and second stimulation peaks increased for BOLD intensity, oxyHb, or deoxyHb. However, there were no differences in CBF between stimulations irrespective of the BP change.
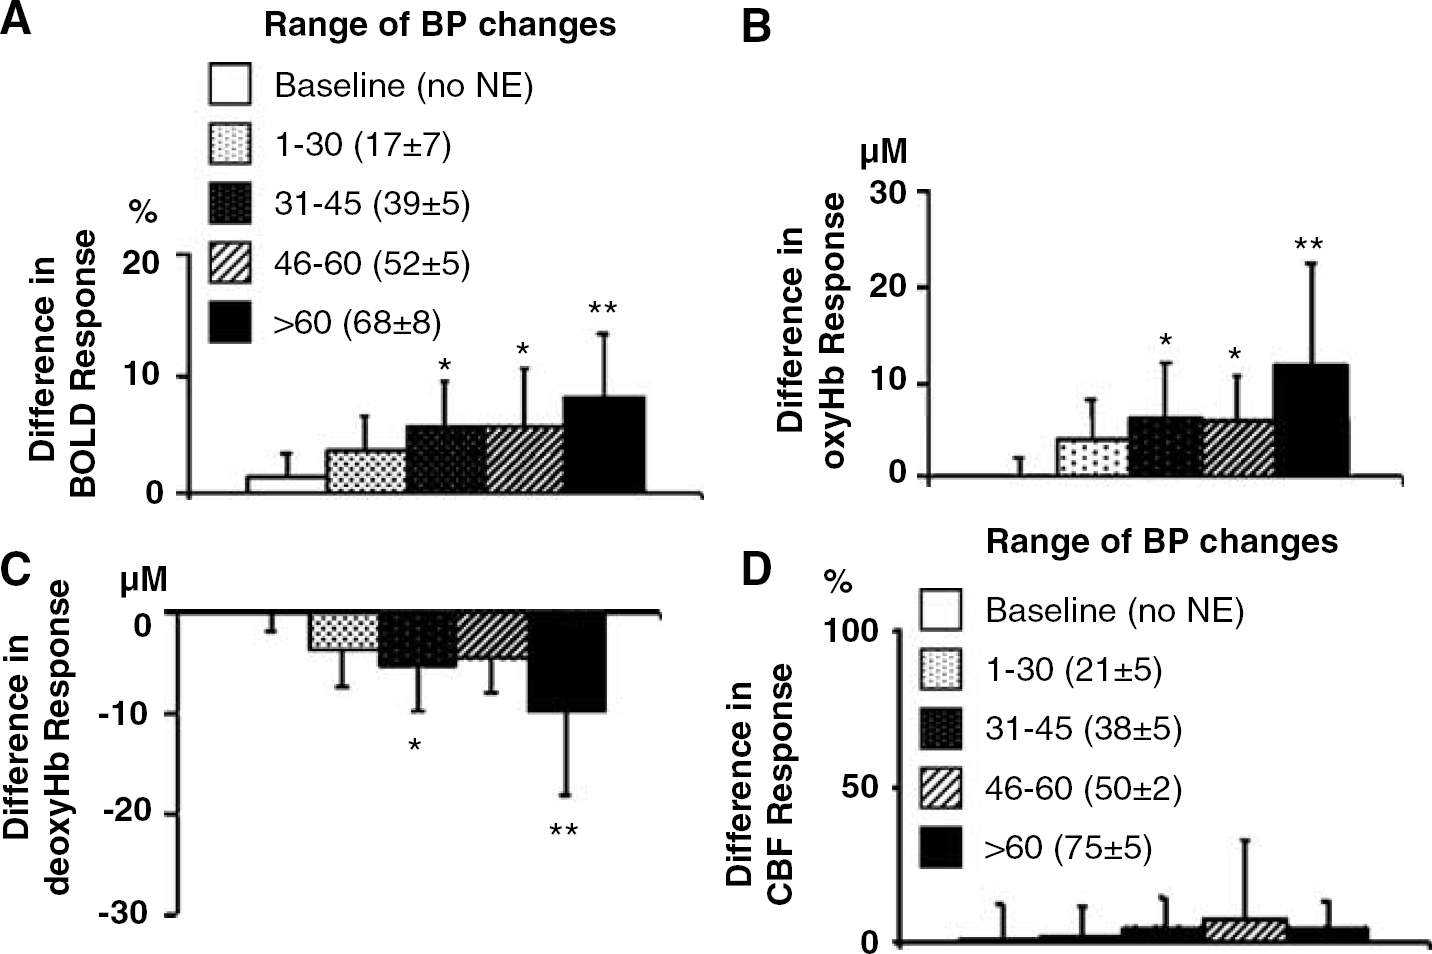
Comparison of the first and second responses to forepaw stimulation. Shown are the mean differences in amplitudes between the first peak (stimulation + hypertension) and the second peak (stimulation alone) for the different blood pressure (BP) ranges examined. The peak differences in BOLD signal (
Discussion
In the present study, we have confirmed that brain activation arising from forepaw electrical stimulation is detected with fMRI as an enhanced BOLD signal and this corresponds to increases in CBF and oxyHb and decreases in deoxyHb. Less studied has been the interaction of BOLD signal changes and hemodynamic responses. The results show that similar to the response to forepaw stimulation, transient hypertension produces changes in BOLD signal, CBF, and tissue oxy/deoxy Hb. The combined stimulation plus hypertension experiments show that during forepaw stimulation, the CBF activation response remains unaffected by a concurrent episode of transient hypertension (i.e. there is an excellent CBF autoregulation during stimulation). This is in contrast to hypertension without stimulation, where the BP increases produce transient increases in CBF and tissue oxygenation. Finally, the changes in BOLD signal and deoxyHb/oxyHb during hypertension plus stimulation are essentially an additive combination of the responses to hypertension and stimulation alone. Thus in fMRI studies where fluctuations in arterial pressure can be expected to accompany an activation task, the BOLD signal may be a combination of tissue oxygenation changes related to both the hypertension and the stimulation.
Coupling of Blood-Oxygen-Level-Dependent, Cerebral Blood Flow, and Tissue Oxygenation Changes in Response to Neuronal Activation
The majority of previous studies that have examined the correspondence between BOLD signal, CBF, and tissue oxygenation changes produced in response to tasks in fMRI studies have, similar to the present results, observed a correspondence between the stimulation paradigm and the CBF and oxy/deoxyHb changes (Hoge et al, 2005; Jones et al, 2001; Kennerley et al, 2005; Mehagnoul-Schipper et al, 2002). Indeed, the present response to forepaw stimulation resulted in sensory-motor increases in BOLD signal and CBF of approximately 7% and 49%, respectively. Although many factors can affect the magnitude of the response observed, these changes are essentially equivalent to those observed by Kida et al (2006) under similar stimulation and anesthesia conditions in the rat.
Changes in total hemoglobin are generally considered to provide an indication of the changes in cerebral blood volume. Presently, the tHb response to forepaw stimulation was less pronounced than the response of either deoxyHb or oxyHb. Indeed, changes in total Hb were 3 to 4 times smaller than the changes in cortical oxy/deoxy Hb as reported previously by others (e.g. Hoge et al, 2005; Kennerley et al, 2005; Mandeville et al, 1999). This is also consistent with the scaling relationship cerebral blood volume (CBV) ≈ CBF0.38 reported recently to occur during the response to whisker stimulation in the rat (Kennerley et al, 2005) and first reported in response to changes in PaCO2 in the monkey (Grubb et al, 1974).
Blood-Oxygen-Level-Dependent, Cerebral Blood Flow, and Tissue Oxygenation in Response to Transient Hypertension
Relatively few studies have investigated the influence of BP changes on BOLD intensity and to our knowledge none have combined these with a study of simultaneous measures of CBF and tissue oxy/deoxyHb. There is evidence that BOLD signal intensity can be reduced by hypotension and increased by hypertension induced with norepinephrine administration (Kalisch et al, 2001; Tuor et al, 2002; Wang et al, 2006; Zaharchuk et al, 1999). In the present study, we show that BOLD changes associated with transient hypertension are related to transient increases in CBF or an inefficiency of the CBF autoregulatory response. Under normal circumstances, CBF is maintained relatively constant by an active constriction or dilation of arterioles in response to a fairly wide range of increases or decreases in mean arterial BP (Paulson et al, 1990). However, the autoregulatory response is not necessarily immediate nor always entirely effective, particularly when there are sudden changes in pressure (Barzo et al, 1993; Czosnyka et al, 2003; Zhang et al, 1998). Note, that although norepinephrine, when administered extraluminally has vasoconstrictor effects, it is considered to have minimal direct effects on the cerebral vasculature if the blood—brain barrier is intact because it does not cross this barrier (Hardebo and Owman, 1980; MacKenzie et al, 1976; Moller et al, 2004).
The results also show that the increases in CBF and BOLD signal that accompany hypertension are reflected in transient changes in tissue oxyHb/deoxy Hb. This is in agreement with the increased CBF and brain tissue PO2 observed previously in patients following the intravenous infusion of norepinephrine (Johnston et al, 2005).
Lastly, the present BOLD signal changes produced by transient hypertension are not likely because of any substantial changes in cerebral blood volume. Increases in total Hb that are considered to reflect changes in cerebral blood volume were imperceptible for most BP ranges. It may be that with modest increases in BP, the vasoconstriction associated with the autoregulatory response during hypertension limits the total blood volume increases until pressure changes are extreme.
Blood-Oxygen-Level-Dependent, Cerebral Blood Flow, and Tissue Oxygenation in Response to Simultaneous Forepaw Stimulation and Hypertension
Not studied previously is the interaction between changes in CBF, BOLD, and tissue oxygenation when neuronal activation is accompanied by transient hypertension. Recently we reported an increased BOLD response and enhanced regional activation to electrical forepaw stimulation if this stimulation is accompanied by a transient hypertension (Wang et al, 2006). The relationship between the two and the hemodynamic changes involved in the responses observed were uncertain. The present results support the hypothesis that when hypertension is combined with forepaw stimulation, there is an interference in the normal physiological responses to neuronal activation so that the stimulation induced changes in BOLD signal and tissue oxygenation are additive with those produced in response to transient hypertension. This is illustrated by the supplemental hypertensive responses observed above stimulation alone (Figure 4) or when comparing the responses between the first and second stimulation periods (Figure 5).
Although both BOLD signal and tissue oxygenation measures were enhanced by BP changes during stimulation, CBF was unaffected by hypertension during forepaw stimulation. Indeed, the CBF response to stimulation was constant whether BP was increased. Furthermore, analysis of the flow changes in the same animal demonstrates that the CBF increase during the first stimulation period (with concurrent hypertension) was equivalent to the flow change during the second stimulation period (lacking a BP change). This suggests that when resting CBF is increased by neuronal activation, CBF autoregulation is more efficient, potentially as a result of an improved myogenic response under conditions of reduced vessel tone (Hudetz, 1997; Paulson et al, 1990). This may be supported to some extent by findings in recent studies that have observed changes in the dynamic and passive autoregulatory responses that vary depending on the frequency range being analyzed (Panerai et al, 2005).
The present results also indicate that the CBF response to forepaw stimulation is unaffected by transient hypertension, whereas the corresponding responses of oxy/deoxy Hb and BOLD signal are enhanced by hypertension. These differences are reliable considering that in each animal CBF and tissue oxygenation changes were measured simultaneously and the different conditions (stimulation + hypertension/stimulation alone) were investigated within minutes of each other in the same scan. Corroborating the tissue oxygenation results are the BOLD intensity changes which were acquired in different animals under identical conditions. Although this discrepancy is rather surprising, since an enhanced increase in tissue oxyHb (and a decrease in deoxyHb) is most readily explained by an increase in CBF independent of changes in CMRO2, there are several possible explanations to consider. First, the measurements of perfusion and near IR spectra are from somewhat different regions. The near-IR spectra reflect changes within a banana-shaped region between the two IR probes and likely include subcortical white matter or sagital sinus in addition to cerebral cortex. Note that the signal directly under the transmit probe consists of skull and CSF and thus is unlikely to contribute to the changes in the spectra. In contrast to the IR spectroscopy measures, cerebral perfusion is measured directly within sensory-motor cortex beneath the Doppler probe. Thus, for a global stimulus such as hypertension, there could be a dissociation between measured changes in oxy/deoxy Hb and CBF. Inconsistent with this explanation is that the BOLD changes, which are exclusively measured within sensory-motor cortex, also show an additive response of changes in response to forepaw stimulation and hypertension (e.g. Figure 5). Furthermore, there is an otherwise good correspondence between CBF and tissue oxygenation changes – i.e. in response to blood pressure changes alone (Figure 3). Thus, the near-IR oxygenation changes appear to represent those within sensory-motor cortex and regional sampling differences do not appear to readily explain the discrepancy between changes in CBF and changes in the other measures under conditions of stimulation plus hypertension.
A second possibility to consider is that during forepaw stimulation plus norepinephrine administration, there is a relative decrease in CMRO2. In general, norepinephrine administration is considered to have little direct effect on CMRO2 if the blood—brain barrier is intact (Hardebo and Owman, 1980; MacKenzie et al, 1976; Moller et al, 2004). There is some evidence for an indirect effect of norepinephrine, possibly via centrally mediated effects of hypertension, to produce a modest reduction in cerebral glucose utilization (Kuschinsky et al, 1983). This possibility may be supported further by the fact that oxy/deoxyHb measures appear to be more sensitive than CBF to norepinephrine administration alone (Figure 3). However, the reduction in glucose utilization or CMRO2 would need to be highly transient, in that the lack of correspondence between tissue oxygenation and perfusion changes is not apparent 2 mins following the combination of hypertension and stimulation (first peak), when there is stimulation alone (second peak).
A third possibility is that hypertension during functional activation may promote a non-nutrient distribution of flow through the cerebral capillaries. Cerebral capillaries are comprised of different types, including non-exchange capillaries. Also, the plasma and erythrocyte flow through the cerebral capillaries is heterogeneous (e.g. Hudetz, 1997; Kuschinsky and Paulson, 1992). Electrical stimulation decreases capillary flow heterogeneity and increases erythrocyte content and velocity (Schulte et al, 2003; Vogel and Kuschinsky, 1996). We suggest that when functional activation is accompanied by an additional hypertensive stimulus, there is an autoregulatory constriction of arterioles to prevent an increase in flow or red blood cell velocities but at the same time this is accompanied by a redistribution of red blood cells to non-exchange capillaries resulting in an increase in tissue oxyHb. This non-nutrient redistribution in capillary flow would be accompanied by decreases in flow through nutrient channels, such that the overall perfusion increase in the vascular bed detected with Laser Doppler remains at the level elicited by forepaw stimulation alone. Although this explanation is consistent with the present results, further experiments will be needed to determine definitively whether this or an altered CMRO2 or a combination of factors are involved in the enhanced tissue oxygenation response to forepaw stimulation plus hypertension.
Irrespective of the mechanism responsible, the results show that during neuronal activation, a concurrent episode of hypertension can enhance the cerebral physiological response to stimulation by an amount related to the response to hypertension alone. In humans, these results are relevant to the interpretation of fMRI studies, particularly in those investigations where transient hypertension occurs as a result of blood pressure reactions to behavioural challenges or stressors (e.g. increases of 20 to 30 mm Hg) (Allen et al, 1992; Carter et al, 2005; Critchley et al, 2000; Gianaros et al, 2005). Such sympathetically mediated autonomic increases in blood pressure involve norepinephrine release and thus may produce effects similar to the direct administration of norepinephrine. Nevertheless, considering that the autoregulatory response varies with the hypertensive agent and other factors (Myburgh et al, 1998; Paulson et al, 1990; Tuor and McCulloch, 1986), the general concepts rather than the absolute effects of hypertension on the BOLD signal and tissue oxygenation response should be applied to human studies. Thus, the increase in tissue oxygenation or enhancement of the BOLD signal observed presently, with even modest hypertension (< 30 mm Hg), may not be significant if cerebral autoregulation is better preserved in normal humans than rats. Conversely, such responses may be enhanced in patients with underlying cerebrovascular pathlogy where there is an inefficient autoregulatory response. Thus, in fMRI studies involving mental or physiological stresses, it is important to establish whether BP changes are evoked and if necessary investigate the efficiency of the autoregulatory response.
Footnotes
Acknowledgements
We gratefully acknowledge S Sea, K McAllister, and J Wamsteeker for their technical assistance.