
Abstract
Angiogenesis is an intricately regulated phenomenon. Its mechanisms in the ischemic brain have not been clearly elucidated. The authors investigated expression of angiogenesis-related genes using a complementary DNA (cDNA) array method as well as Western blotting and immunohistochemistry, and compared these studies with a temporal profile of angiogenesis in mouse brains after ischemia. The number of vessels significantly increased 3 days after injury, and proliferating endothelial cells increased as early as 1 day. This means that angiogenesis occurs immediately after the injury. Ninety-six genes implicated in angiogenesis were investigated with a cDNA array study. It was found that 42, 29, and 13 genes were increased at 1 hour, 1 day, and 21 days, respectively. Most of the well-known angiogenic factors increased as early as 1 hour. Vessel-stabilizing factors such as thrombospondins also increased. At 1 day, however, thrombospondins decreased to lower levels than in the control, indicating a shift from vascular protection to angiogenesis. At 21 days, many genes were decreased, but some involved in tissue repair were newly increased. Western blotting and immunohistochemistry showed findings compatible with the cDNA array study. Many molecules act in an orchestrated fashion in the brain after ischemia and should be taken into account for therapeutic angiogenesis for stroke.
Angiogenesis, the formation of new vessels caused by the sprouting of endothelial cells from preexisting vessels, occurs in a wide range of pathologic processes. Its role in pathophysiology is different in each disorder, and manipulation of new vessel formation can be an innovative means of therapy in some diseases. In tumors, neoplastic cells depend exclusively on newly formed tumor vessels (Folkman and Shing, 1992), and inhibition of angiogenesis significantly prevents tumor growth (Jain, 2001). Uncontrolled angiogenesis is a major cause of visual loss, and reduction of new vessel formation is effective as a treatment of retinopathies (Hammes et al., 1996). In ischemic diseases, in contrast, ischemic tissue is dependent on collateral blood flow, and new vessel formation should play a pivotal role in the strategy against ischemic injury. In myocardial and limb ischemia, angiogenesis occurs after the onset of disease and is considered an important phenomenon for tissue survival (Ware and Simons, 1997; Folkman, 1998; Wurzel and Goldman, 2000). Previous reports showed that the therapeutic potentiation of angiogenesis was quite effective in reducing experimental tissue injury in these disorders (Banai et al., 1994; Takeshita et al., 1994).
As for brain ischemia, it is well known that angiogenesis actually takes place (Wei et al., 2001). The number of new vessels in the ischemic penumbra is correlated to longer survival in patients with ischemic stroke; therefore, angiogenesis should be beneficial to the ischemic brain (Krupinski et al., 1994). There is no direct experimental evidence, however, showing that angiogenesis lessens tissue damage. Furthermore, previous reports that investigated the effects of the application of angiogenic factors in the ischemic brain have shown conflicting results; some reports showed that angiogenic factors ameliorated ischemic brain damage (Tanaka et al., 1995; Hayashi et al., 1998; Harrigan et al., 2002), but another showed their detrimental effects (Zhang et al., 2000). This may be due to the difference in the experimental paradigms. We are aware, however, that angiogenesis is an intricately regulated phenomenon that cannot be explained by focusing on only one molecule. Some molecules act in a synergistic manner (Asahara et al., 1995; Van Belle et al., 1998), some in a direct-opposed manner (Conway et al., 2001), and, interestingly, the effects of some molecules change with the existence of other molecules (DiSalvo et al., 1995; Holash et al., 1999; Conway et al., 2001). The earlier conflicting results could have been caused by expression of other angiogenic molecules that were different among those studies.
Angiogenesis is a process of step-wise progression. An increase in vascular permeability, degradation of the surrounding matrix, proliferation and migration of endothelial cells, and finally, stabilization and cessation of angiogenesis are all necessary steps (Conway et al., 2001). Consequently, many genes should be involved in this phenomenon. Previous reports showed that some angiogenic molecules were increased after cerebral ischemia, including vascular endothelial growth factor (VEGF) and its receptors (Kovacs et al., 1996; Hayashi et al., 1997; Plate et al., 1999; Marti et al., 2000), angiopoietins and their receptors (Beck et al., 2000; Lin et al., 2000, 2001), and other peptides with angiogenic properties (Kumon et al., 1993; Honda et al., 1995; Ohno et al., 1999). Many other molecules, however, could influence these angiogenic factors. With the development of complementary DNA (cDNA) array technology, we can now monitor parallel expression of many genes. In the present experiment, therefore, we performed a cDNA array study in which we investigated 96 angiogenesis-implicated genes and compared the results of this study with a temporal profile of new vessel formation in mouse brains after ischemia. We found that expression of thrombospondin, an antiangiogenic molecule, showed characteristic change. Therefore, we also performed Western blotting on, and immunohistochemical analysis of, this molecule. We also confirmed expression of some representative angiogenesis-related molecules by means of Western blotting and immunohistochemical analysis. The results of these studies were compatible with the cDNA array study, which indicated the reliability of the cDNA array experiment.
MATERIALS AND METHODS
Focal cerebral ischemia
All procedures were in accordance with the National Institutes of Health Guide for the Care and Use of Laboratory Animals and were approved by Stanford's Administrative Panel on Laboratory Animal Care.
With the use of adult male CD1 mice (35 to 40 g), we induced focal cerebral ischemia by intraluminal occlusion of the middle cerebral artery (MCA) using a nylon suture, as previously described (Murakami et al., 1998). In brief, the mice were anesthetized with 1.5% isoflurane, 68.5% nitrous oxide, and 30% oxygen using a face mask. The body temperature was monitored with a rectal probe and controlled at 37°C with a homeothermic blanket. A midline neck incision was made and the left external carotid artery was exposed. After electrocoagulation of its branches, an 11-mm 5–0 monofilament nylon suture with a blunted tip was introduced into the left internal carotid artery through the external carotid artery stump. After 30 minutes of ischemia, CBF was restored by removal of the nylon suture.
Complementary DNA array study
One hour, 1 day, and 21 days after CBF restoration, the animals were deeply anesthetized with isoflurane (n = 4 to 5). Sham-operated animals underwent exposure of carotid arteries without nylon suture insertion (n = 3). After decapitation, the brains were quickly removed and the MCA perfused territory was obtained. It was immediately frozen in powdered dry ice and kept at −80°C until used.
Extraction of total RNA was performed using TRIzol reagent (15596–026; Invitrogen, Carlsbad, CA, U.S.A.) in accordance with the instructions of the manufacturer. The concentration of RNA was assessed by an optical density (OD) ratio of 260:280 and with gel electrophoresis. Single-strand cDNA was synthesized by reverse transcription of the RNA (3 μg) at 42°C for 90 minutes with use of biotin-16-dUTP (1093070; Roche, Mannheim, Germany), M-MLV reverse transcriptase (M1701; Pro- mega, Madison, WI, U.S.A.), and primer mix from the cDNA array kit (MM-009N; SuperArray, Bethesda, MD, U.S.A.). Labeling, hybridization, and washing of the membrane were carried out according to the manufacturer's instructions. In brief, a nylon membrane, 3.8 × 4.8 cm, on which fragments of angiogenesis-related genes and housekeeping genes were printed (MM-009N; SuperArray), was prehybridized with salmon sperm DNA (15632–011; Invitrogen) and then hybridized with the cDNA solution obtained earlier. After 12 hours of incubation at 60°C, the membrane was washed twice in 2x salinesodium citrate (1x in 150 mmol/L NaCl, 15 mmol/L trisodium citrate, pH 7.0) with 1% sodium dodecyl sulfate (SDS) and twice in 0.2x saline-sodium citrate with 0.5% SDS. The membrane was then blocked with a solution from the kit and incubated with streptavidin-conjugated alkaline—phosphatase. Subsequently, the membranes were treated with CDP-star (MS050R; Applied Biosystems, Bedford, MA, U.S.A.) and exposed on x-ray film.
The film was scanned and densitometries were performed with use of Multi-Analyst software (ST32151N; Bio-Rad, Hercules, CA, U.S.A.). Briefly, grids were applied to each gene spot and the density was quantified with background signal subtraction. The spot density of the internal control housekeeping genes (i.e., β-actin and RPL13A) on the membrane was also determined, and the ratio of each gene to the housekeeping gene was calculated. This ratio was obtained from each animal, and the data from the ischemic brains at each time point were compared with those from the sham-operated brains.
Histologic evaluation
For histologic studies, the animals were deeply anesthetized with isoflurane 1 and 3 hours and 1, 3, 7 and 21 days after CBF restoration (n = 4 to 5). Sham-operated animals were also obtained (n = 3). The right cardiac atrium was cut and the brain was perfused with 5 U/mL heparinized saline through the left cardiac ventricle until colorless fluid was obtained. Subsequently, 4% paraformaldehyde in 0.1 mol/L phosphate buffer was perfused and the brain was then removed. After postfixation in 4% paraformaldehyde, the brain was sectioned at 50 μm with a vibratome and placed on glass slides. The brain tissue damage was evaluated by cresyl violet staining as previously reported (Murakami et al., 1998).
Immunohistochemistries
We performed immunohistochemistry for laminin, thrombospondin, VEGF, flk-1, angiopoietin-1, and angiopoietin-2. That for laminin was to investigate the number of vessels, and the others were for further investigation of the results of the cDNA array study. The sections used were the same as those for the cresyl violet study. The method was essentially the same as in previous reports (Hayashi et al., 1997; Murakami et al., 1998). Briefly, endogenous peroxidase activity was quenched by 30% methanol and 0.3% hydrogen peroxide in phosphate-buffered saline (PBS), and the tissue was treated with 0.2% pepsin in 0.01 mol/L HCl when necessary. After blocking nonspecific binding with 1% to 3% bovine serum albumin, the slides were incubated with primary antibodies at 4°C for 12 hours. Internal immunoglobulin G (IgG) within mice brain tissue was blocked with a MOM kit (BMK-2202; Vector Laboratories, Burlingame, CA, U.S.A.) when necessary. The primary antibodies used and each dilution were as follows: rabbit polyclonal antilaminin antibody (10765; Cappel, Aurora, OH, U.S.A.) at 1:50 dilution, rabbit polyclonal anti—thrombospondin-1 antibody (01–20–201319; Athens Research & Technology, Athens, GA, U.S.A.) at 1:500, mouse monoclonal anti-VEGF antibody (05–443; Upstate Biotechnology, Lake Placid, NY, U.S.A.) at 1:100, rabbit polyclonal anti-flk-1 antibody (sc-505; Santa Cruz Biotechnology, Santa Cruz, CA, U.S.A.) at 1:100, mouse monoclonal anti—angiopoietin-1 antibody (ANG11-A; Alpha Diagnostic, San Antonio, TX, U.S.A.) at 1:100, and mouse monoclonal anti—angiopoietin-2 antibody (ANG21-A, Alpha Diagnostic) at 1:300. The slides were washed and then incubated with biotinylated secondary antibodies at 1:200 dilution in PBS. The secondary antibodies were biotinylated mouse monoclonal antirabbit IgG (B3275; Sigma, St. Louis, MO, U.S.A.) or biotinylated antimouse IgG antibody from a horse (BA-2000; Vector Laboratories). They were subsequently incubated with avidin—biotin—peroxidase complex (PK-6100; Vector Laboratories) for 30 minutes and then developed using diaminobenzidine as a color substrate. Methyl green was used for counterstaining.
Fluorescent double staining
We performed double staining for the Ki67 antigen, a replicating cell marker, and Lycopersicon esculentum lectin, an endothelial cell marker, to quantify endothelial cell proliferation. In addition, we applied this method to further confirm that endothelial cells were positively stained for VEGF and angiopoietins. The sections used were the same as those prepared for the cresyl violet study. After pretreatment with pepsin and blocking of nonspecific binding, the sections were incubated with primary and secondary antibodies. The primary antibodies were the same as those described previously or a mouse monoclonal anti-Ki67 antigen antibody (RTU-Ki67-MM1; Novocastra, Newcastle, U.K.). They were then incubated with avidin-conjugated fluorescein isothiocyanate (FITC; A-2001; Vector Laboratories). The sections were then incubated in the excess avidin, followed by incubation with the excess biotin (SP2001; Vector Laboratories) in order to block nonspecific double labeling. They were incubated with biotinylated L esculentum lectin (B-1175; Vector Laboratories) at 1:200 dilution and then with avidin-conjugated Texas red (A-2006; Vector Laboratories). Fluorescence was observed at excitation of 495 nm and emission of > 515 nm for FITC, and excitation of 510 nm and emission of > 580 nm for Texas red.
Detection of endothelial cells undergoing apoptosis
We combined terminal deoxynucleotidyl transferasemediated dUTP-biotin in situ nick end labeling (TUNEL) and staining with L esculentum lectin to detect endothelial cells undergoing apoptosis. The sections used were the same as those prepared for the aforementioned histologic study. For the TUNEL study, we used a commercial kit (S7110; Intergen, Purchase, NY, U.S.A.). After pretreatment with 0.2% pepsin, the sections were incubated with terminal deoxynucleotidyl transferase and digoxigenin-conjugated nucleotides at 37°C for 1 hour. The sections were then incubated with FITC-conjugated antidigoxigenin antibody, and cells undergoing apoptosis were labeled. The sections were then incubated with biotinylated L esculentum lectin, followed by incubation with avidin-conjugated Texas red. Fluorescence was observed at excitation of 495 nm and emission of > 515 nm for FITC, and excitation of 510 nm and emission of > 580 nm for Texas red.
Western blotting analysis
To confirm the change in thrombospondin, VEGF, flk-1, and angiopoietin expression at the protein level, we carried out Western blotting analysis. The animals were decapitated 1 and 3 hours, and 1, 3, 7, and 21 days after CBF restoration under deep anesthesia with isoflurane (n = 4). Samples from sham-operated animals were also obtained (n = 4). The brain tissue was cut into coronal slices 2-mm thick, and the cerebral cortex and caudate of the MCA territory were separately removed. The samples were quickly frozen in powdered dry ice and kept at −80°C until used.
For protein extraction, the tissue was homogenized with about seven volumes of protein extraction buffer (20 mmol/L HEPES potassium hydroxide [pH 7.5], 250 mmol/L sucrose, 10 mmol/L potassium chloride, 1.5 mmol/L magnesium chloride, 1 mmol/L edetic acid, 1 mmol/L ethyleneglycotetraacetic acid, and 0.7% protease inhibitor cocktail [P8340; Sigma]). The homogenate was centrifuged at 10,000g for 15 minutes at 4°C, and the supernatant was used for this study. Assays to determine the protein concentration were performed by comparison with a known concentration of bovine serum albumin using a kit (23227; Pierce, Rockford, IL, U.S.A.).
Sodium dodecyl sulfate—polyacrylamide gel electrophoresis was performed according to previous reports (Hayashi et al., 1997; Noshita et al., 2001). In brief, a lysate equivalent to 5 μg protein from each fraction was run on the gel for 120 minutes at 120 V together with a size marker (RPN800; Amersham, Piscataway, NJ, U.S.A.). The protein on the gel was subsequently transferred to a polyvinylidene fluoride transfer membrane (LC2002; Invitrogen) in a buffer containing methanol, glycine, Tris base, and SDS. After the transfer, the membrane was placed in 3% to 10% powdered milk in Tween PBS (PBS with 0.1% Tween 20 [Bio-Rad]) for 1 to 4 hours to block nonspecific binding. It was then incubated with primary antibodies for 12 hours at 4°C. The primary antibodies used were the same as those used for immunohistochemistry, except for the anti-VEGF antibody, for which we used rabbit polyclonal antibody (AB1876; Chemicon, Temecula, CA, U.S.A.). The dilution was 1:400 for thrombospondin-1, 1:2000 for VEGF, and 1:1000 for flk-1, angiopoietin-1, and angiopoietin-2. After washing, the membrane was incubated with horseradish peroxidase-conjugated antimouse IgG (PI2000; Vector Laboratories) or horseradish peroxidase-conjugated antirabbit IgG (7074; Cell Signaling, Beverly, MA, U.S.A.) at 1:200 dilution for 60 minutes. The signal was then detected with a chemiluminescent kit (RPN2132; Amersham). Multi-Analyst software (Bio-Rad) was used for data analysis.
Quantification and statistical analysis
In the cDNA array study, the relative density of each gene spot against the housekeeping gene was calculated as described previously. This ratio was used as data, and those obtained from each time point were compared with those from the shamoperated group using a t-test. The gene spot that showed a P value smaller than 0.05 was considered statistically significantly changed. The relative ratio of the two ratios (ratio of each time point to ratio of control) was expressed as mean ± SD.
In the vessel number analysis, the vessels stained for laminin were counted in the entire area of the left cerebral cortex or caudate of the MCA territory at x40 magnification. The number of vessels in each area was then divided by the size of the contralateral cerebral cortex or caudate. In this way we avoided the effect of tissue swelling or shrinkage on the vessel counting. The results were expressed as number/mm2. Student's t-test was performed and the number of vessels was considered as having undergone a statistically significant increase when the P value was smaller than 0.05 compared with the sham-control group. The number of Ki67-positive and TUNEL-positive endothelial cells was counted as previously described (Murakami et al., 1998; Noshita et al., 2001). As with the vessel-counting study, the effect of tissue swelling or shrinkage was also taken into account in these studies. A P value smaller than 0.05 was considered to be statistically significant. Evaluation of the results of Western blotting studies was carried out according to our previous report (Noshita et al., 2001).
RESULTS
Complementary DNA array study
Among 96 genes implicated in angiogenesis, 42 (43.8%) were increased 1 hour after CBF restoration, with statistical significance (Table 1). No genes showed a decrease to a statistically significant degree. Vascular endothelial growth factor and its receptors (flk-1 and FMS-like tyrosine kinase), which play a pivotal role in endothelial cell replication (Leung et al., 1989), were increased at this time point. Hypoxia-inducible factor 1, which is responsible for VEGF induction (Forsythe et al., 1996), was also increased. Angiopoietins, which further increased later, already showed an increased level at this time point. Induction of endothelial nitric oxide synthase (eNOS) and cyclooxygenase-1 (COX1) indicates their involvement in the early phase of angiogenesis. Metalloproteinases were induced as well, which means that tissue degradation began this early (Asahi et al., 2000). Growth factors such as fibroblast growth factor (FGF), transforming growth factor (TGF), hepatocyte growth factor (HGF), platelet-derived growth factor (PDGF), and epidermal growth factor were also increased. Induction of vascular cell adhesion molecule-1, cadherin 5, and platelet/endothelial cell adhesion molecule should be related to infiltration of inflammatory cells (Lindsberg et al., 1996). Ephrins and thrombospondins showed an increased level, and this is the first report to demonstrate induction of these molecules in the brain after ischemia (discussed later). Overall, growth factors and their receptors, vascular permeability—regulating molecules, proteinases for surrounding tissue degradation, and adhesion molecules were already induced at this quite early time point.
Genes that increased 1 hour after ischemia
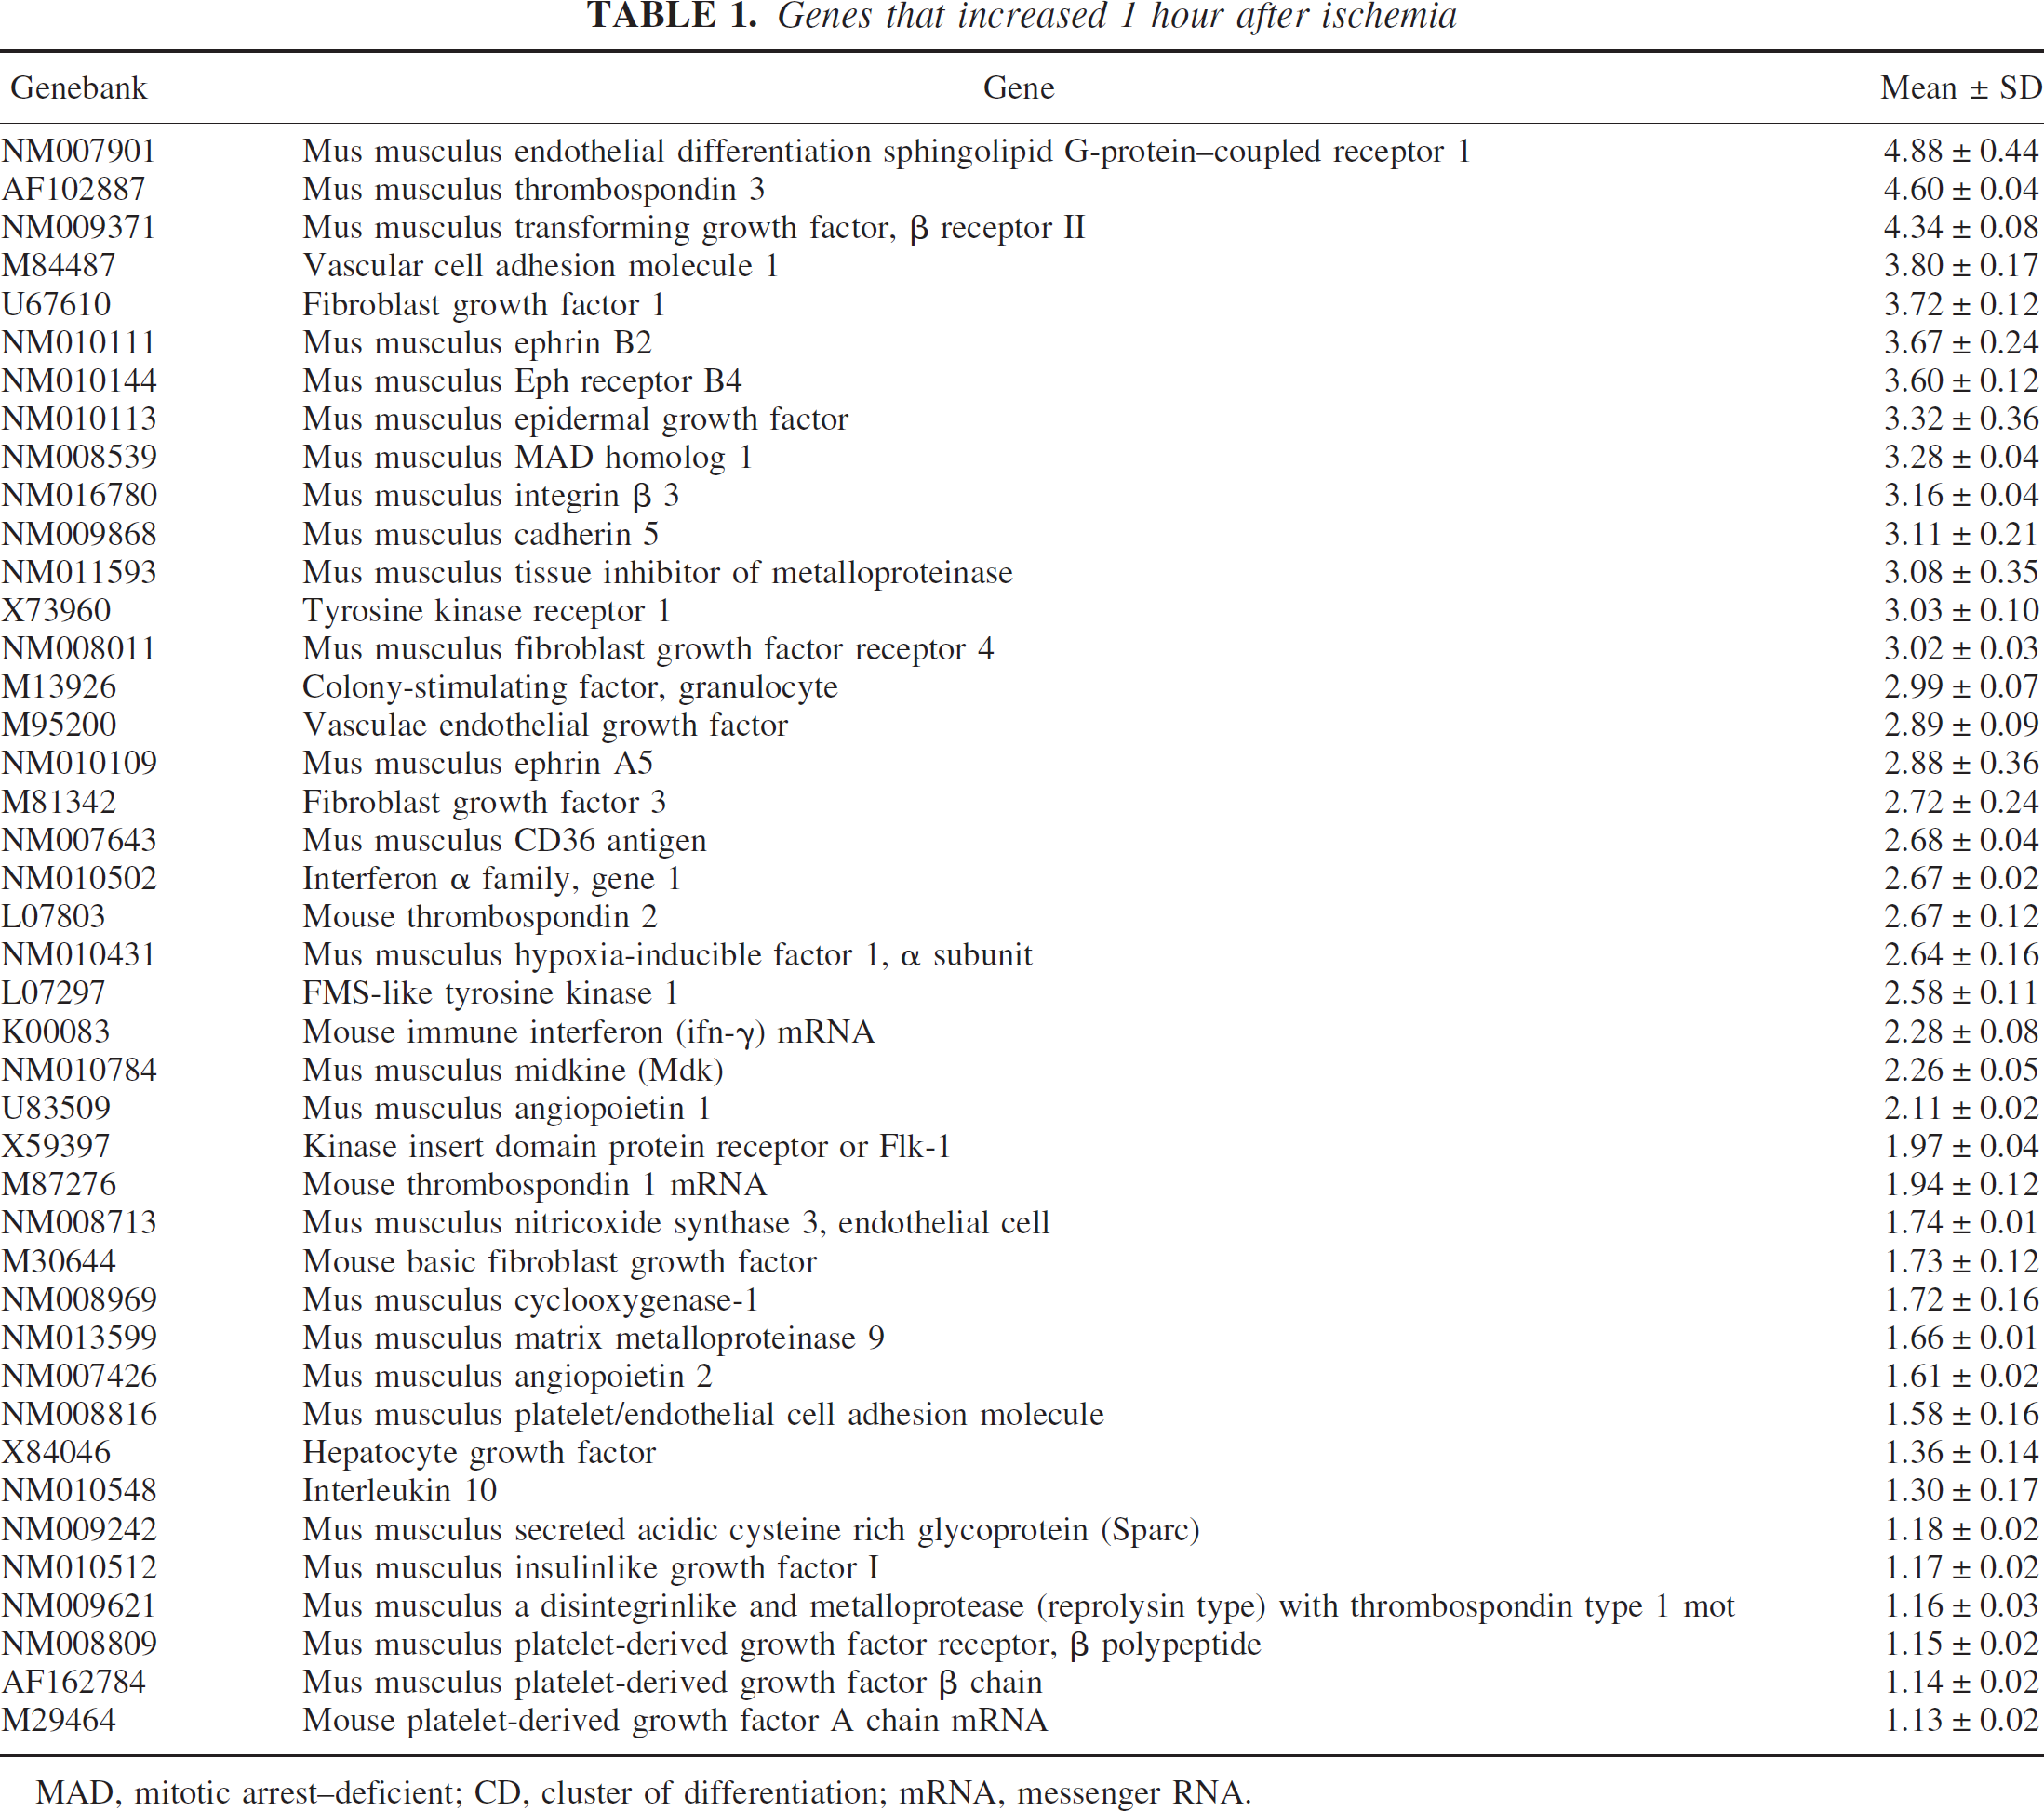
MAD, mitotic arrest—deficient; CD, cluster of differentiation; mRNA, messenger RNA.
Genes that changed to a level of statistical significance at 1 day are shown in Table 2. Twenty-nine (30.2%) of 96 genes were increased, and two genes (2.1%) were decreased. Vascular endothelial growth factor and its receptors (flk-1 and FMS-like tyrosine kinase 1) remained at increased levels, although the relative value became a bit smaller. Neuropilin, a putative VEGF receptor, became increased at this time point. Furthermore, angiopoietin-1 and angiopoietin-2, which play important roles in angiogenesis (Holash et al., 1999; Conway et al., 2001), were increased. Growth factors such as FGF, TGF, and HGF were still expressed at high levels. Connective tissue growth factor was newly increased. On the other hand, eNOS and COX1 no longer showed increased levels, which indicates that increased permeability is important only at a quite early phase of angiogenesis. Ephrins were also normalized. It is of interest that thrombospondins were decreased to a statistically significant degree at this time point, after showing an increase in expression at 1 hour of reperfusion.
Genes that increased or decreased 1 day after ischemia
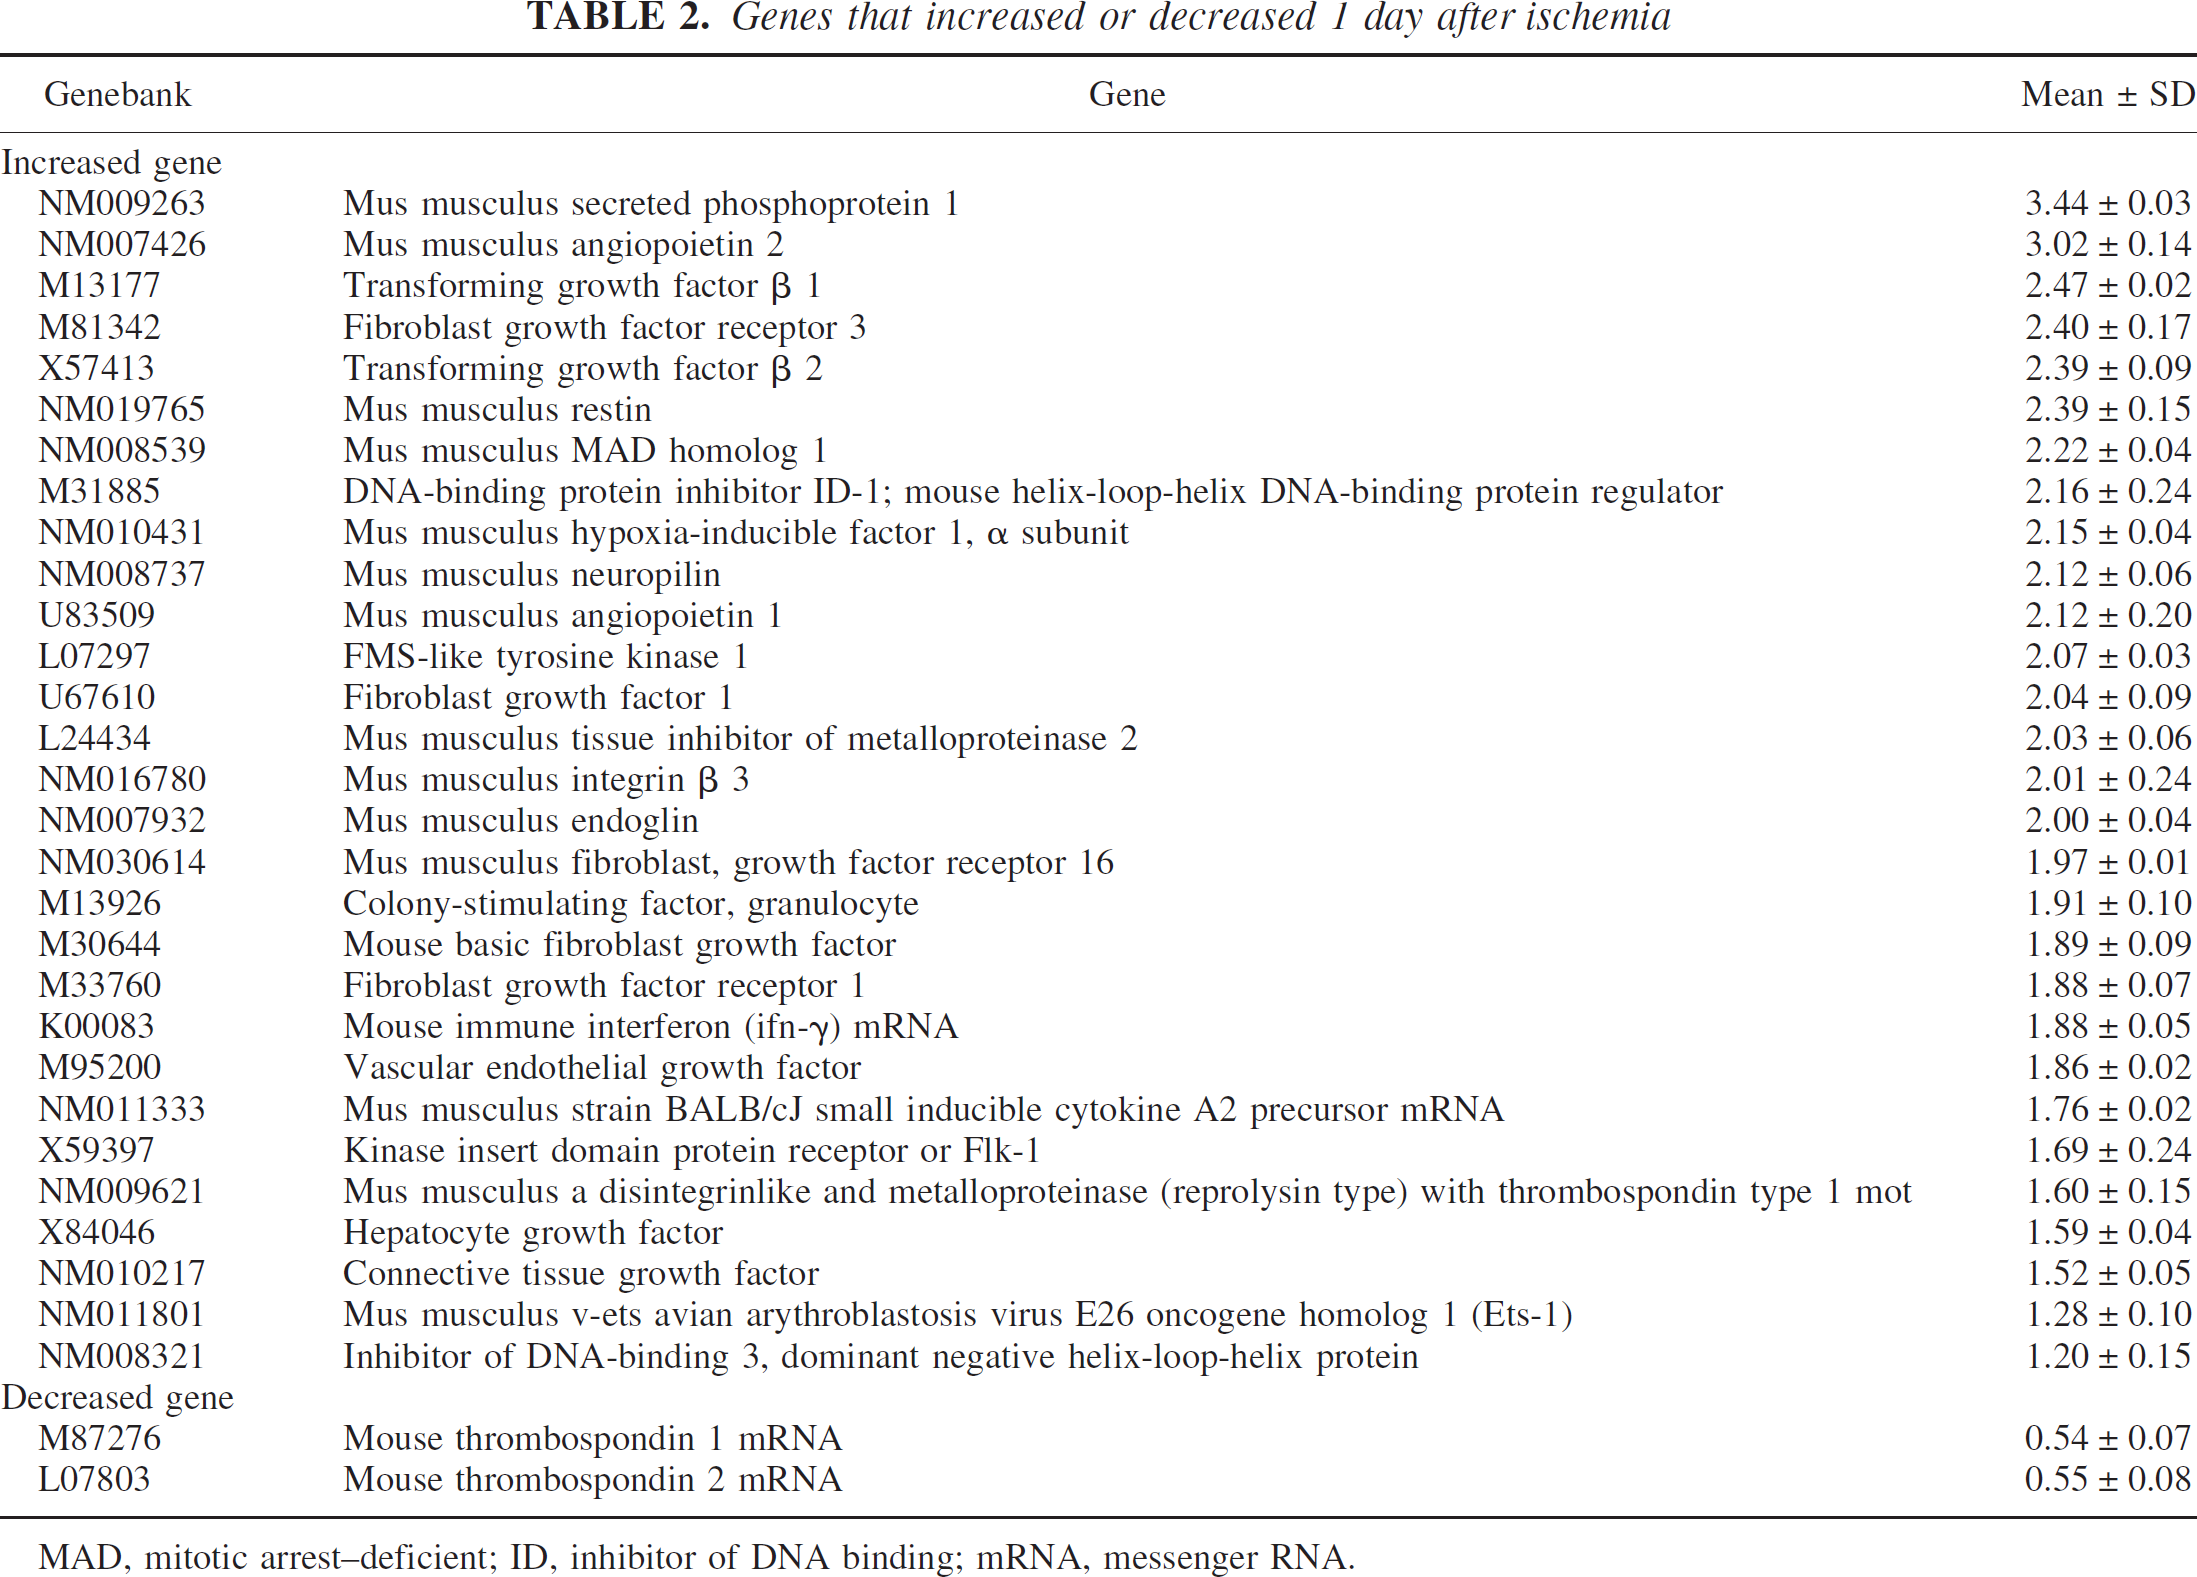
MAD, mitotic arrest—deficient; ID, inhibitor of DNA binding; mRNA, messenger RNA.
Twenty-one days after CBF restoration, 13 genes were increased and 2 genes were decreased to a statistically significant degree (Table 3). Angiopoietin-1 and angiopoietin-2 were still highly expressed. We found that three genes were newly increased at this time point: fibronectin, macrophage scavenger receptor-1, and placental growth factor (PlGF). In contrast, the two genes that showed a decreased level were angiogenesis-related growth factors.
Genes that increased or decreased 21 days after ischemia
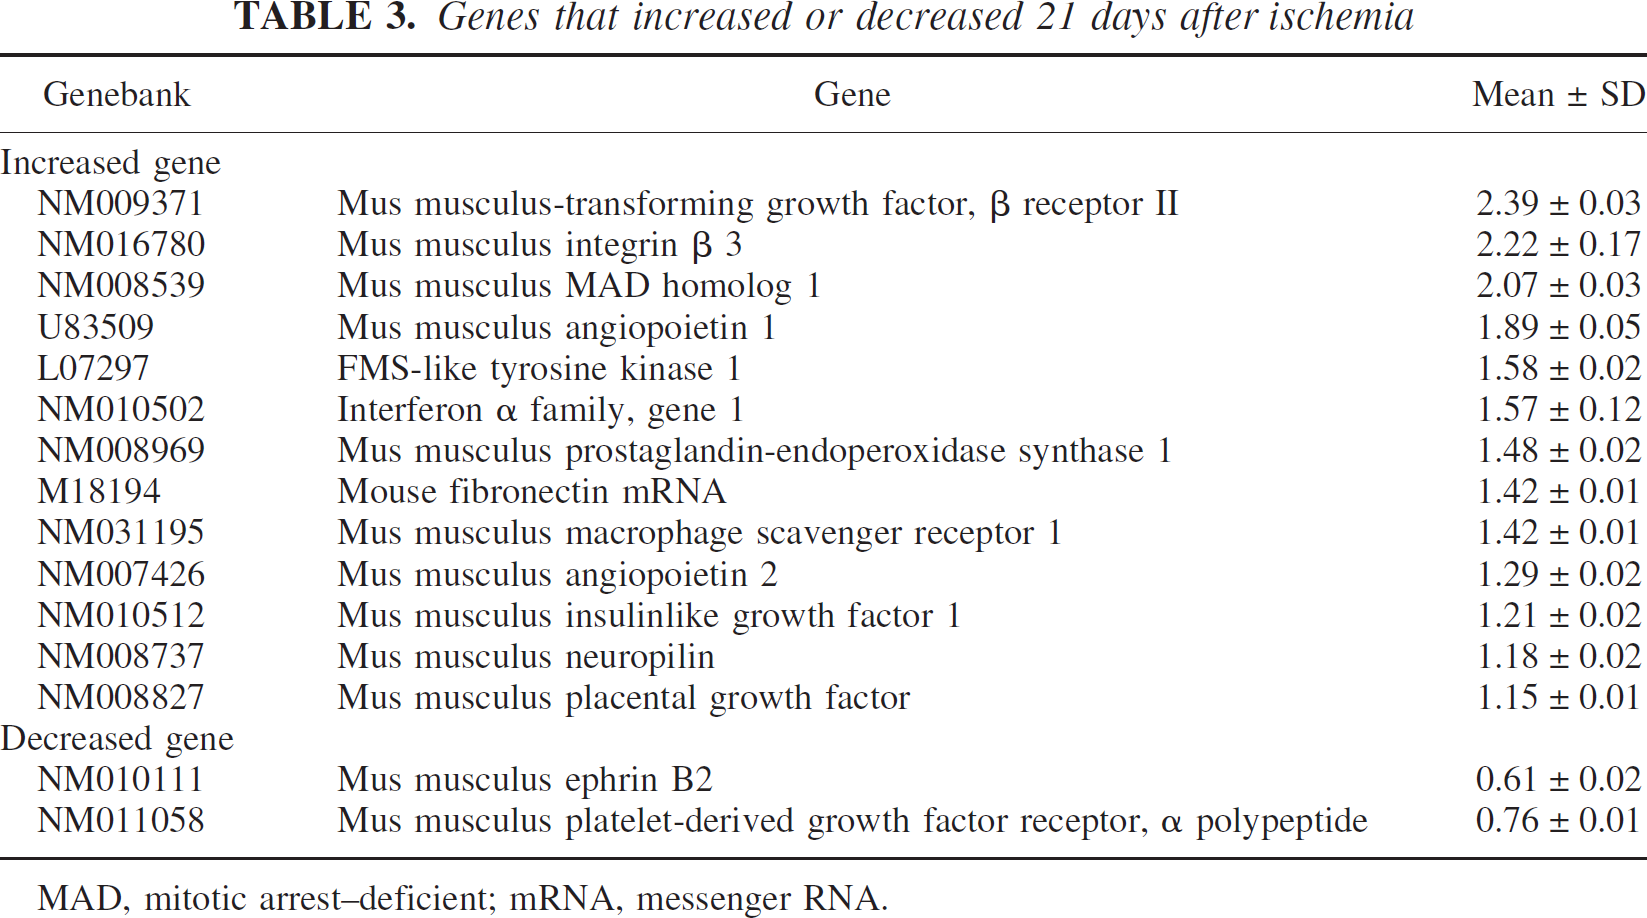
MAD, mitotic arrest—deficient; mRNA, messenger RNA.
Histologic outcome
A cresyl violet—staining study showed that only the striatum on the ischemic side was severely damaged in this model; massive neuronal cell death was followed by infiltration of inflammatory cells and astrocytosis. We could not confirm cell death or tissue destruction in the cerebral cortex. A TUNEL study done later also confirmed that neuronal cell death occurred only in the striatum.
Change in number of vessels in the ischemic hemisphere
To count the number of vessels we used immunohistochemistry for laminin, as previously reported (Rosenstein et al., 1998). The results of immunostaining are shown in Fig. 1A, and the number of vessels is summarized in Figs. 1B and 1C. In the brains of the sham-control group, vessels with various sizes were observed throughout the cerebral cortex and caudate (145.5 ± 6.6/mm2 in the cerebral cortex, 173.8 ± 9.8/mm2 in the caudate). The vessels seemed to become dilated 1 and 3 hours after CBF restoration, but the total number did not change to a statistically significant level at 1 and 3 hours and 1 day, in either the cerebral cortex or the caudate (1 hour, 152.7 ± 11.2/mm2 in the cerebral cortex, 175.7 ± 7.5/mm2 in the caudate; 3 hours, 142.0 ± 2.9/mm2 in the cerebral cortex, 167.4 ± 6.0/mm2 in the caudate; 1 day, 157.6 ± 13.4/mm2 in the cerebral cortex, 179.6 ± 7.7 /mm2 in the caudate). At 3 days of reperfusion, the total number of vessels increased in both the cerebral cortex and caudate, to statistical significance (P < 0.05 compared with the control group respectively, 169.5 ± 11.1/mm2 in the cerebral cortex, 202.3 ± 1.8/mm2 in the caudate), and further increased at 7 and 21 days (P < 0.01 compared with the control group respectively, 7 days, 212.3 ± 9.6/mm2 in the cerebral cortex, 229.0 ± 10.2/mm2 in the caudate; 21 days, 230 ± 23.0/mm2 in the cerebral cortex, 252.4 ± 19.4/mm2 in the caudate).
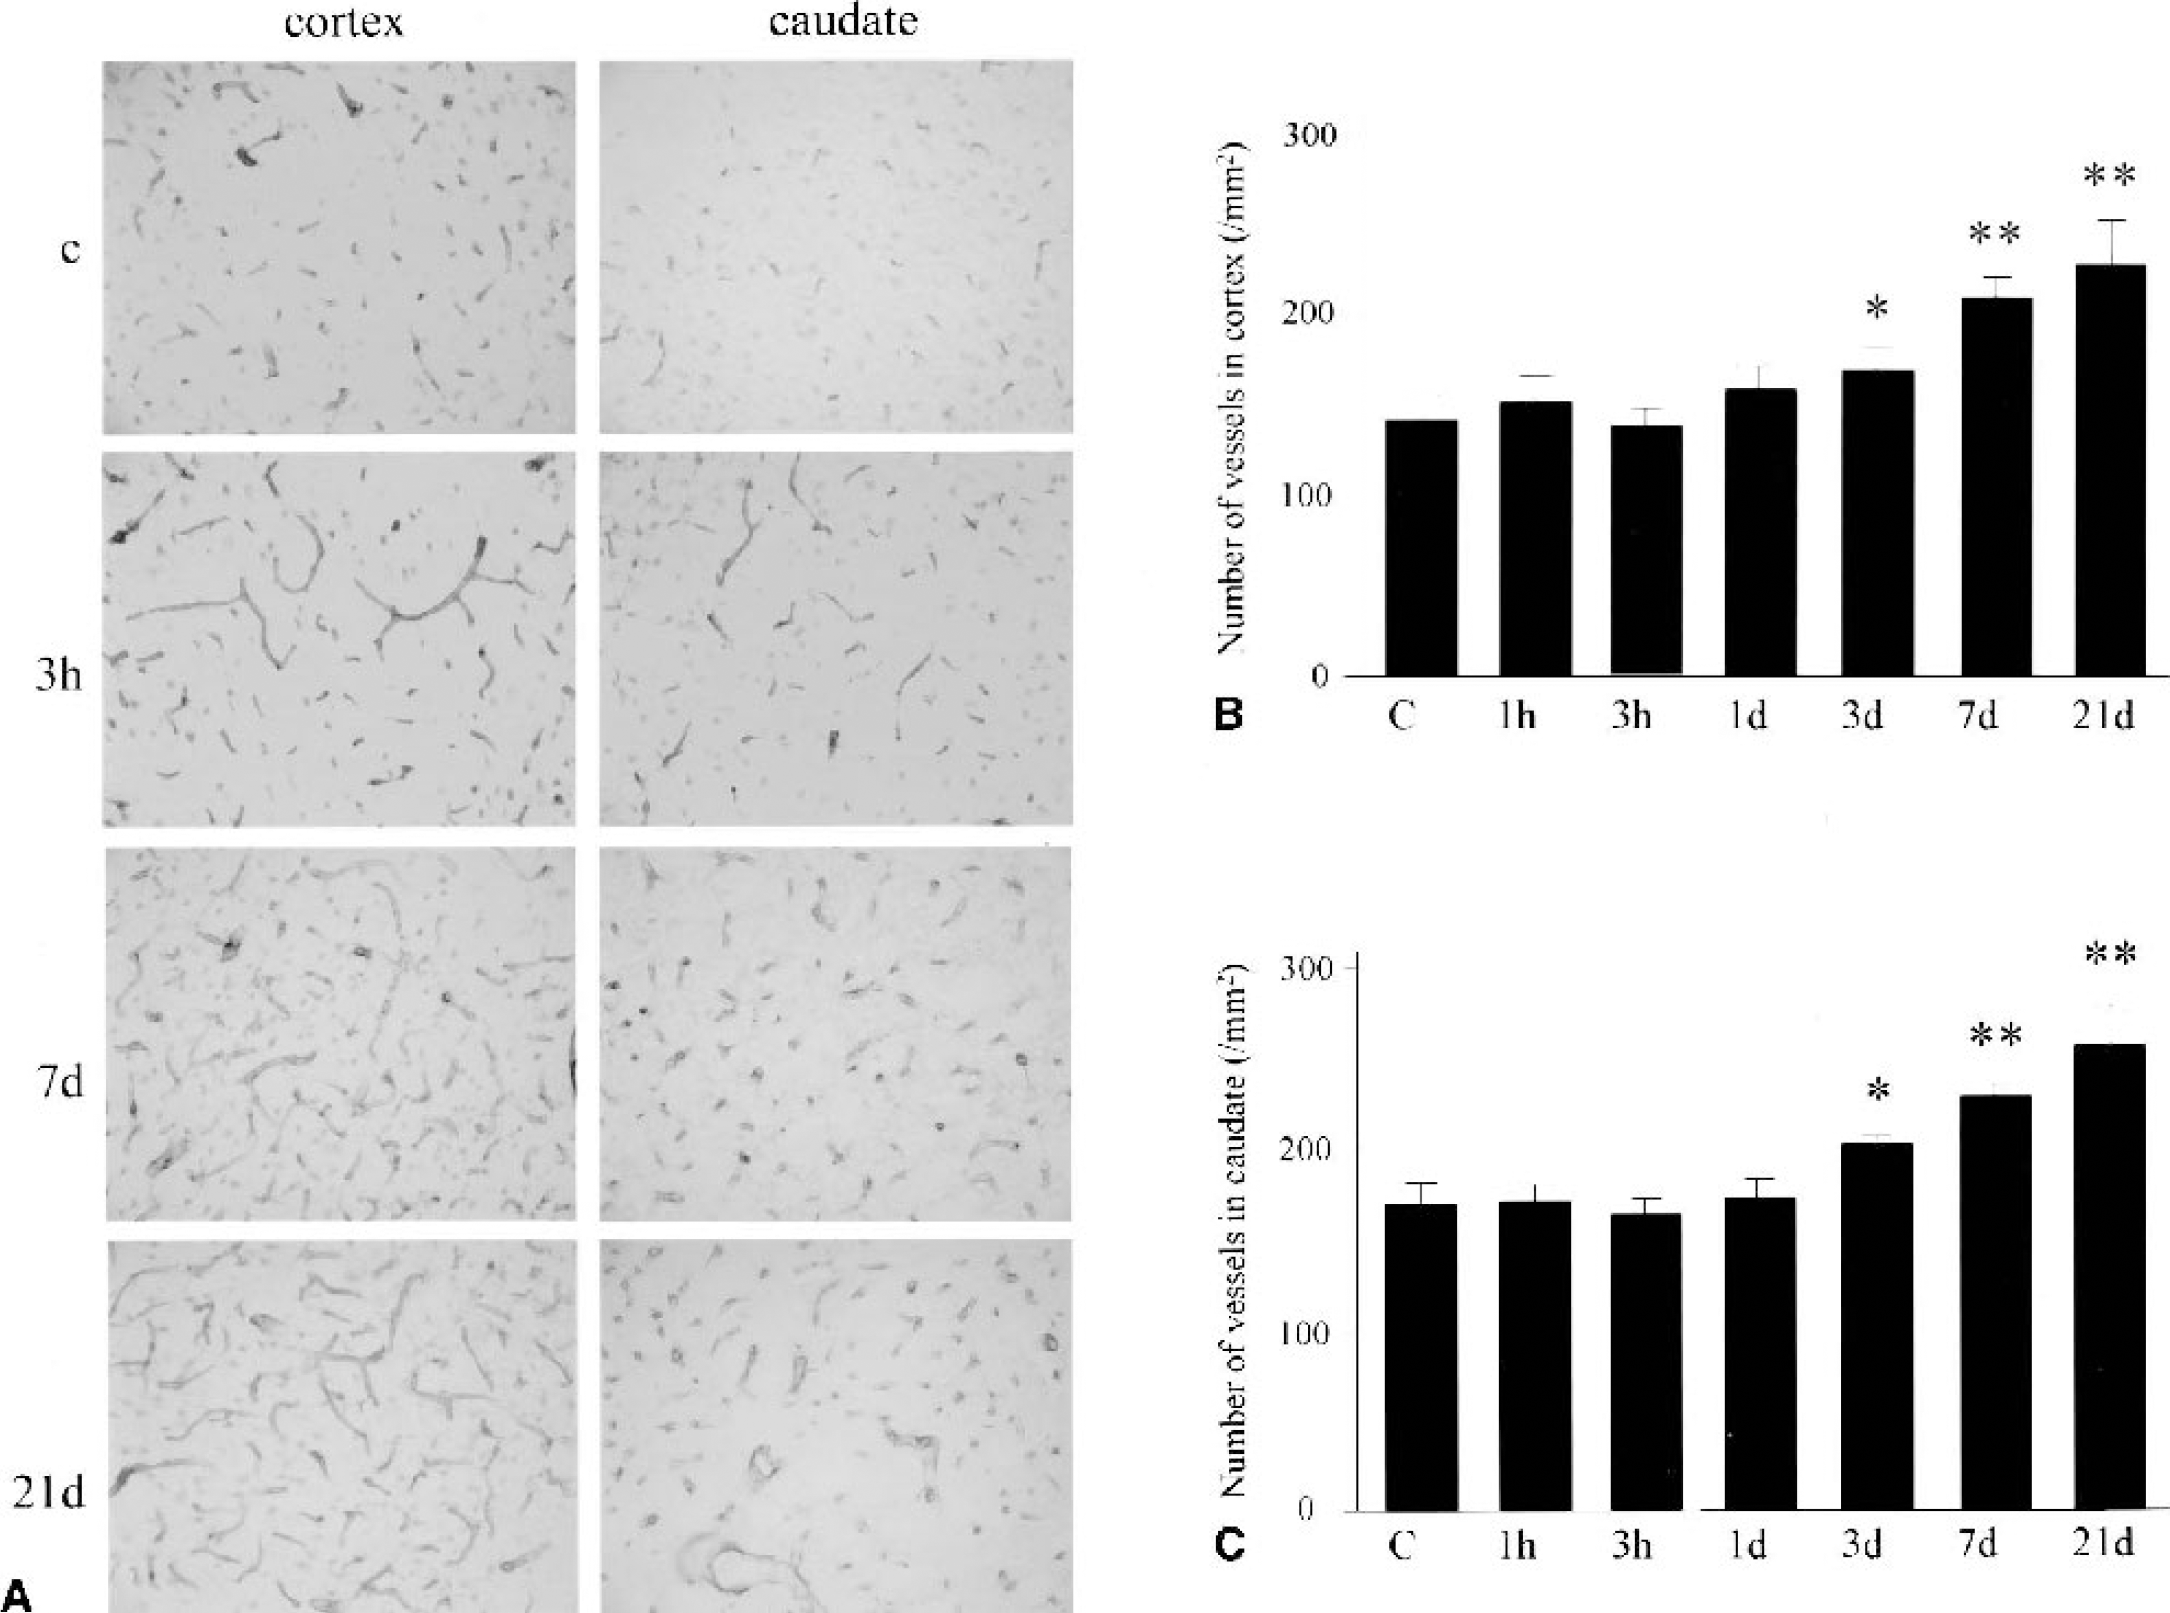
Quantification of the total number of vessels in the cerebral cortex and the caudate of the ischemic middle cerebral artery territory.
Number of replicating endothelial cells
Because the Ki67 antigen is a good marker for cells undergoing mitosis (Marti et al., 2000) and L esculentum lectin is useful for labeling endothelial cells (Beck et al., 2000), we were able to detect replicating endothelial cells by double staining with these molecules. The results of the staining are shown in Fig. 2A, and the number of replicating endothelial cells is summarized in Figs. 2B and 2C. In the normal brain, Ki67-positive cells were quite rare and most of the endothelial cells were in the quiescent state. At 1 and 3 hours of CBF restoration, most of the endothelial cells still remained replicatively quiescent and Ki67-positive endothelial cells were only rarely observed. At 1 day of reperfusion, however, Ki67-positive endothelial cells were dramatically increased in both the cerebral cortex and caudate (P < 0.01 compared with the control group, respectively). The number of replicating endothelial cells peaked at 3 days of reperfusion, but was still large, with statistical significance, at 7 and 21 days of reperfusion, in both the cerebral cortex and caudate.
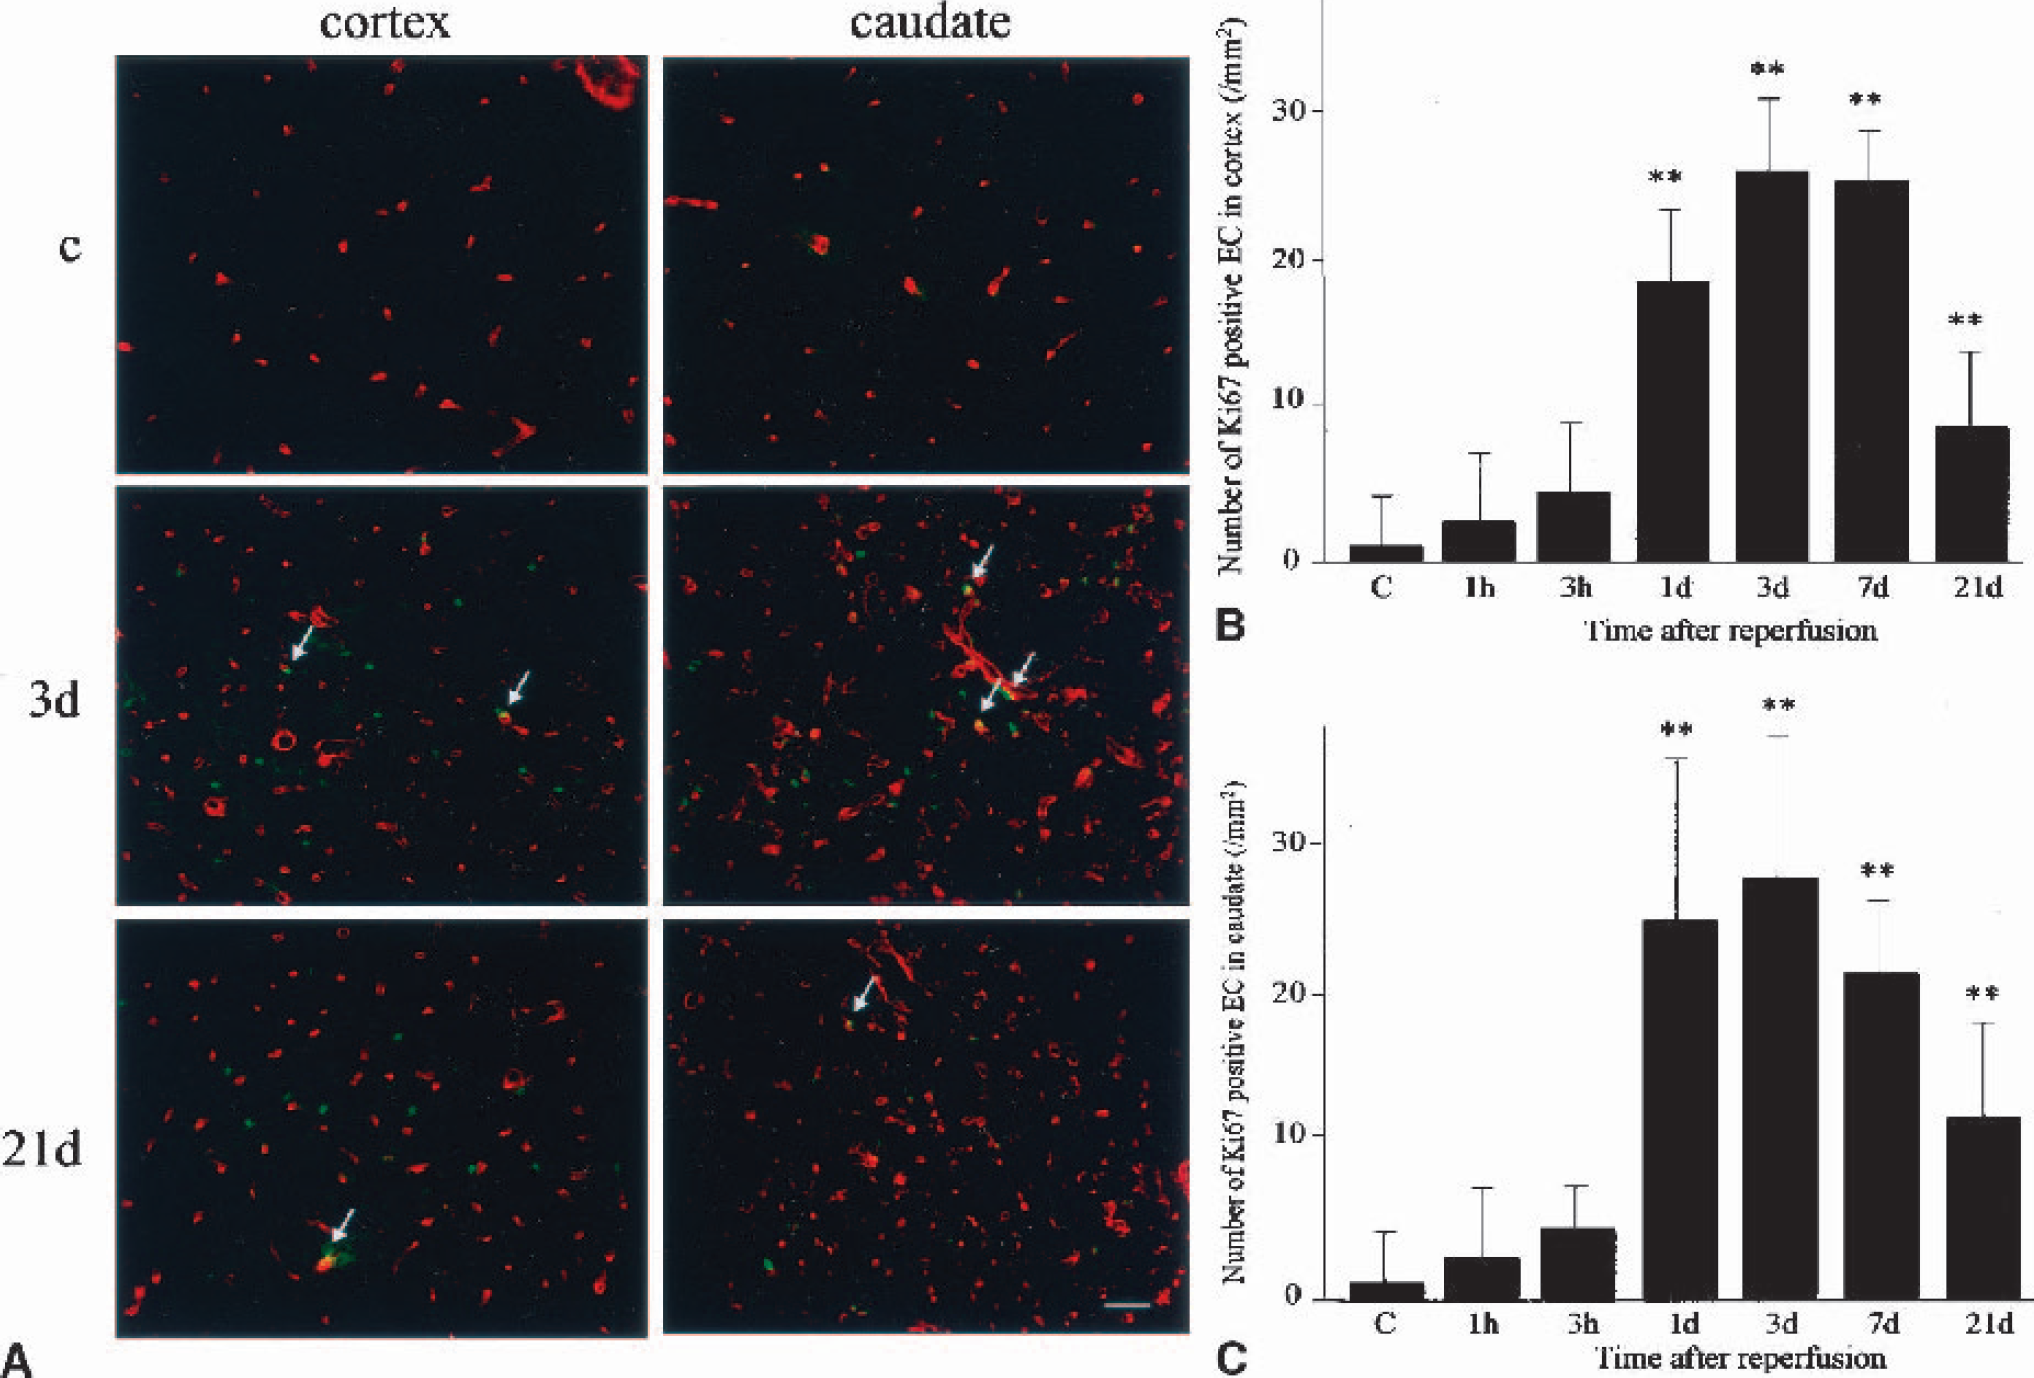
Quantification of the proliferating endothelial cells in the cerebral cortex and the caudate of the ischemic middle cerebral artery territory.
TUNEL-positive endothelial cells
Endothelial cells are known to be resistant to ischemic injury (Stempien-Otero et al., 1999), but they could undergo apoptosis to accomplish vascular remodeling (Dimmeler and Zeiher, 2000). By combining TUNEL and L esculentum lectin staining, we observed endothelial cells undergoing apoptotic cell death (Fig. 3). In the control brains and those at 1 and 3 hours of CBF restoration, there were no TUNEL-positive endothelial cells in the cerebral cortex and caudate. At 1 day of reperfusion, many TUNEL-positive cells appeared in the caudate and some of them overlapped on the lectinstained sites. There were also TUNEL-positive endothelial cells in the caudate at 3 days, but we could no longer find them at 7 and 21 days of reperfusion. In the cerebral cortex, there were no TUNEL-positive endothelial cells throughout the investigated time course. The number of TUNEL-positive endothelial cells was 8.5 ± 4.7/mm2 at 1 day and 4.4 ± 2.9/mm2 at 3 days of CBF restoration.
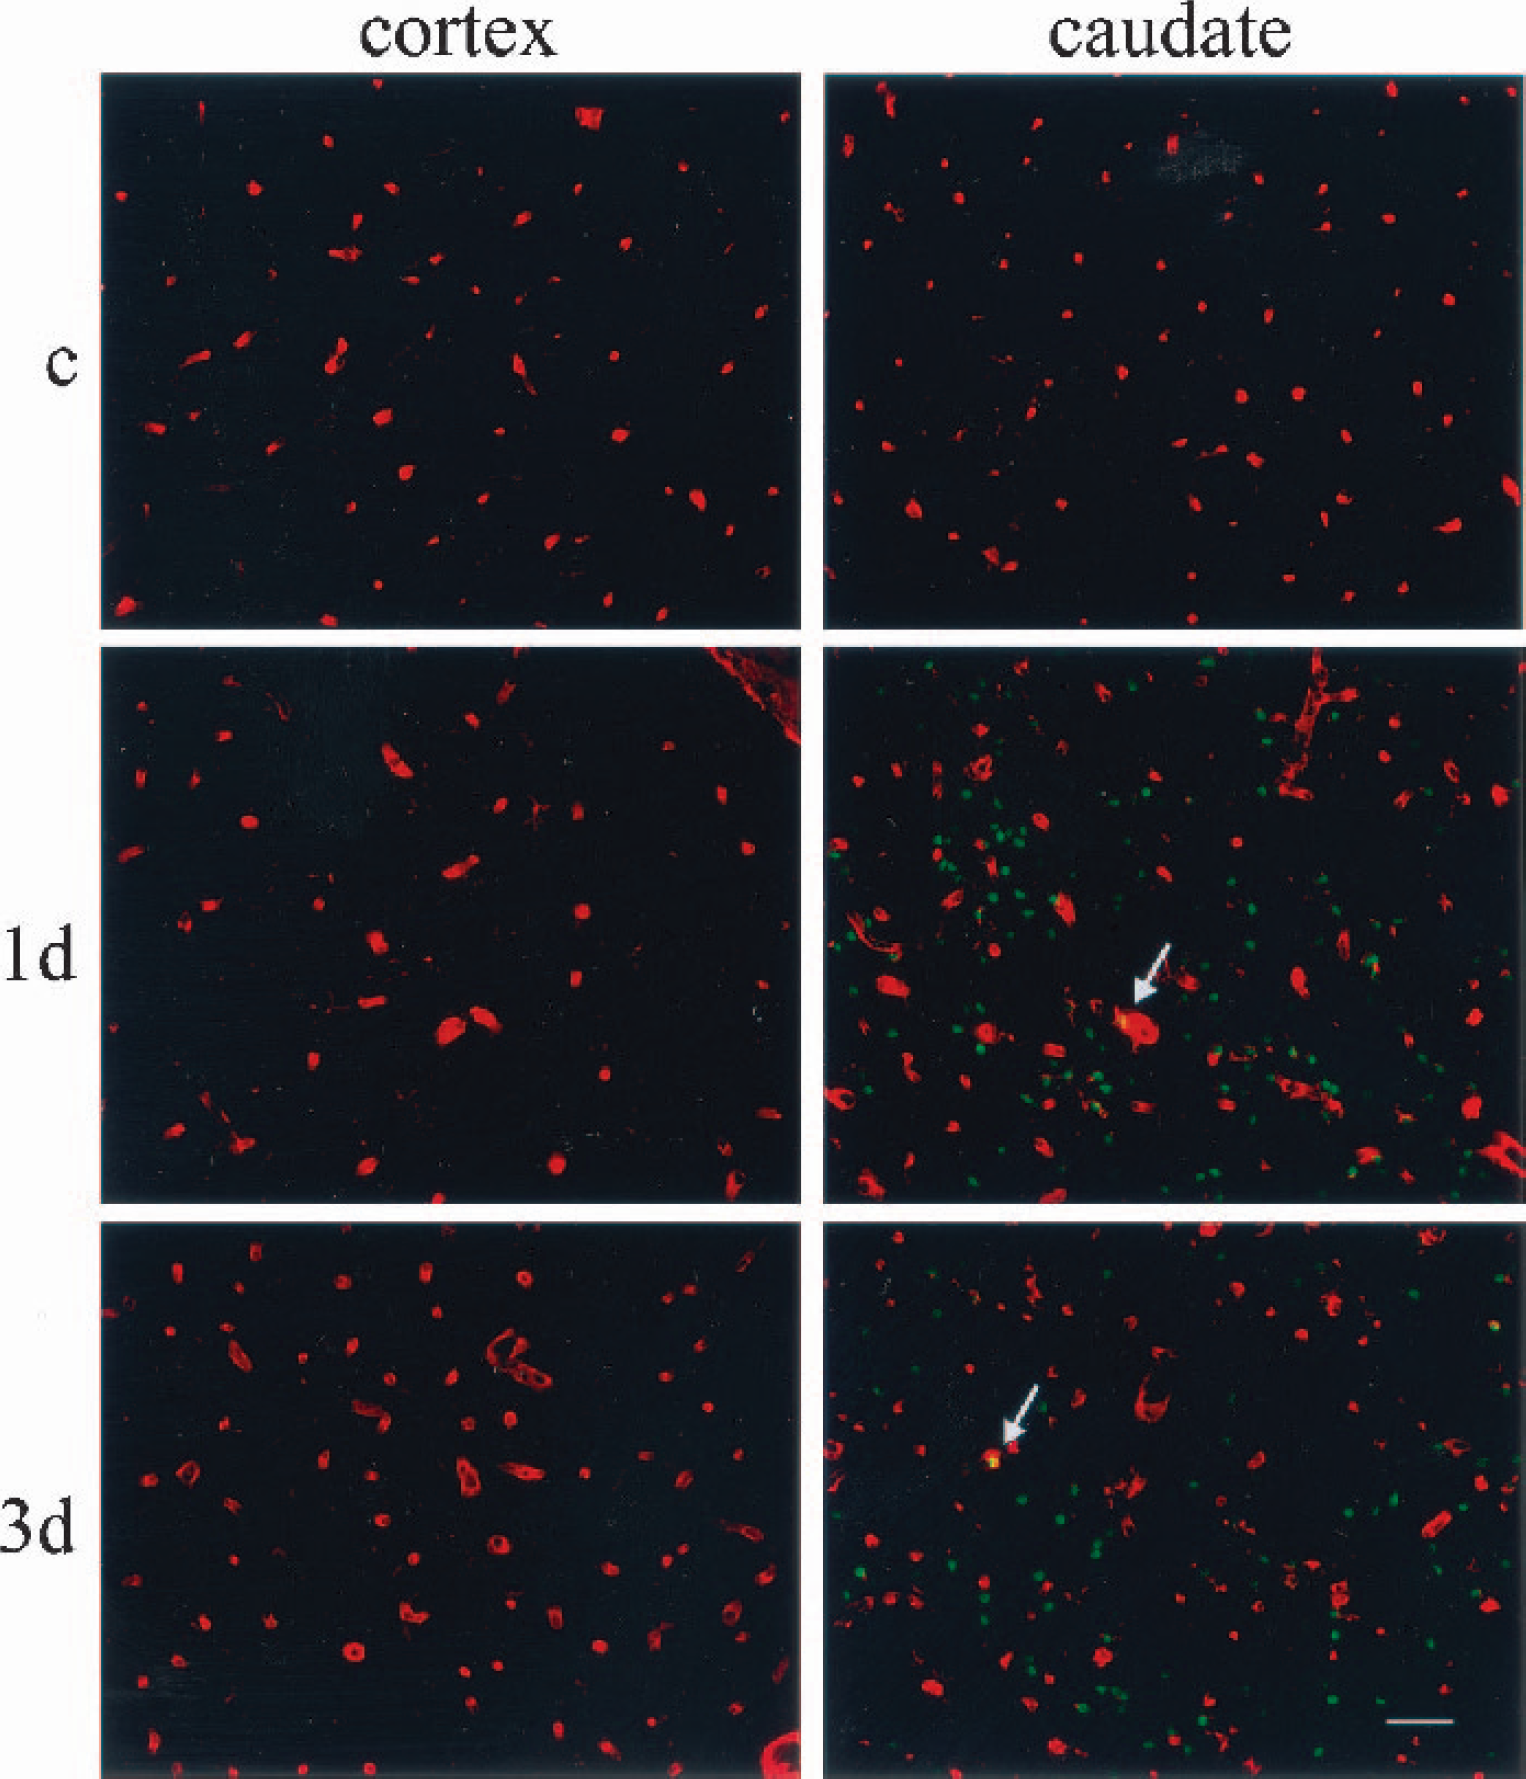
Photomicrographs of double fluorescence study for TUNEL (fluorescein isothiocyanate; green) and Lycopersicon esculentum lectin staining (Texas red; red). In the control brain (c) there were no TUNEL-positive cells in either the cerebral cortex or the caudate. In the brains at 1 day, many TUNEL-positive cells appeared in the caudate but not in the cerebral cortex. Most of the TUNEL-positive cells were in the brain parenchyma, and overlap with lectin staining was occasionally observed (arrow). At 3 days, the number of TUNEL-positive cells slightly decreased, but the labeling pattern was essentially the same as at 1 day. We occasionally observed TUNEL-positive endothelial cells (arrow). Note that we also confirmed an increase in the number of vessels with this study. Bar = 50 μm. TUNEL, terminal deoxynucleotidyl transferasemediated uridine 5‘-triphosphatebiotin nick end labeling.
Change in expression of thrombospondin-1
Because the cDNA array study showed a characteristic change in thrombospondin messenger RNA (mRNA), we investigated thrombospondin-1 at the protein level by means of Western blotting and immunohistochemical analysis. The results are summarized in Fig. 4, in which Western blotting is shown in panel A, relative OD is seen in panel B, and immunohistochemistry in panel B. In the control brains, a single band with a molecular weight (MW) of 150 kd was observed in both the cerebral cortex and the caudate, but it was weak. Immunohistochemistry showed quite a weak signal in neuronal cells. At 1 hour of reperfusion, the band for thrombospondin-1 became transiently denser than in the control brains (no statistical significance) but was diminished and became lower than the control level at 3 hours and 1 day (the decrease reached statistical significance at 1 day; P < 0.01 in the cerebral cortex, P < 0.05 in the caudate). Immunohistochemical analysis showed that immunoreactivity in neuronal cells became a bit stronger at 1 hour but was almost undetectable at 1 day of reperfusion, in both the cerebral cortex and caudate. Three days after CBF restoration, the level of thrombospondin-1 increased and was statistically significant in the cerebral cortex (P < 0.05). The protein level peaked at 7 days (P < 0.01 in the cerebral cortex, P < 0.05 in the caudate) and was still high at 21 days of reperfusion (P < 0.01 in the cerebral cortex, no statistical significance in the caudate). With immunohistochemistry, not only neuronal but also endothelial cells became positively stained 3, 7, and 21 days after CBF restoration. The results were compatible with those of the cDNA array study, suggesting that the dramatic increase in thrombospondin-1 protein was due to expression in the endothelial cells.
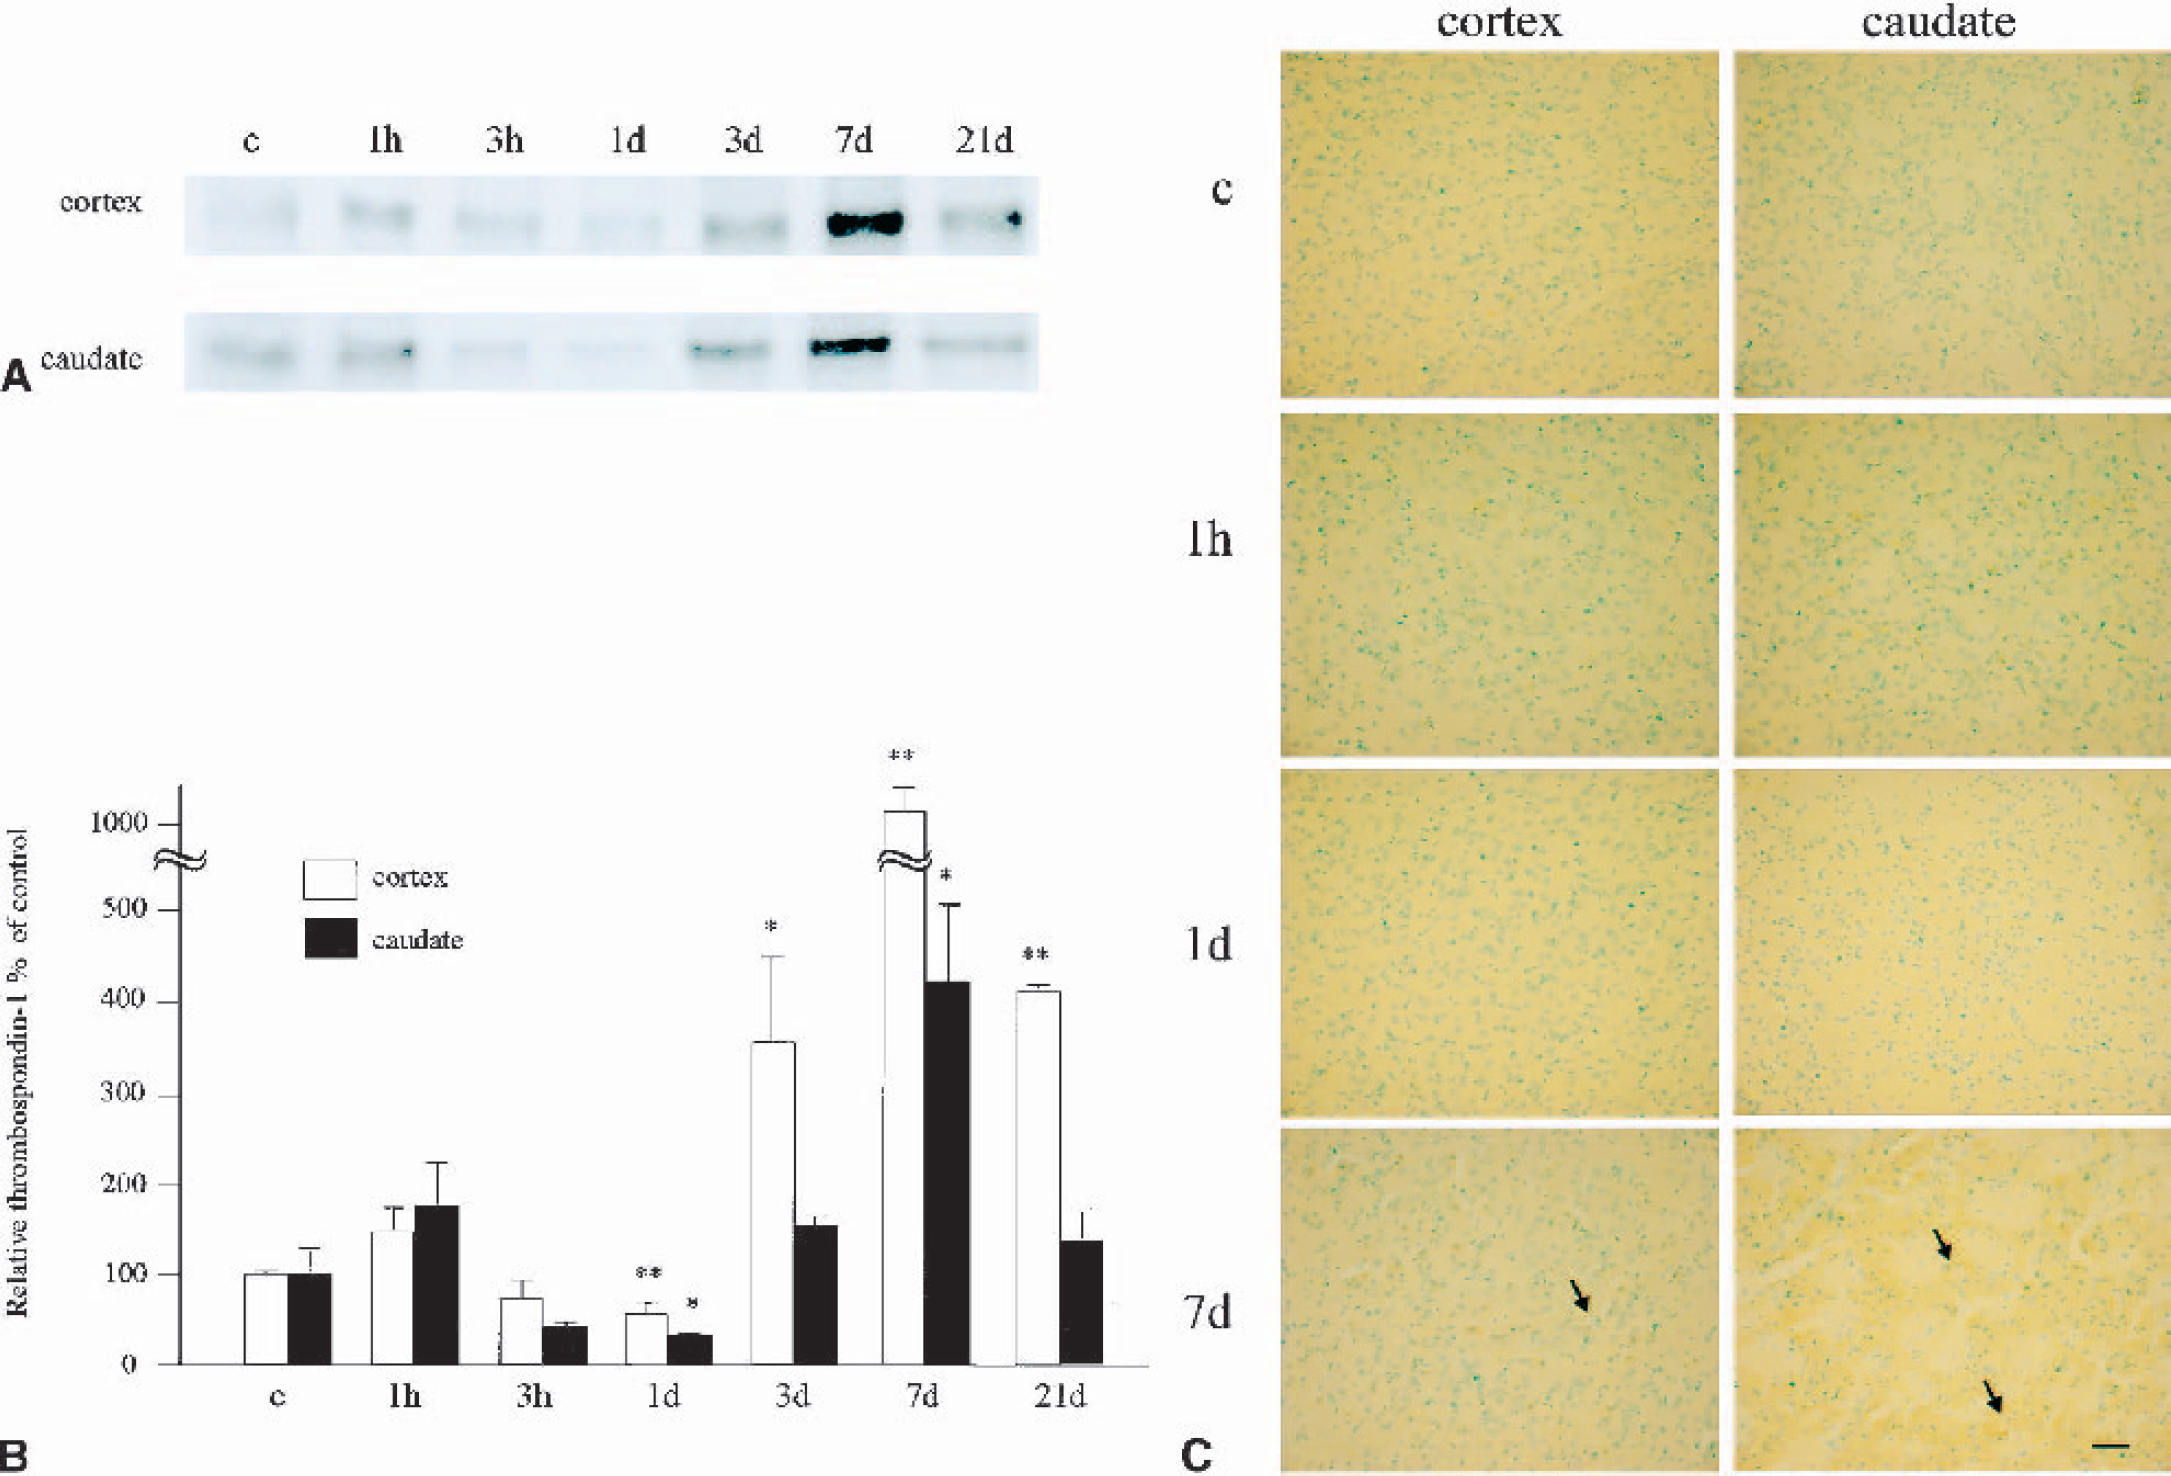
Change in expression of thrombospondin-1.
Change in expression of vascular endothelial growth factor and flk-1
Vascular endothelial growth factor, a mitogen for endothelial cells, plays a central role in angiogenesis (Leung et al., 1989; Holash et al., 1999; Conway et al., 2001). The cDNA array study showed a rapid increase in VEGF and its receptors at the mRNA level. Therefore, we carried out Western blotting and immunohistochemistry for VEGF and flk-1 to confirm them at the protein level.
With Western blotting for VEGF (Fig. 5A), the control brains showed very weak bands at 45 and 38 kd, in both the cerebral cortex and the caudate. The band at 38 kd was only barely detectable, indicating that VEGF165, which is one of four VEGF isoforms, is the main source under normal conditions. Immunohistochemistry (Fig. 5C) showed that only a few neuronal cells possessed weak immunoreactivity for VEGF under normal conditions. One hour after CBF restoration, both bands became stronger in the cerebral cortex and the caudate, indicating that VEGF165 and VEGF121 were increased at the protein level (Fig. 5A). The density of the two bands peaked at 3 hours of reperfusion and gradually decreased thereafter (Fig. 5A). With immunohistochemistry, neuronal and endothelial cells became strongly stained at 1 hour, peaked at 3 hours, then gradually decreased thereafter in both the cerebral cortex and the caudate (Fig. 5C). We noticed that endothelial cells still remained immunopositive at 3 days of reperfusion. Fluorescent double staining with L esculentum lectin, an endothelial cell marker, showed that some of the immunopositive sites were actually endothelial cells in the cerebral cortex and the caudate (Fig. 5D). An increase in OD of total VEGF was statistically significant from 1 hour to 1 day in the cerebral cortex (P < 0.01 compared with the control), although it was from 1 hour to 3 days in the caudate (P < 0.01 compared with the control; Fig. 5B).
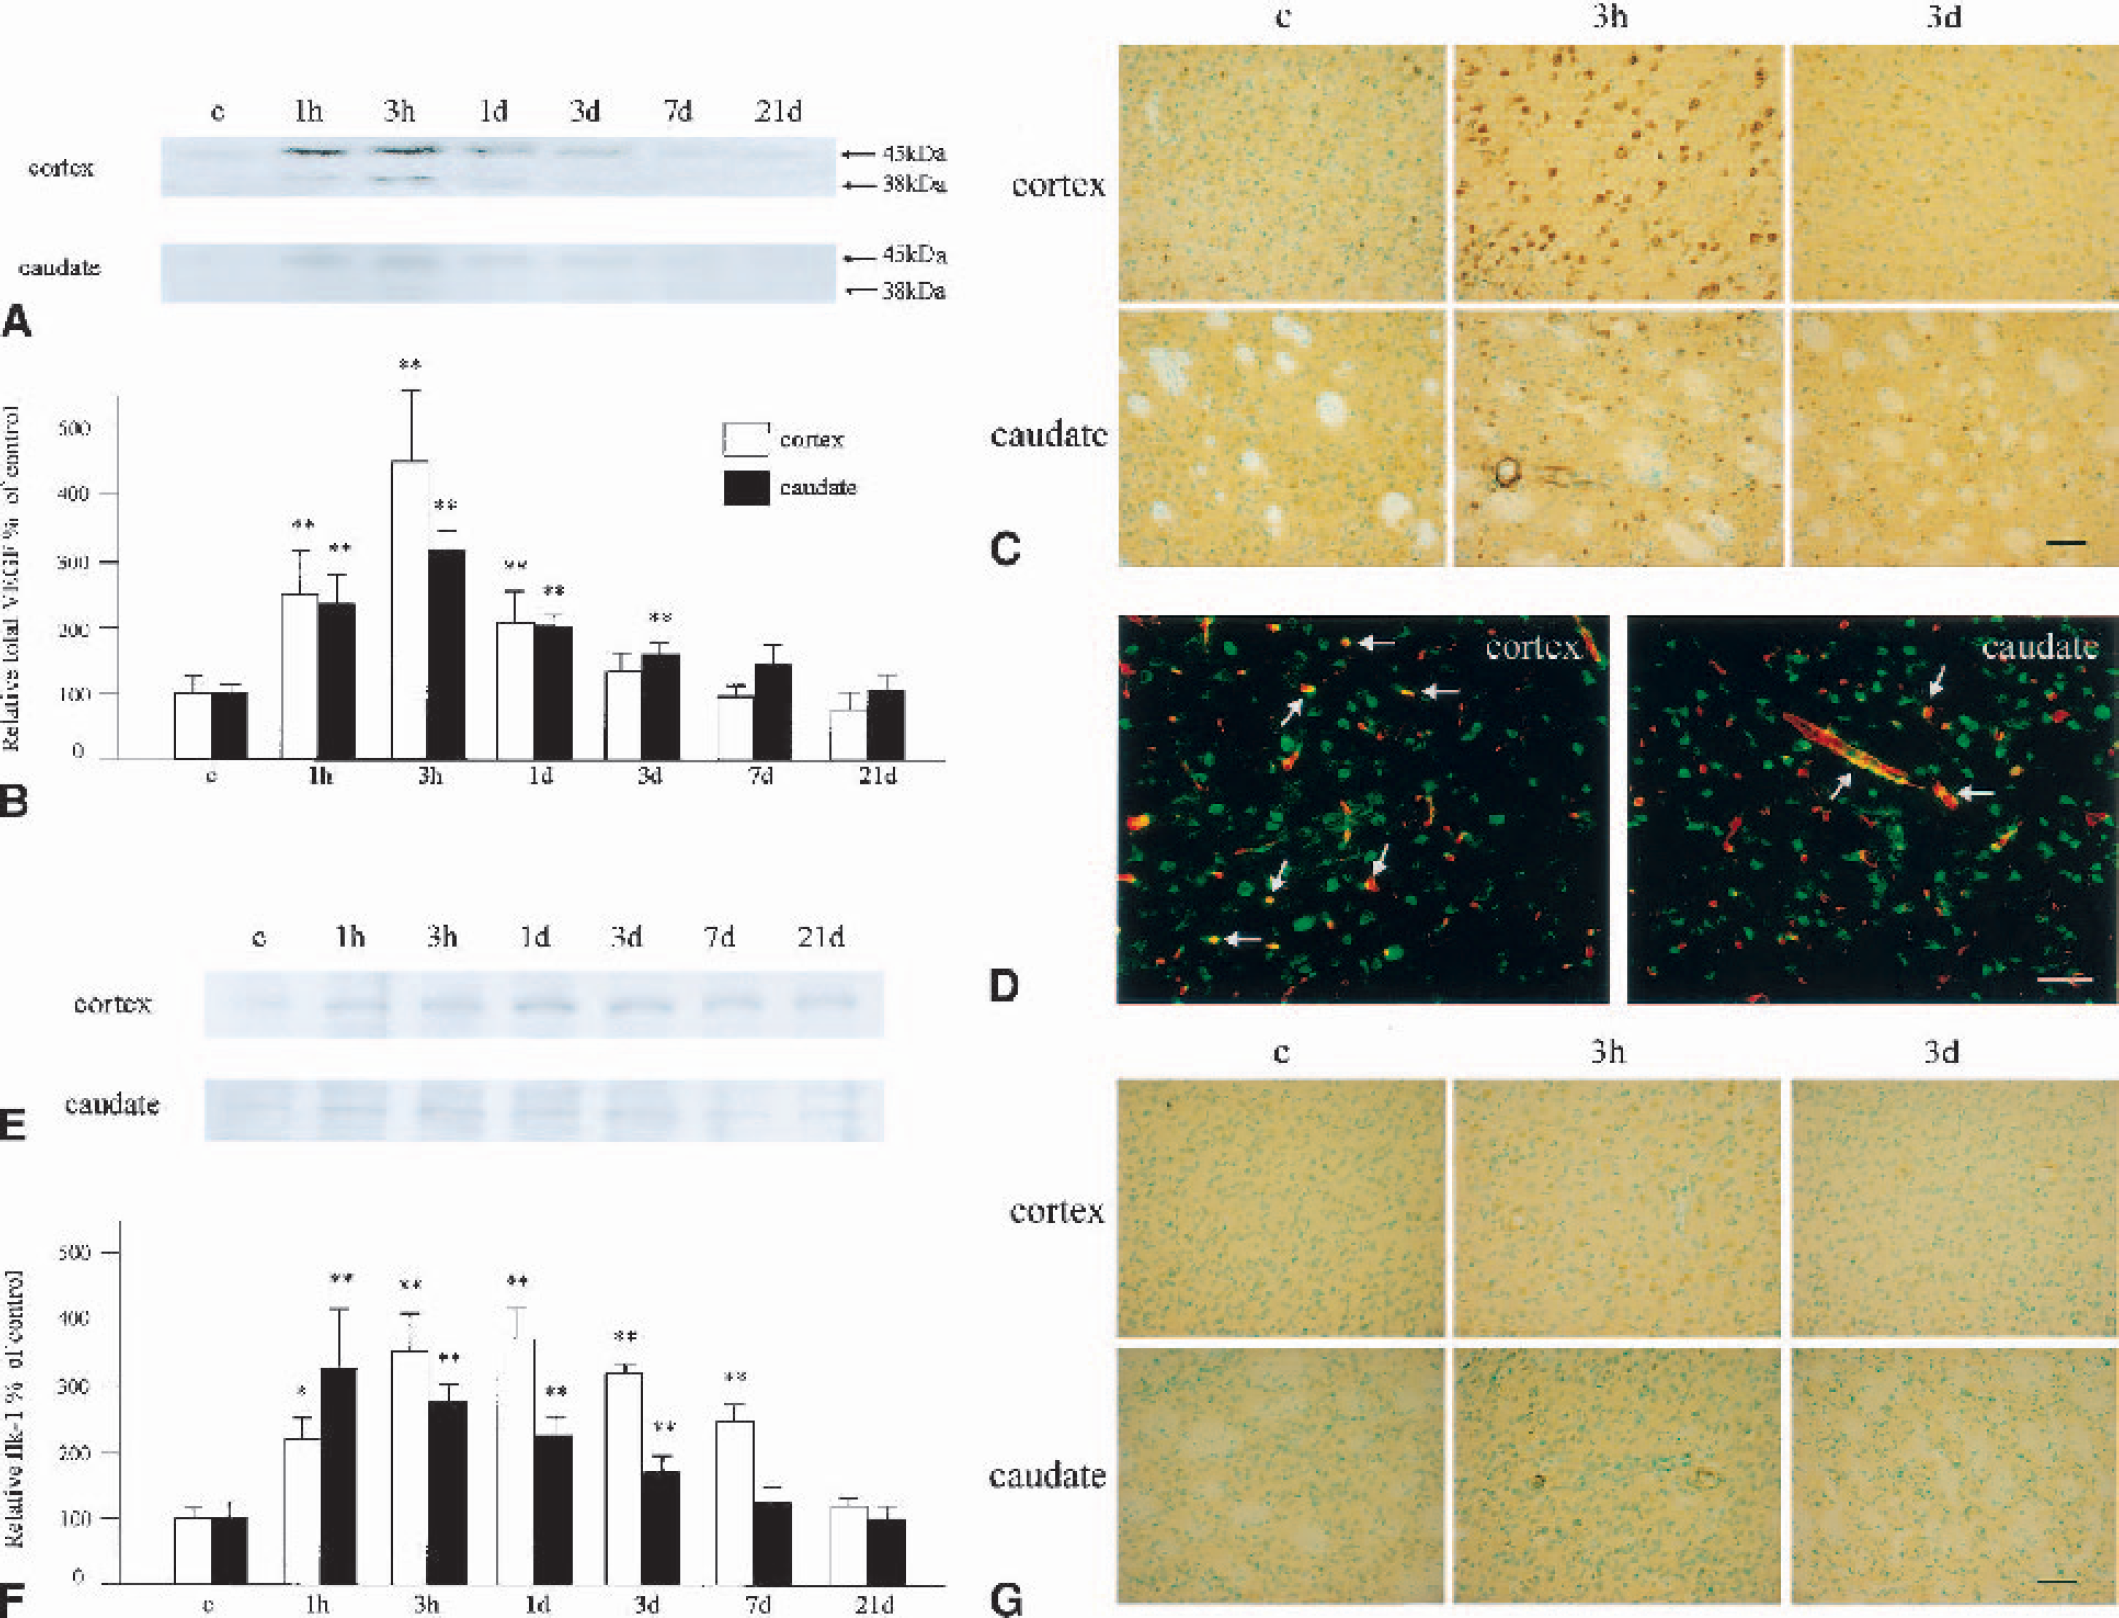
Change in expression of VEGF and flk-1.
Western blotting for flk-1 showed a very weak band with an MW of 195 kd in the cerebral cortex and the caudate (Fig. 5E). In the cerebral cortex, the protein gradually increased and peaked at 1 day of reperfusion. The OD was high, with a statistical significance from 1 hour to 7 days (1 hour, P < 0.05 compared with the control; 3 hours to 7 days, P < 0.01 compared with the control; Fig. 5F). In the caudate, in contrast, the immunoreactive flk-1 band peaked at 1 hour of reperfusion and gradually decreased thereafter (Fig. 5E). The OD was high, with a statistical significance from 1 hour to 3 days (P < 0.01 compared with the control group). Immunohistochemistry showed only a slight immunoreactivity for flk-1 in neuronal cells in the control brain (Fig. 5G). After ischemia and reperfusion, the immunoreactivity increased in both the cerebral cortex and the caudate, and of note was that not only neuronal but also vascular endothelial cells became positively stained. The immunoreactivity became a bit weaker at 3 days, but in the endothelial cells still remained definite at this time point.
Change in expression of angiopoietins
With the cDNA array study, angiopoietin-1 and angiopoietin-2 showed a dramatic and prolonged increase at the mRNA level. These molecules play important roles in angiogenesis, and of interest is that angiopoietin-2 exerts different effects, depending on the existence of VEGF (Holash et al., 1999; Conway et al., 2001). To confirm the expression of angiopoietins at the protein level, we performed Western blotting and immunohistochemical analysis for these molecules.
With Western blotting for angiopoietin-1, a weak single band with an MW of 55 kd was observed in the control brain samples, in both the cerebral cortex and the caudate (Fig. 6A). The protein gradually increased and peaked at 7 days of reperfusion. The increase in OD was statistically significant compared with the control group from 1 to 21 days in the cerebral cortex (P < 0.05 at 1 day, P < 0.01 at 3 to 21 days) and from 1 hour to 21 days in the caudate (P < 0.05 at 1 hour to 1 day, P < 0.01 at 3 to 21 days; Fig. 6B). Immunohistochemical analysis for angiopoietin-1 disclosed that control brains showed barely detectable immunoreactivity, but neuronal and endothelial cells were positively stained at 3 hours of reperfusion in both the cerebral cortex and the caudate (Fig. 6C). The immunoreactivity remained definite throughout the investigated time course. A double fluorescence study with L esculentum lectin further demonstrated that some of the angiopoietin-1-positive sites were endothelial cells (Fig. 6D).
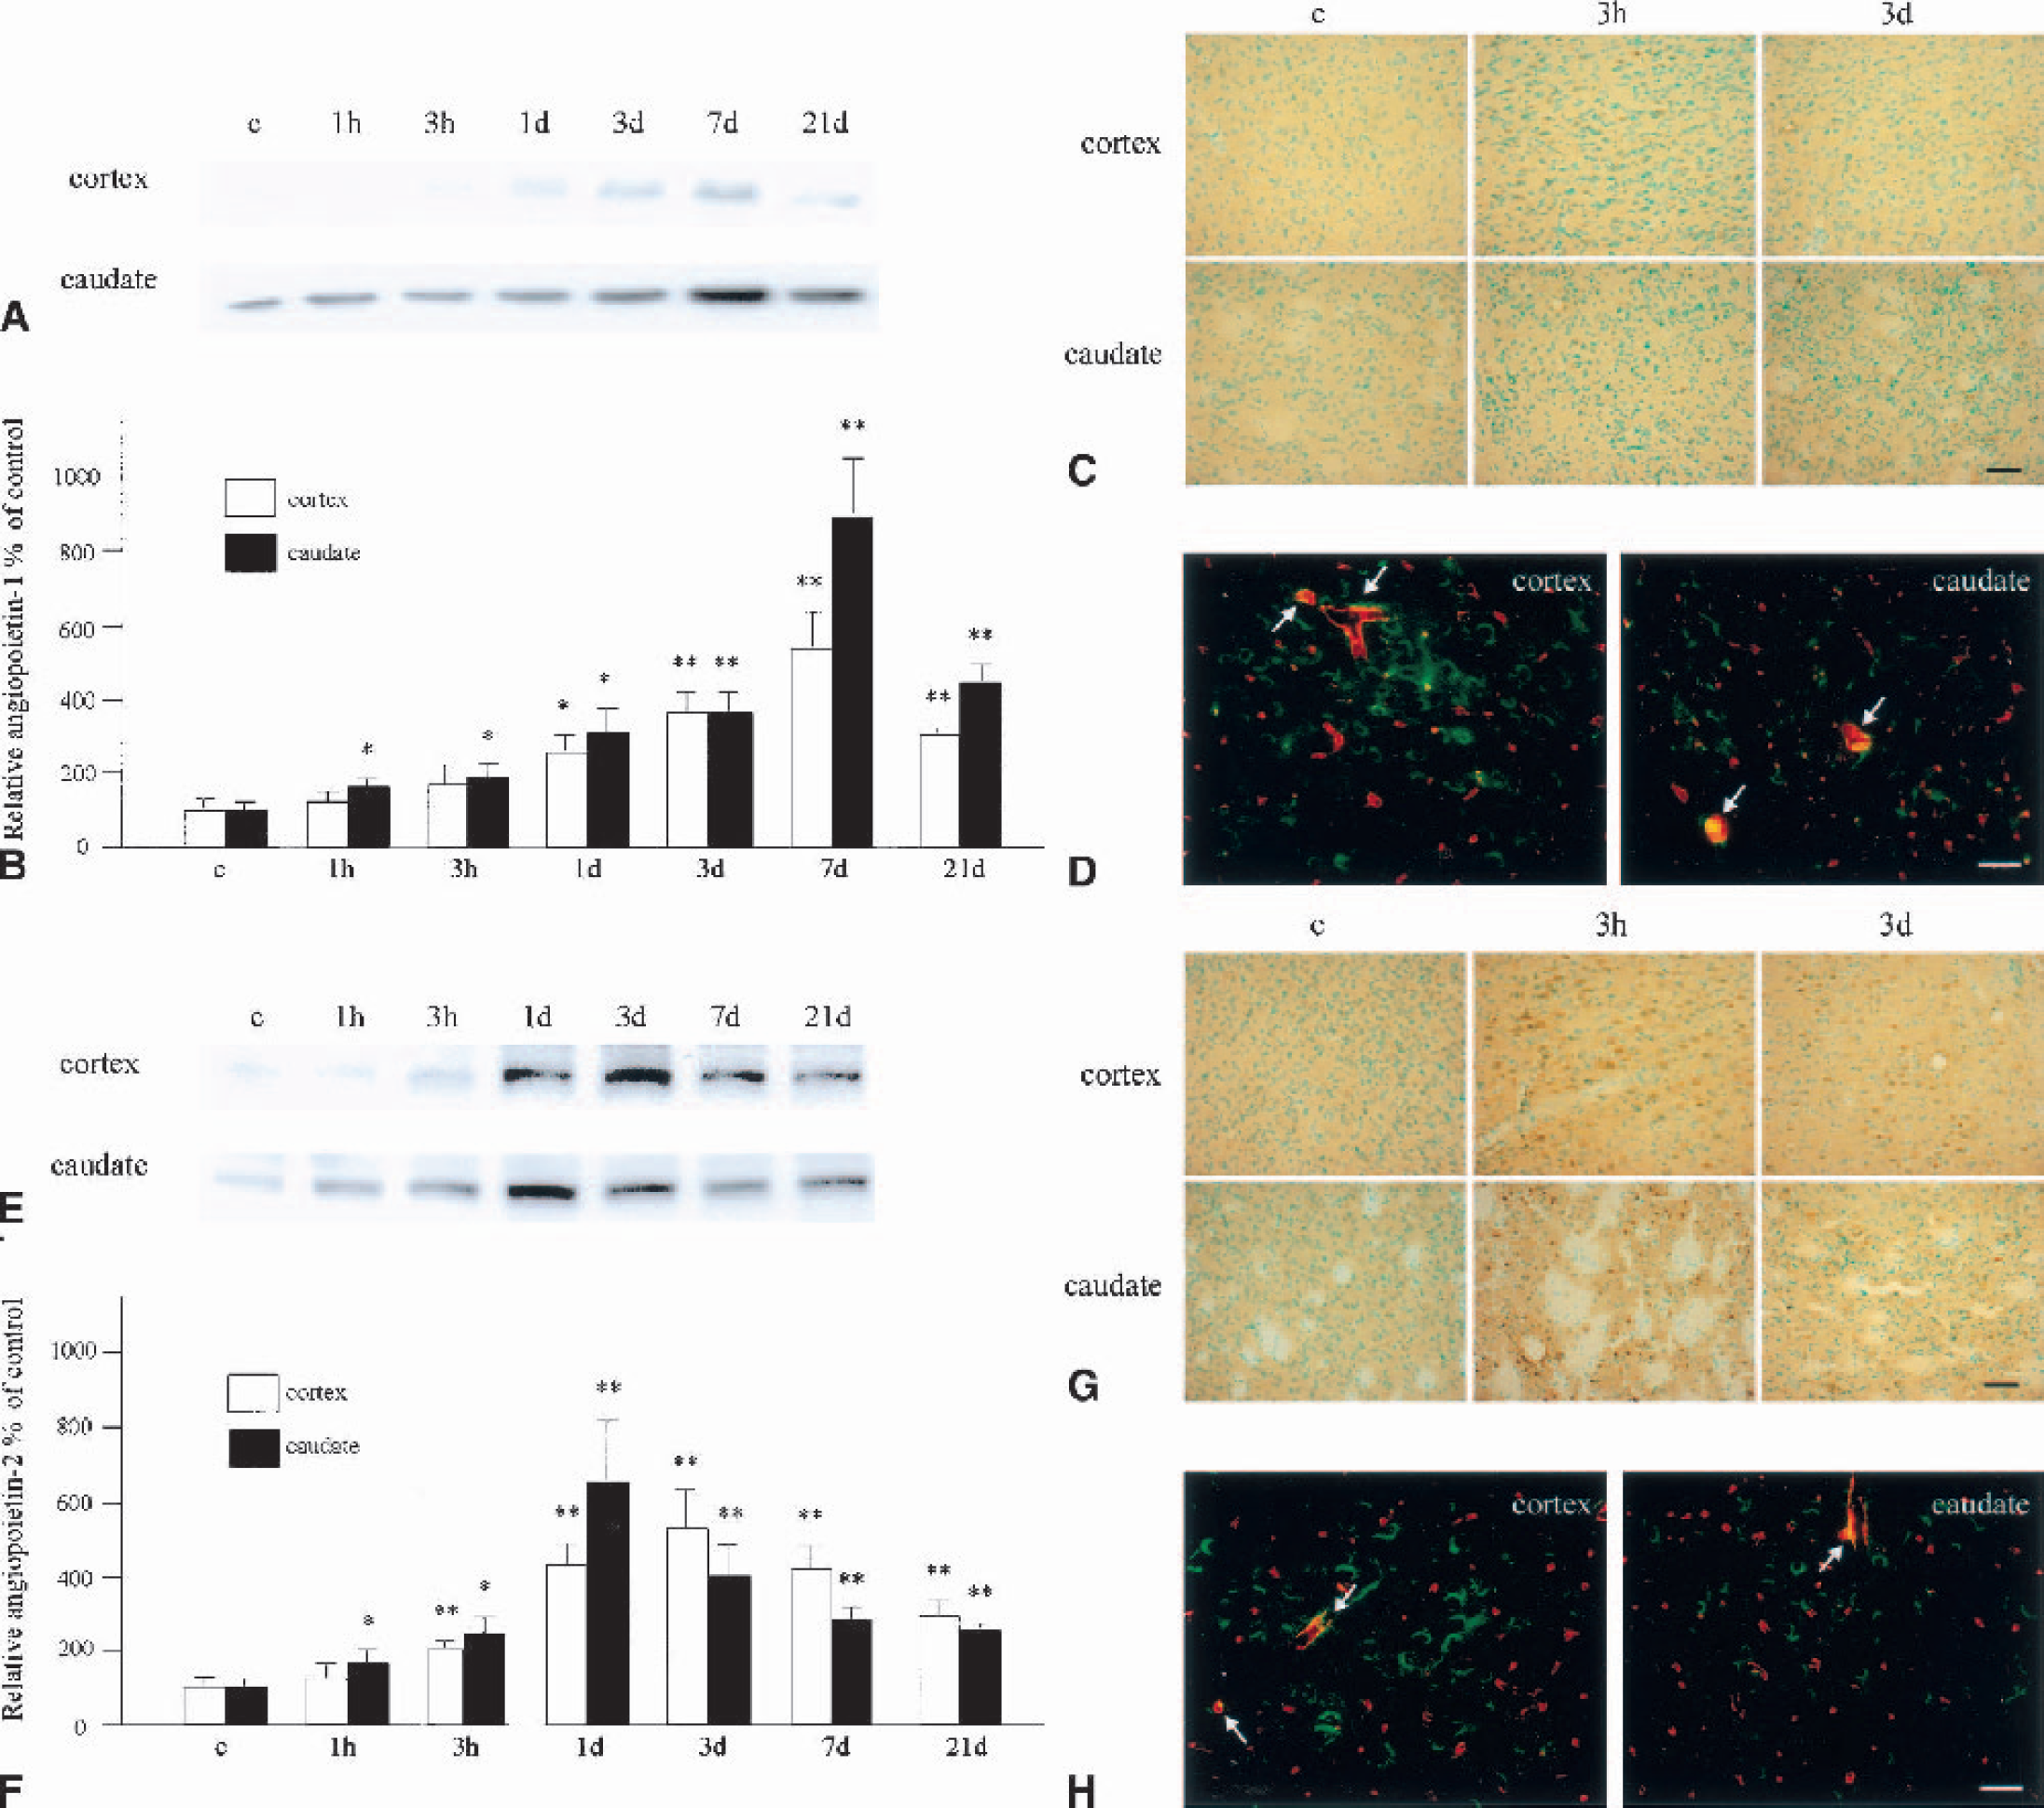
Change in expression of angiopoietin-1 and angiopoietin-2.
Western blotting for angiopoietin-2 showed a weak band with an MW of 55 kd in the control brains, in both the cerebral cortex and the caudate (Fig. 6E). The immunoreactivity gradually increased and peaked at 3 days in the cerebral cortex and at 1 day in the caudate and decreased thereafter. The increase in OD was statistically significant compared with the control group from 3 hours to 21 days in the cerebral cortex (P < 0.01) and from 1 hour to 21 days in the caudate (P < 0.05 from 1 hour to 1 day, P < 0.01 from 3 days to 21 days) (Fig. 6F). Immunohistochemical analysis disclosed that control brains showed barely detectable immunoreactivity, but that neuronal and endothelial cells became positively stained at 3 hours of reperfusion in both the cerebral cortex and the caudate (Fig. 6G). The immunoreactivity remained definite throughout the investigated time course. A double fluorescence study with L esculentum lectin further demonstrated that some of the angiopoietin-2–positive sites were endothelial cells (Fig. 6H).
DISCUSSION
In the present study, we investigated change in angiogenesis-related gene expression with a cDNA array study and compared the results of this study with a temporal profile of new vessel formation. Furthermore, we carried out Western blotting and immunohistochemical analysis for some angiogenic and antiangiogenic molecules to confirm their expression at the protein level. There have been three reports that applied cDNA array technology to the investigation of gene expression change in cerebral ischemia. One investigated apoptosis-related genes (Jin et al., 2001), one bone and cartilage genes (Soriano et al., 2000), and another neural plasticity-related genes (Keyvani et al., 2002). Jin et al. (2001) used a microarray consisting of human genes, and the latter two studies used those of rat genes. Ours is therefore the first report to use a mouse gene cDNA array to investigate cerebral ischemia—related gene changes. Because the results of the cDNA array study were compatible with those of Western blotting and immunohistochemical analysis, we consider this to be a useful and reliable method for this kind of experiment.
We found that more than 40% of genes were increased at 1 hour of reperfusion (Table 1). At 1 and 21 days, many genes showed a significant increase in expression (Tables 2 and 3). This is in contrast to previous reports in which a relatively small percentage of genes showed a significant increase (Jin et al., 2001; Keyvani et al., 2002). In addition, no genes decreased to a statistically significant degree at 1 hour of reperfusion in our study. This is not surprising because almost no angiogenesis occurs in the normal brain; histologic analysis showed that very few endothelial cells possessed Ki67 immunoreactivity in the control brains (Fig. 2). The basic expression level of angiogenic factors should be very low.
We demonstrated that endothelial cells began mitosis as early as 1 day after reperfusion. This finding is quite interesting because it has been thought that proliferation of endothelial cells begins only several days after ischemia (Chen et al., 1994; Krupinski et al., 1994). Our cDNA array study showed that many genes were increased as early as 1 hour after reperfusion, including many mitogens for endothelial cells and their receptors (Table 1); VEGF, VEGF receptors (flk-1 and FMS-like tyrosine kinase 1), FGF, FGF receptors, PDGF, and HGF were all significantly increased at 1 hour. This rapid increase in endothelial cell mitogens is likely to be the cause of rapid endothelial cell proliferation. Tissue under ischemic conditions needs almost immediate collateral blood flow; therefore, the angiogenic reaction should be very quick. The rapid increase in endothelial cell mitogen receptors is also important for possible therapeutic angiogenesis in ischemic stroke. Application of an angiogenic factor should be most effective when its receptor is highly expressed. From this study, we can speculate that the effect of angiogenic factor application should be relatively poor when applied in the very late stages.
Thrombospondin-1 is one of the molecules that we first found to change expression in the brain after ischemia. It is produced by various cells and is important for inhibiting proliferation and migration of endothelial cells (Iruela-Arispe et al., 1991; Lawler, 2000). Its temporal profile of expression was quite unique; it was decreased from 3 hours after a transient slight increase, and then increased from 3 days (Fig. 4). The role of the first transient increase is uncertain, but may be caused by the early increase in VEGF and flk-1 (Fig. 5). Vascular endothelial growth factor induces transcription of thrombospondin-1 through flk-1–mediated mechanisms (Suzuma et al., 1999). Of note was that CD36, which is a receptor for thrombospondin-1 (Jimenez et al., 2000), was also increased at 1 hour of reperfusion (Table 1). The decrease in this molecule may be important for promoting angiogenesis. A previous study showed that disruption of thrombospondin-1 expression facilitated new vessel formation in vitro (DiPietro et al., 1994). Our study showed that a decrease in this molecule preceded an increase in endothelial cell proliferation. The later increase may be important for stopping angiogenesis. We compared expression of thrombospondin-1 and the appearance of TUNEL-positive endothelial cells, but they did not correlate either temporally or geographically. Although thrombospondin-1 induced apoptosis of the endothelium in tumors, it did not cause endothelial cell death in normal tissue (Jimenez et al., 2000). Therefore, thrombospondin-1 could possibly inhibit angiogenesis without causing endothelial cell apoptosis. Indeed, it stimulates migration of vascular smooth muscle cells and mediates vascular maturation (Majack et al., 1988).
In the present study, we demonstrated that angiopoietin-1 and angiopoietin-2 were dramatically increased after ischemic injury (Fig. 6). Immunoreactivity was also confirmed in the endothelial cells, which was compatible with previous reports (Beck et al., 2000; Lin et al., 2001). Angiopoietin-1 is important not only for sprouting endothelial cells but also for recruiting periendothelial cells (Beck et al., 2000; Conway et al., 2001). In contrast, angiopoietin-2 is involved in detachment of periendothelial cells and loosening of surrounding matrix (Conway et al., 2001). The peak of expression was different between these two angiopoietins: angiopoietin-1 at 7 days and angiopoietin-2 at 1 to 3 days. This finding is reasonable for the temporal profile of new vessel formation observed in this study (Fig. 2). Angiopoietin-2 expression preceded or coincided with proliferation of endothelial cells, and angiopoietin-1 expression preceded a decrease in endothelial cells under mitosis. Of note is that angiopoietin-1 increased as early as 1 hour after reperfusion. This may be for the purpose of reducing vascular permeability. It has been reported that angiopoietin-1 plays an important role in preventing vasogenic brain edema (Thurston et al., 2000). It should also be taken into account that angiopoietin-2 promotes endothelial cell apoptosis when VEGF is lacking. In the present study, VEGF and flk-1 were highly expressed when angiopoietin-2 expression was near the peak. Therefore, the proapoptotic effect of angiopoietin-2 should not be important in this ischemic model.
Among the genes that increased at 1 hour, attention should be paid to eNOS and COX1 (Table 1). These molecules are implicated in vascular permeability and vasodilation (Nag et al., 2001; Niwa et al., 2001). Because an increase in vascular permeability and vasodilation is important for triggering endothelial cell proliferation, these molecules are probably involved in the initial stage of angiogenesis (Murohara et al., 1998; Murphy and Fitzgerald, 2001; Zhang et al., 2002). The mRNA of both molecules was normalized at 1 day, indicating that an increase in permeability and vasodilation is necessary only at the early stage of new vessel formation. We found that the ephrin family of genes also showed increased expression only at 1 hour of reperfusion (Table 1). As far as we know, this is the first report that demonstrates their induction after ischemia. An in vitro study showed that they are induced by VEGF (Cheng et al., 2002); therefore, increased expression in this family of genes may be due to VEGF induction rather than hypoxia itself. Ephrin family members have recently been recognized as angiogenic molecules, and their roles are quite different from tissue to tissue, from situation to situation (Gale and Yancopoulos, 1999; Ogawa et al., 2000). Although they are not direct mitogens for endothelial cells, they are necessary for VEGF-mediated survival and migration of endothelial cells (Cheng et al., 2002). As in vitro studies have shown (Huynh-Do et al., 1999), ephrin family members could be implicated in cell-matrix interaction in vivo. Further investigation, however, is required to make clear the exact role of these molecules in the brain after ischemia.
We found that CTGF was induced at 1 day, and fibronectin, macrophage scavenger receptor 1, and PlGF at 21 days (Tables 2 and 3). Connective tissue growth factor is involved in extracellular matrix deposit (Oemar and Luscher, 1997), and fibronectin is involved in wound healing, as well as in cell adhesion and motility (Garat et al., 1996). Macrophage scavenger receptor 1 is important for phagocytosis and lipid influx of macrophages (Suzuki et al., 1997), of which infiltration could be mediated by angiopoietins (Manoonkitiwangsa et al., 2001). These molecules may therefore play important roles in tissue repair after ischemic injury. As for PlGF, it combines with VEGF to form a heterodimer. This heterodimer is less potent than the VEGF homodimer, and consequently, PlGF acts as a partial antagonist of VEGF (DiSalvo et al., 1995). This molecule may be important for stabilizing and stopping angiogenesis.
Therapeutic angiogenesis is not currently available for cerebrovascular disease. Previous reports have demonstrated that VEGF is effective for ischemic stroke (Hayashi et al., 1998; Harrigan et al., 2002), but others have shown its detrimental effects (Zhang et al., 2000). We have now demonstrated that many genes are increased or decreased in the brain after ischemia. These molecules act in an orchestrated fashion in the brain. Not only endothelial cell mitogens, but also molecules implicated in vascular permeability, periendothelial cell recruitment, and tissue remodeling, all play important roles. Antiangiogenic factors may also play active roles. Based on the data obtained from this study, making available effective therapeutic angiogenesis is the next challenge.
Footnotes
Abbreviations used
Acknowledgments
The authors thank Liza Reola, Bernard Calagui, and Ghezal Omar for technical assistance, Cheryl Christensen for editorial assistance, and Elizabeth Hoyte for figure preparation.