
Abstract
Proinflammatory cytokines and chemokines are quickly upregulated in response to ischemia/reperfusion (I/R) injury; however, the relationship between I/R-induced oxidative stress and cytokine/chemokine expression has not been elucidated. We investigated the temporal profile of cytokine and chemokine gene expression in transient focal cerebral ischemia using complementary DNA array technology. Among 96 genes studied, 10, 4, 11, and 5 genes were increased at 6, 12, 24, and 72 h of reperfusion, respectively, whereas, 4, 11, 8, and 21 genes, respectively, were decreased. To clarify the relationship between chemokines and oxidative stress, we compared the gene and protein expression of monocyte chemoattractant protein 1 (MCP-1) and macrophage inflammatory protein-1α (MIP-1α) in wild-type (WT) mice and copper/zinc-superoxide dismutase (SOD1) transgenic (Tg) mice. Monocyte chemoattractant protein-1 and MIP-1α mRNA were significantly upregulated at 6 to 12 h of reperfusion. In the SOD1 Tg mice, however, MCP-1 and MIP-1α mRNA expression was significantly decreased 12 h postinsult. In the WT mice, MCP-1 and MIP-1α protein expression peaked 24 h after onset of reperfusion determined by immunohistochemistry. In the SOD1 Tg mice, MCP-1 and MIP-1α immunopositive cells were reduced, as were concentrations of these proteins (measured by enzyme-linked immunosorbent assay) at 24 h of reperfusion. Our results suggest that MCP-1 and MIP-1α expression is influenced by I/R-induced oxidative stress after transient focal stroke.
Introduction
Cerebral ischemia triggers a cascade of proinflammatory molecular and cellular events. Ischemia and reperfusion (I/R), in particular, elicit an inflammatory response characterized by increased production and interplay of reactive oxygen species (ROS), cytokines, chemokines, adhesion molecules, and destructive enzymes (i.e., cyclooxygenase-2, nitric oxide synthase, and proteinases). The ensuing activation of resident microglia and transendothelial migration of circulating neutrophils and monocytes/macrophages have been implicated in the loss of microvascular integrity, vasogenic edema, exacerbation of neuronal injury, and even hemorrhage (Wang and Lo, 2003). Thus, understanding the mechanisms that lead to secondary or delayed neuronal injury is critical to the development of therapeutic strategies for stroke. In this study, we sought to examine the relationship between I/R-induced ROS production and the expression of cytokines (e.g., tumor necrosis factor α (TNFα), interleukin [IL]-1β, and IL-6) and chemokines (e.g., monocyte chemoattractant protein 1 (MCP-1) and macrophage inflammatory protein 1 α (MIP-1α)) after focal stroke.
mRNA and protein expression of several chemokines have been shown to increase after permanent focal cerebral ischemia (Kim et al, 1995). However, most cytokines and chemokines have not been studied in depth after transient focal cerebral ischemia. In the current study, we used a well-established complementary DNA (cDNA) array method to investigate the temporal gene expression profile of inflammatory cytokines, chemokines, and their receptors in a transient middle cerebral artery occlusion (MCAO) model. We used copper/zinc-superoxide dismutase (SOD1) transgenic (Tg) mice, which are more resistant to oxidative stress and I/R-induced ischemic neuronal damage (Kinouchi et al, 1991), than their wild-type (WT) littermates. Based on the results from the cDNA array study, we then focused particular attention on the expression of MIP-1α and MCP-1.
Macrophage inflammatory protein-1α is a member of the β-family of chemokines and was originally identified as a heparin-binding protein that has inflammatory and neutrophil chemokinetic properties (Wolpe et al, 1988). Macrophage inflammatory protein-1α modulates the functions of macrophages (Fahey et al, 1992) and triggers hydrogen peroxide production from leukocytes (Wolpe et al, 1988; Appelberg, 1992). Monocyte chemoattractant protein-1 is in the same family as MIP-1α; it participates in the inflammatory response and contributes to the development of ischemic brain injury (Kim et al, 1995). Monocyte chemoattractant protein-1 is a chemoattractant specific to monocytes and basophils (but not neutrophils) (Bischoff et al, 1992), and induces expression of adhesion molecules and cytokine production in monocytes (Miller and Krangel, 1992). It is well known that expression of MIP-1α and MCP-1 is increased after permanent MCAO (Kim et al, 1995; Che et al, 2001); however, their profiles in transient MCAO require further examination.
Materials and methods
Superoxide Dismutase 1 Transgenic Mice
Heterozygous SOD1 Tg mice of the SOD1 TGHS/SF-218-3 strain with a CD-1 background, carrying human SOD1 genes with a threefold increase in SOD1, were derived from the founder stock previously described (Kinouchi et al, 1991). They were backcrossed with CD-1 WT mice for more than 10 generations and were identified by quantitative demonstration of SOD1 using non-denaturing gel electrophoresis, followed by nitroblue tetrazolium staining. There were no phenotypic differences (including vascular anatomy and cerebral blood flow) between the SOD1 Tg mice and their WT littermates.
Focal Cerebral Ischemia
All procedures were in accordance with the National Institutes of Health Guide for the Care and Use of Laboratory Animals and were approved by our institution's Administrative Panel on Laboratory Animal Care. Male CD-1 mice (3 months old, weighing 35 to 40 g) were subjected to MCAO using a nylon suture as described previously (Yang et al, 1994). In brief, the mice were anesthetized with 1.5% isoflurane, 68.5% nitrous oxide, and 30% oxygen using a face mask. Body temperature was monitored with a rectal probe and controlled at 37°C with a homeothermic blanket. A midline neck incision was made and the left external carotid artery was exposed. After electrocoagulation of its branches, an 11-mm 5-0 monofilament nylon suture with a blunted tip was introduced into the left internal carotid artery through the external carotid artery stump. After 60 mins of ischemia, cerebral blood flow was restored by removal of the nylon suture.
Complementary DNA Array Study
At 6, 12, 24, and 72 h after reperfusion onset, the animals were deeply anesthetized with isoflurane (n = 4 for each time point). Sham-operated animals underwent exposure of carotid arteries without nylon suture insertion (n = 4 for each time point). After decapitation, the brains were quickly removed and the MCA territory was obtained. The tissue was immediately frozen in powdered dry ice and kept at -80°C until use. Extraction of total RNA was performed using TRIzol reagent (15596-026; Invitrogen, Carlsbad, CA, USA) in accordance with the manufacturer's instructions. The concentration of RNA was assessed by an optical density ratio of 260:280 and with gel electrophoresis. Single-strand cDNA was synthesized by reverse transcription of RNA (3 μg) at 42°C for 90 mins with the use of biotin-16-deoxyuridine 5′-triphosphate (1093070; Roche, Mannheim, Germany), M-MLV reverse transcriptase (M1701; Promega, Madison, WI, USA), and a primer mix from the cDNA array kit (MM-015N; SuperArray, Bethesda, MD, USA). Labeling, hybridization, and washing of the membrane were performed according to the manufacturer's instructions. In brief, a nylon membrane (3.8 × 4.8 cm2), on which fragments of inflammatory cytokine-related genes and housekeeping genes were printed, was prehybridized with salmon sperm DNA (15632-011; Invitrogen) and then hybridized with the cDNA obtained earlier. After 12 h of incubation at 60°C, the membrane was washed twice in 2 × saline-sodium citrate (1 × in 150 mmol/L NaCl, 15 mmol/L trisodiumcitrate, pH 7.0) with 1% sodium dodecyl sulfate and twice in 0.2 × saline-sodium citrate with 0.5% sodium dodecyl sulfate. The membrane was then blocked with a solution from the kit and incubated with streptavidin-conjugated alkaline-phosphatase. Subsequently, the membranes were treated with CDP-star (MS050R; Applied Biosystems, Bedford, MA, USA) and exposed on X-ray film. The film was scanned and densitometry was performed with multi-Analyst software (ST3215N; Bio-Rad, Hercules, CA, USA). Briefly, grids were applied to each gene spot and the density was quantified with background signal subtraction. The spot density of the internal control housekeeping genes (i.e., β-actin and RPL13A) on the membrane was also determined and the ratio of each gene to the housekeeping gene was calculated. This ratio was obtained from each animal and the data from the ischemic brains at each time point were compared with those from the sham-operated brains.
Reverse Transcription
Complementary DNA was constructed by reverse transcriptase-polymerase chain reaction (RT-PCR) using SuperScript II Reverse Transcriptase (Invitrogen) according to the manufacturer's instructions. We heated 13-μL samples containing total RNA (2 μg), 1 μL of 10 mmol/L 2′-deoxynucleoside 5′-triphosphate (dNTP Mix PCR Grade; Invitrogen), and 1 μL of Oligo(dT)12–18 Primer (Invitrogen) at 65°C for 5 mins to denature the RNA and then chilled the samples on ice for 5 mins. We then added mixed buffer (50 mmol/L Tris-HCl (pH 8.3), 75 mmol/L KCl 3 mmol/L MgCl2 and 5 mmol/L dithiothreitol (Invitrogen)) to a total volume of 19 μL. All samples were heated to 42°C for 2 mins and then 1 μL of 200 U SuperScript II was added for a final volume of 20 μL. The reverse transcription reaction was performed by PCRExpress Thermal Cycler (Thermo Hybaid, Franklin, MA, USA) at 42°C for 50 mins and was stopped by heating to 70°C for 15 mins. The cDNA was then stored at -20°C. For this study we used animals at 6, 12, 24, and 48 h of recirculation and sham-operated animals (WT and SOD1 Tg mice, n = 4 for each time point).
Real-Time Quantitative RT-PCR
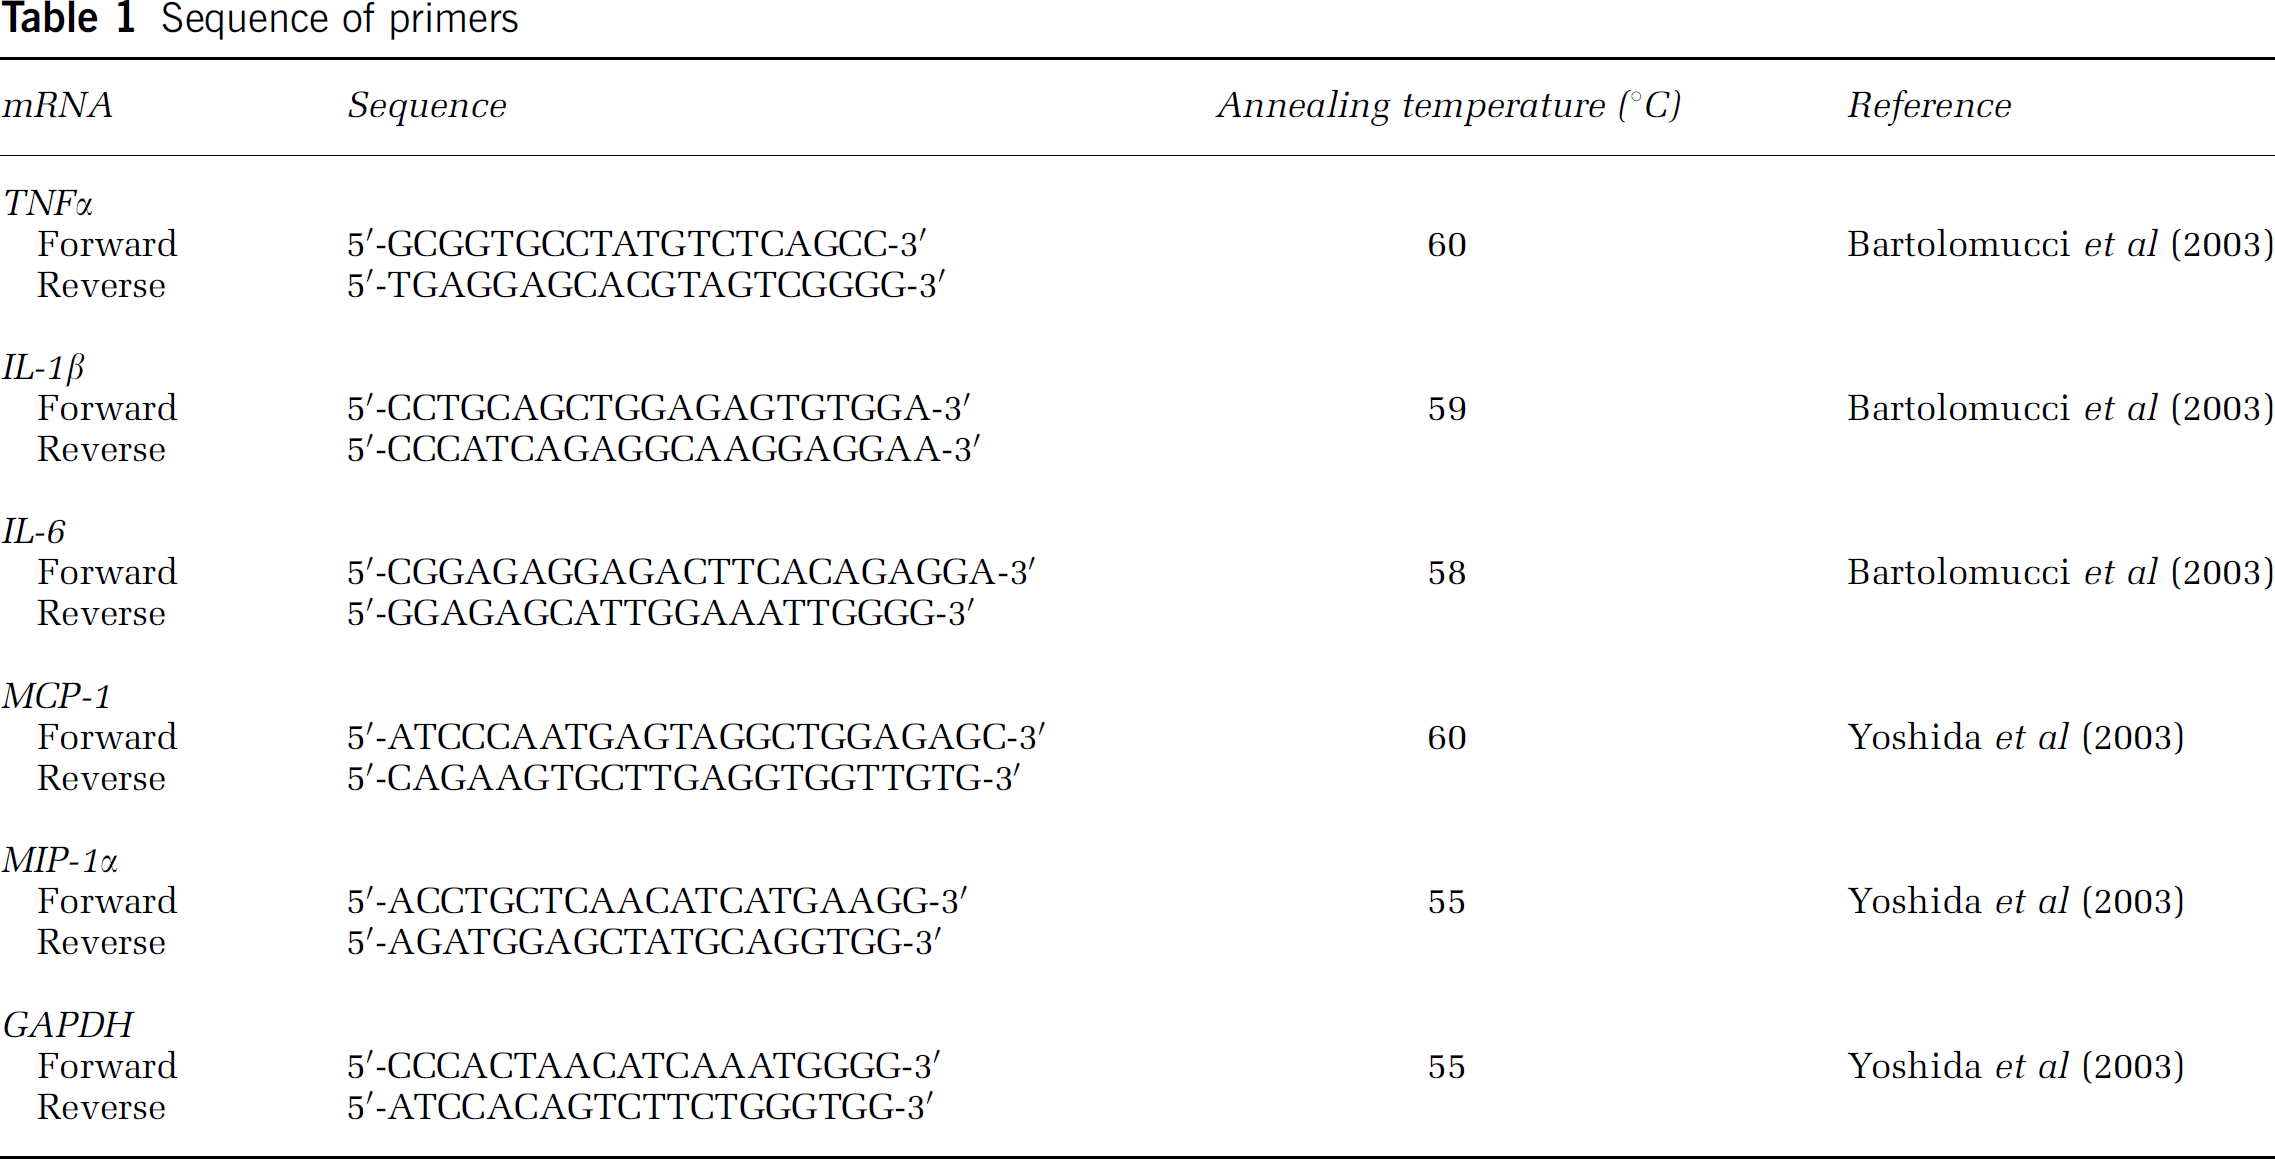
Real-time quantitative RT-PCR was performed using QuantiTect SYBR Green PCR Master Mix (QIAGEN, Valencia, CA, USA) including ROX dye as an internal control according to the manufacturer's instructions. In brief, all cDNA samples (2.5 μL) were mixed with 12.5 μL of QuantiTect SYBR Green PCR Master Mix and 1.0 μL of primer (5 pmol/L, sense and antisense) and 8 μL of RNasefree water (total 25 μL). Primer sets and annealing temperature were synthesized according to published sequences (Table 1; Bartolomucci et al, 2003; Yoshida et al, 2003). The sequence PCRs were performed with a Mx3000P Real-Time PCR System (Stratagene, La Jolla, CA, USA). Thermal cycling conditions were as follows: activation of HotStarTaq DNA polymerase (QIAGEN) at 95°C for 15 mins, followed by 40 cycles of denaturation at 94°C for 30 secs, annealing for 30 secs, and extension at 72°C for 20 secs. All samples were run in duplicate and the output level was reported as the average of the two wells. The threshold cycle, which represents the PCR cycle at which an increase in fluorescence above background is first detected, was determined by the Mx3000P software based on the generated standard curves. Each time point was expressed as normalized expression of target gene with respect to glyceraldehyde 3-phosphate dehydrogenase (GAPDH) and divided by control samples.
Sequence of primers
Immunohistochemistry
Animals were transcardially perfused with 10 U/mL heparin and subsequently with 4% paraformaldehyde in 0.1 mol/L phosphate-buffered saline, pH 7.4, at 6, 12, 24, or 48 h of reperfusion. The brains were quickly removed, postfixed for 12 h, and sectioned at 50 μm on a vibratome. To quench endogenous peroxidases, we used 1% hydrogen peroxide and 30% methanol in phosphate-buffered saline for 30 mins at room temperature. To avoid nonspecific binding, the tissue was treated with 20% normal goat serum and the sections were incubated with rat anti-mouse MCP-1 monoclonal antibody (Abcam, Cambridgeshire, UK) at a 1:150 dilution and rabbit anti-mouse MIP-1α polyclonal antibody (Abcam) at a 1:150 dilution overnight at 4°C. The sections were incubated with biotinylated goat anti-rat immunoglobulin G (IgG) antibody (Vector Laboratories, Burlingame, CA, USA) at a 1:500 dilution for MCP-1 and biotinylated goat anti-rabbit IgG (Vector Laboratories) for MIP-1α for 90 mins at room temperature. The sections were subsequently incubated with avidin-biotin-peroxidase complex (ABC-Elite Kit; Vector Laboratories) for 30 mins and then developed using 3,3-diaminobenzidine (DAB substrate Kit; Vector Laboratories) as a color substrate. Methyl green was used for counterstaining.
Fluorescent Double Staining
We performed double staining to evaluate MCP-1 colocalization with neurons, astrocytes, and endothelial cells. Sections fixed by 4% paraformaldehyde were immunostained with MCP-1 antibodies and a biotinylated goat anti-rat IgG antibody (Vector Laboratories) as described above, and were then incubated with Fluorescein Avidin DCS (Vector Laboratories). The tissue was then incubated in excess avidin followed by incubation with excess biotin (Avidin/Biotin Blocking Kit; Vector Laboratories) to block nonspecific labeling. The sections were then incubated with mouse anti-neuron-specific nuclear protein (NeuN) monoclonal antibody (Chemicon International, Temecula, CA, USA) at a 1:200 dilution, rabbit anti-glial fibrillary acidic protein (GFAP) polyclonal antibody (DakoCytomation, Carpinteria, CA, USA) for astrocytes, and biotinylated Lycopersicon esculentum lectin (Vector Laboratories) at a 1:200 dilution for endothelial cells. We also used rat anti-mouse integrin αM (CD11b) monoclonal antibody (Chemicon) at a 1:750 dilution for microglia/macrophages, but in this case we used a rabbit anti-mouse MCP-1 polyclonal antibody (Serotec, Oxford, UK) at a 1:500 dilution. After the sections were incubated with biotinylated goat anti-mouse IgG antibody (Vector Laboratories) for NeuN, goat anti-rabbit IgG antibody (Vector Laboratories) for GFAP, and biotinylated goat anti-rat IgG antibody (Vector Laboratories) for CD11b at a 1:500 dilution, they were incubated with Texas Red Avidin D (Vector Laboratories). In the same manner, we also performed double staining for MIP-1α and mouse anti-GFAP monoclonal antibody (Chemicon) at a 1:200 dilution, and MIP-1α and CD11b at the same dilutions described previously. Fluorescence of fluorescein was observed at an excitation of 495 nm and emission of >515 nm, and Texas Red fluorescence was observed at an excitation of 510 nm and emission of >580 nm.
Monocyte Chemoattractant Protein-1 Enzyme-Linked Immunosorbent Assay
To compare the quantitative expression of MCP-1 between the WT and SOD1 Tg mice, we performed an enzyme-linked immunosorbent assay (ELISA) as previously described (Che et al, 2001). In brief, both types of animals were decapitated at 6, 12, 24, or 48 h of reperfusion under deep anesthesia with isoflurane (n = 4 for each time point). Samples from sham-operated animals were also obtained (n = 4). The brains were quickly removed and the left hemispheres were weighed, frozen in powdered dry ice, and kept at -80°C until use. For protein extraction, the tissue was homogenized with five volumes of protein extraction buffer (20 mmol/L HEPES potassium hydroxide (pH 7.5), 250 mmol/L sucrose, 10 mmol/L potassium chloride, 1.5 mmol/L magnesium chloride, 1 mmol/L editic acid, 1 mmol/L ethyleneglycotetraacetic acid, and 0.7% protease inhibitor cocktail [Sigma Chemical Co., St Louis, MO, USA]). The homogenate was centrifuged at 10,000 g for 15 mins at 4°C and the supernatant was used for this study. The amount of MCP-1 was determined by a mouse MCP-1 ELISA kit (Pierce Biotechnology, Rockford, IL, USA) and the amount of MIP-1α was determined by a mouse MIP-1α ELISA kit (Quantikine; R&D Systems, Minneapolis, MN, USA). The concentrations were shown as ng/g wet tissue. All samples were assayed in duplicate. The optical density was determined by a microplate reader set to 450 nm with the wavelength set to 540 nm. Authentic MCP-1 and MIP-1α were used to obtain a standard curve.
Quantification and Statistical Analysis
In the cDNA array study, the relative density of each gene spot against the housekeeping gene was calculated as described. We used the cut-off criterion of a 2.0-fold difference of up or down gene expression in the ischemic brain, compared with the sham-operated brains in all the RNA pools. This ratio was used for data analysis, and the data obtained from each time point were compared with those from the sham-operated group using one-way ANOVA, followed by a Scheffe post hoc analysis (StatView, version 5.01; SAS Institute Inc, Cary, NC, USA). A P-value <0.05 was considered a change to a statistically significant degree. The relative ratio of the two ratios (ratio of each time point to ratio of control) was expressed as mean±s.d. In the RT-PCR and ELISA studies, the data are also expressed as mean±s.d. Comparisons between WT and Tg mice were achieved using ANOVA for repeated measure with Scheffé post hoc analysis (StatView). Significance was accepted with P<0.05.
Results
Complementary DNA Array Study
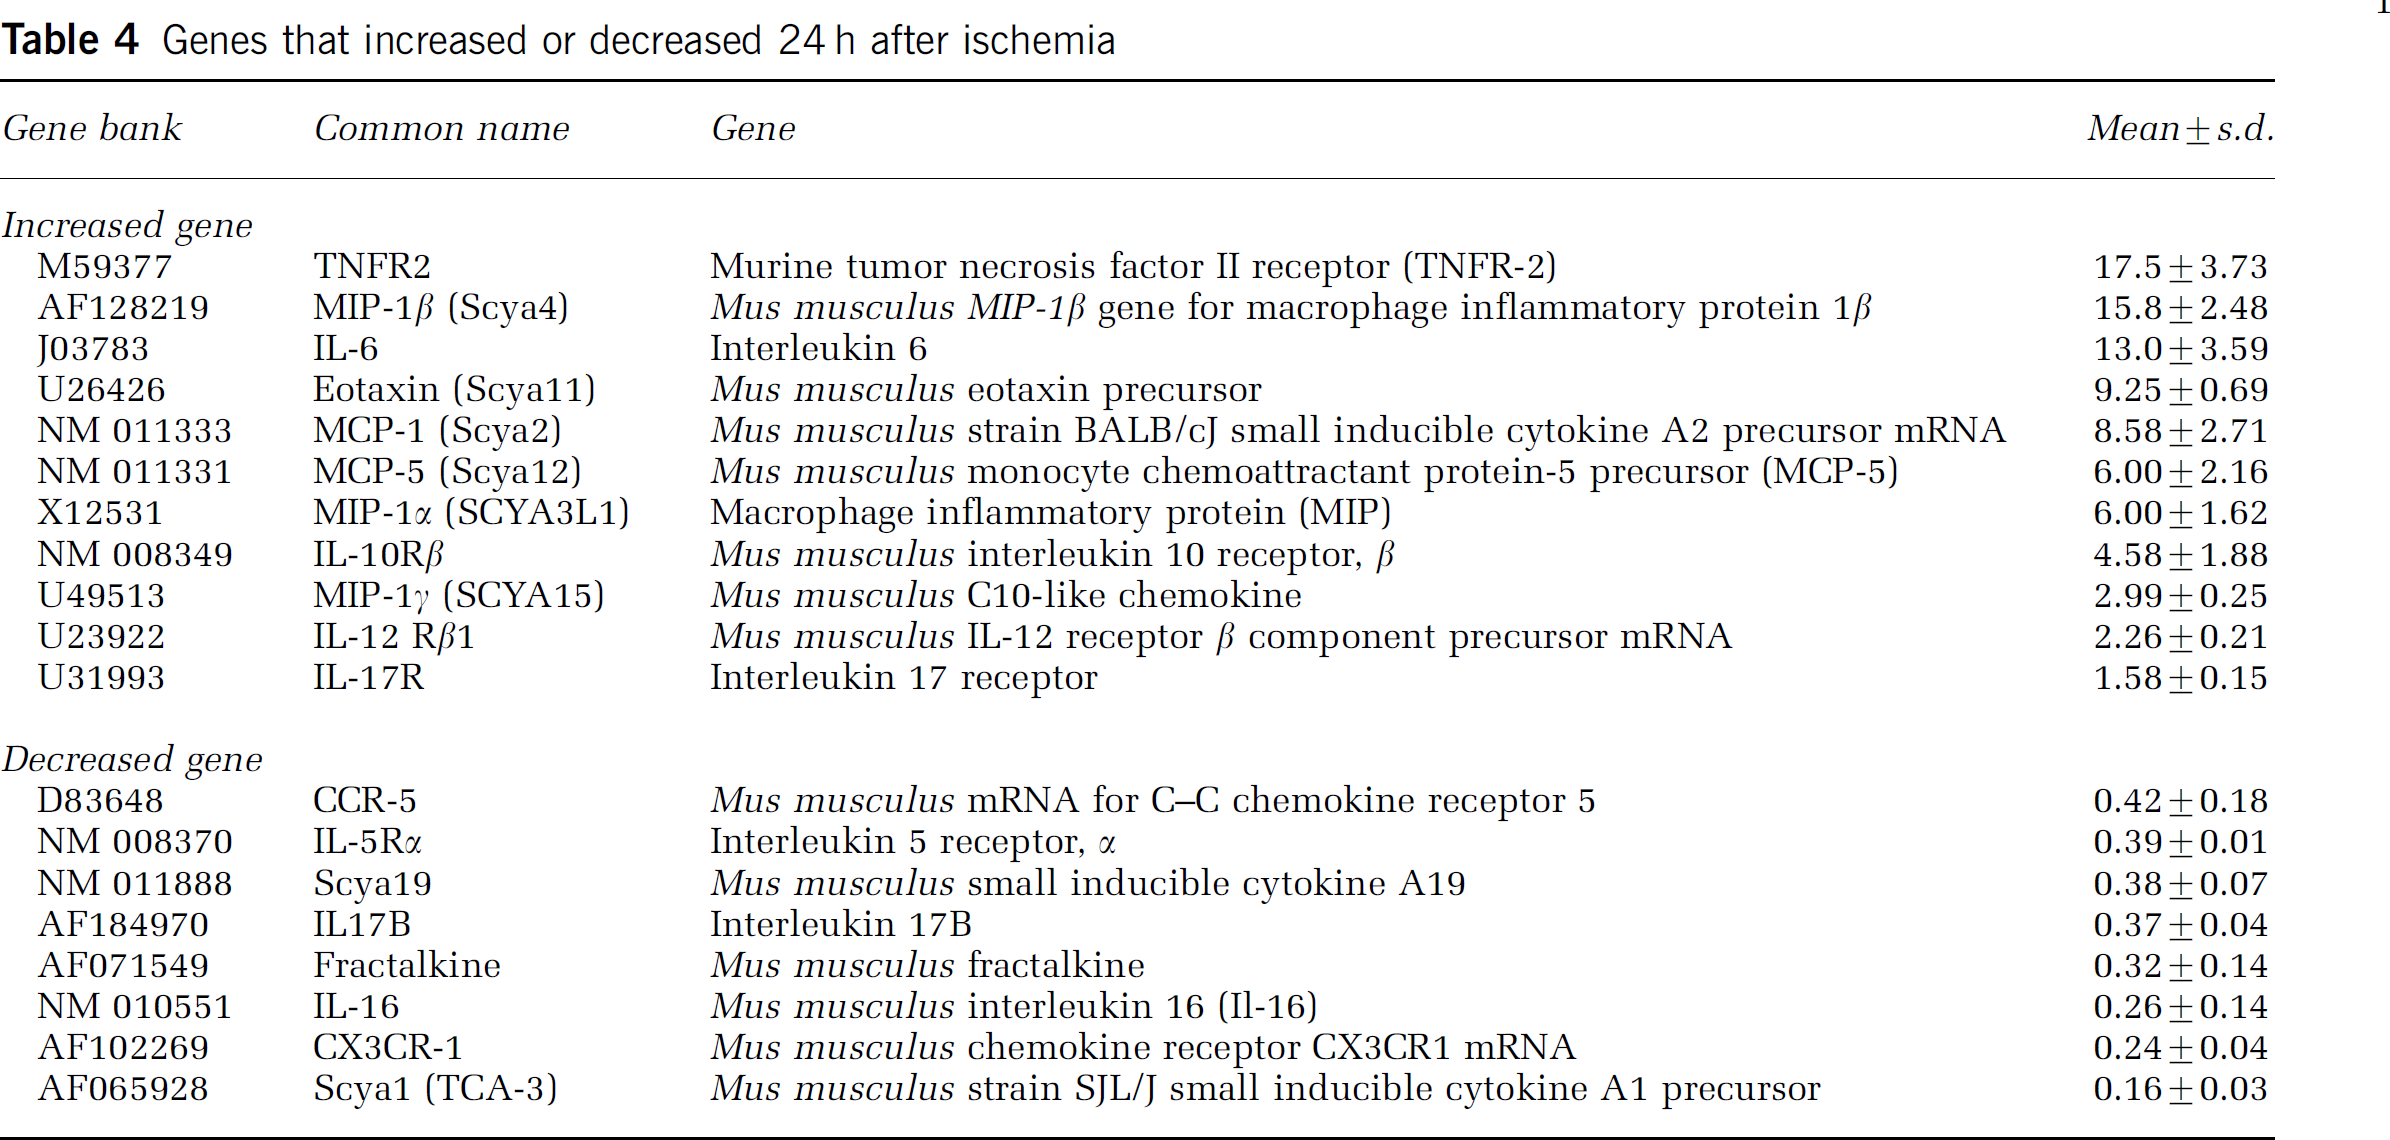
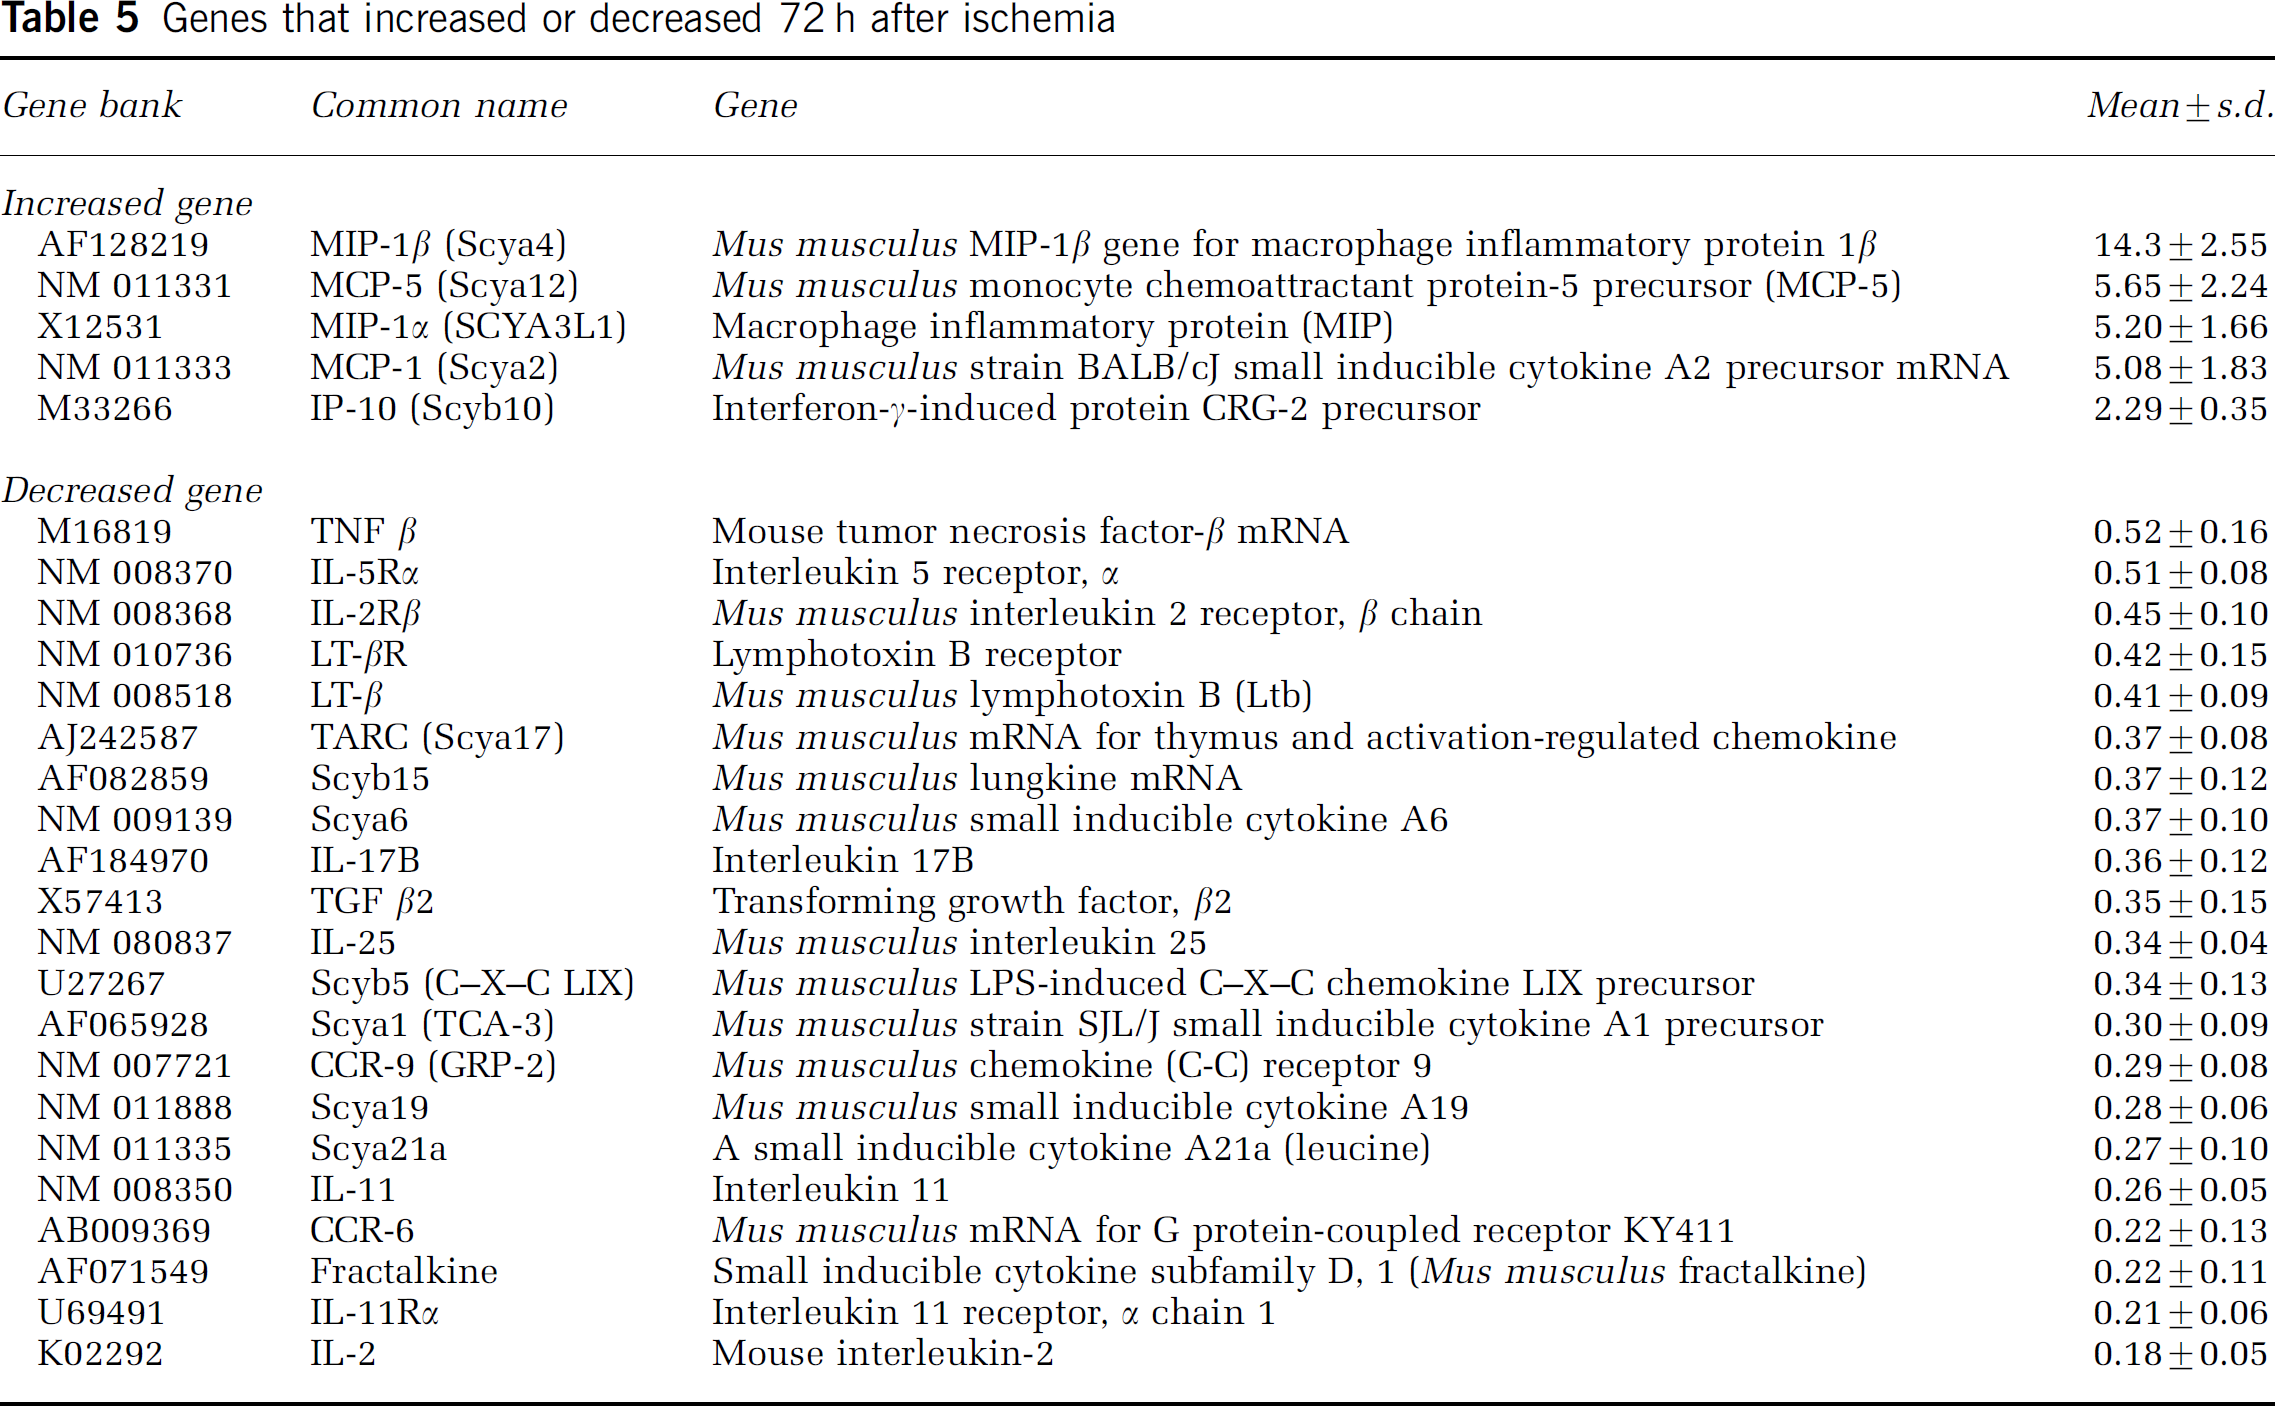
Among the 96 genes studied (60 cytokine genes and 36 receptor genes), 10, 4, 11, and 5 genes were significantly increased at 6, 12, 24, and 72 h of reperfusion, respectively (Table 2–Table 5). In contrast, 4, 11, 8, and 21 genes were decreased at the same time points, respectively.
Genes that increased or decreased 6 h after ischemia
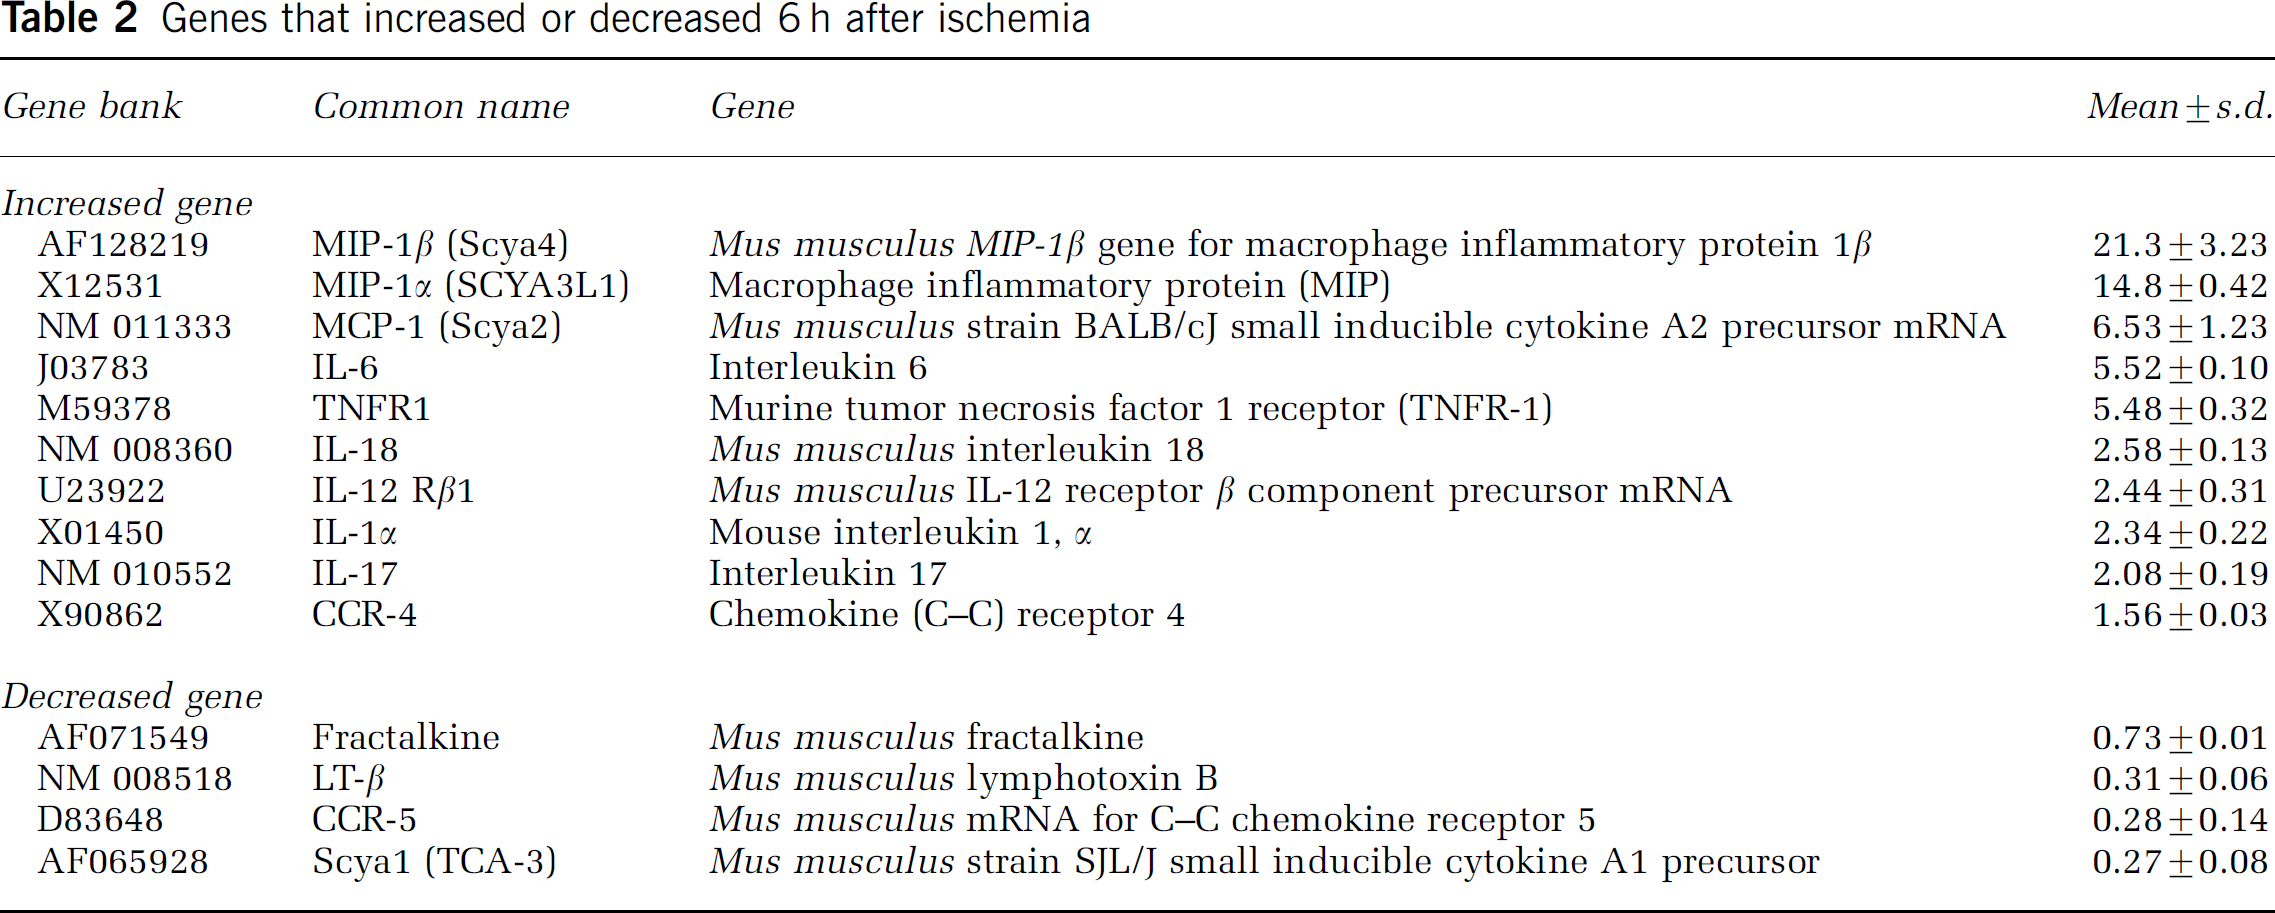
Increased genes: Macrophage inflammatory protein-1β expression peaked at 12 h of reperfusion and MIP-1α expression at 6 h; both were downregulated at later time points. Monocyte chemoattractant protein-1 appeared at 6 h and MCP-5 at 12 h of reperfusion. Both peaked at 24 h but were downregulated by 72 h of reperfusion. IL-6 appeared at 6 h and peaked at 24 h of reperfusion. IL-1α, IL-17, IL-18, TNFR1, IL-12Rβ1, and CCR-4 increased only at 6 h of reperfusion. TNFR2, eotaxin, IL-10 Rb, MIP-1γ, IL-12Rb1, and IL-17R increased at 24 h of reperfusion. IP-10 increased at 72 h of reperfusion.
Genes that increased or decreased 12 h after ischemia
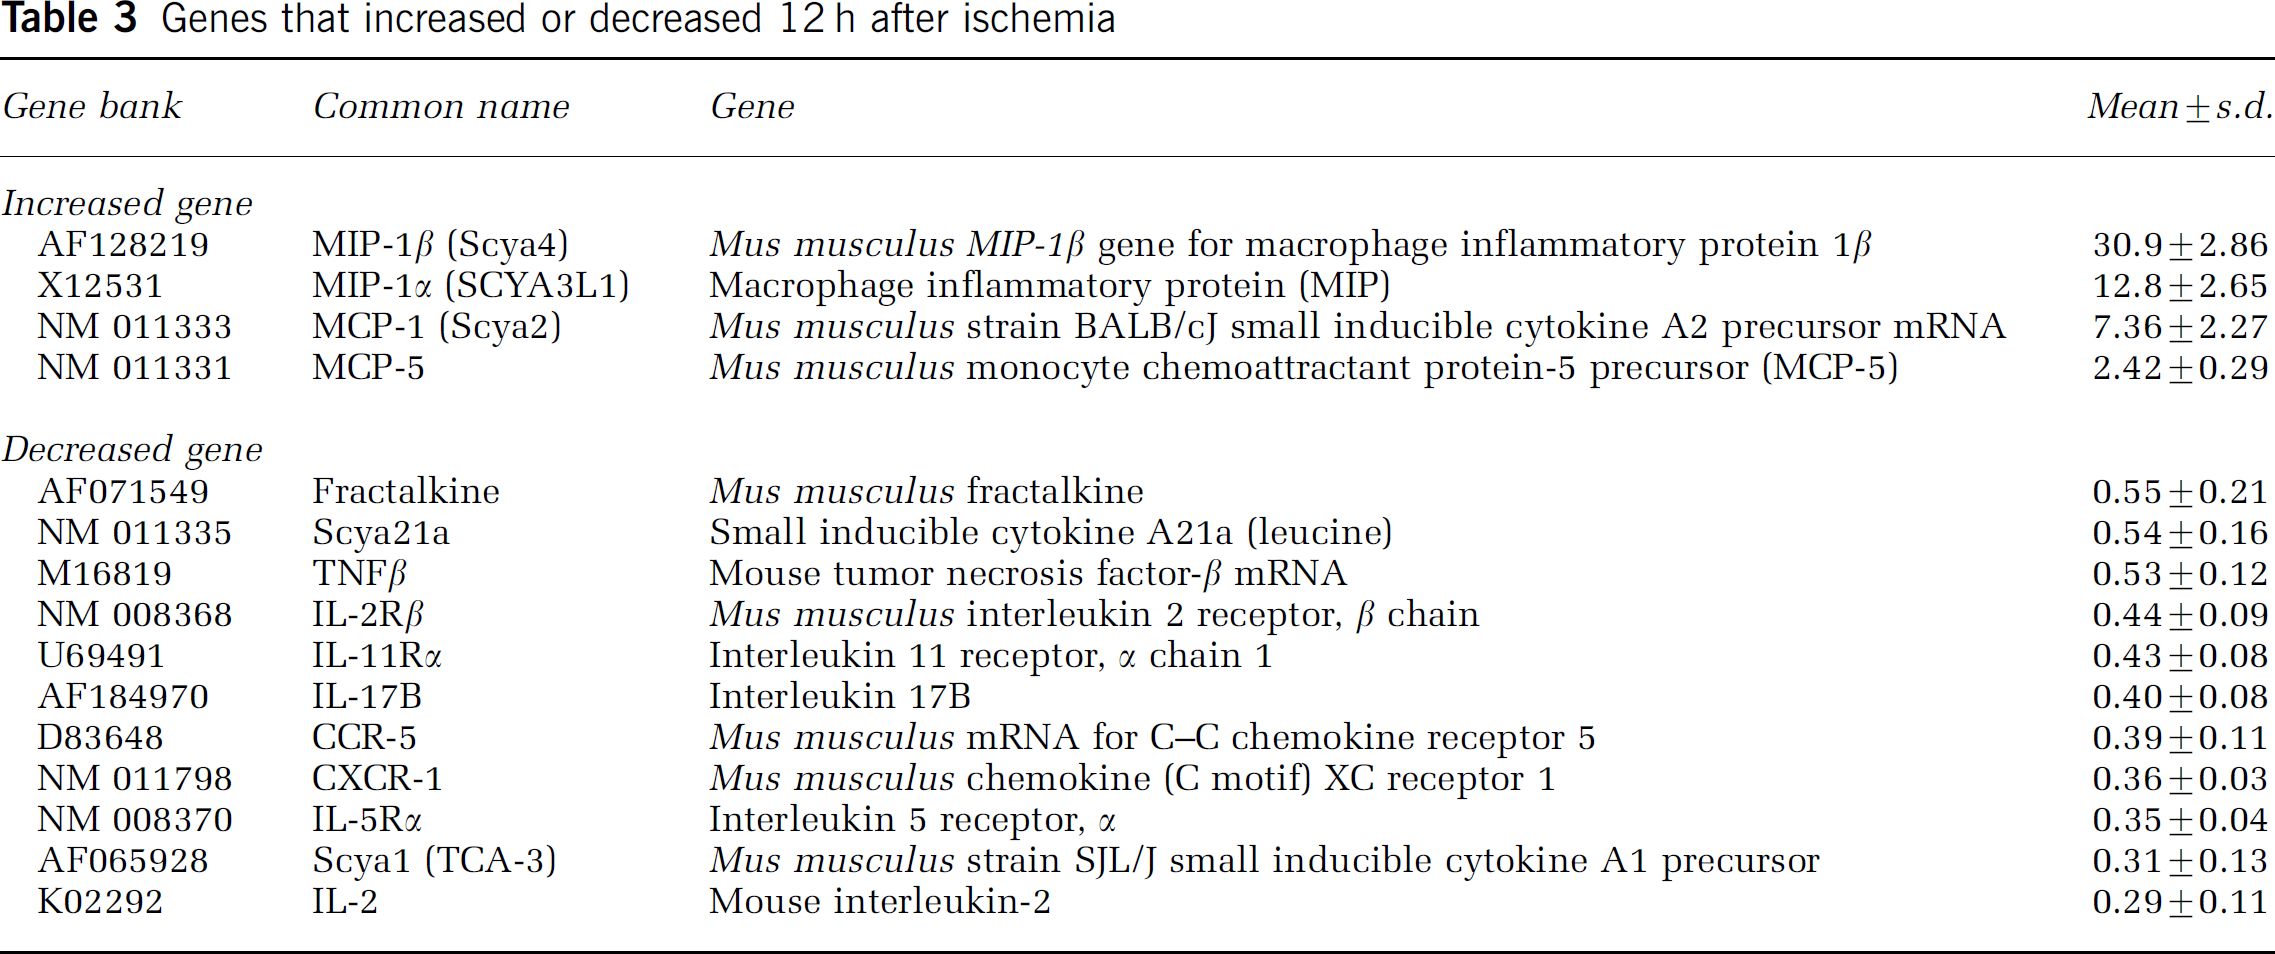
Decreased genes: Fractalkine and Scya 1 were downregulated at 6 to 72 h of reperfusion. CCR-5 was downregulated at 6 to 24 h. IL-17B and IL-5R were downregulated from 12 to 72 h. Scya 19 was downregulated from 24 to 72 h. LT-β downregulated at 6 and 72 h of reperfusion. Scya 21a, TNFβ, IL-2 rb, IL-11Ra, CXCR5, and IL-2 were downregulated at 12 and 72 h after reperfusion.
Real-time Quantitative RT-PCR
In accordance with the results of our cDNA array study, the real-time quantitative RT-PCR study confirmed the mRNA level of proinflammatory cytokines (TNFα, IL-1β, IL-6) and typical β chemokines (MCP-1, MIP-1α) (Figure 1). mRNA (normalized with GAPDH levels) for TNFα and IL-6 was upregulated at 6 h of reperfusion, peaked at 24 h, and was downregulated at 48 h of recirculation. In contrast, normalized mRNA levels for IL-1β, MCP-1, and MIP-1α were upregulated at 6 h of recirculation, peaked at 12 h, and were downregulated at 24 and 48 h of reperfusion. Compared with the WT mice, all mRNA levels were suppressed or showed a trend toward suppression in the SOD1 Tg mice at each time point. The statistically significant reductions in mRNA levels were evident at 12 and 24 h of recirculation (P<0.05) for TNFα and MCP-1, at only 12 h of recirculation for MIP-1α, and at 24 h of recirculation for IL-6.
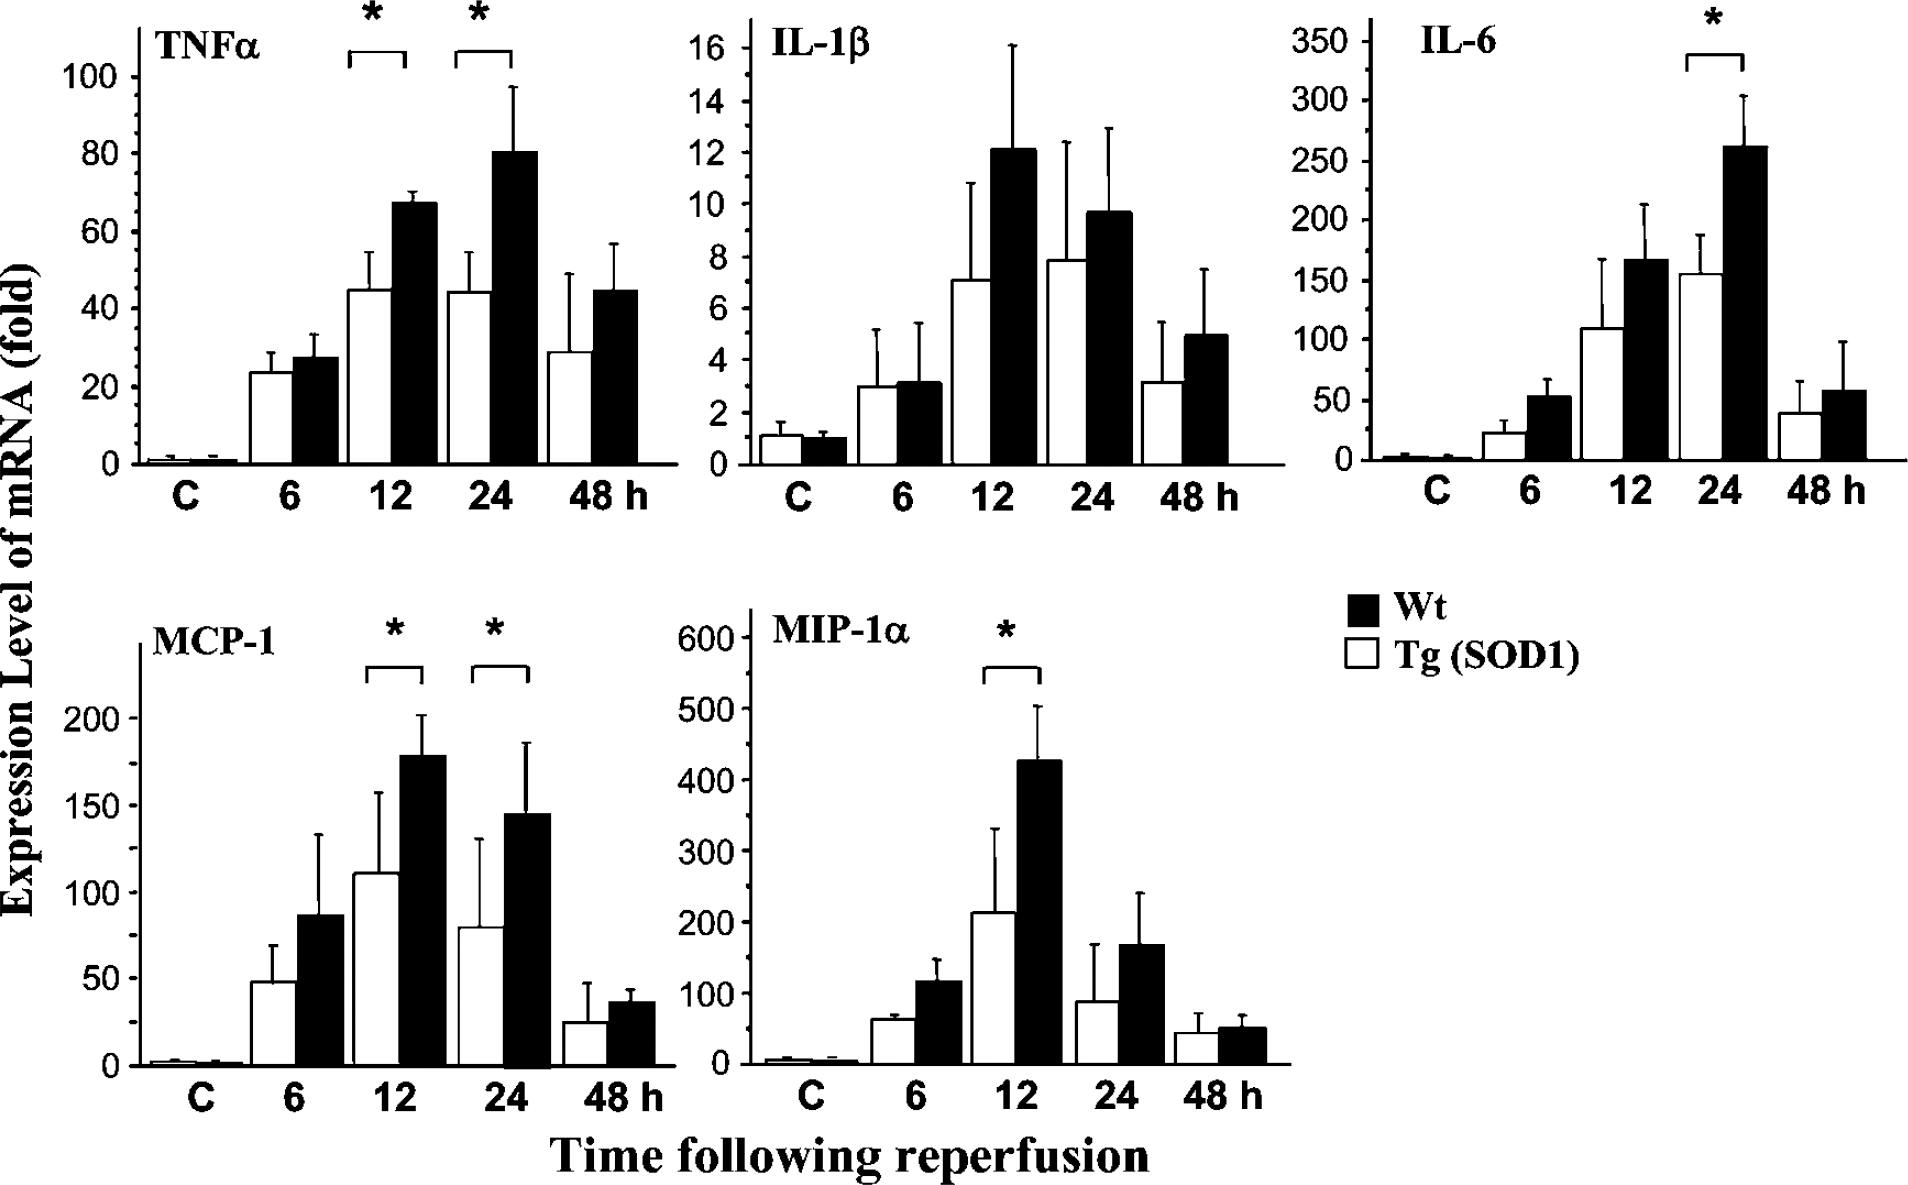
Real-time quantitative RT-PCR showing the time course of mRNA levels for proinflammatory cytokines (TNFα, IL-1β and IL-6) and β-chemokines (MCP-1 and MIP-1α). In general, the SOD1 Tg mice tended to have decreased mRNA expression compared with the WT mice. Statistically significant differences (*P<0.05) were observed at 12 and 24 h of recirculation for TNFα and MCP-1, at 12 h of recirculation for MIP-1α, and at 24 h of recirculation for IL-6. All data were standardized by GAPDH and divided by controls (sham-operated animals). The bars show the mean±s.d. C: control.
Genes that increased or decreased 24 h after ischemia
Genes that increased or decreased 72 h after ischemia
Immunostaining of Monocyte Chemoattractant Protein-1 and Macrophage Inflammatory Protein-1α in Wild-Type and Superoxide Dismutase 1 Transgenic Mice
Monocyte chemoattractant protein-1 immunoreactivity, observed throughout the cellular cytoplasm, was more intense in the striatum (ischemic core) compared with the cortex of the WT animals (Figures 2A to Figure 2C). Monocyte chemoattractant protein-1 immunopositive staining was observed at 12 to 48 h of recirculation, with peak intensity seen at 24 h (Figure 2B). Superoxide dismutase 1 Tg mice (Figures 2D to Figure 2F) showed less MCP-1 immunoreactivity even within the ischemic core. Macrophage inflammatory protein-1α immunopositivity was observed in the ischemic penumbra at 6 to 48 h of recirculation in both the WT and SOD1 Tg mice (Figure 3); however, the latter showed qualitatively less immunoreactivity (Figures 3D to Figure 3F) than their WT littermates (Figures 3A to Figure 3C).
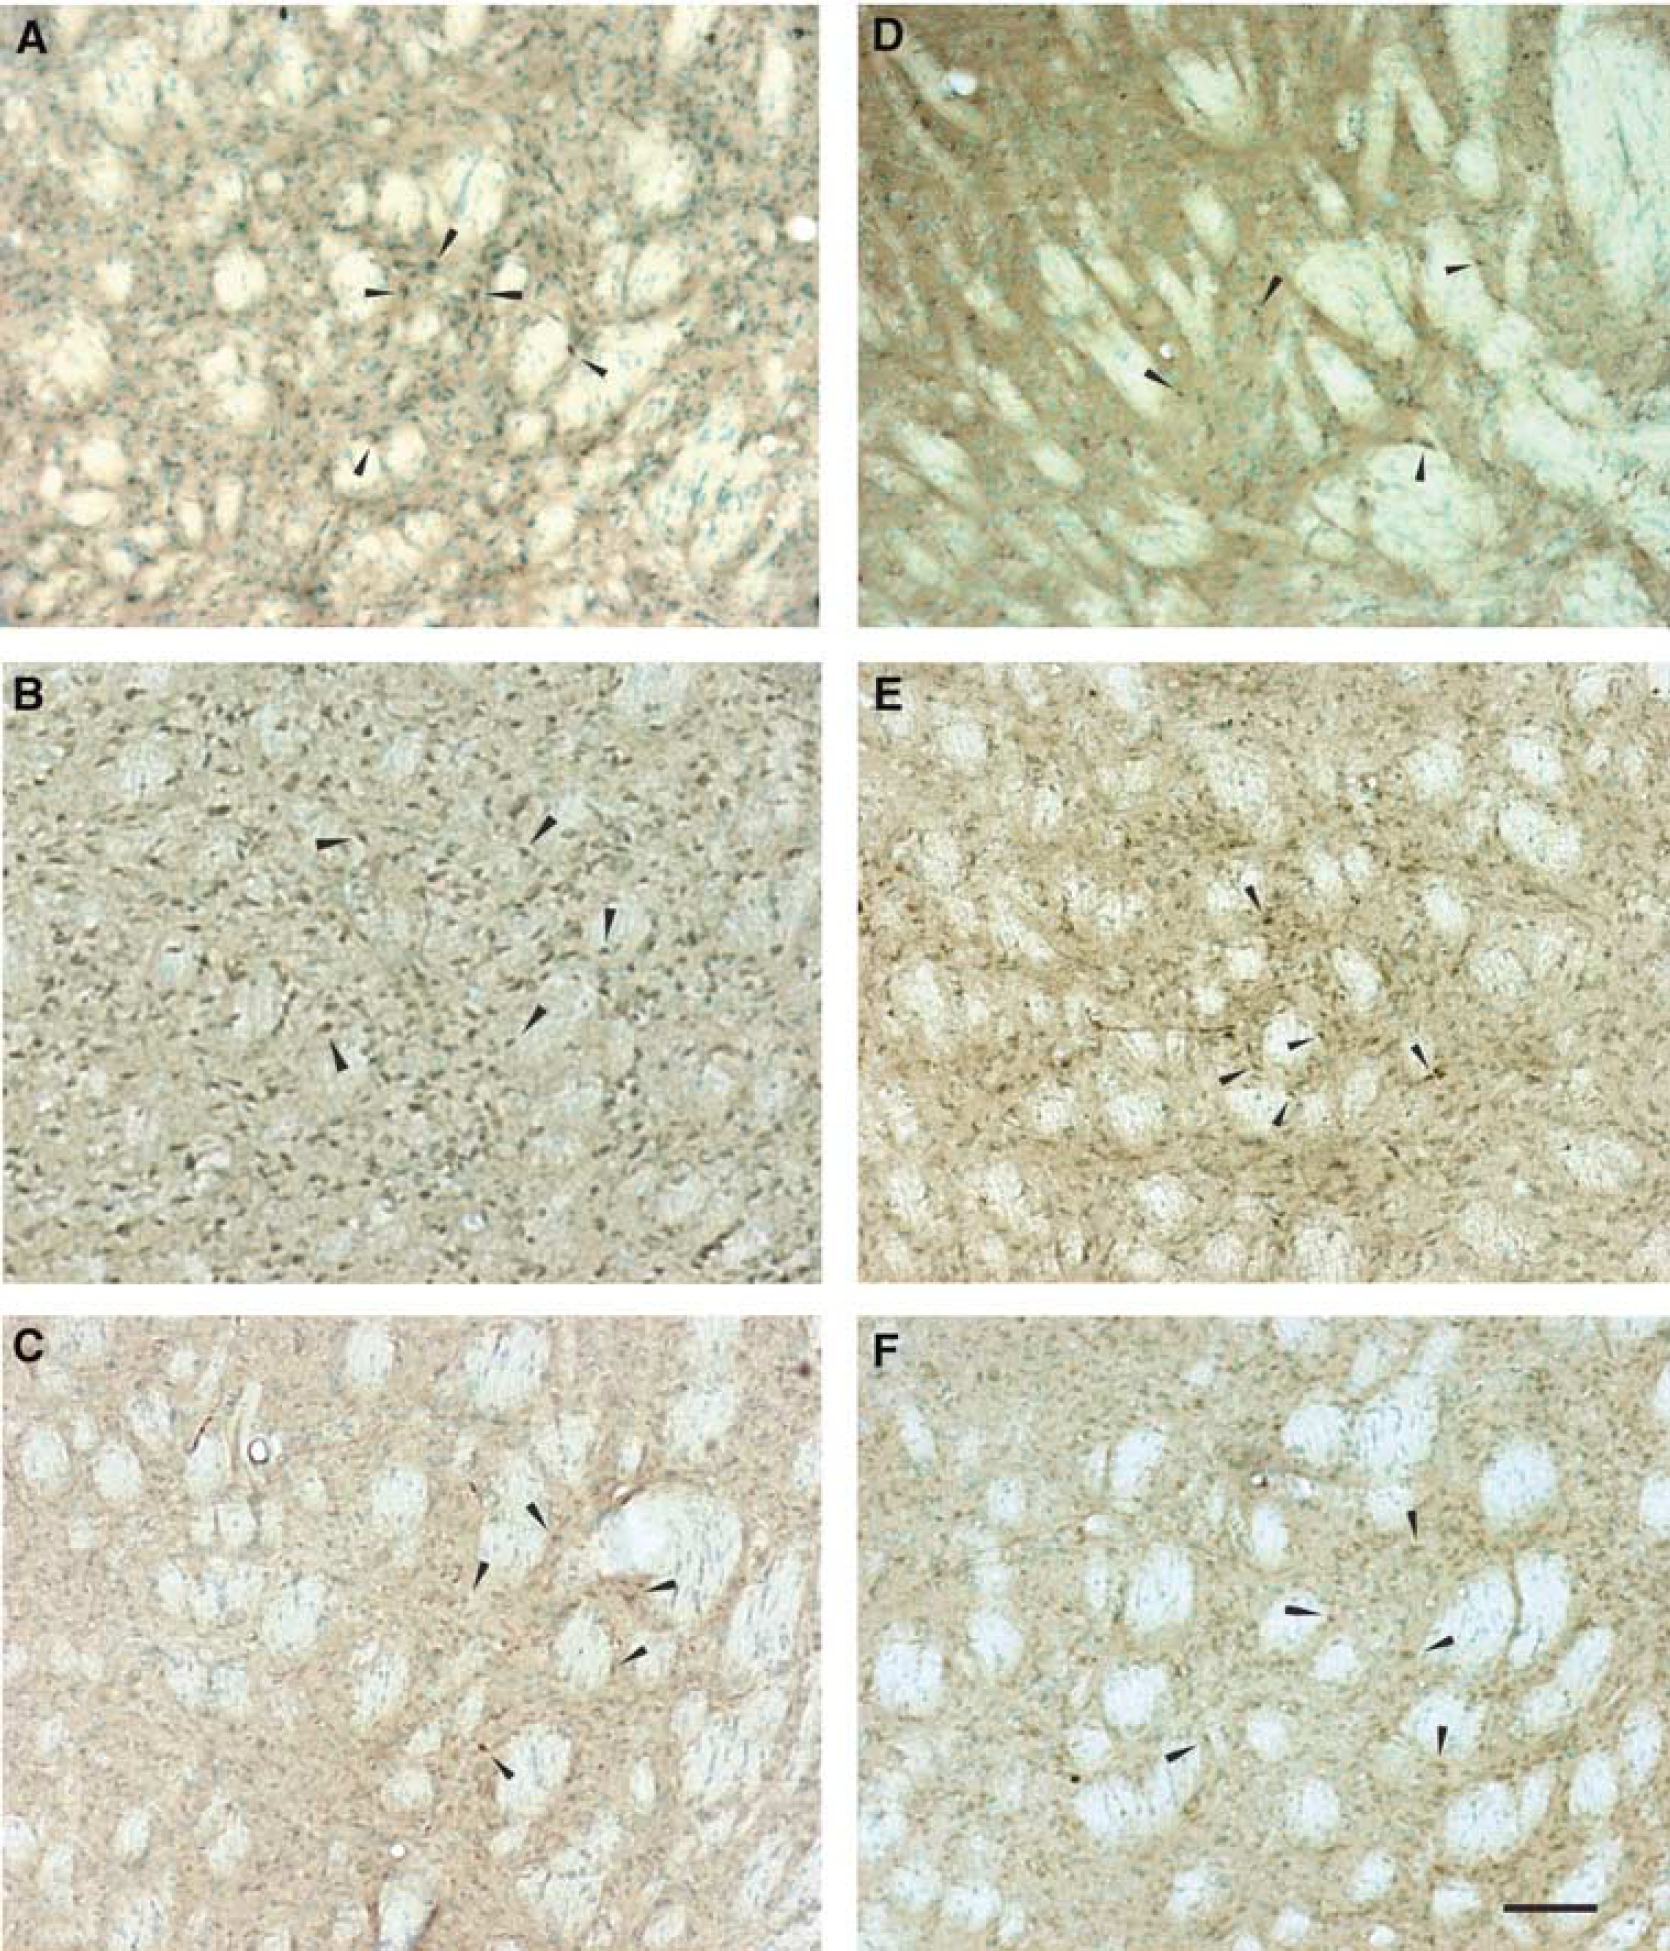
Immunohistochemistry for MCP-1 in the WT (
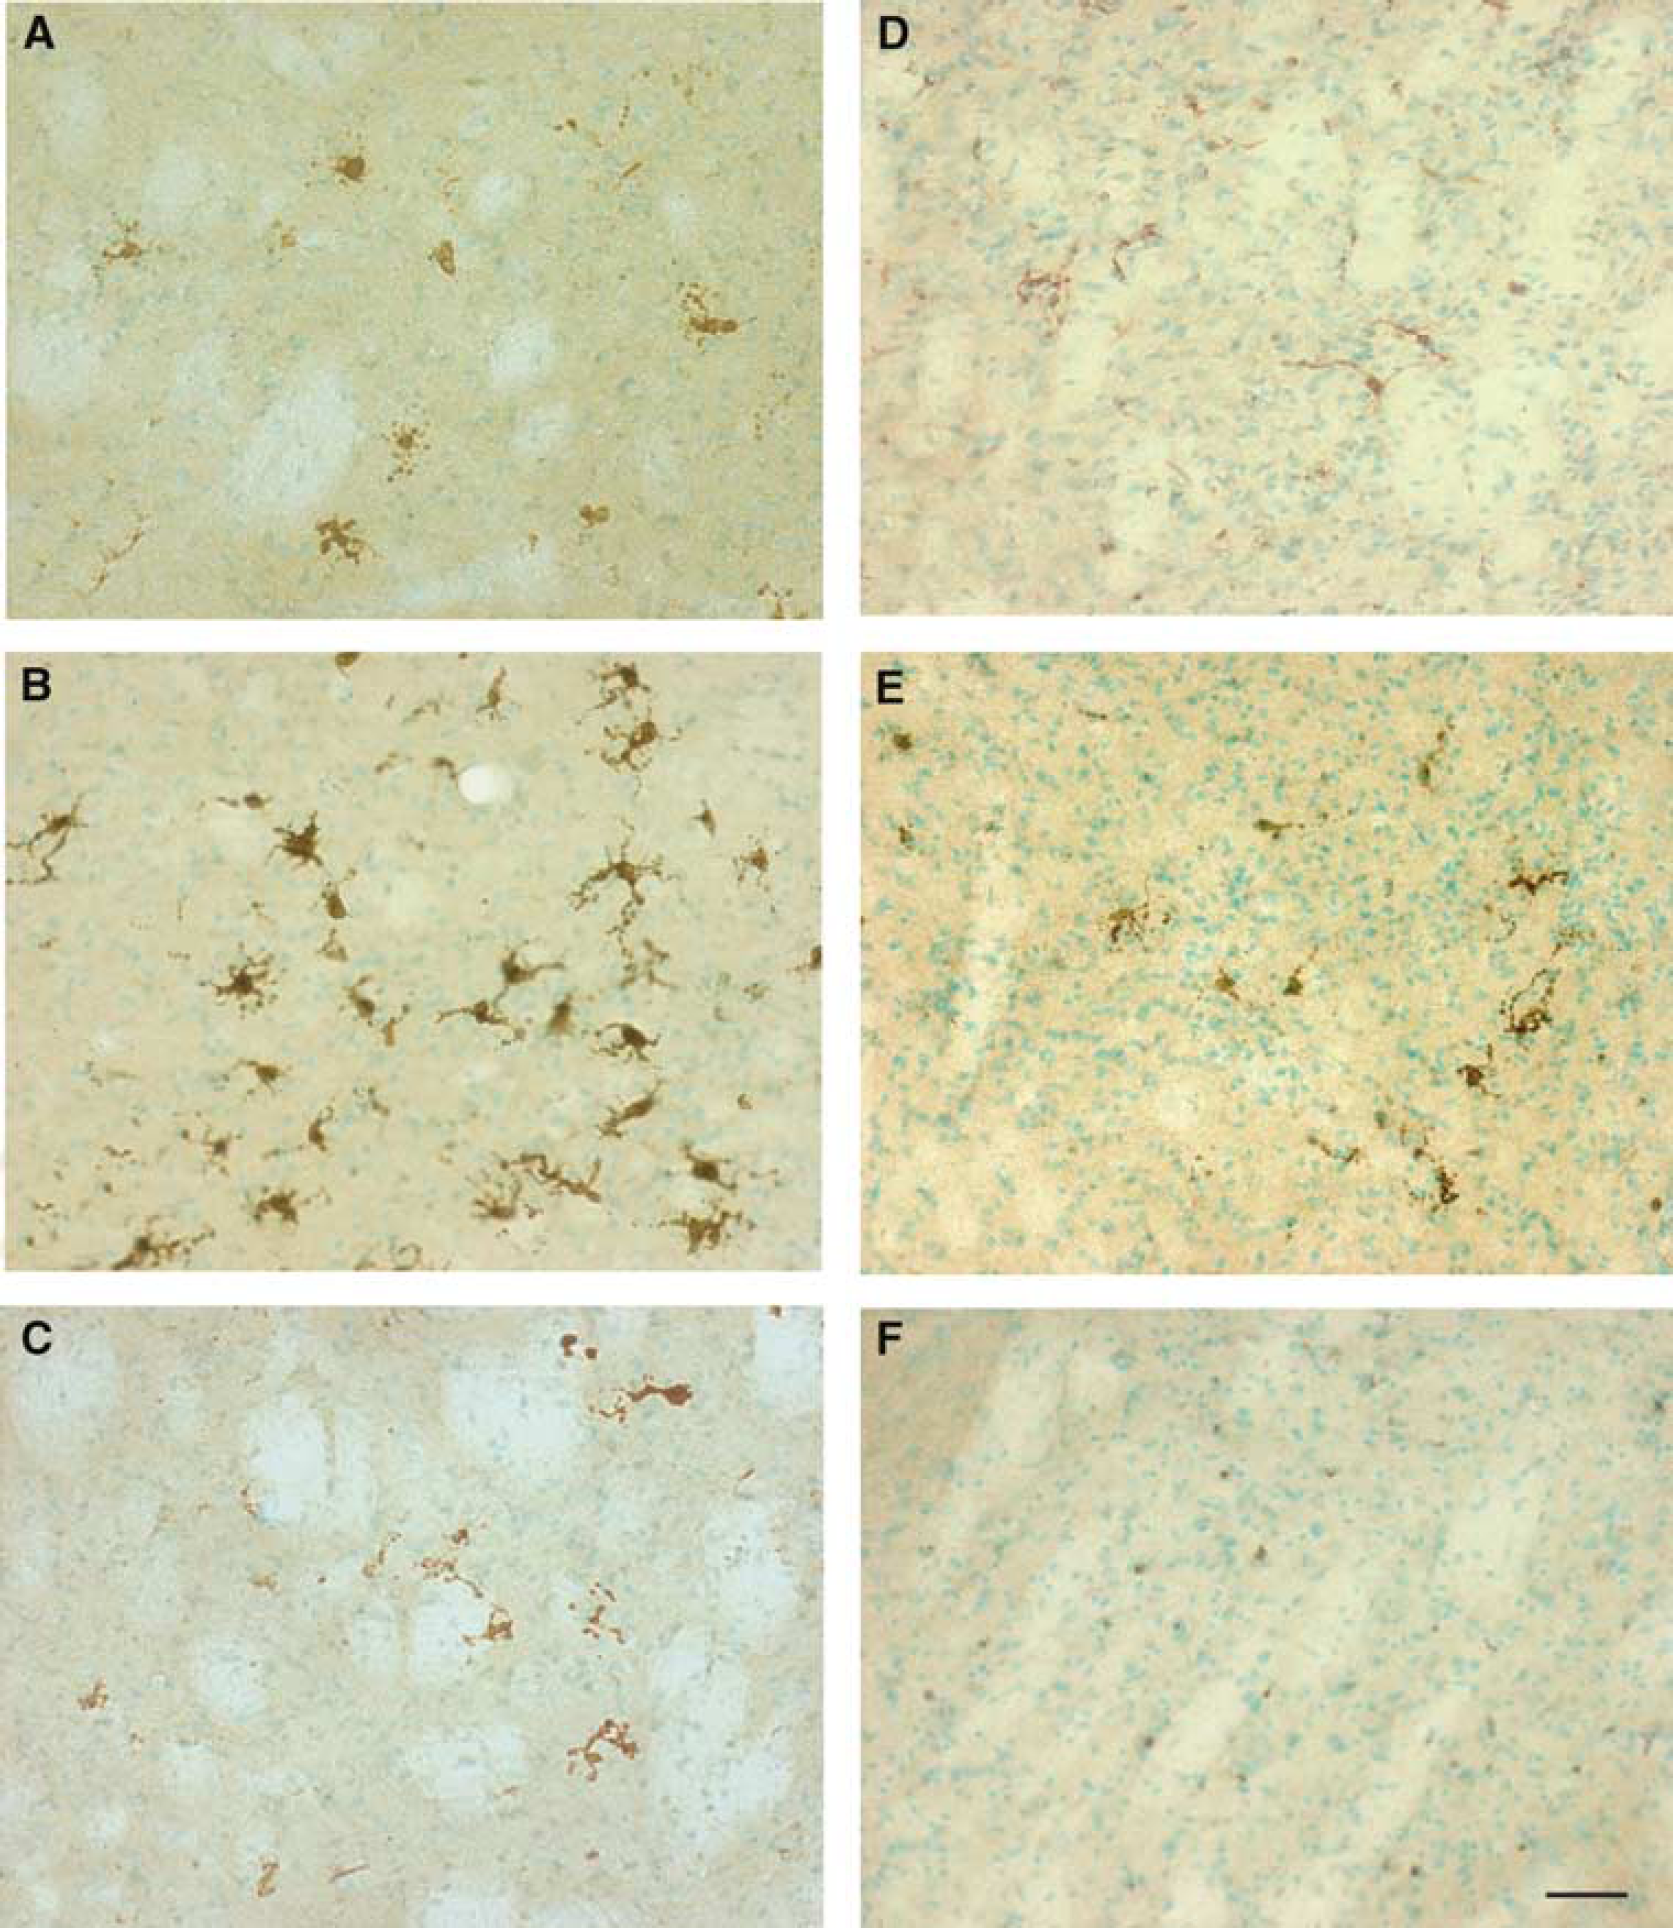
Immunohistochemistry for MIP-1α in the WT (
Localization of Monocyte Chemoattractant Protein-1 and Macrophage Inflammatory Protein-1α
We investigated the cellular localization of MCP-1 and MIP-1α with the use of double-labeled immunohistochemistry 24 h after recirculation (Figure 4). Monocyte chemoattractant protein-1 was colocalized with GFAP (Figures 4A1 to 4A3), CD11b (Figures 4B1 to Figure 4B3), NeuN (Figures 4C1 to Figure 4C3), and L. esculentum lectin (Figure 4D). Glial fibrillary acidic protein staining was observed mainly in the corpus callosum, and a few cells were stained in the striatum. Morphologically activated astrocytes produced MCP-1. CD11b stained both microglia and macrophages. Monocyte chemoattractant protein-1/CD11b-immunopositive cells were round, indicating macrophages rather than microglia. Macrophages that produced MCP-1 were seen in the striatum and the cortex. Many neuronal cells in the striatum produced MCP-1, which also appeared to colocalize with endothelial cells stained by L. esculentum lectin. Monocyte chemoattractant protein-1-producing cells were seen mainly in vessels within the cortex and in the infarct border. Macrophage inflammatory protein-1α was colocalized only in CD11b-positive cells (Figures 4E1 to Figure 4E3), which morphologically appeared to be activated microglia.
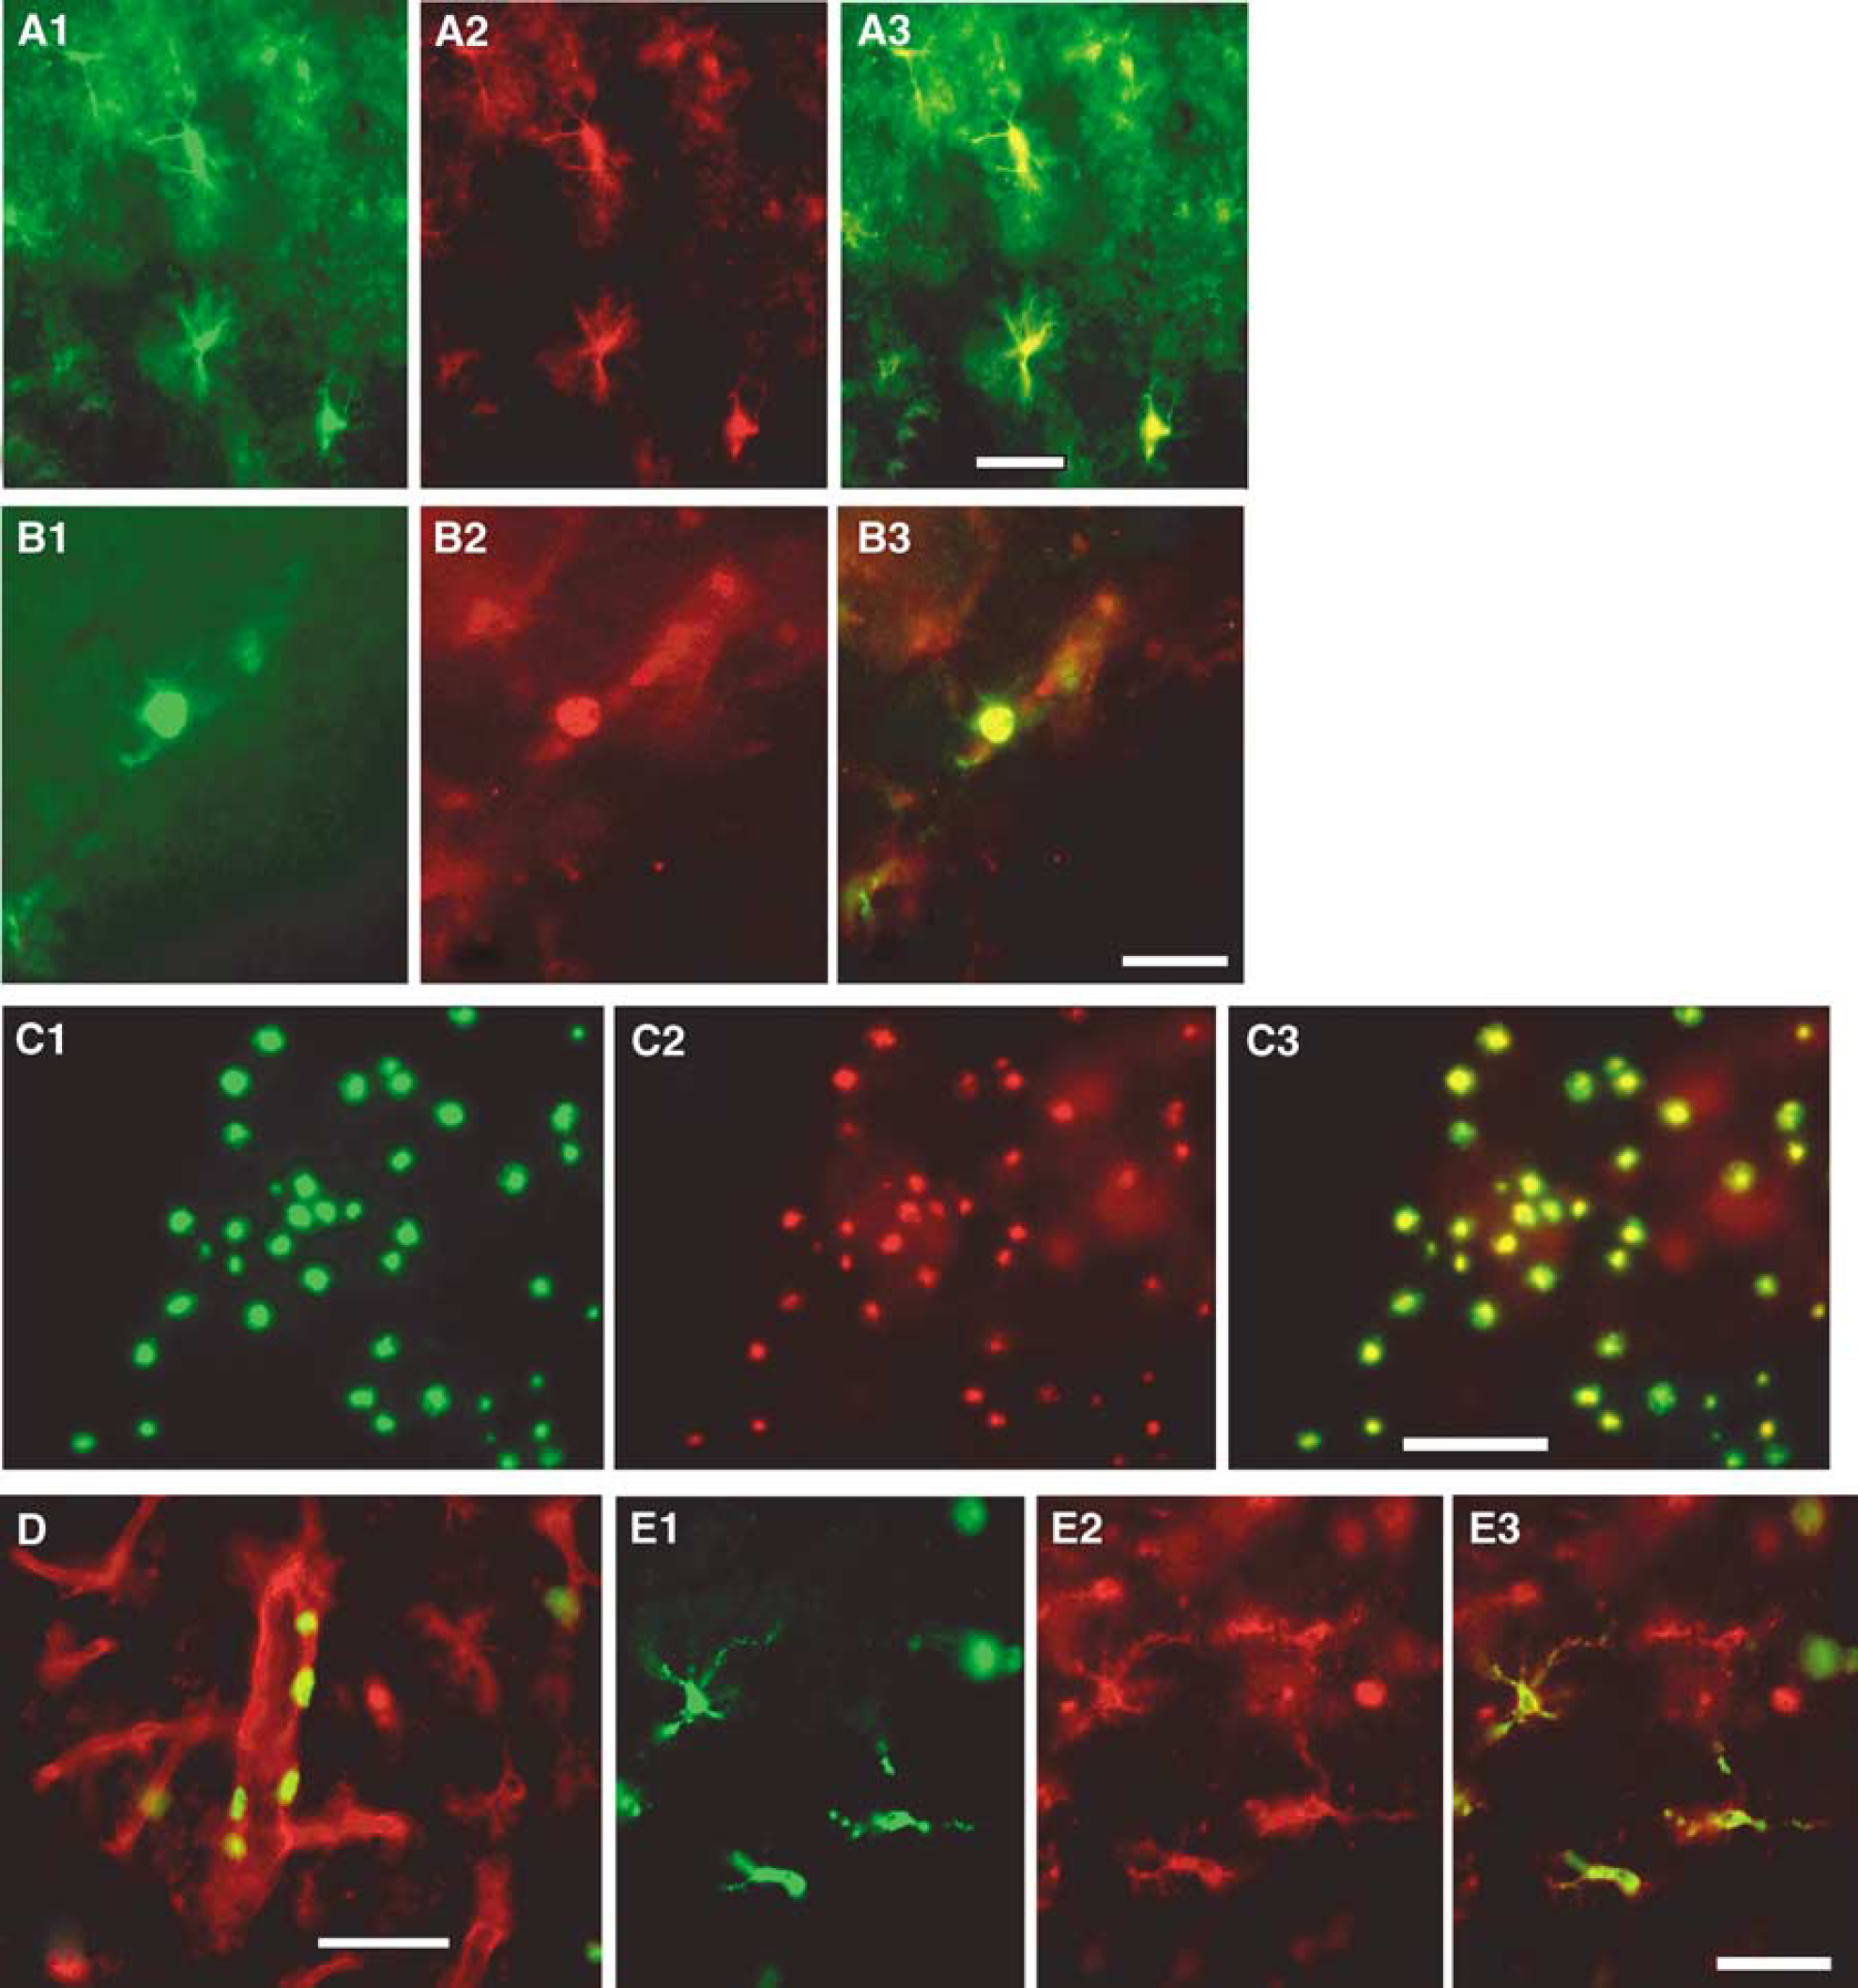
Photomicrographs of a double immunofluorescence study 24 h after reperfusion. Monocyte chemoattractant protein-1 (
Monocyte Chemoattractant Protein-1 and Macrophage Inflammatory Protein-1α ELISA
The level of MCP-1 and MIP-1α in the brains was determined using ELISA (Figure 5). In the controls, MCP-1 levels were below 250 pg/mL in both the Tg and WT animals. The temporal distribution of MCP-1 levels followed the same pattern for both the Tg and WT mice; however, the former showed significantly lower MCP-1 levels at 24 h of reperfusion compared with the WT animals (P<0.05). The level of MIP-1α in the controls was under 500 pg/mL in both the WT and Tg mice. Macrophage inflammatory protein-1α levels increased at 6 h and peaked at 24 h of recirculation in the WT mice, and were significantly higher in the WT animals at 24 and 48 h of recirculation compared with the SOD1 Tg mice (P<0.05).
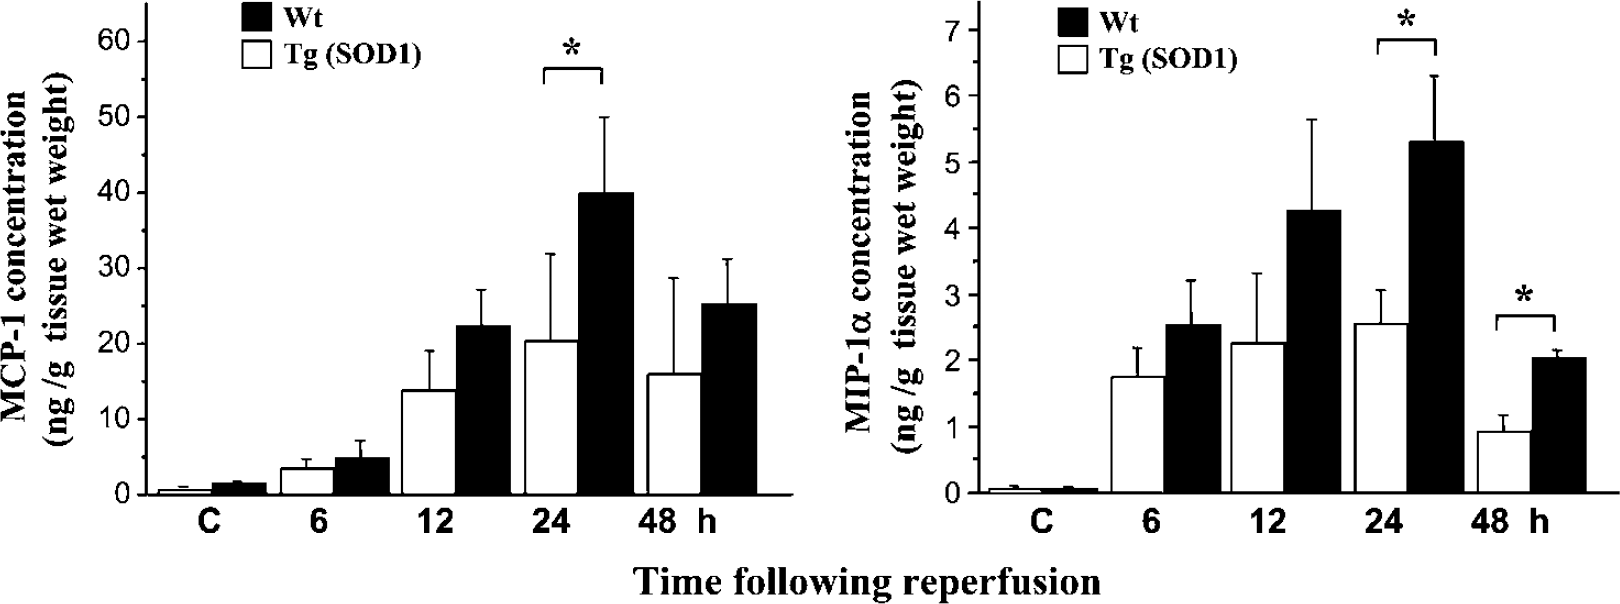
The level of MCP-1 and MIP-1α in the brains was determined using ELISA. In the controls (C), the MCP-1 levels were under 250 pg/mL and MIP-1α levels were below 500 pg/mL in both the Tg and WT mice. The temporal distribution of MCP-1 levels was similar in both the Tg and WT mice; however, the former showed significantly lower MCP-1 levels at 24 h of reperfusion compared with the WT littermates (*P<0.05). The level of MIP-1α peaked at 24 h of reperfusion, with the WT mice showing significantly higher levels at 24 and 48 h of recirculation (*P<0.05).
Discussion
Several studies have used cDNA microarray technology to investigate changes in inflammatory gene expression in cerebral ischemia (Kim et al, 2002; Raghavendra Rao et al, 2002; Schmidt-Kastner et al, 2002). In the current study, we focused on the temporal gene expression profile of 96 genes encompassing inflammatory cytokines, chemokines, and their receptors. The expression of only a few of these genes increased significantly during the postischemic period, with MIP-1α, MIP-1β, and MCP-1 showing consistent elevations 6 to 72 h postinsult. In contrast, several genes were downregulated, most noticeably at 72 h, after the ischemic challenge. This finding is consistent with the work by Kim et al (2004) in which upregulation of genes (including those involved in oxidative stress and cellular defense mechanisms) in the postischemic brain was followed by a rise in the number of downregulated genes 2 days postinsult. This downregulation of gene expression might simply be a result of cell death in the affected tissue; however, the concomitant upregulation of stress-related genes supports the notion of delayed neuronal injury. Additionally, delayed alterations in gene expression might be a result of ischemia-induced neuronal adaptations that include neuronal plasticity and repair (Stumm et al, 2002).
In our study, the surge in the number of genes whose expression was downregulated 3 days after the ischemic challenge (mostly cytokine and chemokine precursors and receptors) is intriguing, given that the inflammatory response in this transient ischemia model peaks 24 to 72 h postinsult (Kochanek and Hallenbeck, 1992) and that some of these molecules are key modulators of immune function. In contrast, this reduction in gene expression may represent the brain's attempt to contain the intense postischemic inflammatory reaction, thereby restricting secondary neuronal damage that can result from the activation and/or infiltration of inflammatory cells (Wang and Feuerstein, 2004). It is important to note that genes whose expression might have been altered only slightly, perhaps at the single-cell level, could also play very significant roles in infarct development; however, those genes were not the targets of the current study.
Up- and Downregulated Genes
Among the proinflammatory cytokines, we found upregulation of IL-1α, IL-6, IL-17, and IL-18 mRNA to varying degrees and with specific temporal profiles. IL-1α, for example, which is known to play a role in the pathogenesis of ischemic brain damage (Boutin et al, 2001) and has been shown to peak 18 h post-transient MCAO (Hill et al, 1999), could not be detected after 12 h of reperfusion in our study. Similarly, IL-6 mRNA expression (a strong predictor of early neurological deterioration after stroke (Castillo and Rodriguez, 2004) with sustained elevations observed from 3 to 24 h after permanent MCAO (Wang et al, 1995b)) showed only a very short elevation (6 h) after transient MCAO that peaked at 24 h of reperfusion onset. We also observed a fairly acute (6 h postinsult) yet short-lived increase in IL-17 and IL-18 mRNA expression. This is in direct contrast to results obtained after permanent MCAO, where IL-17 (Li et al, 2001) and IL-18 (Jander et al, 2002) expression did not peak until 6 days after the ischemic insult. This suggests that the therapeutic window for neuroprotective strategies targeting inflammatory molecules might be quite different depending on the severity of the insult as well as on the presence (or absence) of reperfusion.
Among the chemokines, we found that MIP-1α, MIP-1β, and MCP-1 showed the most significant elevations of mRNA expression, with peaks at 6, 12, and 24 h, respectively. Schmidt-Kastner et al (2002) found that these genes were all upregulated as early as 3 h after transient MCAO. The expression of cytokine and chemokine receptor genes was also upregulated as early as 6 h of reperfusion (IL-12Rβ, CCR-4, and TNFR1) or as late at 24 h (IL-10Rβ, IL-12Rβ1, and IL-17R) in our study.
Equally important to genomic upregulation is the downregulation of specific genes. As early as 6 h postinsult, we found decreased gene expression of chemokine receptors such as CCR-5 followed by decreased expression of various chemokine receptors and chemokine precursors. The number of downregulated genes increased exponentially by 72 h of reperfusion. Our results are in accord with those of Tarozzo et al (2002), who showed that fractalkine mRNA and protein were rapidly lost from the ischemic striatum starting at 12 h and up to 7 days of reperfusion. The same group found increased fractalkine immunoreactivity in morphologically intact neurons in peri-infarct areas at 24 to 48 h of reperfusion as well, an induction of fractalkine mRNA and protein on the walls of cerebral blood vessels within the infarcted area 2 to 7 days postinsult. Thus, while cDNA microarray technology allows the detection of genome-wide alterations in gene expression, it does not provide sufficient information regarding the anatomical and cellular distribution of the genes being studied.
Real-Time Quantitative RT-PCR
In addition to the question of histological correlates, we were concerned that we could not detect gene expression alterations of proinflammatory cytokines such as TNFα and IL-1β in our microarray study. This was particularly worrisome given reports that TNFα mRNA and IL-1β mRNA upregulation had been observed as early as 1 h after transient MCAO (with peaks at 3 and 6 h, respectively), and that this elevation was sustained for up to 3 days of reperfusion (Wang et al, 1994; Berti et al, 2002).
To test the specificity of our results, we used quantitative real-time RT-PCR analysis to examine the expression of selected proinflammatory cytokines and chemokines. Our real-time quantitative RT-PCR results confirmed the upregulation of IL-6, MCP-1, and MIP-1α expression observed in the microarray study; however, there were some differences in the results obtained by the two techniques. For example, the expression level of MCP-1 mRNA peaked at 24 h of recirculation while MIP-1α peaked at 6 h in the cDNA microarray study. In contrast, mRNA levels for both chemokines peaked at 12 h of recirculation in the real-time quantitative RT-PCR study. Given the inherent variability of stroke models, including differences in animal species and quantitative techniques used, it is not surprising to find disparities in gene expression profiles among various studies (Wang et al, 1995a; Schroeter et al, 2003). At the same time, however, such discrepancies highlight the importance of using techniques with higher sensitivity as a follow-up to microarray results. This was particularly apparent in our study where, using real-time quantitative RT-PCR, we found that TNFα and IL-1β mRNA levels were indeed upregulated by 6 h of reperfusion.
Oxidative Stress and Altered mRNA/Protein Expression
To examine the relationship between I/R-induced ROS production and expression of the above-mentioned cytokines and chemokines after focal stroke, we compared the mRNA expression of TNFα, IL-1β, IL-6, MCP-1, and MIP-1α between the SOD1 Tg mice and their WT littermates. We found that TNFα, IL-6, MCP-1, and MIP-1α mRNA expression was suppressed in the SOD1 Tg mice compared with their WT counterparts, and a similar trend was observed for IL-1β.
Immunohistochemical analysis showed that, at 12 h of reperfusion, MCP-1 protein expression was restricted to the striatum, yet it expanded to the cortex by 24 h. By 48 h, MCP-1 immunoreactivity had decreased in the striatum. This may reflect a decrease in MCP-1 synthesis in the ischemic core, suggesting that MCP-1 expression may correlate with cellular necrosis (Che et al, 2001). It is important to note that overexpression of MCP-1 in the brain exacerbates ischemic injury (Chen et al, 2003), while MCP-1 deficiency confers neuroprotection in a permanent MCAO model (Hughes et al, 2002). We speculate that the reduction in MCP-1 expression contributes to the protection observed in the SOD1 Tg mice. Additional studies are required to elucidate the level of MCP-1 expression in cells and the level of oxidative stress in SOD1 Tg mice after transient focal cerebral ischemia.
Macrophage inflammatory protein-1α immunopositivity was observed in the ischemic penumbra starting at 6 h of reperfusion in both the WT and SOD1 Tg animals, although immunoreactivity in the latter group appeared to be significantly less intense. This difference in protein expression between the WT and SOD1 Tg mice became very apparent at 24 to 48 h of reperfusion, which coincides with the peak of the inflammatory response in this ischemia model. Macrophage inflammatory protein-1α is a well-known chemoattractant (Wolpe et al, 1988) that can modulate macrophage function (Fahey et al, 1992), and trigger hydrogen peroxidase production in leukocytes (Wolpe et al, 1988; Appelberg, 1992). In accordance with previous reports (Kim et al, 1995; Takami et al, 1997), we found MIP-1α expressed in microglia/macrophages rather than in astrocytes. It is important to note, however, that others have found MCP-1 expression not only in microglia/macrophages (Kim et al, 1995), but also in astrocytes (Kim et al, 1995; Che et al, 2001), neurons (Che et al, 2001), and endothelial cells (Kim et al, 1995).
One of the limitations of our study is that we cannot completely correct for infarct size. Superoxide dismutase 1 Tg mice are known to have reduced ischemic injury relative to their WT counterparts (Kinouchi et al, 1991; Yang et al, 1994); however, SOD1 Tg mice are resistant to ischemic brain damage only at a much delayed time point (i.e., 24 h onward), whereas our studies examined the early changes in gene expression at 6 and 12 h, in addition to 24 and 72 h after ischemia. Thus, the difference in expression of proinflammatory cytokines/chemokines between the WT and SOD1 Tg mice might not be due to the difference in the extent of brain damage after transient ischemia at the early times, whereas at the delayed times caution must be used when interpreting the data involving brain damage.
Conclusion
Cerebral ischemia is known to induce the generation of ROS, just as the expression of cytokines and chemokines is known to be regulated by oxygen- or redox-sensitive mechanisms. The exact nature of this relationship is not clear, but our results suggest that I/R-induced ROS production may play a role in the regulation of inflammatory gene expression. It is also worth mentioning that all the proinflammatory cytokines and chemokines examined in our study are controlled, to some degree, by nuclear factor-kappa B (Hallenbeck, 2002), and that the endogenous free radical scavenger, SOD1, can downregulate nuclear factor-kappa B expression (Huang et al, 2001). Further studies are needed to establish a clear cause-and-effect relationship. Nevertheless, it is increasingly evident that cytokines, chemokines, and their receptors (as well as the signal transmission systems regulating their production) are potential targets for therapeutic intervention in stroke.
Footnotes
Acknowledgements
The authors thank Liza Reola, Bernard Calagui, and Ghezal Omar for technical assistance, Cheryl Christensen for editorial assistance, and Elizabeth Hoyte for figure preparation.