
Abstract
The substrate for the second enzymatic step in serotonin synthesis, 5-hydroxy-L-tryptophan, labeled in the β-position ([11C]-HTP), was used for positron emission tomography (PET) measurements in six healthy human participants, examined on two occasions. One- and two-tissue kinetic compartment modeling of time-radioactivity curves was performed, using arterial, metabolite-corrected [11C]-HTP values as input function. The availability of unchanged tracer in arterial blood plasma was ⩽ 80% up to 60 minutes after injection, while [11C]-hydroxyindole acetic acid and [11C]-serotonin accounted for the remaining radioactivity, amounting to ⩽16% and ⩽4%, respectively. Compartment modeling was performed for brain stem, putamen, caudate nucleus, anterior cingulate, white matter, and superior occipital, occipitotemporal, and temporal cortices. The average biologic half-life for plasma-to-tissue equilibrium was 7 to 12 minutes, and the volume of distribution was 0.2 to 0.5 μL·mL−1. In all regions except white matter, the kinetic compartment model that included irreversible [11C]-HTP trapping showed significantly improved model fits with respect to a one-tissue compartment model. The [11C]-HTP trapping rate constant depended on the estimated tissue availability of the serotonin precursor tryptophan, known to reflect serotonin synthesis in healthy individuals, and correlated with serotonin tissue concentration and synthesis rates reported previously in literature. These findings suggest the use of [11C]-HTP PET measurements to investigate serotonin synthesis.
Keywords
Over the last decades, a growing number of drugs acting on the serotonergic system have proven beneficial for the treatment of psychiatric disorders, raising questions regarding the role of serotonin (5-HT) in the pathophysiology and pharmacology of these disorders. To date, the best method for the study of such issues in humans is positron emission tomography (PET), because of its high sensitivity and flexibility. Several tracers have been developed that enable the study of serotonin reuptake sites and various receptor subtypes (Crouzel et al., 1992; Gunn et al., 1998; Helfenbein et al., 1999; Ito et al., 1998), relatively less effort has been devoted to the development of tracers for probing presynaptic 5-HT synthesis.
Because serotonin cannot cross the blood–brain barrier (BBB), it is synthesized in the neurons from the amino acid precursor tryptophan (Trp), the synthesizing enzymes tryptophan hydroxylase (Trp-OH) and amino acid decarboxylase (AADC) primarily being located in nerve terminals (Feldman et al., 1997; Meek and Neff, 1972). Although Trp taken from circulation is preferentially channeled into 5-HT synthesis (Denizeau and Sourkes, 1977), Trp is also used in protein synthesis and some of it may also be metabolized via the kynurenine pathway. Ideally, tracer candidates should be different from endogenous Trp but otherwise follow the 5-HT synthesizing pathway. Such a candidate tracer is [11C]-α-methyl-tryptophan, [11C]-AMT, which is an analog of Trp but, in contrast to the endogenous tracer, it is not used for protein synthesis and is not catabolized by monoamine oxidase (MAO; Diksic and Young, 2001).
Although [11C]-AMT represents an interesting tool for assessing serotonin synthesis, it is associated with some limitations, particularly with regard to tracer kinetics and alternative synthesis pathways. The biologic half-life of [11C]-AMT is relatively long (Muzik et al., 1997), and hence plasma-to-tissue equilibrium may not be achieved until 60 to 80 minutes after injection. At this time point, only 6% to 12% of the original [11C]-radioactivity remains, and a limited signal-to-noise ratio may hamper the measurement. Several studies also demonstrate a pronounced delay between uptake and 5-HT conversion of [11C]-AMT, in some cases amounting to hours (Gharib et al., 1999; Shoaf et al., 2000). In view of these results, it has been claimed that [11C]-AMT kinetics are driven predominantly by BBB exchange (Shoaf and Carson, 2000). At present there is no consensus on how to evaluate [11C]-AMT measurements. While Chugani and Muzik (2000) note the presence of a large unmetabolized tracer pool and thus suggest that the rate of irreversible tracer trapping is used for assessing the serotonin synthesis capacity, Diksic and Young (2001) assert that quantitation of the brain 5-HT synthesis rate does not require the metabolic conversion of the tracer to [11C]-α-methyl-serotonin, and hence advocate serotonin synthesis quantification by taking into account the protein-free plasma concentration of Trp. Regardless of the evaluation method used, [11C]-AMT is occasionally converted to kynurenine and, because this process cannot be singled out from serotonin synthesis, the measurements may reflect both pathways (Chugani and Muzik, 2000). Although kynurenine conversion is less pronounced in healthy tissue, it may affect the [11C]-AMT results in the case of elevated cortisol levels (Curzon and Green, 1971; Young, 1981), deficiency of the AADC cofactor vitamin B6 (Guilarte and Wagner, 1987), and inflammatory processes (Saito et al., 1993).
The choice of [11C]-AMT as a tracer for serotonin synthesis is linked with the notion that the rate-limiting step is the conversion of Trp to 5-hydroxytryptophan (5-HTP), as indicated by the Michaelis-Menten constant of Trp-OH, being 10-fold lower than that of the next enzyme, AADC (Cooper et al., 1978). On the other hand, neither of the enzymes is saturated, because both constants are on the order of or above the brain tissue Trp concentration, and it is generally accepted that the availability of the precursor, not devoted to other metabolic pathways, plays an important role for the regulation of serotonin synthesis (Fernstrom and Wurtman, 1971). Consequently, the measurement of any of the two enzymatic steps may be indicative of serotonin synthesis, and the assessment of the 5-HTP to 5-HT conversion rate constant in serotonergic cells may be sufficient, albeit less sensitive, to investigate synthesis. To be more explicit, if more Trp is converted to 5-HTP by Trp-OH, the 5-HTP to 5-HT conversion should also increase, as the latter process is more efficient. Moreover, since endogenous 5-HTP-levels in the brain are usually very low, the rate of decarboxylation to serotonin is most probably equal to its rate of formation, and probing the second enzymatic step may thus yield a measure that is proportional to 5-HT synthesis. Such reasoning lies behind the use of [11C]-5-hydroxy-L-tryptophan ([11C]-HTP, Bjurling et al., 1989) PET. Using this tracer, it has been shown that the accumulation rate decreases following coinjection with pharmacological doses of unlabeled 5-HTP (Hartvig et al., 1993) and increases after coadministration of vitamin B6 (Hartvig et al., 1995), indicating that the tracer is sensitive to pharmacological challenge. In clinical studies, [11C]-HTP has been used to study patients with major depression (Ågren et al., 1993, 1994) and social phobia (Marteinsdottir et al., 2001).
Apart from the labeling, [11C]-HTP is chemically identical to the endogenous compound and hence will undergo both conversion to 5-HT by the AADC enzyme and catabolism by MAO to hydroxyindole acetic acid (5-HIAA). A concern of [11C]-HTP PET relates to the ubiquitous distribution of the decarboxylating enzyme, which is expressed in all the monoaminergic cells (serotonergic, noradrenergic, and dopaminergic); hence, the use of [11C]-HTP may reflect 5-HT synthesis in all of these neuronal cell types. The 5-HT catabolite 5-HIAA is cleared from the brain, and this conversion may alter [11C]-HTP PET measurements. Previous studies suggest that, although 5-HIAA is formed, the majority of labeled compounds will be trapped in the tissue, and presumably only a limited tracer loss occurs during a standard 60-minute PET scan (Lindner et al., 1997). Specifically, with its generally high metabolic capacity, the half-life of 5-HIAA in rats is 40 minutes after an intraventricular administration (Burns et al., 1976). After pretreatment with MAO-blockers, which prevent 5-HIAA formation, only a restricted increase in [11C]-HTP accumulation occurs (Hartvig et al., 1992; Lindner et al., 1997).
Consequently, many aspects need to be addressed before the use of [11C]-HTP is fully accepted. The aim of the present study was to determine to what extent [11C]-HTP PET data can be modeled by one- or two-tissue kinetic compartment models, and to determine the reliability of the results. We also evaluated the relation between the rate constants and alternative, potentially more robust parameters that can be used for voxelwise analysis, such as the Patlak slope (Patlak and Blasberg, 1985), the net accumulation rate constant and the standard uptake value. A secondary aim was to investigate the existence of a biologic link between measured [11C]-HTP rate constants and serotonin synthesis. With this in mind, and considering that the serotonin synthesis rate will depend on the tissue availability of Trp, in turn dependent on precursor transport across the BBB, we analyzed the relation between the calculated rate constants and plasma Trp concentrations. Moreover, data derived from the literature on serotonin synthesis, such as serotonin tissue concentration, and AADC and Trp-OH activity were evaluated and compared with parameters obtained from kinetic modeling.
MATERIALS AND METHODS
Participants
Three female and three male white healthy volunteers (mean ± SD age, 24 ± 2 years; range 22–27 years) participated in the experiment after giving written informed consent. The local ethics and radioisotope committees of the Uppsala University Hospital approved the study. Each participant had two PET scans and one MRI examination.
Positron emission tomography
Magnetic resonance imaging
A Philips Gyroscan MR system (Philips Medical system, The Netherlands) operating at 1.5 T was employed for acquiring anatomic MR images. A birdcage volume head coil was used for radio frequency transmission and reception. The nasion was aligned with a laser cross-hair projection, so that each participant's head would be approximately centered in the standing magnetic field of the MR system once within the MR bore. Head movement was minimized by mild restraint and cushioning. A three-dimensional T1-weighted scout image was acquired before positioning the anatomic MR images. A proton density-weighted image was then acquired using an inversion-recovery sequence with 128 phase-encoding steps (repetition time, 2,200 milliseconds; echo time, 16 milliseconds; inversion time, 300 milliseconds; in-plane resolution, 2 mm; slice thickness, 4 mm; interslice gap, 0.5 mm) for a total of 30 transverse slices.
Image postprocessing
Each PET time frame was corrected for motion during the scan (Andersson, 1995) and the time frames of the second measurement were reoriented to match the first scan. An average image of the two summation images obtained at the two measurement occasions was also generated. The MR image was coregistered to the PET average image by application of a mutual information algorithm (Andersson, 1998). The following regions of interest (ROI) were outlined on the MR images: caudal brain stem (two slices, 6–8 cm3), rostral brain stem (including the dorsal and medial raphe nuclei, two slices, 6–8 cm3), cerebellum (two slices, 23–27 cm3), putamen (two slices, 5–6 cm3), caudate nucleus (two slices, 1.5–2.5 cm3), thalamus (two slices, 2–3 cm3), an area covering parts of the superior, medial and inferior temporal gyri (located within Brodmann area [BA] 21, 22, and 37; three slices, 17–22 cm3), superior frontal gyrus (within BA 10; three slices, 10–13 cm3), anterior cingulate (within BA 24 and 32; three slices, 8–10 cm3), medial occipitotemporal gyrus (within BA 18; three slices, 10–12 cm3), superior occipital gyrus (within BA 18; three slices, 11–16 cm3), and white matter (semiovale; two or three slices, 19–25 cm3). After transfer of each ROI to the single time frames of the PET images, the corresponding radioactivity values were automatically extracted and transferred to ASCII files before subsequent compartment modeling.
Compartment modeling
For each participant and scan, information regarding noise equivalent counts, plasma and whole blood radioactivity, plasma metabolite content, and radioactivity in the ROIs (for each time frame) was used for compartment modeling with software implemented in MATLAB 5.3 (The MathWorks Inc., Natick, MA, U.S.A.). Previous to fitting, the blood and plasma curves were corrected for delay, dispersion, and metabolite content. Nonlinear least-square fitting to one- and two-tissue compartment models were performed with a Levenberg Marquardt algorithm, using partial derivatives to improve speed and the inverse of the square root of the noise-equivalent counts as weights (Strother et al., 1990).
The plasma curve, C, was furthermore corrected for the presence of [11C]-labeled metabolites.

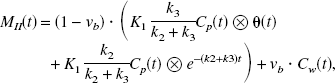
In terms of 5-HT synthesis, k3 can be defined as the conversion rate constant from 5-HTP to 5-HT by the decarboxylating enzyme.

RESULTS
Positron emission tomography
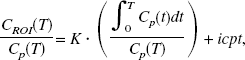
Example [11C]-HTP PET images representing the attenuation and scatter-corrected average tracer distribution in a single participant 30 to 60 minutes after injection are shown in Fig. 1. In these images, the average radioactivity concentration in putamen was twofold higher than in cortical regions.
Example positron emission tomography (PET) and coregistered magnetic resonance images (MRI). Above: [11C]-HTP summation image that represents the radioactivity distribution, corrected for attenuation and scattering, 30 to 60 minutes after tracer injection. Radioactivity concentrations in basal ganglia were about two times higher than those found in cortical areas. Below: proton-density-weighted MRI, coregistered to the PET scan.
Availability of unchanged [11C]-HTP in plasma
During PET-scanning, tracer metabolite analysis was performed. The amount of [11C]-HTP detected in plasma was 97% ± 1% at 5 minutes, 89% ± 2% at 20 minutes, 85% ± 3% at 40 minutes, and 80% ± 5% at 60 minutes, indicating a small interindividual variation and a high availability of unchanged tracer at all time points. The other metabolites identified were [11C]-HIAA and [11C]-HT. The fraction of [11C]-labeled HIAA (HT) at the various time points was 3% ± 1% (the fraction of HT was below detection limit at this time point) at 5 minutes, 10% ± 2% (HT, 1% ± 1%) at 20 minutes, 12% ± 2% (3% ± 2%) at 40 minutes, and 16% ± 3% (4% ± 3%) at 60 minutes.
Compartment modeling
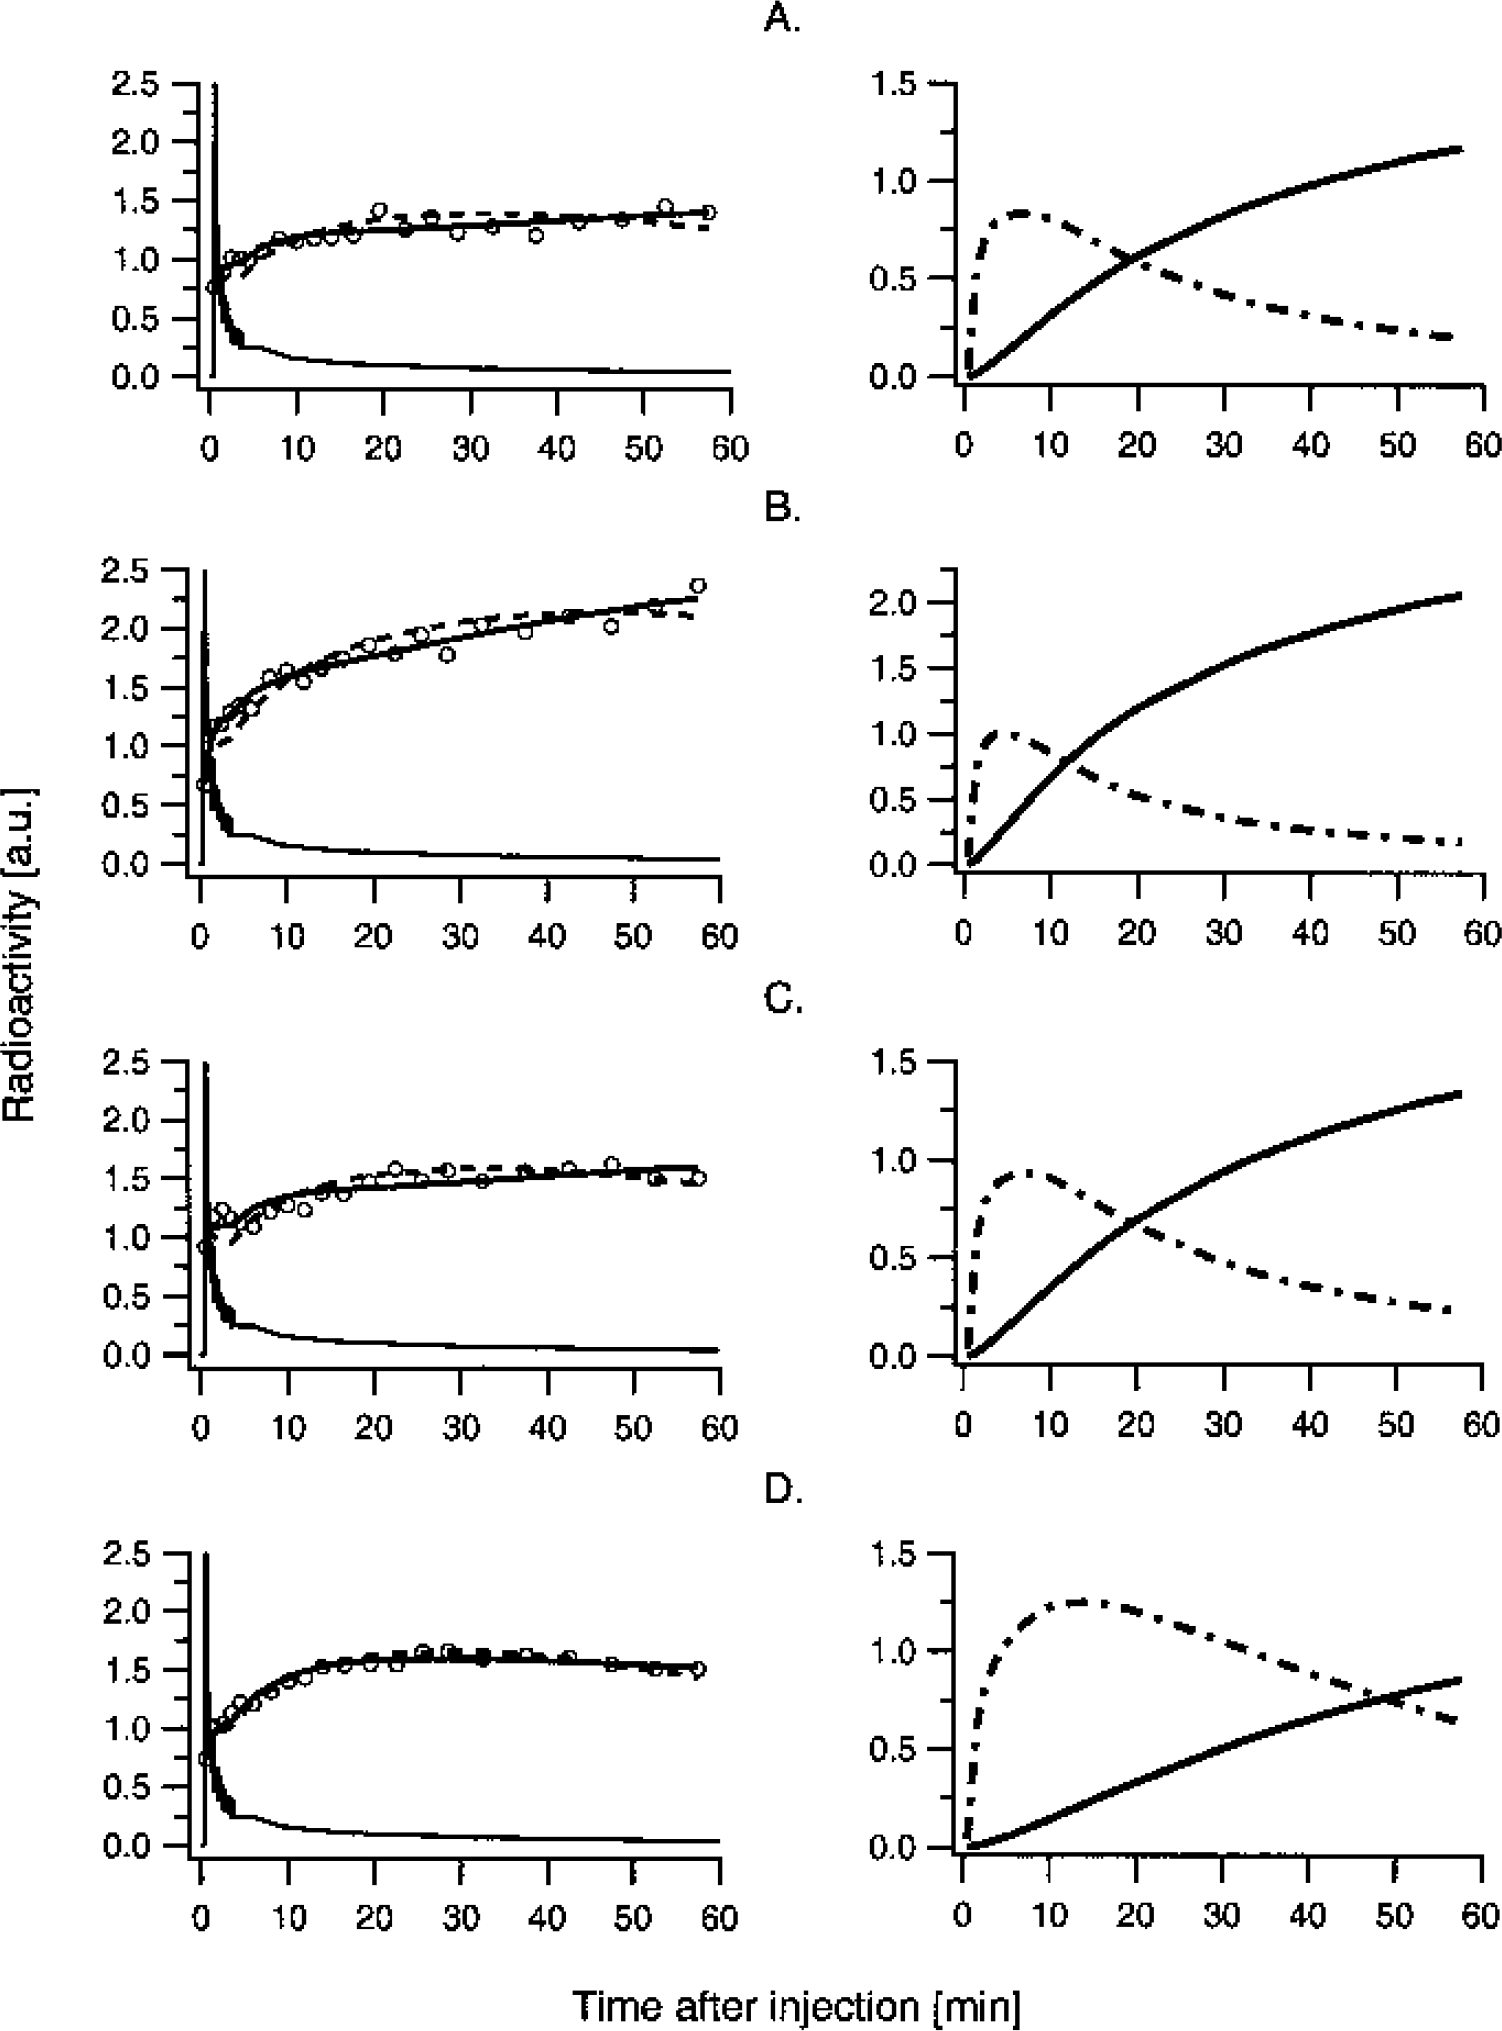
Examples of [11C]-HTP time-radioactivity curves (left column) and amount of free and bound [11C]-HTP in tissue (right column) in the
The average fractional blood volume determined by the model fits was somewhat lower than expected (around 2% to 3% instead of the expected 4% to 5%). This effect depended on the coarse sampling at the initial time points that impeded an accurate assessment of the blood peak. Moreover, the average fractional blood volume showed a high variation. In particular, for one participant the vb across brain regions showed a higher interregional variation and a higher overall mean (0.075 ± 0.024) than the remaining five participants (0.021 ± 0.008). Thus, we decided to replace this subject's vb with the regionally specific average values obtained for the whole group. This resulted in a nonsignificant increase (P > 0.15) of the fitted parameters, being at most about 5% across brain regions for the one-tissue compartment fit (K1, 2 ± 1%; k2, 5 ± 1%) and 17% for the two-tissue compartment fit (K1, 4 ± 2%; k2, 12 ± 6%; k3, 17 ± 5%).
Compared to the one-tissue compartment model fits, the introduction of irreversible tracer trapping lead to a significant improvement in AIC and F values (Table 1). In particular, when going from the one-tissue to the two-tissue compartment model, the AIC decreased in a significant number of the total number of model fits (137 out of 144, P < 0.005, binomial test). Moreover, scrutiny of the region-specific average change in AIC indicated that this value was significant (P < 0.005, corrected for the 12 comparisons performed, one for each brain region; P < 0.0004, uncorrected for multiple comparisons) for all investigated brain regions except the white matter. The greatest reduction in AIC was observed in the superior frontal gyrus, superior occipital gyrus, and cerebellum (6%) followed by the anterior cingulate, caudal brain stem, putamen, medial occipitotemporal and temporal gyri, and the rostral brain stem (5%). In the thalamus and the caudate, the AIC reduction was small but significant (4% and 3.3%, respectively), while in the white matter, where supposedly no serotonin synthesis occurs, the average AIC reduction was nonsignificant.
Compartment modeling of regional [11C]-HTP time-acivity curves
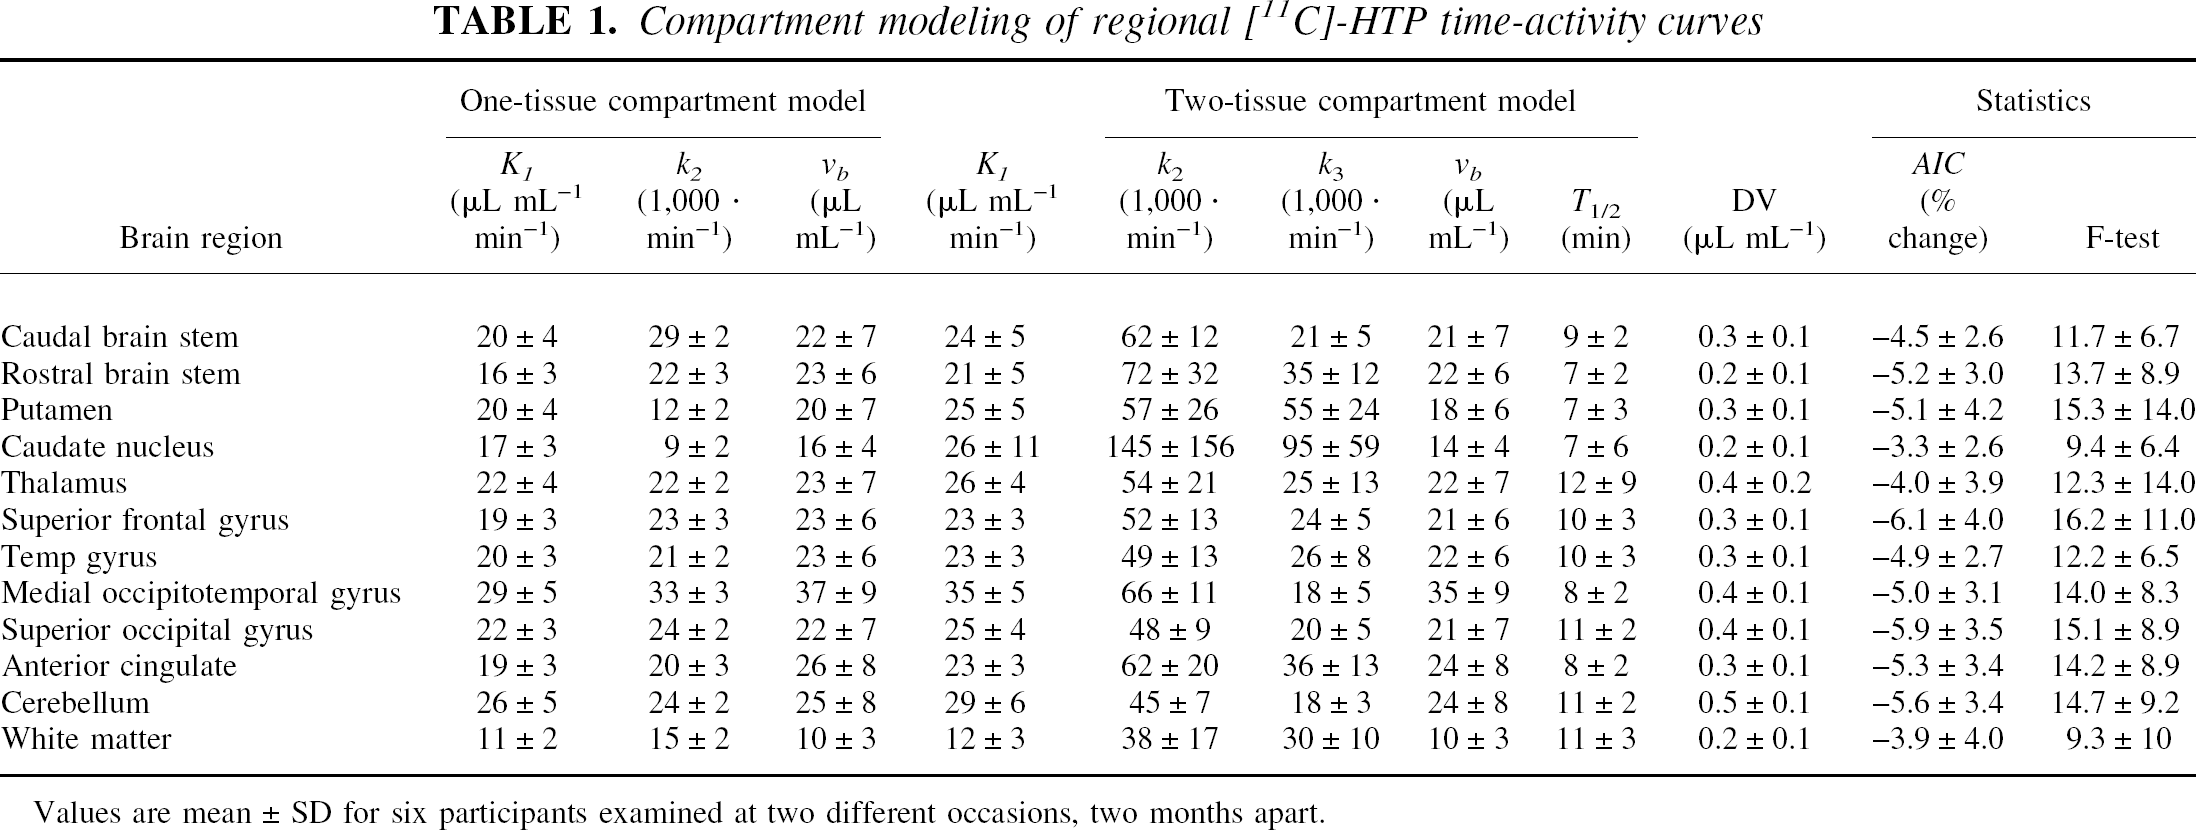
Values are mean ± SD for six participants examined at two different occasions, two months apart.
The F value was above its critical limit (F0.05(1,18) = 4.4) in 117 out of the 144 model-fits and in 126 out of 132 model fits, when the participant with a fixed vb value was excluded. For the latter group of fits, lack of significance occurred in the caudate nucleus (two model fits) and thalamus (two fits), probably due to the low signal-to-noise level in these small structures, and in the white matter (two fits), probably due to absence of serotonin synthesis associated with this region.
Test-retest data (Table 2) indicated no significant difference between the rate constants determined at the two measurement occasions. Moreover, the standard deviation for the model fits obtained at each single occasion was not substantially different from the data that were collapsed across the 12 measurements, indicating that the largest error source is the modeling itself and not biological, interindividual, or intraindividual differences.
Two-compartment modeling of regional [11C]-HTP time-activity curves at two measurement occasions
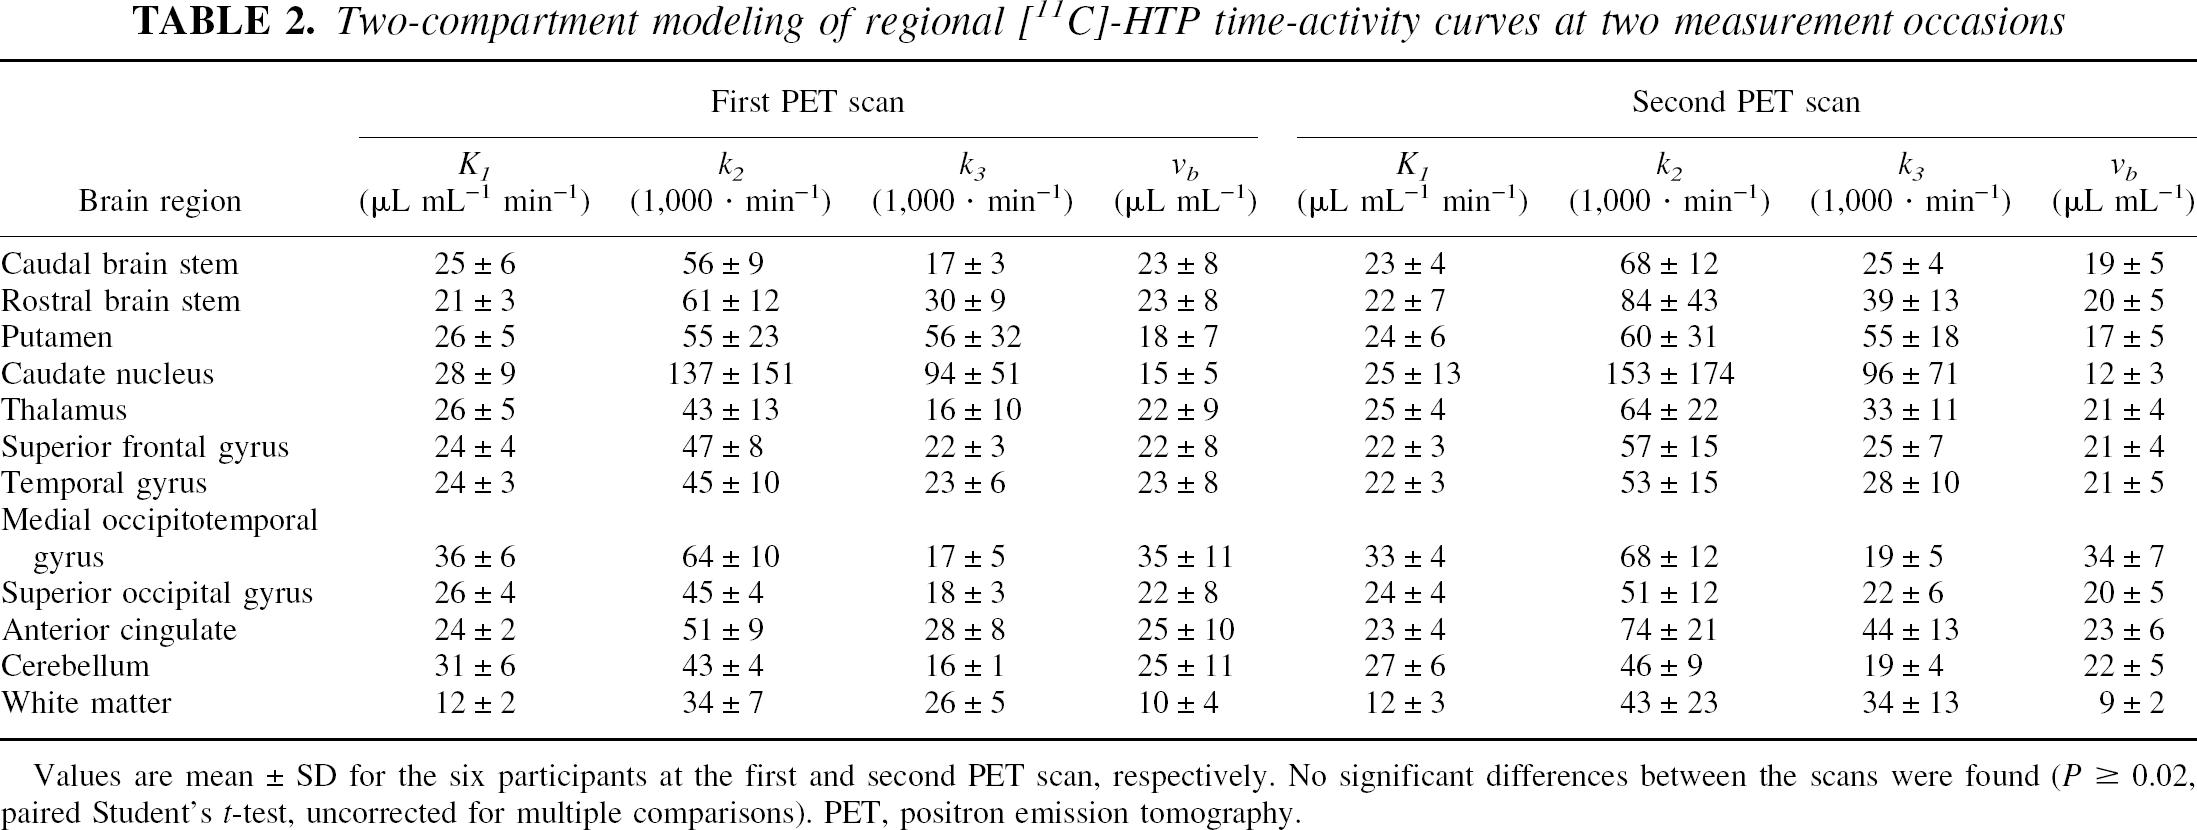
Values are mean ± SD for the six participants at the first and second PET scan, respectively. No significant differences between the scans were found (P ⩾ 0.02, paired Student's t-test, uncorrected for multiple comparisons). PET, positron emission tomography.
Regional [11C]-HTP Patlak slope and goodness-of-fit from positron emission tomography data measured between 30 to 60 minutes
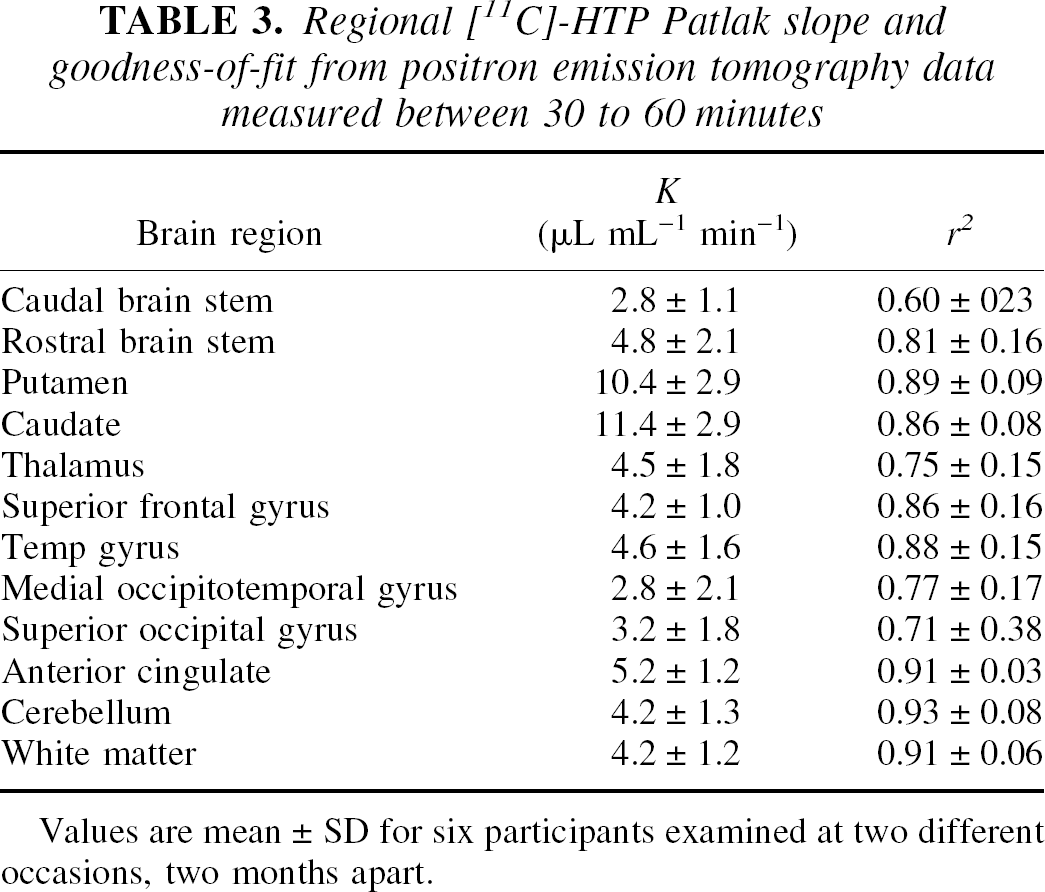
Values are mean ± SD for six participants examined at two different occasions, two months apart.
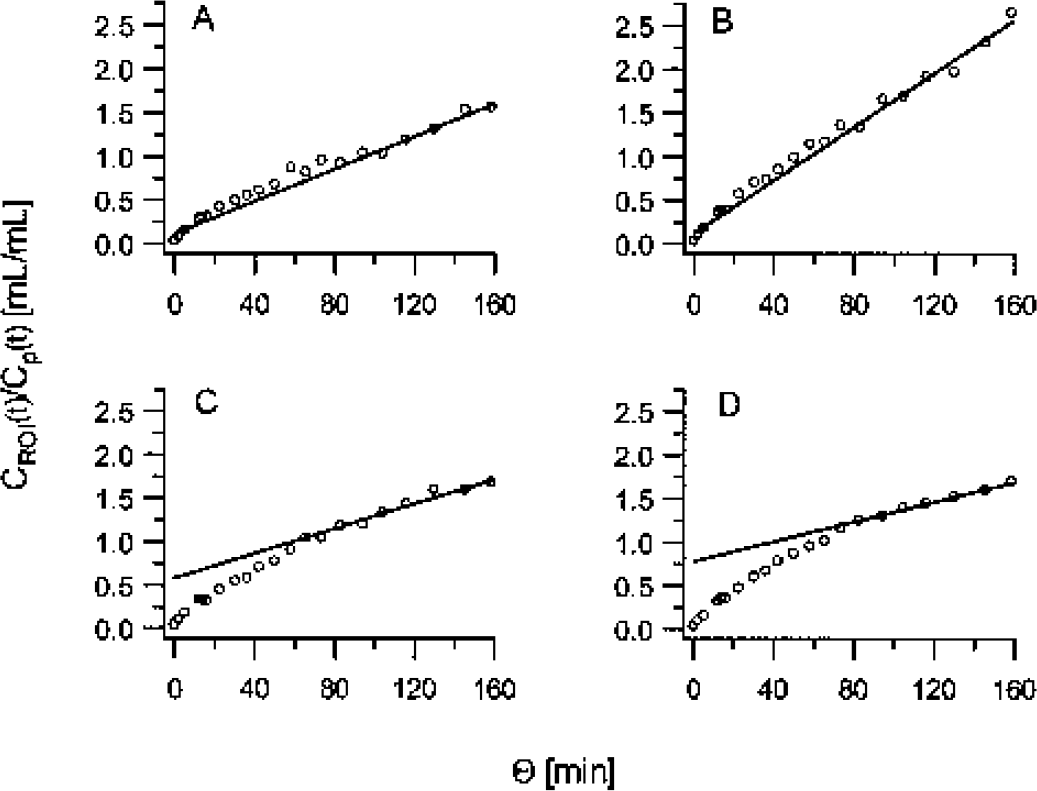
Examples of Patlak analysis of regional [11C]-HTP data for the
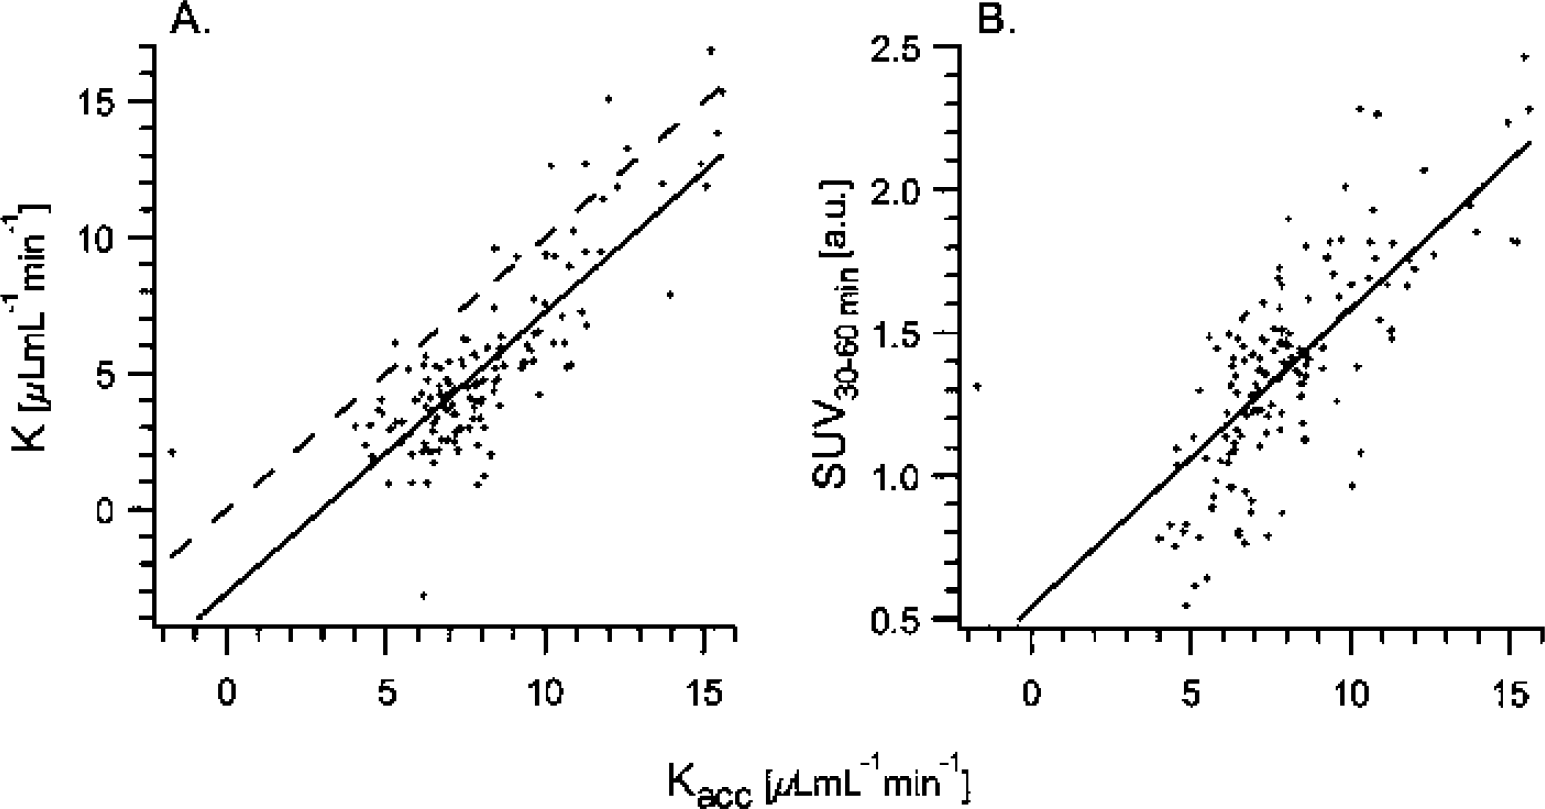
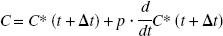
Relation between other evaluation methods and the net accumulation rate constant Kacc = K1k3/(k2+k3) obtained by kinetic two-tissue compartment modeling.
Relation between [11C]-HTP PET data and other parameters of serotonin synthesis
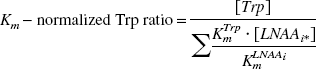
Large neutral amino acids in plasma before [11C]-HTP positron emission tomography scanning
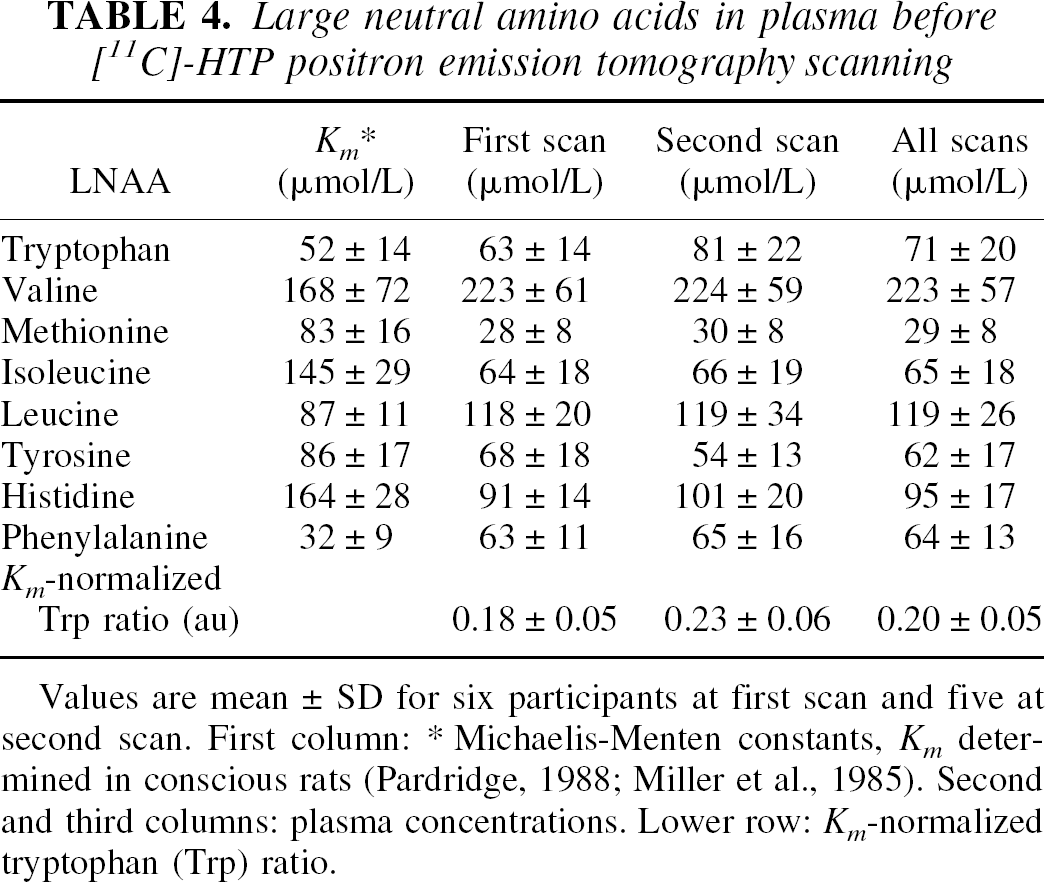
Values are mean ± SD for six participants at first scan and five at second scan. First column:
Michaelis-Menten constants, Km determined in conscious rats (Pardridge, 1988; Miller et al., 1985). Second and third columns: plasma concentrations. Lower row: Km-normalized tryptophan (Trp) ratio.
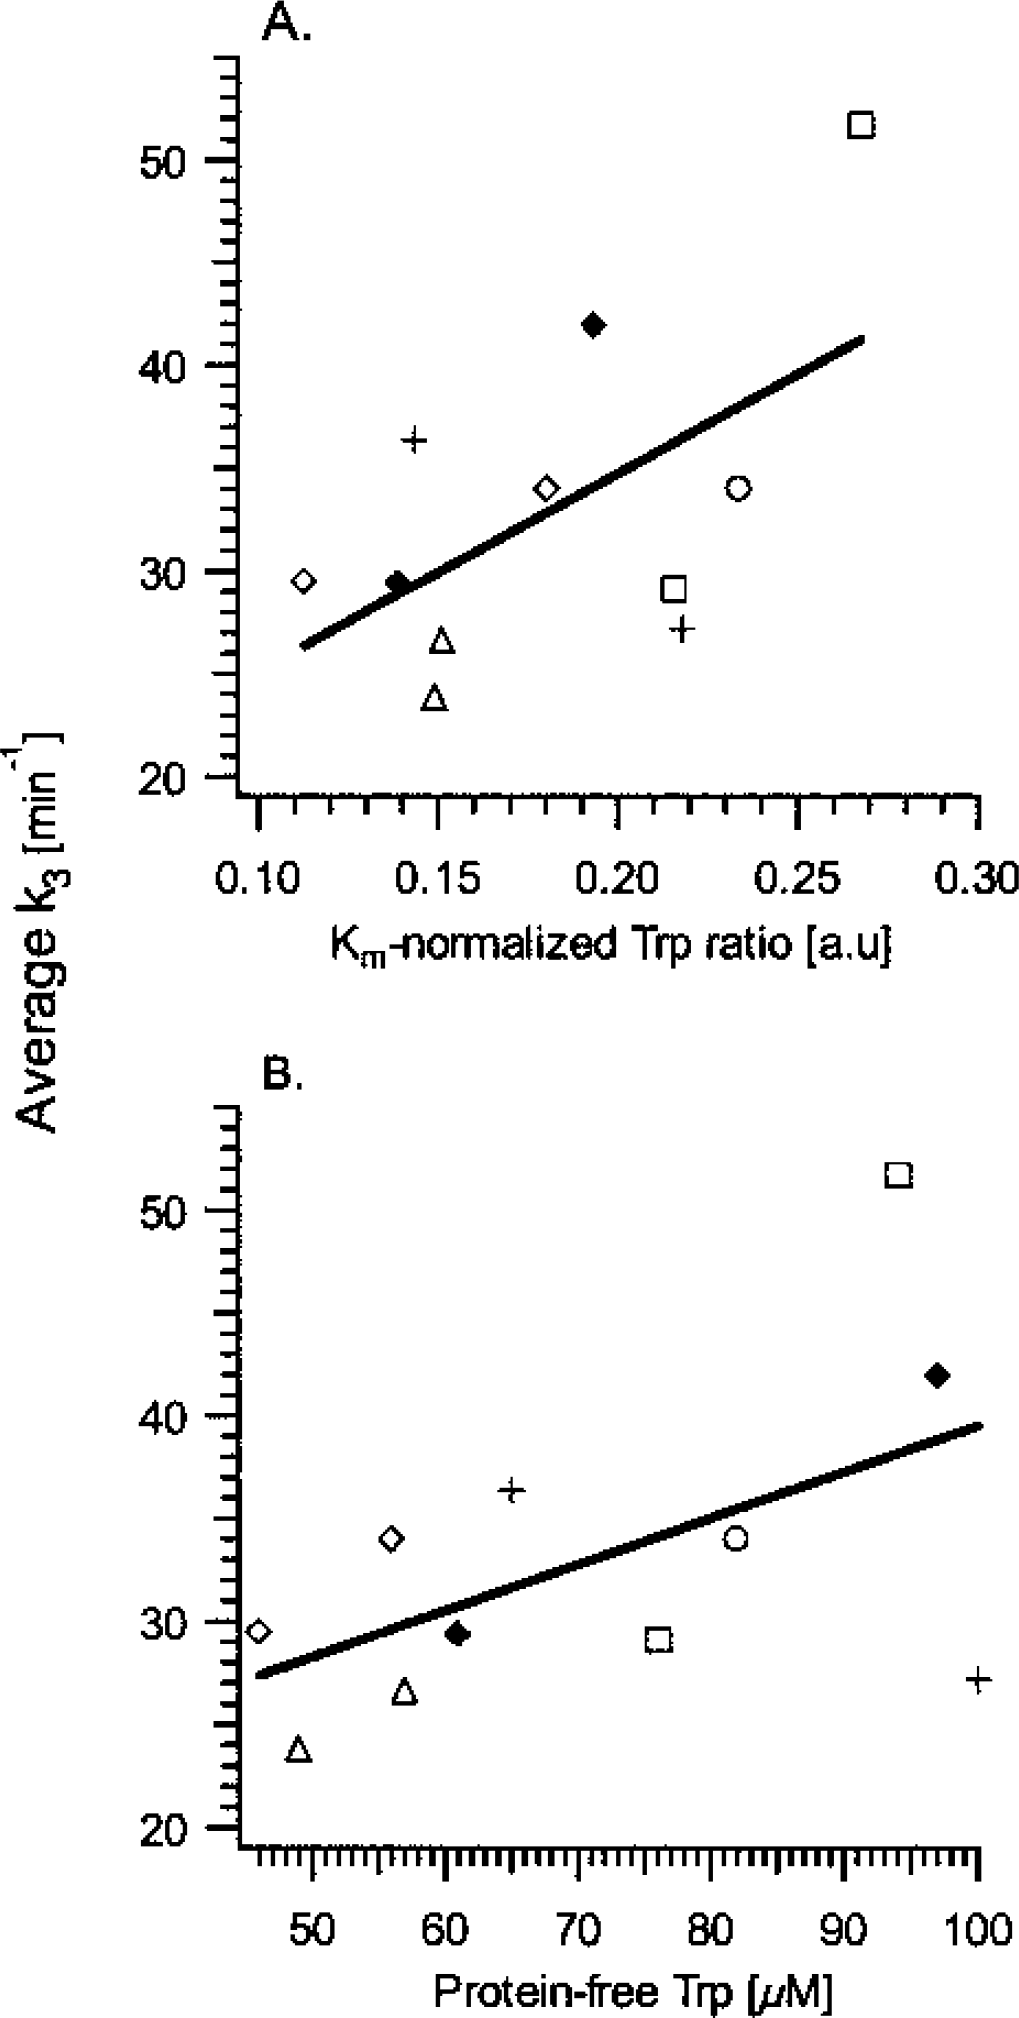
Relation between the rate constant for [11C]-HTP trapping, k3, and plasma tryptophan (Trp) levels.
[11C]-HTP net accumulation rate in human brain and serotonin tissue concentration
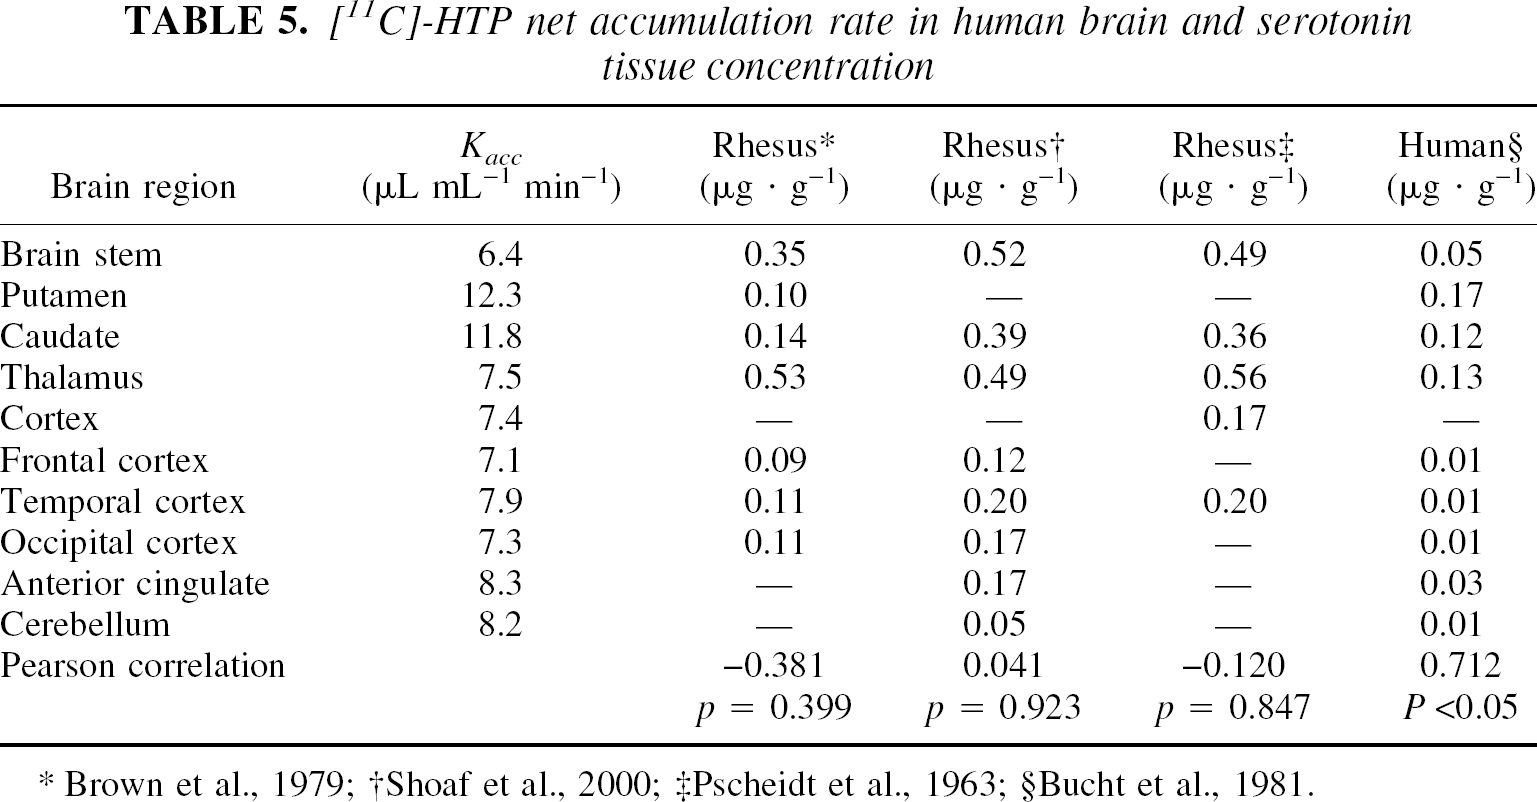
On the other hand, no species-related differences were found with regard to the serotonin synthesis rate, expressed as decarboxylation activity measured in vitro in rat and bovine tissue using 5-HTP as substrate. The values found in previous studies correlated with the rate constant of [11C]-HTP trapping, k3, determined in the present study (Table 6). In contrast, the k3-value was unrelated to the 5-HTP accumulation rates determined in Rhesus monkeys pretreated with the AADC inhibitor NSD1015 (Brown et al., 1979) and to the serotonin synthesis capacity reported for healthy human individuals (Chugani et al., 1998). Only when the net accumulation rate constant, which takes into account the precursor distribution volume, was calculated from the individually determined kinetic parameters (K1, k2, and k3) were significant correlations with the results from the studies in Rhesus monkeys and humans found.
[11C]-HTP tracer trapping, [11C]-HTP net accumulation rate, and serotonin turnover rates
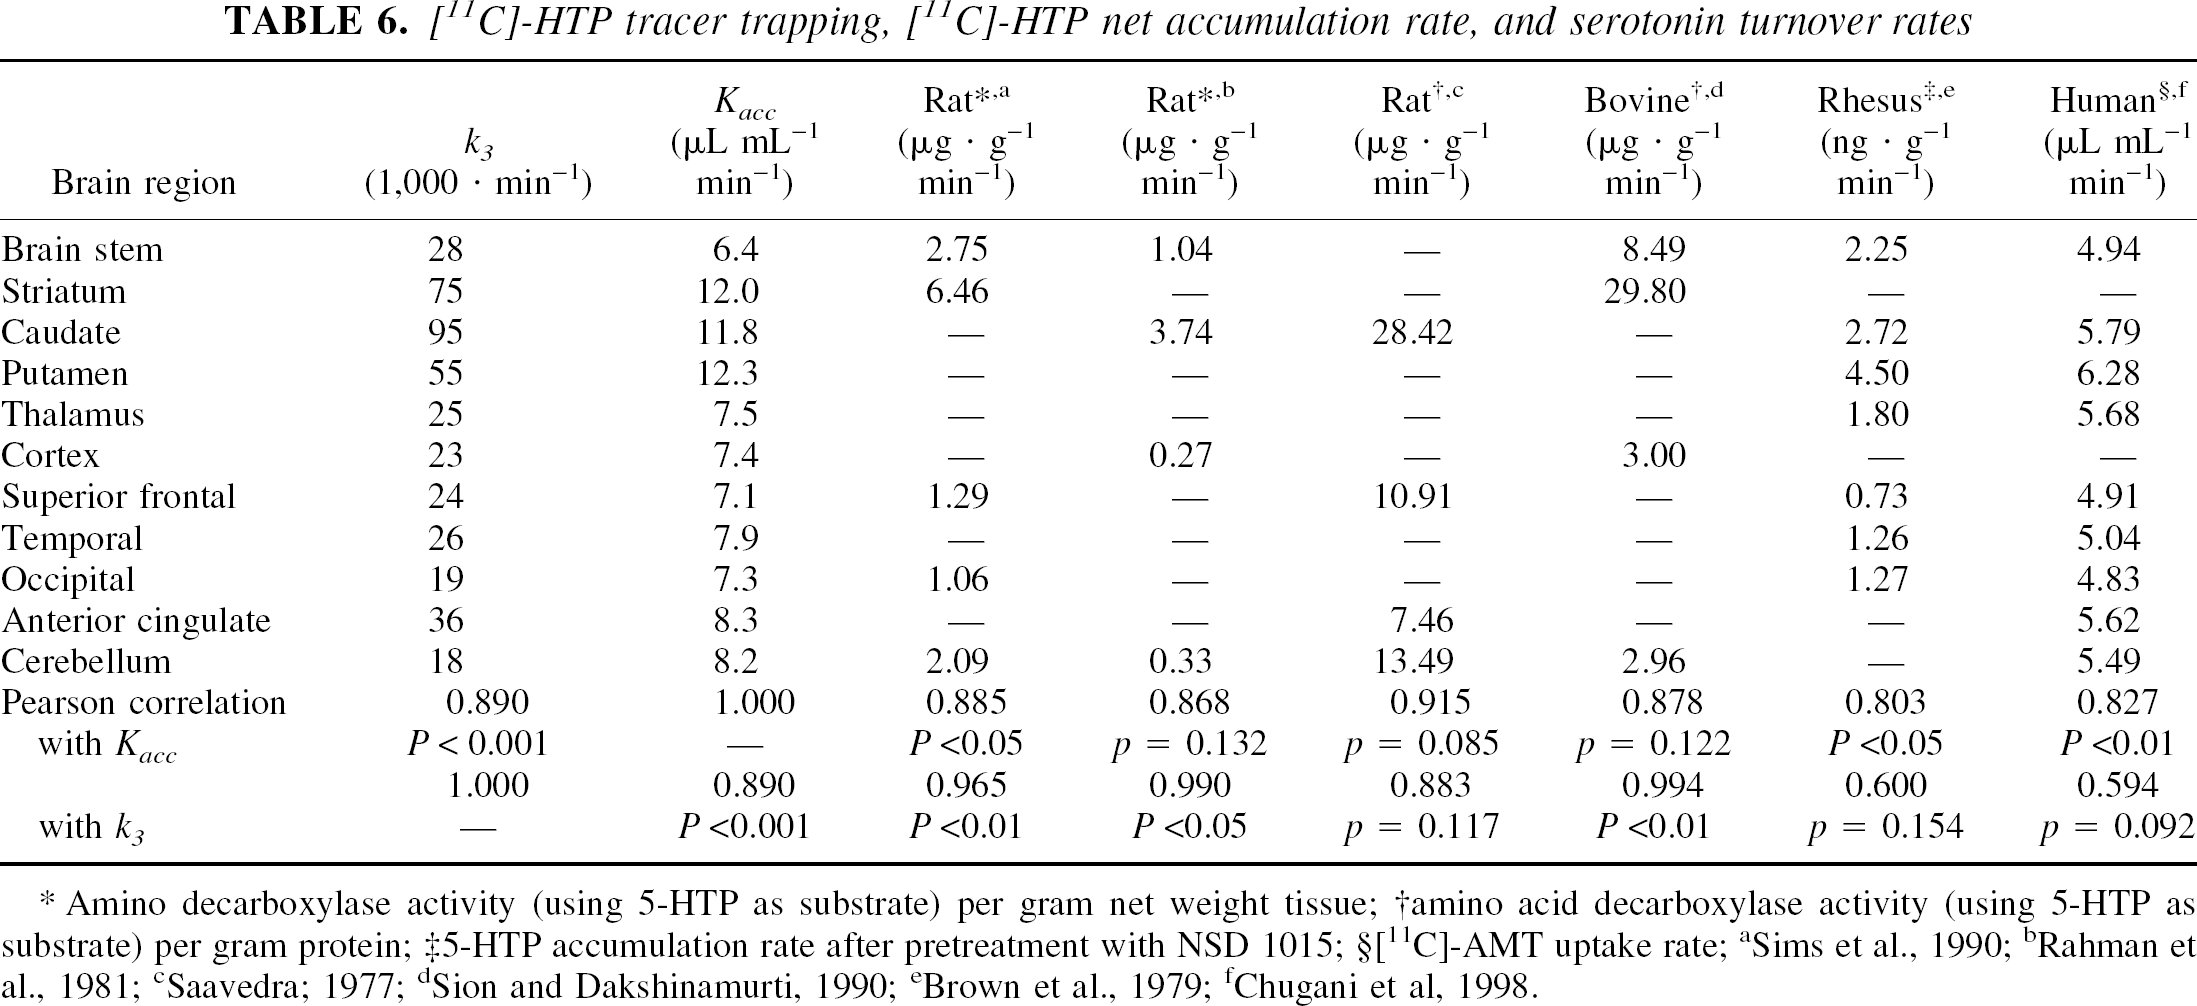
Amino decarboxylase activity (using 5-HTP as substrate) per gram net weight tissue
amino acid decarboxylase activity (using 5-HTP as substrate) per gram protein
5-HTP accumulation rate after pretreatment with NSD 1015; §[11C]-AMT uptake rate
Sims et al., 1990
DISCUSSION
The aim of the present work was to find a reliable and robust compartment model for [11C]-HTP PET data obtained in various brain regions of healthy individuals. For this purpose, six participants were scanned at two occasions and arterial blood sampling and plasma metabolite analysis was performed. Care was taken to perform the measurements at the same time of the day, in view of the known circadian variation of 5-HT synthesis. For all measurements, the availability of unchanged tracer in plasma was high (80% or more of the total radioactivity up to 60 minutes after injection). For kinetic modeling, regions in the human brain known to contain serotonin (Bucht et al. 1981; Chugani et al., 1998) were selected. In particular, regions where high 5-HT levels were expected (brain stem, enclosing the raphe nuclei, putamen, caudate nucleus, and anterior cingulate) were included in the analysis. Likewise, areas with intermediate levels (superior occipital, occipitotemporal, and temporal areas) and presumably absent 5-HT (white matter areas) were analyzed. The time-activity curves were extracted and fitted to a one-tissue compartment model describing inflow and clearance of the tracer, and to a two-tissue compartment model including irreversible trapping of the tracer. Although sampling at the initial time points was coarse, the fractional blood volume concurred in all but one subject, for whom this parameter was fixed. For the large majority of the individual model fits (84%), the two-tissue compartment model that included irreversible tracer trapping described the data significantly better than the one-tissue compartment model, as indicated by F tests. Similarly, a significant decrease in AIC was observed for the two-tissue compartment for all brain regions except the white matter, where presumably no serotonin synthesis occurs.
The results obtained in the present study may not be valid for the entire population of healthy young volunteers, since only six individuals were examined. To obtain kinetic parameters that have a more universal meaning, further studies with more subjects are needed. However, each participant was scanned at two separate occasions 2 months apart, and consequently the reliability of the method could be assessed. No significant difference was noted between the two occasions; however, in 10 out of the 12 brain regions (all regions except the two smallest structures, caudate nucleus and thalamus), the average k3 value showed slightly higher values at the second scan. Interestingly, this change was paralleled by a small but nonsignificant increase in the protein-free plasma Trp level and in the Km-corrected Trp ratio, both of which are believed to reflect increases in serotonin synthesis (Fernstrom and Wurtman, 1971).
Because [11C]-HTP is not only converted to 5-HT but may undergo catabolism to 5-HIAA that readily is cleared from the brain, model identification may require that more complex kinetics be considered. We attempted to account for the loss of labeled 5-HIAA by introducing additional rate constants in the model (data not shown). However, this approach did not yield improved model fits and the variation of the rate constants was high, in contrast to the relatively robust results obtained for the two-tissue, irreversible-trapping compartment model. This evidence of tracer trapping is supported by previous studies that report a rather long 5-HIAA half-life of 40 minutes in rats (Burns et al., 1976; Lindner et al., 1995). Due to slower metabolism, this half-life is probably even longer in humans. Consequently, tracer loss can most probably be neglected during the PET measurement time, which is the first 60 minutes after injection. Future studies using new-generation PET cameras operating in the more sensitive three-dimensional mode and that permits longer scan times should address this issue in more detail. Because HIAA is also present in plasma, it is possible that active transport of this metabolite from plasma into the brain occurs, affecting the final results. However, the maximal plasma content of HIAA was 16% of the total radioactivity, and the highest levels appeared only towards the end of scanning. Consequently, it seems less likely that this factor would have affected the final results.
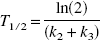
For any PET tracer, the biologic half-life for plasma to brain equilibrium is an important parameter, as it gives an estimate of the time point at which irreversible trapping can be measured. The half-life of [11C]-HTP was 7 to 12 minutes, about a factor of two higher than fluorodeoxy-glucose and a factor of two lower than those reported for the alternative serotonin tracer, [11C]-AMT (Muzik et al.,1997). The relatively rapid [11C]-HTP equilibration time suggests that other methods of analysis that are computationally more robust and thus lend themselves to voxelwise analysis may be used, starting at five times the half-life (i.e. approximately 3–6 minutes after injection). Two such methods were evaluated, the Patlak graphical method and the SUV, and both methods yielded results that were in good agreement with the parameters obtained by fitting of the two-tissue compartment model, especially in areas with high levels of tracer trapping.
The validity of the two-tissue compartment model and, in particular, the use of k3 as a representative measure of the conversion rate constant from 5-HTP to 5-HT by AADC and its relation to 5-HT synthesis, depends on several assumptions. First, the AADC must operate far from saturation; only then first-order kinetics reign and k3 becomes independent of the available substrate concentration, 5-HTP. Otherwise, if the tissue concentration of the substrate is above the Michaelis-Menten constant of AADC, the conversion rate constant becomes inversely proportional to the endogenous 5-HTP concentration. Because the Michaelis-Menten constant of AADC is on the order of 1000 μmol/L, which is far above the approximate 5-HTP tissue concentration (estimated to 3–30 nmol/L from the 5-HTP accumulation rates reported in Rhesus monkeys by Brown et al., 1979), the validity of linear kinetics is most probably assured and we may assume that the measured k3 is practically independent of tissue 5-HTP concentration. Another matter of concern is that tracer influx, not synthesis, is rate limiting for tracer trapping. In this respect, it can be noted that the free distribution volume was significantly different from zero in all investigated brain regions, suggesting that synthesis, not tracer transport, is rate limiting. Although these assumptions seem to hold, it should be noted that the serotonin synthesis rate (i.e., 5-HTP to 5-HT conversion rate, not its rate constant) cannot be determined by the proposed method, since this would require that the 5-HTP tissue concentration is quantified or at least that these levels are invariant. Absolute 5-HTP levels cannot be determined because most 5-HTP is produced locally, in the neurons and the outflux rate constant, k2, is important, as shown in the present study. But if we assume that the tracer is immediately mixed with the endogenous pool, and that the tracer fraction in this compartment equals the fraction that undergoes synthesis, then k3 becomes proportional to serotonin synthesis. Specifically, k3 is proportional to the formation of endogenous 5-HTP, and hence 5-HT synthesis, given that the rate of decarboxylation to serotonin is proportional to the rate of Trp to HTP conversion. Therefore, an increase in the rate of hydroxylation can be detected as an increase in k3, and vice versa.
Although, the conversion rate constant represents a potential tool for probing the two-step enzymatic reactions involved in serotonin synthesis, the use of [11C]-HTP PET may still be questioned. The reasons behind such doubts are associated with current knowledge of 5-HT neurochemistry. In general, any PET tracer aimed at detecting presynaptic 5-HT function should ideally be taken up selectively by the subpopulation of brain cells known as serotonergic neurons, and hence must undergo several distinct processes common to these cells, specifically neuronal precursor uptake, synthesis, vesicle storage, and 5-HT transmitter release. Difficulties arise at the very first step because the carrier-mediated transport system is common to all LNAAs, and transport of 5-HTP and Trp is thus not specific for serotonergic neurons (Feldman et al., 1997). Moreover, both substrates can be taken up by diffusion, making uptake an even less selective process (Feldman et al., 1997). As the rate-limiting step in serotonin synthesis is Trp hydroxylation, it seems reasonable to assume that the presence of this enzyme distinguishes serotonergic cells, and that this enzymatic step is the obvious choice for PET tracers. However, there is evidence that some neurons, specifically hypothalamic cells, show immunoreactivity to Trp-OH but only release dopamine and not serotonin (Vanhatalo and Soinila, 1999). Conversely, in several brain areas, neurons that are immunoreactive to the next enzyme in 5-HT synthesis, AADC, and hence synthesize serotonin and other LNAAs, do not show any immunoreactivity to Trp or tyrosine hydroxylase (Jaeger et al., 1984, Kitahama et al., 1990). These findings suggest, on one hand, that the expression of Trp-OH alone does not necessarily confirm the serotonergic phenotype; on the other hand, it seems that serotonergic neurons do not necessarily rely on Trp to 5-HTP conversion. As a consequence, tracers that undergo conversion only by AADC and not by Trp-OH may also represent tools for probing 5-HT synthesis. Although AADC is universal to all LNAAs, substrate specificity may arise by differences in affinities for this enzyme, as shown in vitro (Christenson et al., 1972) and in vivo in rat (Hashiguti et al., 1993) and Rhesus monkeys (Hartvig et al., 1993). Regulation of serotonin neurotransmission may also occur by the breakdown of 5-HT to 5-HIAA that is catalyzed by MAO. This enzyme is located intracellularly in mitochondria, and catabolism of 5-HT may thus take place either before vesicular storage or after release and reuptake via the 5-HT transporter site. Although synthesis immediately followed by degradation without storage and transmitter release may seem futile, this mechanism also offers an opportunity to control 5-HT neurotransmission. Two MAO isoforms with different in vitro affinity for 5-HT exist: the A and B-form. The A form has the highest 5-HT affinity, and remarkably, the prevalent form in serotonergic neurons in human is the B form (Feldman et al., 1997). This characteristic suggests that high intracellular levels of 5-HT must be achieved before an efficient clearance via 5-HIAA can take place, thus promoting vesicle storage over immediate degradation and elimination of 5-HT.
In view of these previous findings, proving that [11C]-HTP can be used for the assessment of 5-HT synthesis in serotonergic cells seems complex. However, some studies would support such an assumption. For instance, a 5-HTP-induced increase in 5-HT synthesis (Moir and Eccleston, 1968) has been demonstrated. Moreover, following 5-HTP administration, a dose-dependent serotonin release that could last for more than 2 hours after administration has been reported (Gartside et al., 1992; Perry and Fuller 1993). Likewise, after destruction of the raphe system, serotonin formation from exogenous 5-HTP was blocked, implying that 5-HTP is predominantly used by serotonergic nerves (Saavedra, 1976).
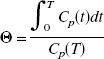
In the present work, to support a link between the obtained kinetic parameters and serotonin synthesis, different measures of 5-HT synthesis in serotonergic cells—namely, availability of brain Trp, serotonin concentration, and synthesis rate—were evaluated and compared to appropriate kinetic parameters. First, the [11C]-HTP k3 value was compared to the estimated availability of brain Trp, evidently a limiting factor for serotonin synthesis (Fernstrom and Wurtman, 1971). The precursor tissue concentration will depend on BBB transport, which occurs both via active transport and diffusion mechanisms. In the case of active transport, an estimate of Trp tissue concentration can be obtained by evaluating precursor transport across the BBB, with respect to the presence of other LNAAs that use the same transporter site. On the other hand, if diffusion prevails, it is sufficient to evaluate the protein-free plasma Trp concentration to obtain an estimate of the brain tissue concentration. Indeed, the latter approach has been shown to yield the best correlations, as shown by Gillman et al. (1981), who assessed plasma and brain tissue Trp levels in fasting schizophrenic patients before brain surgery. In accordance with these results, we found trends towards positive, linear relations between k3 values, averaged across the 12 investigated brain regions, and both the Km-normalized Trp ratio and the protein-free Trp plasma concentration.
We also evaluated the relation between the rate constants and serotonin data reported in the literature. In spite of problems associated with such a comparison that are related to the definition of brain regions, adopted methodology, and species differences, this analysis led to some interesting results. For instance, the rate constant for [11C]-HTP trapping correlated well with 5-HT levels measured in human post mortem tissue but not in Rhesus monkeys or rats. This inconsistency may be related to the high amount of tracer trapping and serotonin concentration observed in human striatal areas, an observation not confirmed in animal studies, where the highest 5-HT levels are detected in the thalamus and brain stem. Such phylogenetic differences are not unexpected because the degree of myelinization in the serotonergic system differs severalfold between rats and monkeys (Jacobs and Azmitia, 1992), suggesting that in higher species, relatively more junctional connections are made. Nevertheless, there is not necessarily a good accordance between brain 5-HT concentrations and 5-HT synthesis. For instance, a study by Huether et al., (1997) indicated that the tissue content of 5-HT is the least reliable measure of changes associated with 5-HT terminals.
The measured kinetic parameters were furthermore related to literature data on serotonergic enzyme activity. As can be expected, the in vitro decarboxylase activity, measured with 5-HTP as substrate and determined in rat and bovine tissue, correlated significantly with the rate constant for [11C]-HTP trapping. A common feature of these studies was the relatively high level of AADC activity in the basal ganglia that potentially may be driven by dopaminergic cells, which have a high density in these structures. Indeed, since AADC is expressed in all the monoaminergic cells (serotonergic, noradrenergic, and dopaminergic), the use of HTP for probing decarboxylase activity may reflect 5-HT synthesis in any of these neuronal cell types. Consequently, a possible interpretation of the high conversion rate constants observed in the striatum is an unspecific uptake 5-HT synthesis and binding in synaptosomal vesicles in dopaminergic cells. Nevertheless, the remaining two studies, both aimed at probing Trp-OH activity, either by measurement of 5-HTP accumulation after pretreatment with NSD 1015 (Brown et al., 1979) or by [11C]-AMT PET (Chugani et al., 1998), also reported high levels in the basal ganglia and regional values correlated with the [11C]-HTP net accumulation rate constant. In contrast, if Trp-OH activity is measured in vitro, the regional distribution is different, with the highest levels in the midbrain raphe area, preoptic hypothalamic area, and substantia nigra, while the lowest rates are observed in the caudate and putamen (Azmitia and Gannon, 1986). Moreover, such results have also been observed in vivo in rats, in which the 5-HTP accumulation after AADC inhibition with NSD 1015 is twice as high in the hypothalamus than in the striatum (Larsson et al., 1998). Taken together, these studies illustrate that the issue of regional distribution of in vivo 5-HT synthesis is not clearcut, potentially since synthesis may be related to factors other than enzyme activity, such as density of 5-HT terminals and serotonin turnover. For instance, bearing in mind that Trp hydroxylation is regulated by precursor uptake, it may be worth noting that Trp uptake could vary across brain regions. Given such considerations, the highest rate of synaptosomal 5-HT conversion was observed in the striatum, in spite of a low hydroxylase activity, since this structure exhibited a high rate of Trp uptake (Mandell and Knapp, 1977).
In conclusion, tracer kinetic compartment rate constants can be reliably estimated for [11C]HTP PET measurements. The results of kinetic compartment modeling indicate that within the PET time frame (i.e., up to 60 minutes after injection), the tracer crosses the BBB, reaches plasma-to-tissue equilibrium with a distribution volume that is significantly different from zero, and is trapped in brain tissue. These results suggest that the rate constant for tracer trapping reflects the conversion rate constant from 5-HTP to 5-HT by AADC, independent of tracer transport. Interestingly, the rate of [11C]-HTP trapping determined by compartment modeling is closely linked to the estimated availability of Trp in brain tissue, which reflects serotonin synthesis in healthy individuals. Moreover, k3 correlates with AADC activity determined in vitro in rat and bovine tissue. Likewise, the [11C]-HTP net accumulation rate constant corresponds to the rate of 5-HTP accumulation determined in Rhesus monkeys pretreated with the AADC inhibitor NSD 1015 and to [11C]-AMT–assessed serotonin synthesis capacity in healthy individuals. Although further studies are needed to confirm the relation between the [11C]-HTP conversion rate constant and serotonin synthesis in serotonergic cells, these findings indicate that, within the limits of current knowledge regarding the identification and function of this cell population, [11C]-HTP may be used as a PET tracer to investigate synaptic serotonin synthesis in serotonergic cells.
Footnotes
Acknowledgments:
The authors thank Svante Ross (Astra-Zeneca Södertälje) for valuable discussions, Anders Larsson (Department of Clinical Chemistry and Pharmacology, Uppsala University Hospital) for plasma LNAA analysis, Jesper Andersson (Karolinska Institute, Stockholm) for the software used to obtain raw data, and the Uppsala University PET-Center radiographers (Rita Öhrstedt, Lars Lindsjö, and Karin Lidström) for performing the PET measurements.