
Abstract
Serotonin 5-HT1A receptors are implicated in the pathophysiology of neuropsychiatric conditions. The goal of this study was to evaluate methods to derive 5-HT1A receptor parameters in the human brain with positron emission tomography (PET) and [carbonyl-11C]WAY 100635. Five healthy volunteer subjects were studied twice. Three methods of analysis were used to derive the binding potential (BP), and the specific to nonspecific equilibrium partition coefficient (k3/k4). Two methods, kinetic analysis based on a three compartment model and graphical analysis, used the arterial plasma time-activity curves as the input function to derive BP and k3/k4. A third method, the simplified reference tissue model (SRTM), derived the input function from uptake data of a region of reference, the cerebellum, and provided only k3/k4. All methods provided estimates of regional 5-HT1A receptor parameters that were highly correlated. Results were consistent with the known distribution of 5-HT1A receptors in the human brain. Compared with kinetic BP, graphical analysis slightly underestimated BP, and this phenomenon was mostly apparent in small size-high noise regions. Compared with kinetic k3/k4, the reference tissue method underestimated k3/k4 and the underestimation was apparent primarily in regions with high receptor density. Derivation of BP by both kinetic and graphical analysis was highly reliable, with an intraclass correlation coefficient (ICC) of 0.84 ± 0.14 (mean ± SD of 15 regions) and 0.84 ± 0.19, respectively. In contrast, the reliability of k3/k4 was lower, with ICC of 0.53 ± 0.28, 0.47 ± 0.28, and 0.55 ± 0.29 for kinetic, graphical, and reference tissue methods, respectively. In conclusion, derivation of BP by kinetic analysis using the arterial plasma input function appeared as the method of choice because of its higher test—retest reproducibility, lower vulnerability to experimental noise, and absence of bias.
Serotonin (5-HT) projections, arising from the dorsal and median raphe nuclei, innervate virtually all regions of the brain (Steinbusch, 1981). 5-HT1A receptors are somatodendritic autoreceptors in the raphe nuclei and postsynaptic receptors in the neocortex, hippocampus, and other limbic structures (Wright et al., 1995; Blier et al., 1998). Abnormalities in the density of these receptors have been described in postmortem brain samples from subjects with schizophrenia, and less consistently, in depressed subjects and suicide victims (see reference lists in Arango et al., 1995; Gurevich and Joyce, 1997). Modulation of 5-HT1A receptor function has also been implicated in the mechanism of action of antidepressant drugs (Blier et al., 1998). However, the exact function of these receptors and their involvement in neuropsychiatric conditions remains to be elucidated. Imaging 5-HT1A receptors with positron emission tomography (PET) provides a unique opportunity to better characterize the function of 5-HT1A receptors.
WAY-100635 [N-(2-(4-(2-methoxyphenyl)-1-piperazinyl)ethyl)-N-(2-pyridinyl) cyclohexane carboxamide] is a 5-HT1A antagonist with high affinity and selectivity for 5-HT1A receptors (KD = 0.1–0.4 nmol/L)(Forster et al., 1995; Gozlan et al., 1995). Initial PET studies in monkeys and humans supported the potential of WAY-100635 labeled with 11C in the O-methyl position as a PET radiotracer (Mathis et al., 1994; Pike et al., 1995a). However, [O-methyl-11C]WAY-100635 is rapidly metabolized into a more polar metabolite, [O-methyl-11C]WAY-100634, which crosses the blood-brain barrier and has high affinity for both 5-HT1A and adrenergic α1 receptors (Osman et al., 1996). An elegant solution to this problem was provided by Pike et al. (1995b), who suggested placement of the C-11 labeling atom in the cyclohexanecarbonyl moiety of the molecule (that is, [carbonyl-11C]WAY-100635). In contrast with [O-methyl-11C]WAY-100635, the radioactive metabolite generated by the hydrolysis of [carbonyl-11C]WAY-100635 does not cross the blood-brain barrier. As a result, the brain time-activity curves were not contaminated with radioactively labeled metabolites, the signal-to-noise ratio of [carbonyl-11C]WAY-100635 was dramatically enhanced compared with [O-methyl-11C]WAY-100635, and quantitative derivation of 5-HT1A receptors parameters became feasible (Pike et al., 1995b).
Quantification of human 5-HT1A receptors with [11C]WAY 100635 (from here on, [11C]WAY 100635 designates [carbonyl-11C]WAY-100635) was initially reported by Farde et al. (1998). Kinetic analyses based on a three compartment model, graphical analysis, and transient equilibrium analysis methods were used to compare the binding potential (BP) normalized to the cerebellum distribution volume (denoted here as k3/k4) in four regions of the human brain. Each method generated different estimates of k3/k4. Gunn et al. (1998) quantified 5-HT1A receptor k3/k4 in four human brain regions. Two kinetic methods were evaluated: one method used the arterial plasma concentration as the input function, and the second method used an input function derived from a background region (reference tissue model). Again, discrepancies between estimates of k3/k4 by the two methods were reported. Recently, two groups, both using the reference tissue model, reported generalized decreases in [11C]WAY 100635 k3/k4 in patients with major depression (Drevets et al., 1999; Sargent et al., 2000).
The general scope of the current investigation was to further evaluate quantification of 5-HT1A receptor parameters in the human brain with [11C]WAY 100635. The first aim of the current study was to compare the test—retest variability (TRV) of two receptor parameters, BP and k3/k4. In this paper, the term BP refers to the distribution volume of the specifically bound radiotracer relative to the plasma concentration, and k3/k4 refers to BP normalized to the distribution volume of a reference region devoid of receptors. The second aim of the study was to evaluate the discrepancies between the values of k3/k4 as returned by different analytical approaches (kinetic, graphical, and reference tissue models) in more detail. The third aim was to determine the reliability of 5-HT1A parameter measurements in small and discrete limbic brain regions. Previously published studies restricted their analyses to relatively large brain regions, such as the medial temporal lobe (with the notable exception of the dorsal raphe). The medial temporal lobe encompasses several limbic structures of interest, such as the amygdala, the hippocampal formation, the parahippocampal gyrus, the uncus, and the entorhinal cortex. To evaluate the potential of [11C]WAY 100635 imaging for studying the role of 5-HT1A receptors in the limbic system, the authors investigated the reliability of 5-HT1A receptor measurements in these subregions of the medial temporal lobe.
Five healthy male volunteer subjects were studied twice with [11C]WAY 100635, and data were analyzed with three general methods: three compartment kinetic analysis using an arterial input function (Mintun et al., 1984), graphical analysis using an arterial input function (Logan et al., 1990), and kinetic analysis based on an input function derived from a region of reference, that is, the cerebellum (Lammertsma and Hume, 1996). Outcome measures derived with these three methods were compared using several criteria, including identifiability, stability, variability, and reliability.
MATERIALS AND METHODS
Human subjects
Five healthy male volunteer subjects age 29 ± 4 years (mean ± SD) were scanned twice on the same day to evaluate the reproducibility of the outcome measures. The study was approved by the Columbia Presbyterian Medical Center Institutional Review Board, and subjects provided written informed consent after receiving an explanation of the study. The absence of medical, neurologic, and psychiatric history (including alcohol and drug abuse) was assessed by history, review of systems, physical examination, routine blood tests, urine toxicology, and electrocardiogram. Subjects were not taking any medication for at least two weeks before the scans.
Radiochemistry
[11C]WAY 100635 was prepared as previously described (Hwang et al., 1999). Specific radioactivity at the time of injection was 1047 ± 288 Ci/mmol (n = 10, range 428 to 1355 Ci/mmol). Injected dose was 8.8 ± 3.0 mCi (n = 10, range 5.5 to 12.9 mCi). Injected mass was 3.7 ± 1.3 μg (n = 10, range 1.2 to 5.8 μg).
PET protocol
Subject preparation included placement of arterial and venous catheters, fiducial markers and a polyurethane head immobilizer. Four fiducial markers, filled with C-11 (about 2 μCi per marker at time of injection) were taped on the subject's heads. Head movement was minimized with a polyurethane head immobilizer system (Soule Medical, FL), molded around the head of the subject. This system provides better restraint than a thermoplastic mask (Mawlawi et al., 1999). PET imaging was performed with an ECAT EXACT 47 scanner (Siemens/CTI, Knoxville, TN). This camera generates 47 slices covering an axial field of view of 16.2 cm. The transverse and axial resolutions at the center of the field of view were 6.0 and 4.6 mm FWHM respectively in 3D mode. The axial sampling was 3.4 mm. A 10 minute transmission scan was obtained before radiotracer injection. [11C]WAY 100635 was injected intravenously as a bolus over 45 seconds. Emission data were collected in the 3D mode for 120 minutes as 21 successive frames of increasing duration (3 × 20 seconds, 3 × 1 minute, 3 × 2 minutes, 2 × 5 minutes, 10 × 10 minutes). Images were reconstructed to a 128 × 128 matrix (pixel size of 2.5 × 2.5 mm2). Reconstruction was performed with attenuation correction using the transmission data and a Shepp reconstruction filter with a cutoff of 0.5 cycles/projection rays. Subjects were rested outside the camera for 15 to 30 minutes between injections.
Input function measurement
After radiotracer injection, arterial samples were collected every 5 seconds with an automated sampling system for the first 2 minutes, and manually thereafter at longer intervals. Thirty-one samples were obtained for each experiment. After centrifugation (10 minutes at 1,800
Samples collected at 2, 6, 12, 20, 40, and 60 minutes were processed by protein precipitation using acetonitrile followed by high pressure liquid chromatography (HPLC) to measure the fraction of unmetabolized [11C]WAY 100635. Plasma samples (0.5 mL) were added to 0.7 mL acetonitrile, mixed, and centrifuged at 14,000
The six measured unmetabolized [11C]WAY 100635 fractions were fit to the sum of one exponential and one constant, with the value at time zero constrained to one hundred percent. The input function was the product of total counts and interpolated unmetabolized [11C]WAY 100635 fraction. The measured input function values (Ca(t), μCi/mL) were fit to a sum of three exponentials (this function was fit from the time of the peak to the last data point, whereas the rising part of the curve was fit as a straight line between the first point and the peak). The fitted values were used as input to the kinetic and graphical analyses. The clearance of the unmetabolized [11C]WAY 100635 (CL, L/h) was calculated as the ratio of the injected dose to the area under the curve of the input function (Abi-Dargham et al., 1994).
For the determination of the plasma free fraction (f1), triplicate 200 μL aliquots of plasma collected before injection were mixed with radiotracer, pipetted into ultrafiltration units (Centrifree, Amicon, Danvers, MA), and centrifuged at room temperature (20 minutes at 4000
MRI acquisition and segmentation procedures
Magnetic resonance imagings (MRIs) were acquired on a GE 1.5 T Signa Advantage system (GE Medical Systems, Milwaukee, WI, U.S.A.). Following a sagittal scout (localizer), performed to identify the anterior commissure-posterior commissure plane (1 minute), a transaxial T1 weighted sequence with 1.5 mm slice thickness was acquired in a coronal plane orthogonal to the anterior commissure-posterior commissure plane over the whole brain with the following parameters: three-dimensional SPGR (Spoiled Gradient Recalled Acquisition in the Steady State); repetition time 34 milliseconds; echo time 5 milliseconds; flip angle of 45 degrees; slice thickness 1.5 mm and zero gap; 124 slices; field of view 22 × 16 cm; with 256 × 192 matrix, reformatted to 256 × 256, yielding a voxel size of 1.5 mm × 0.9mm × 0.9 mm; and time of acquisition 11 minutes. Magnetic resonance imaging segmentation between gray matter, white matter, and cerebrospinal fluid pixels was performed as previously described (Abi-Dargham et al., 2000).
Image analysis
Image analysis was performed with MEDx (Sensor Systems, Sterling, Virginia, U.S.A.) with PET-PET frame realignment, PET-MRI registration, and time-activity curve measurement.
Quantitative analysis
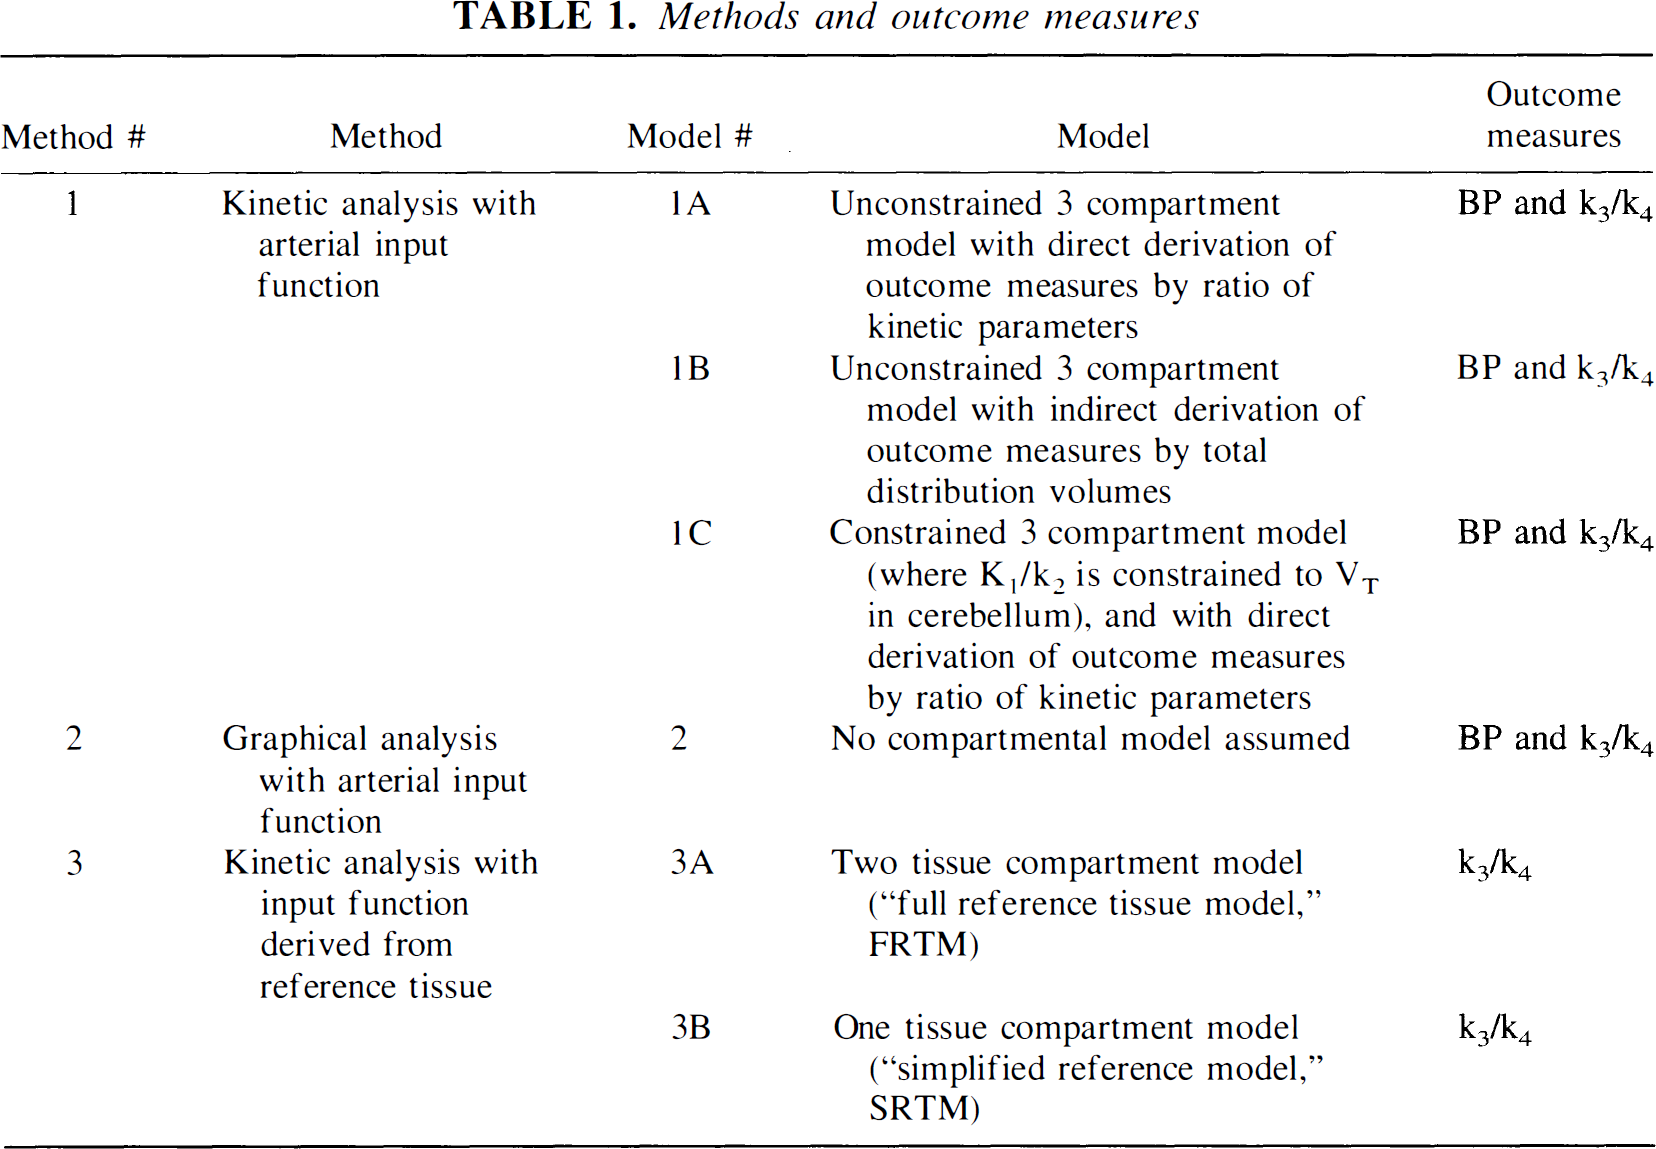
Derivation of [11C]WAY 100635 regional distribution volumes was performed with three general approaches: kinetic analysis using the arterial input function (Method 1); graphical analysis using the arterial input function (Method 2), and kinetic analysis using an input function derived from a reference region (Method 3, Table 1). A three compartment model (that is, two tissue compartment model) provided the general framework for each method. The model included the arterial plasma compartment (Ca), the intracerebral free and nonspecifically bound compartment (nondisplaceable compartment, C2), and the specifically bound compartment (C3). The equilibrium distribution volume of a compartment i (Vi, mL/g−1) was defined as the ratio of the tracer concentration in this compartment to the free plasma concentration at equilibrium

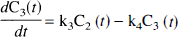
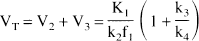
V2 and V3 were defined as the distribution volumes of the second (nondisplaceable) and third (specific) compartments, respectively. V3 was equal to the ratio of the receptor density (Bmax, nmol/L·g of tissue) and affinity (KD, nmol/L·mL of brain water) (Mintun et al., 1984; Laruelle et al., 1994c). VT was defined as the total regional equilibrium distribution volume, equal to the sum of V2 and V3.
Methods and outcome measures
All analyses (kinetic with arterial input function, graphical with arterial input function, and kinetic with reference tissue derived input function) shared two assumptions. First, given the negligible concentration of 5-HT1A receptors in the cerebellum, cerebellar VT was assumed to represent only free and nonspecific binding and to provide a reasonable estimate of V2 in the ROIs. Second, the contribution of plasma total activity to the regional activity was calculated assuming a 5% blood volume in the ROI and subtracted from the regional activity before analysis (Mintun et al., 1984).
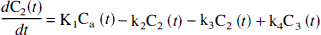
with the kinetic parameters defined as


where F (mL g−1 min−1) is the regional blood flow, E (unitless) is the unidirectional extraction fraction, PS is (mL g−1 min−1) the permeability surface area product of the tracer, kon is (nmol/L−1·min−1) the bimolecular ligand-receptor association rate constant, Bmax (nmol/L) is the concentration of receptors available for binding (equal to Bmax because experiments were performed at tracer dose), and koff (min−1) is the receptor dissociation rate constant.
In the ROIs, volumes of distribution can be directly derived from rate constants according to

Substituting in Eq. 9 the terms K1/k2f1, k3, k4 with Eq. 5, 6, and 7, respectively, and recalling that KD equals koff/kon, establishes the equivalence between V3 and Bmax/KD (Laruelle et al., 1994a).
As defined above, V3 is the optimal outcome measure because it is the only expression of the specific distribution volume which is exclusively dependent on receptor parameters (that is, KD and Bmax). However, this outcome measure requires the measurement of the plasma free fraction (f1) which was found to be associated with poor reliability (see Results). Therefore, distribution volumes were expressed relative to the total (free and nonspecifically bound to plasma proteins) [11C]WAY 100635 plasma concentration
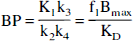
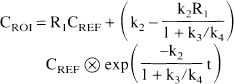
Because BP, as defined in Eq. 11, requires the measurement of the arterial input function, BP was derived only for Methods 1 and 2. The specific to nonspecific equilibrium partition coefficient, k3/k4, is equivalent to V3 normalized to the reference region distribution volume
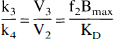
where f2 is the free fraction in the nondisplaceable compartment (f2 = 1/V2). k3/k4 was derived with Methods 1, 2, and 3.
Kinetic analysis with arterial input function (Method 1)
Three approaches were used to derive BP and k3/k4 with Method 1 (Methods 1A, 1B and 1C). In Method 1A, ROI data were fit to an unconstrained three compartment model, and BP and k3/k4 were directly calculated by applying Eq. 8 and 9 with the rate constants provided by the analysis. The authors refer to Method 1A as the direct approach. In Method 1B, ROI data were fit to a unconstrained three compartment model, regional VT were calculated using Eq. 10, and BP and k3/k4 were derived as


where VT ROI and VT CER are the total distribution volumes in the ROI and the cerebellum, respectively. The authors refer to Method 1B as the indirect approach. In Method 1C, ROI data were fit to a three compartment model with the K1/k2 ratio constrained to the value of cerebellum VT, and BP and k3/k4 were derived with Eq. 8 and 9, respectively. The authors refer to Method 1C as the constrained approach. Method 1A is the method used by Farde et al. (1998) in their kinetic analysis of human [11C]WAY 100635 data. Gunn et al. (1998) used both Methods 1A and 1B. Method 1C has not been previously reported for [11C]WAY 100635.
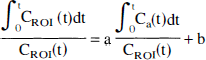
where the value of the slope a and the intercept b were obtained by linear regression (Logan et al., 1990). This method allows for the determination of regional VT of reversible ligands as the slope of the regression line without assuming a particular compartmental configuration. Assuming, as in the kinetic analysis, the equivalence between the cerebellum distribution volume (VT CER) and the nondisplaceable distribution volume in the ROI, outcome measures BP and k3/k4 were calculated using Eq. 13 and 14. Methods 1 and 2 have been shown to allow derivation of distribution volumes that are independent of blood flow as long as the blood flow is constant during the time frame of the experiment (Logan et al., 1994).
In the simplified reference tissue model (SRTM, Method 3B), (Lammertsma and Hume, 1996), the second and third compartments are collapsed, therefore the total distribution volume is expressed as

where k2 = k2/(1 + k3/k4). With this assumption, the operational equation simplifies to
Fitting the data to the operational equation of the simplified reference tissue method provides the parameters R1, k2, and k3/k4. Compared with the full reference tissue model, the simplified reference tissue model is more stable and parameter identification is improved (Gunn et al., 1998). For both reference tissue methods, the convolution sum was formed by interpolating the reference region data with cubic splines at intervals of 1 minute and integrating using trapezoidal sums.
For Methods 1 and 3, kinetic parameters were derived by nonlinear regression using a Levenberg—Marquart least squares minimization procedure implemented in MATLAB (Math Works, South Natick, MA, U.S.A.) as previously described (Laruelle et al., 1994b). Given the unequal sampling over time (increasing frame acquisition time from beginning to end of the study), the least squares minimization procedure was weighted by the square root of the frame acquisition time.
Between methods comparisons
Values of BP and k3/k4 derived by different methods were evaluated with five criteria: success rate, identifiability, stability, variability, and reliability.
where BSMSS is the mean sum of squares between subjects, WSMSS is the mean sum of squares within subjects, and n is the number of repeated observations (n = 2 in the current study). This coefficient estimates the reliability of the measurement and ranges between −1 (no reliability, that is, BSMSS = 0) to 1 (maximum reliability, achieved in the case of identity between test and retest, that is, WSMSS = 0).
Statistical analysis
For each outcome measure and each subject (n = 5), the average of test and retest values were calculated, and results were given as mean ± SD of these five average measurements. Unless otherwise specified, SD refers to between-subject SD, that is, to the estimated variability in the investigated population (each subject counts only once, n = 5). When the SD refers to variability between the experiments rather than between subjects (such as for the injected dose), the SD is followed by n = 10. Statistical analysis was performed with factorial or repeated measures analysis of variance (ANOVA), as appropriate. Relations between continuous variables were analyzed with the Pearson product moment correlation coefficient. A two-tailed probability value of 0.05 was selected as the significance level.
RESULTS
Plasma analysis
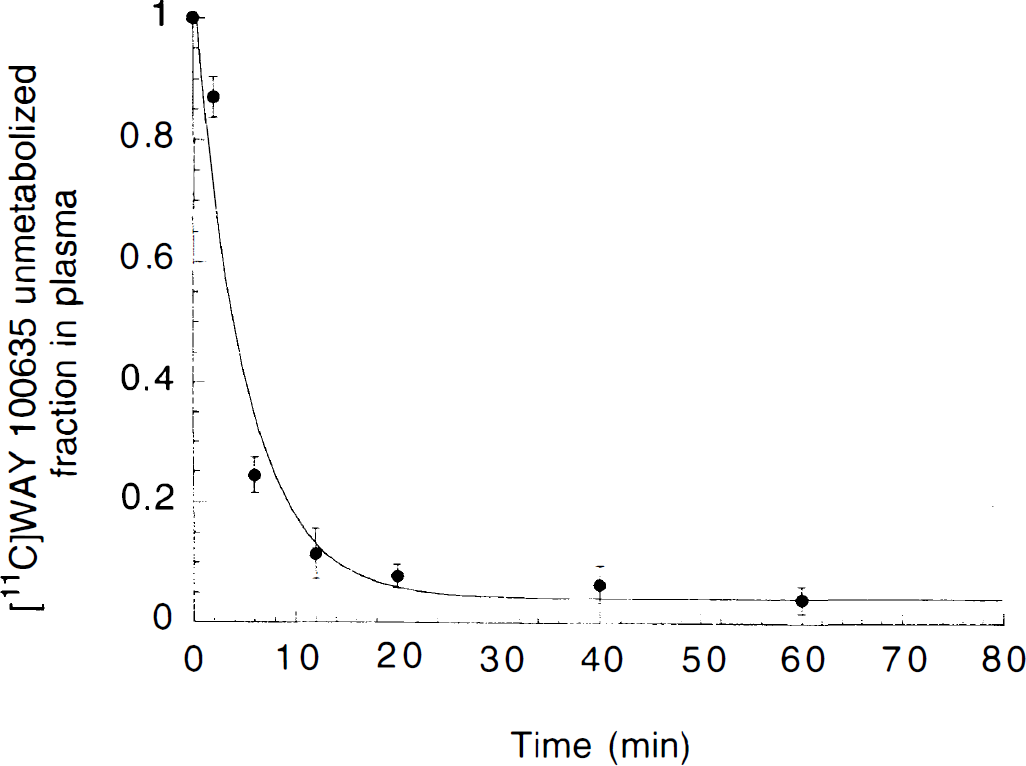
Fraction of plasma activity associated with unmetabolized [11C]WAY 100635 (% total) after [11C]WAY 100635 injection in humans. Each point is the average ± SD of 10 measurements (5 subjects studied twice). The solid line represents the sum of one exponential and a constant.
For reversible ligands, the terminal washout rate from a region of reference will tend toward the terminal rate of decrease of the unmetabolized [11C]WAY 100635 in the plasma (Carson et al., 1993). Taking advantage of this property, cerebellum and total plasma terminal half-lives were compared to determine the most appropriate method to fit the unmetabolized [11C]WAY 100635 fraction (Abi-Dargham et al., 2000). The cerebellum time-activity curves were fit to one exponential from 20 to 120 minutes, and the exponent (λcer) was −0.024 ± 0.009 min−1 (n = 10), corresponding to a terminal half-life of 31 ± 10 minutes. Similarly, the total plasma (unmetabolized [11C]WAY 100635 plus metabolites) time-activity curves were fit to one exponential over the same interval (20 to 120 minutes), and returned an exponent (λtot) of −0.024 ± 0.003 min−1 (n = 10), corresponding to a terminal half-life of 28 ± 3 minutes. No significant differences were observed between λcer and λtot (repeated measures ANOVA, P = 0.90). Together, these data suggest that over the time of the study, the terminal exponent of the unmetabolized [11C]WAY 100635 fraction curve (λpar) was very low, and that the unmetabolized [11C]WAY 100635 fraction curve could be interpolated over the time of the study by the sum of one exponential and a constant. This function was used to fit the unmetabolized [11C]WAY 100635 fraction value in each subject. The mean value of the constant term was 0.035 ± 0.021. This constant term was significantly different between subjects (ICC = 0.61).
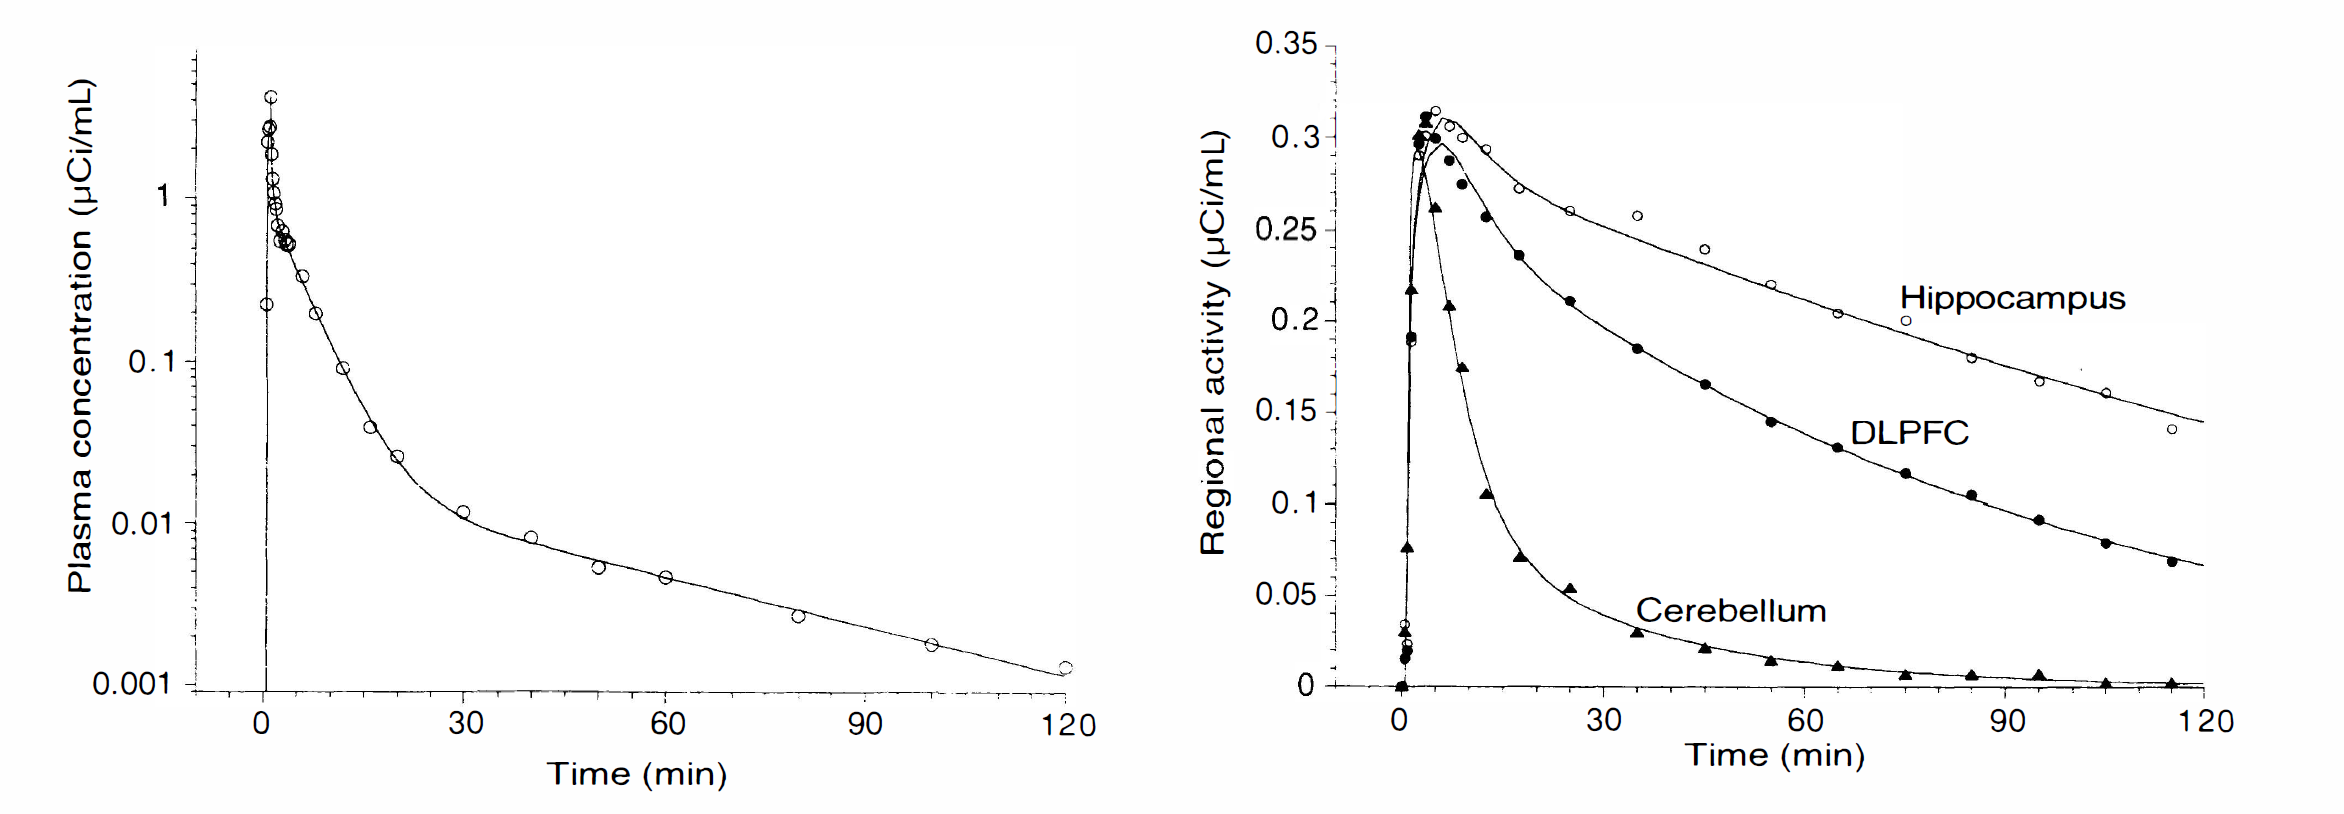
Plasma (left) and brain (right) [11C]WAY 100635 time-activity curves measured after injection of 12.8 mCi in a human volunteer. Plasma: points are measured values of unmetabolized [11C]WAY 100635; line represents the three exponential function fit to the data. Brain: regional activities in the cerebellum (triangles), dorsolateral prefrontal cortex (closed circles) and hippocampus (open circles). Points are measured values; lines are values fitted to a three compartment constrained model.
Brain uptake
Activity concentrated in neocortical and limbic areas, with the highest uptake in temporal cortex and medial temporal structures (Fig. 3). Very low activity levels were measured in the striatum, thalamus, and cerebellum. An activity concentration was also visualized in midbrain and pons at the level of the floor of the fourth ventricle, corresponding to the location of the dorsal and median raphe nuclei. Uptake peaked within 10 to 15 minutes and was followed by an appreciable washout. Overall, the brain uptake was low; for example, the cerebellum uptake was 0.0022 ± 0.0001 %ID/g at peak uptake (2 minutes postinjection), and only 0.0004 ± 0.0001 %ID/g at 30 minutes (values not corrected for vascular contribution). In the anterior cingulate, a region with high density of 5-HT1A receptors, the brain uptake was 0.0027 ± 0.0007 %ID/g at 2 minutes and 0.0016 ± 0.0005 %ID/g at 30 minutes. Assuming a 5% blood volume in the ROI, the contribution of the intravascular activity to the total cerebellar activity was about 20% throughout the scan.
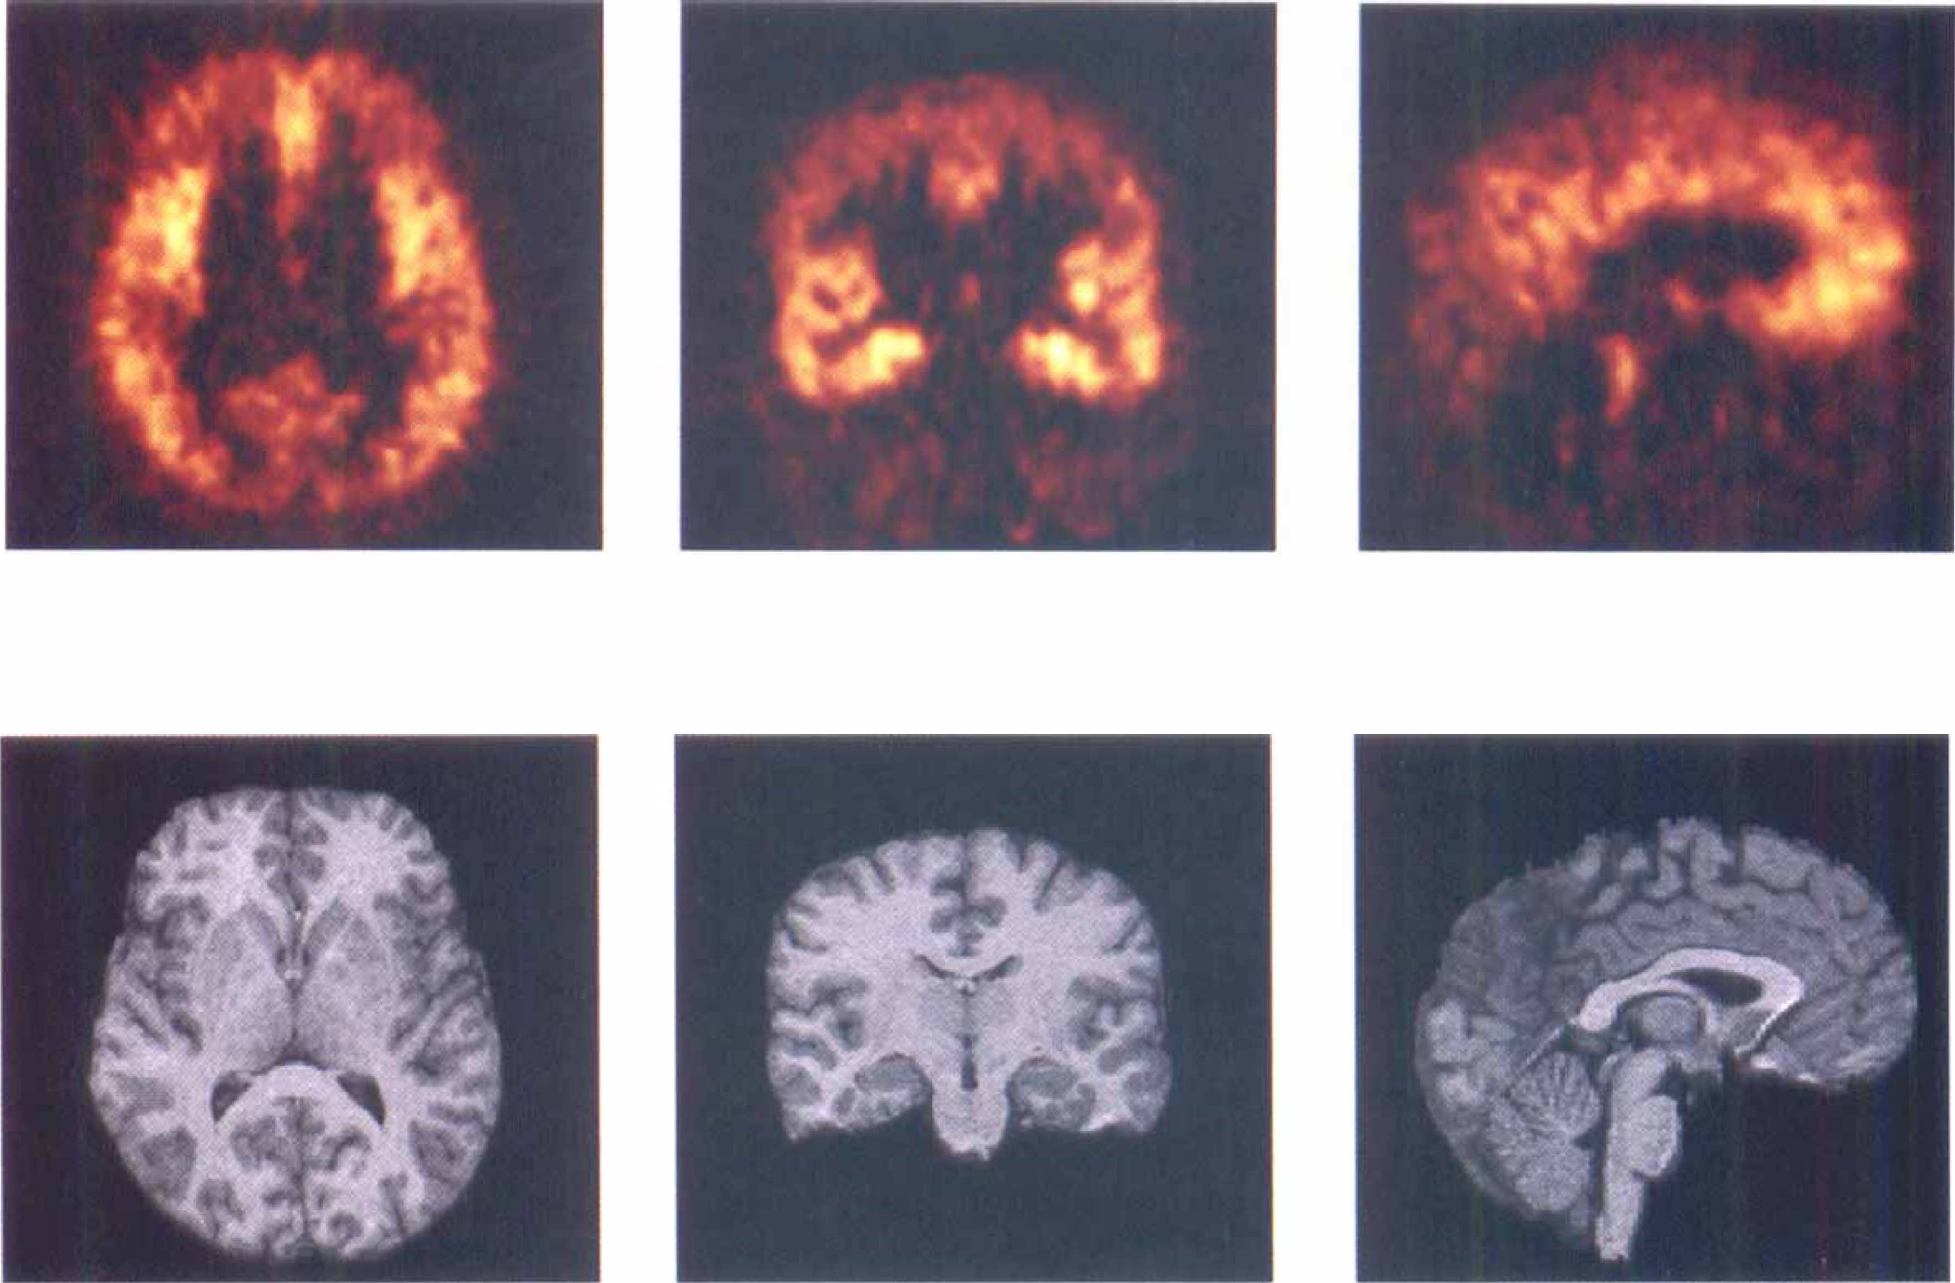
Brain distribution of [11C]WAY 100635 in a human volunteer. (upper row) PET: Transaxial, coronal, and sagittal views acquired over 60 minutes and starting 40 minutes after the injection of 12 mCi of [11C]WAY 100635 in a 30-year-old male. (lower row) MRI: SPGR acquisitions in the corresponding planes. Activity concentrated in neocortical and limbic areas with very low activity in the striatum, thalamus, and cerebellum. This distribution corresponds to the anatomical distribution of the serotonin 5HT1A receptor. The coronal section is at the level of the anterior hippocampus. The sagittal section was taken at midline to display activity corresponding to the 5HT1A somatodendritic receptors in the dorsal raphe nuclei in the pons, at the level of the floor of the 4th ventricle.
Activity ratios between receptor rich regions and the cerebellum were high (for example, 7.52 ± 1.9 in the anterior cingulate and 7.76 ± 3.26 in the hippocampus during the 30- to 60-minute interval).
Kinetic analysis with arterial input function
Distribution volumes of [11C]WAY 100635 derived by the unconstrained 3 compartment model with arterial input function
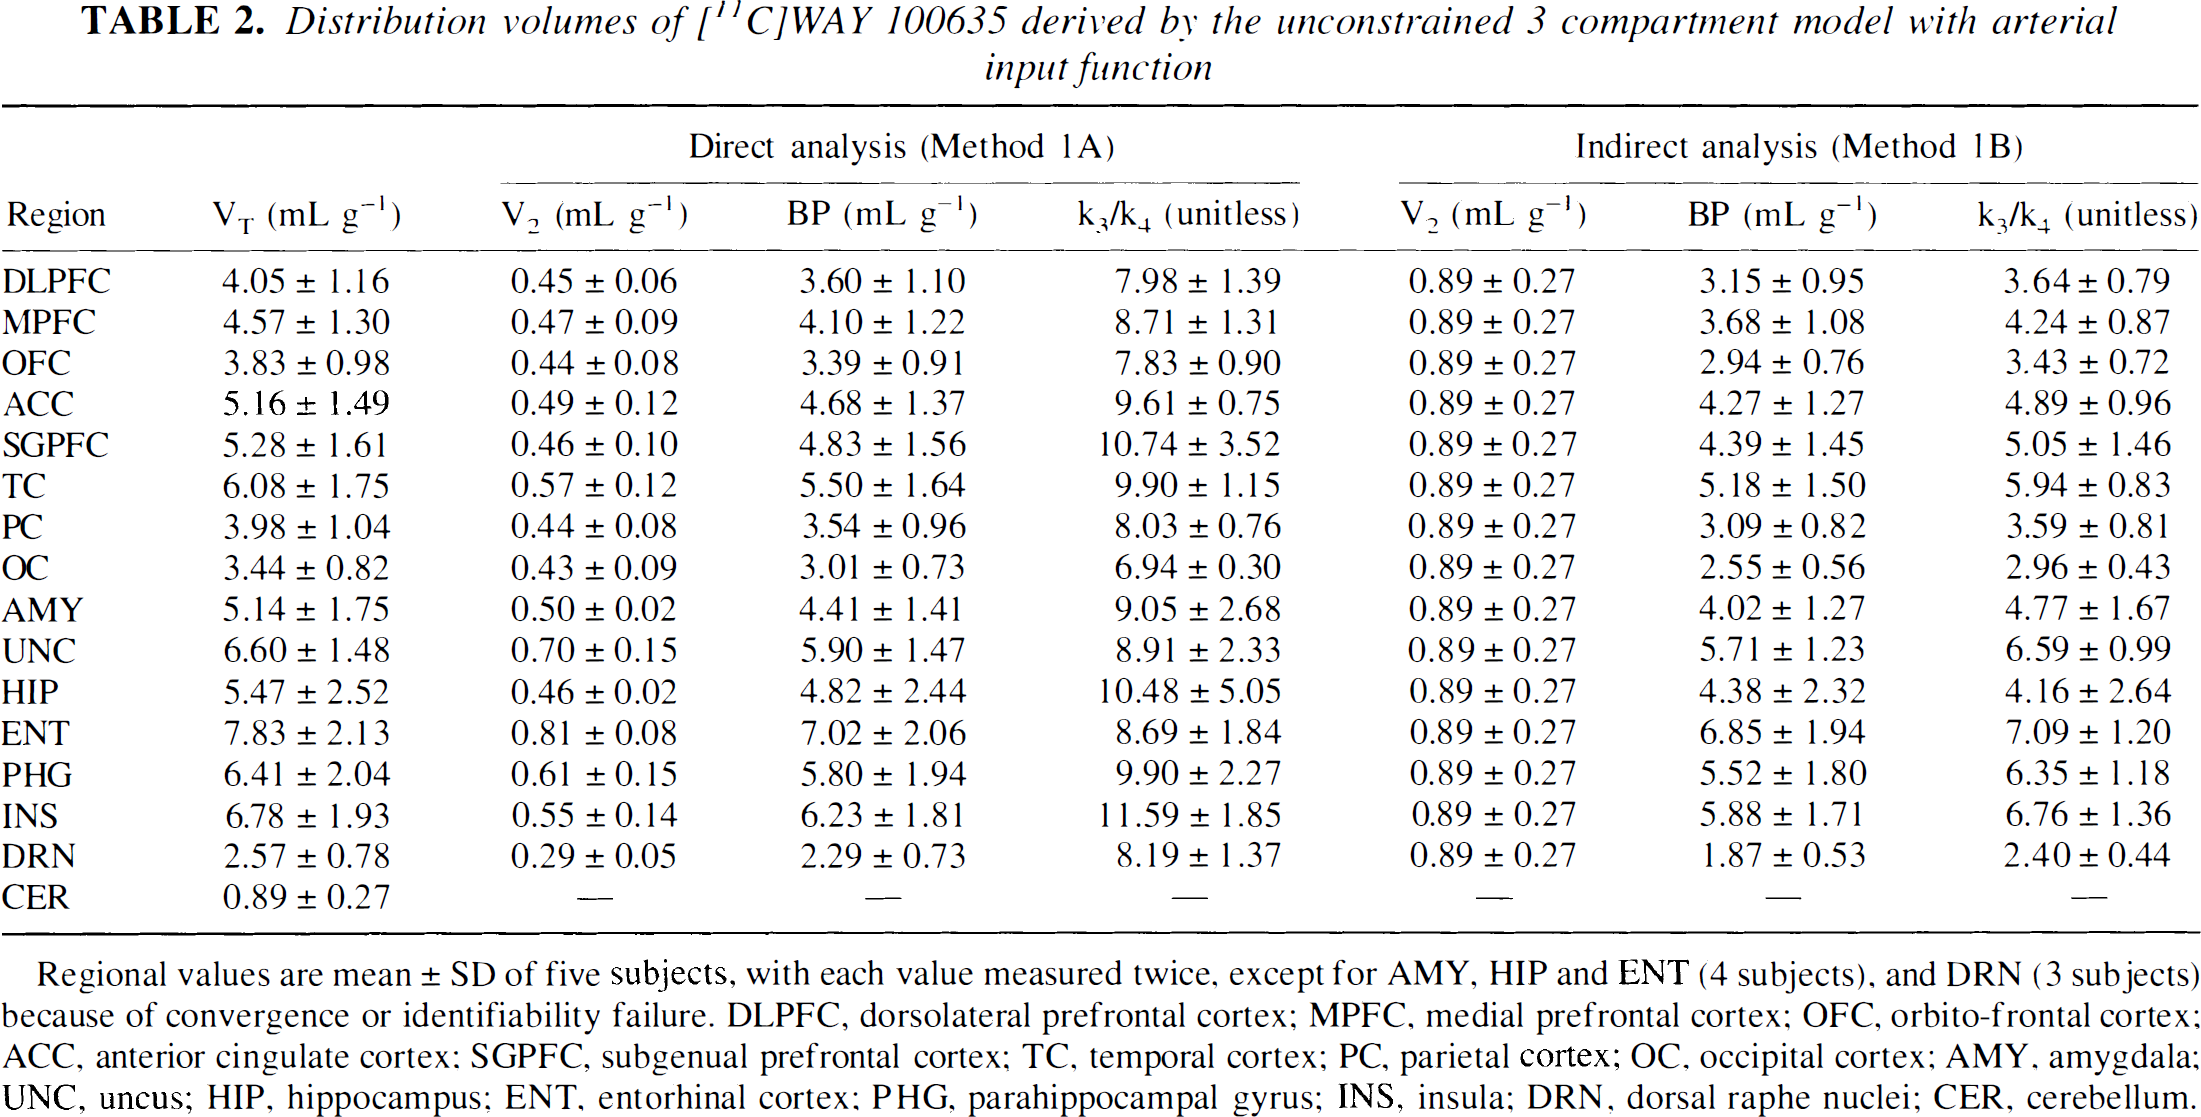
Regional values are mean ± SD of five subjects, with each value measured twice, except for AMY, HIP and ENT (4 subjects), and DRN (3 subjects) because of convergence or identifiability failure. DLPFC, dorsolateral prefrontal cortex; MPFC, medial prefrontal cortex; OFC, orbito-frontal cortex; ACC, anterior cingulate cortex; SGPFC, subgenual prefrontal cortex; TC, temporal cortex; PC, parietal cortex; OC, occipital cortex; AMY, amygdala; UNC, uncus; HIP, hippocampus; ENT, entorhinal cortex; PHG, parahippocampal gyrus; INS, insula; DRN, dorsal raphe nuclei; CER, cerebellum.
This error had little impact on the estimation of BP. BP by Method 1A was 10 ± 7% higher than BP by Method 1B, and this difference was not significant (repeated measures ANOVA, P = 0.09). In contrast, this error induced a marked difference in the estimates of k3/k4 by Methods 1A and 1B, k3/k4 by Method 1A was 205 ± 48% higher than k3/k4 by Method 1B (repeated measures ANOVA, P < 0.001). The difference in impact of V2 error on BP and k3/k4 derived from the large difference between [11C]WAY 100635 specific and nondisplaceable compartments and because V2 appears in the denominator calculation of k3/k4, whereas it appears as a subtraction term in the calculation of BP.
From these considerations, it was concluded that Method 1A is not an appropriate method for receptor parameters estimations, and that individual rate constants derived from the unconstrained fit had poor physiologic plausibility. Thus, derivation of BP and k3/k4 from the unconstrained fit required the indirect approach (Method 1B).
Kinetic analysis of regional [11C]WAY 100635 uptake in human brain (3CM constrained, Method 1C)
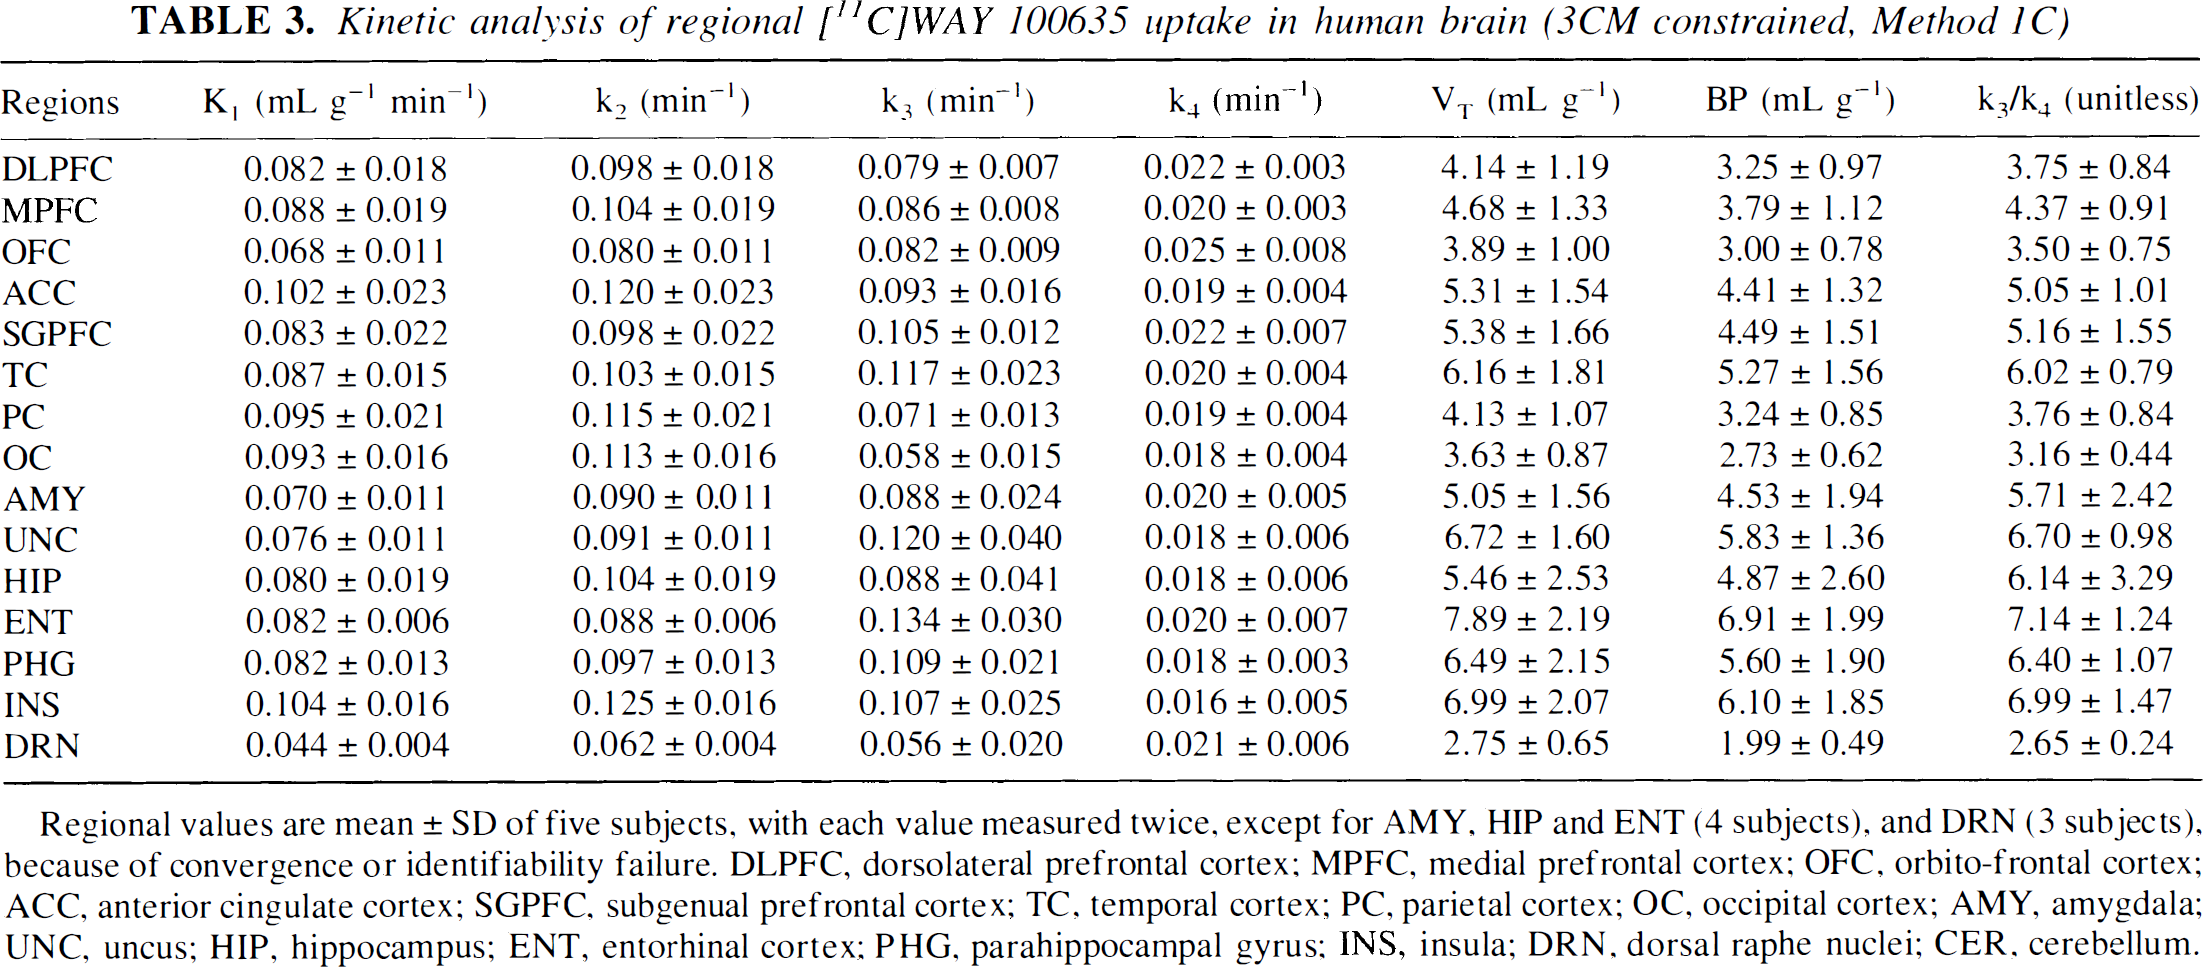
Regional values are mean ± SD of five subjects, with each value measured twice, except for AMY, HIP and ENT (4 subjects), and DRN (3 subjects), because of convergence or identifiability failure. DLPFC, dorsolateral prefrontal cortex; MPFC, medial prefrontal cortex; OFC, orbito-frontal cortex; ACC, anterior cingulate cortex; SGPFC, subgenual prefrontal cortex; TC, temporal cortex; PC, parietal cortex; OC, occipital cortex; AMY, amygdala; UNC, uncus; HIP, hippocampus; ENT, entorhinal cortex; PHG, parahippocampal gyrus; INS, insula; DRN, dorsal raphe nuclei; CER, cerebellum.
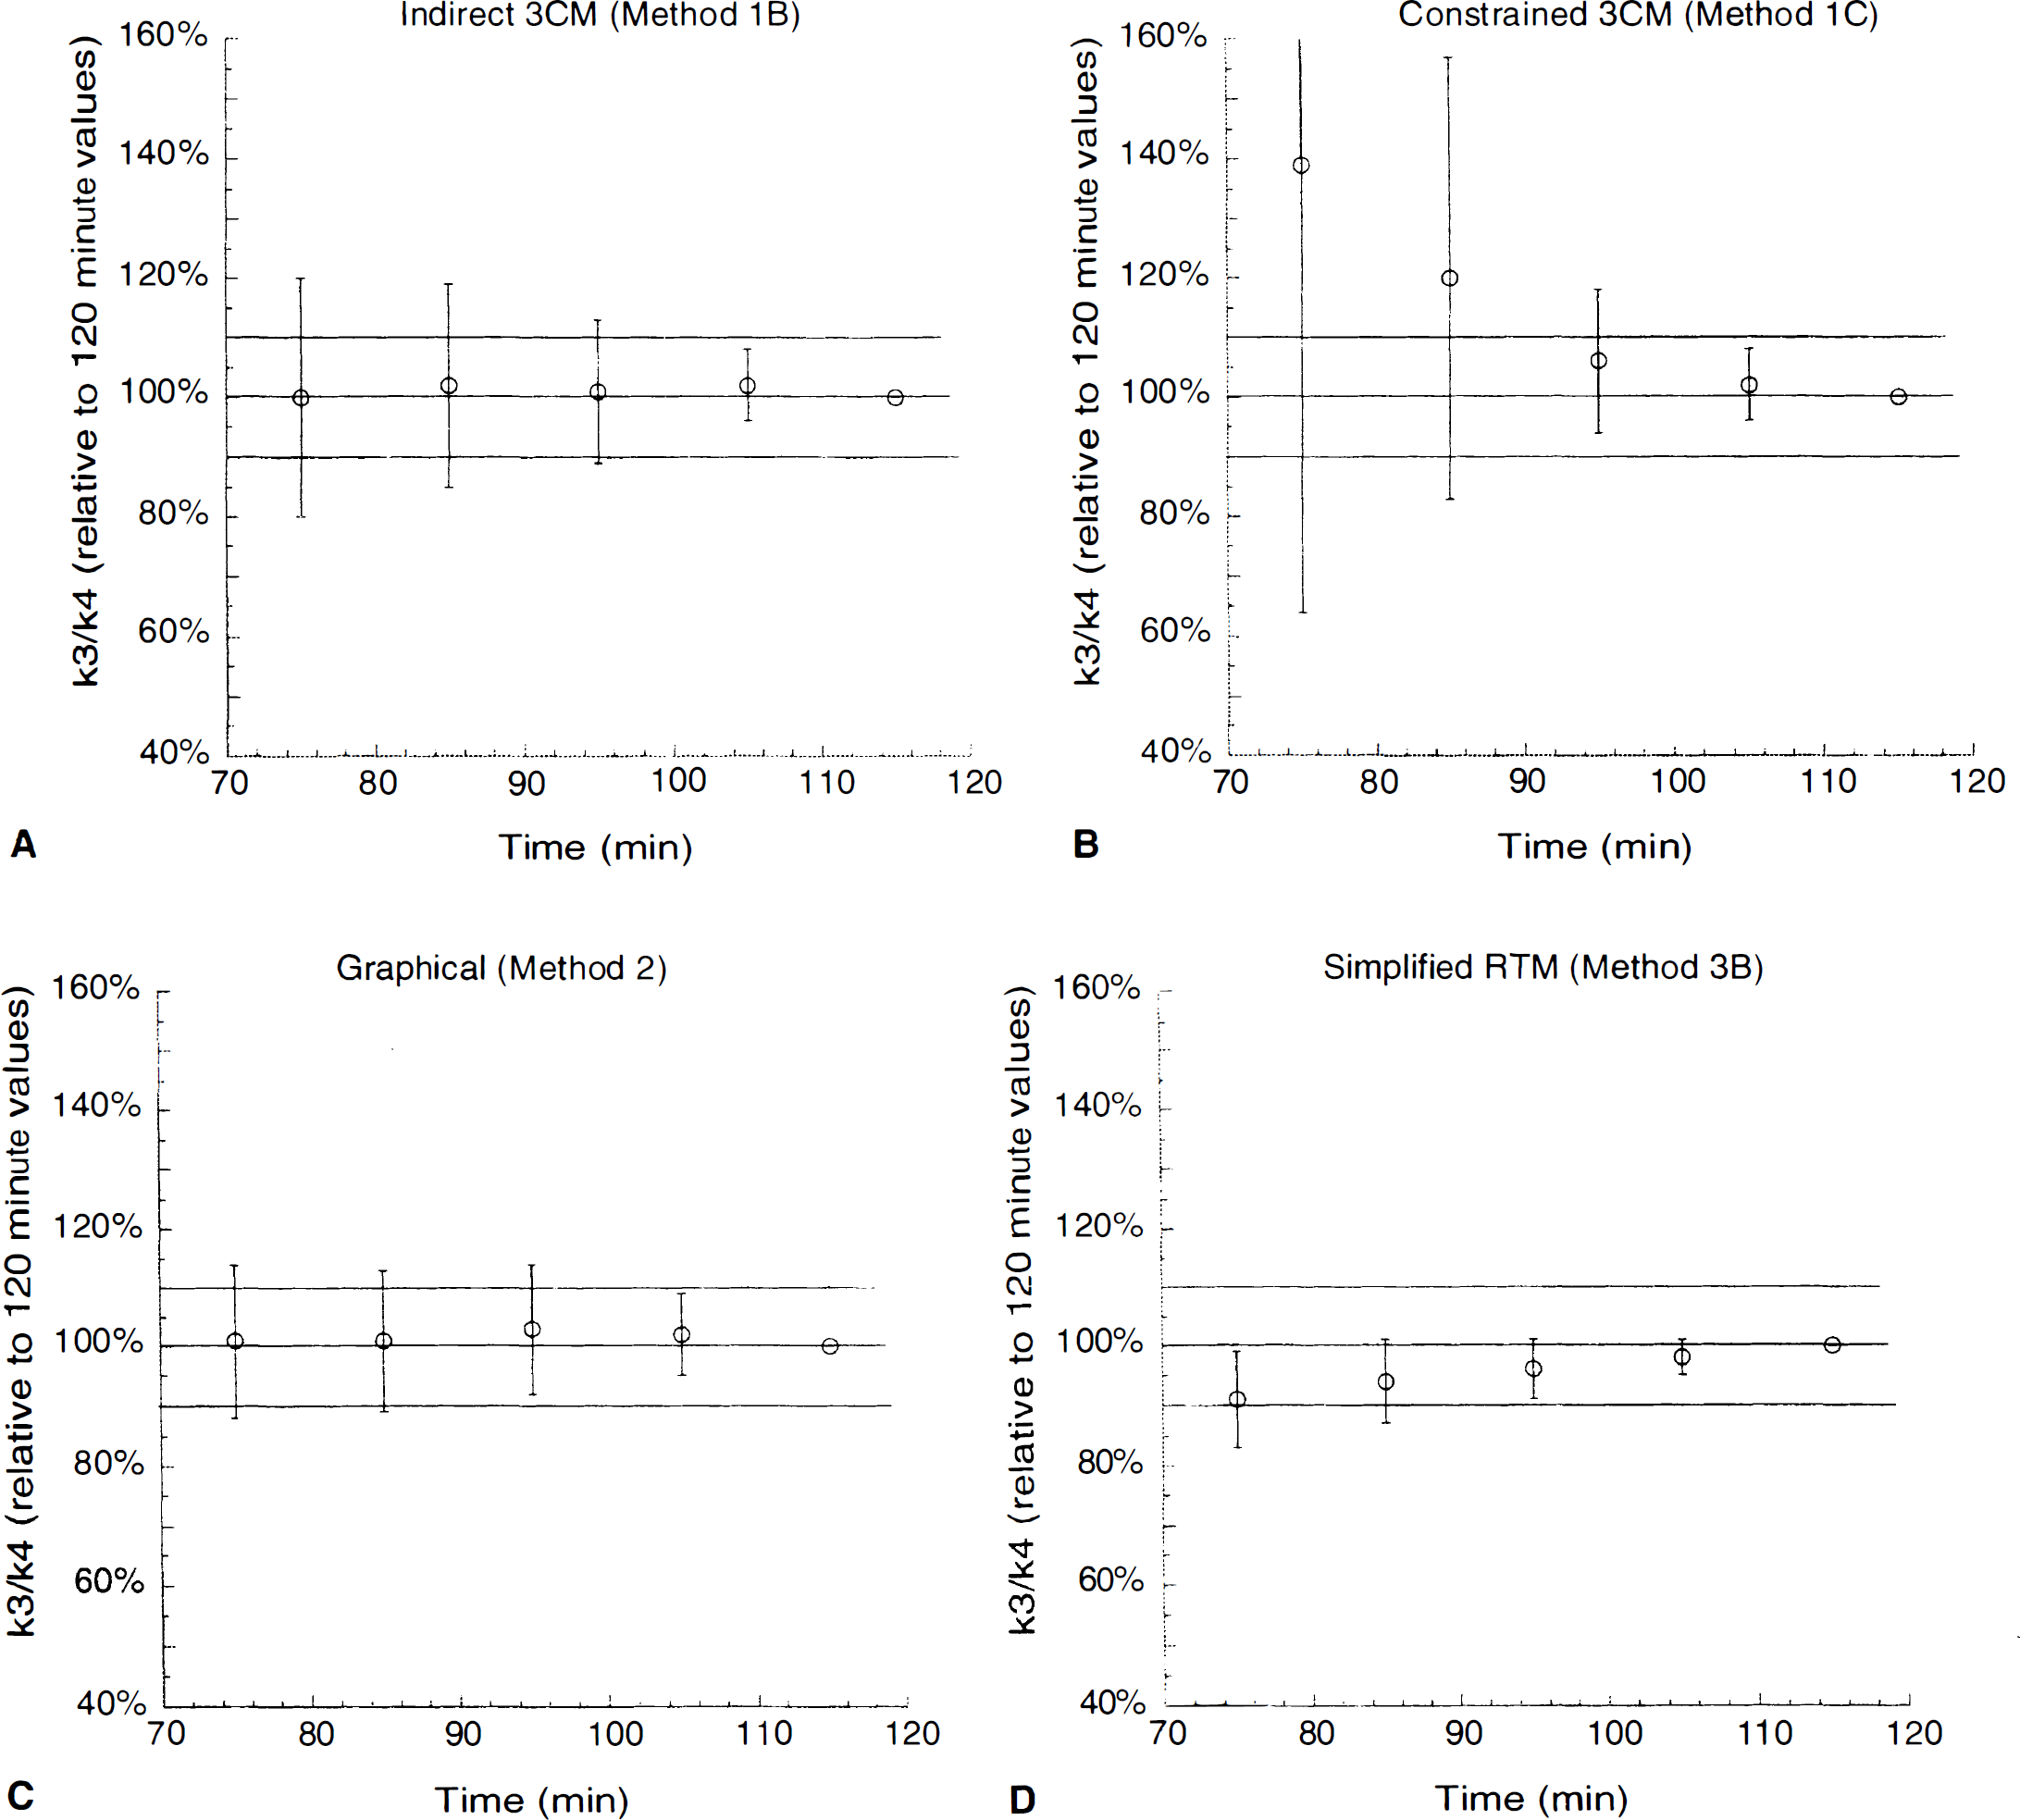
Relationship between duration of data collection and derivation of k3/k4 (aggregate of all regions) by the unconstrained indirect kinetic method (Method 1B, panel A), the constrained kinetic method (Method 1C, panel B), the graphical method (Method 2, panel C), and the simplified reference tissue method (Method 3B, panel D). For each region (n = 15) and each experiment (n = 10), k3/k4 values derived with shorter data sets were expressed as a percentage of the reference value defined as the value measured with the whole data set (120 minutes of data collection). Each time point represents the mean ± SD of all regions in all subjects. Deviations from 100% indicate the bias associated with shorter data sets, whereas the SD indicates the error associated with shorter data sets. Solid lines identify the desired mean (100%) and the ± 10% boundaries. The graphs show no significant bias for Methods 1B and 2, but shorter data sets were associated with a bias towards over- and under-estimation of k3/k4 with Methods 1C and 3B, respectively. Methods also differed in the error terms, with Method 1C being associated with the larger errors followed by 1B, 2, and 3B.
Minimal scanning time (minutes) needed to derive stable estimates of BP and k3/k4
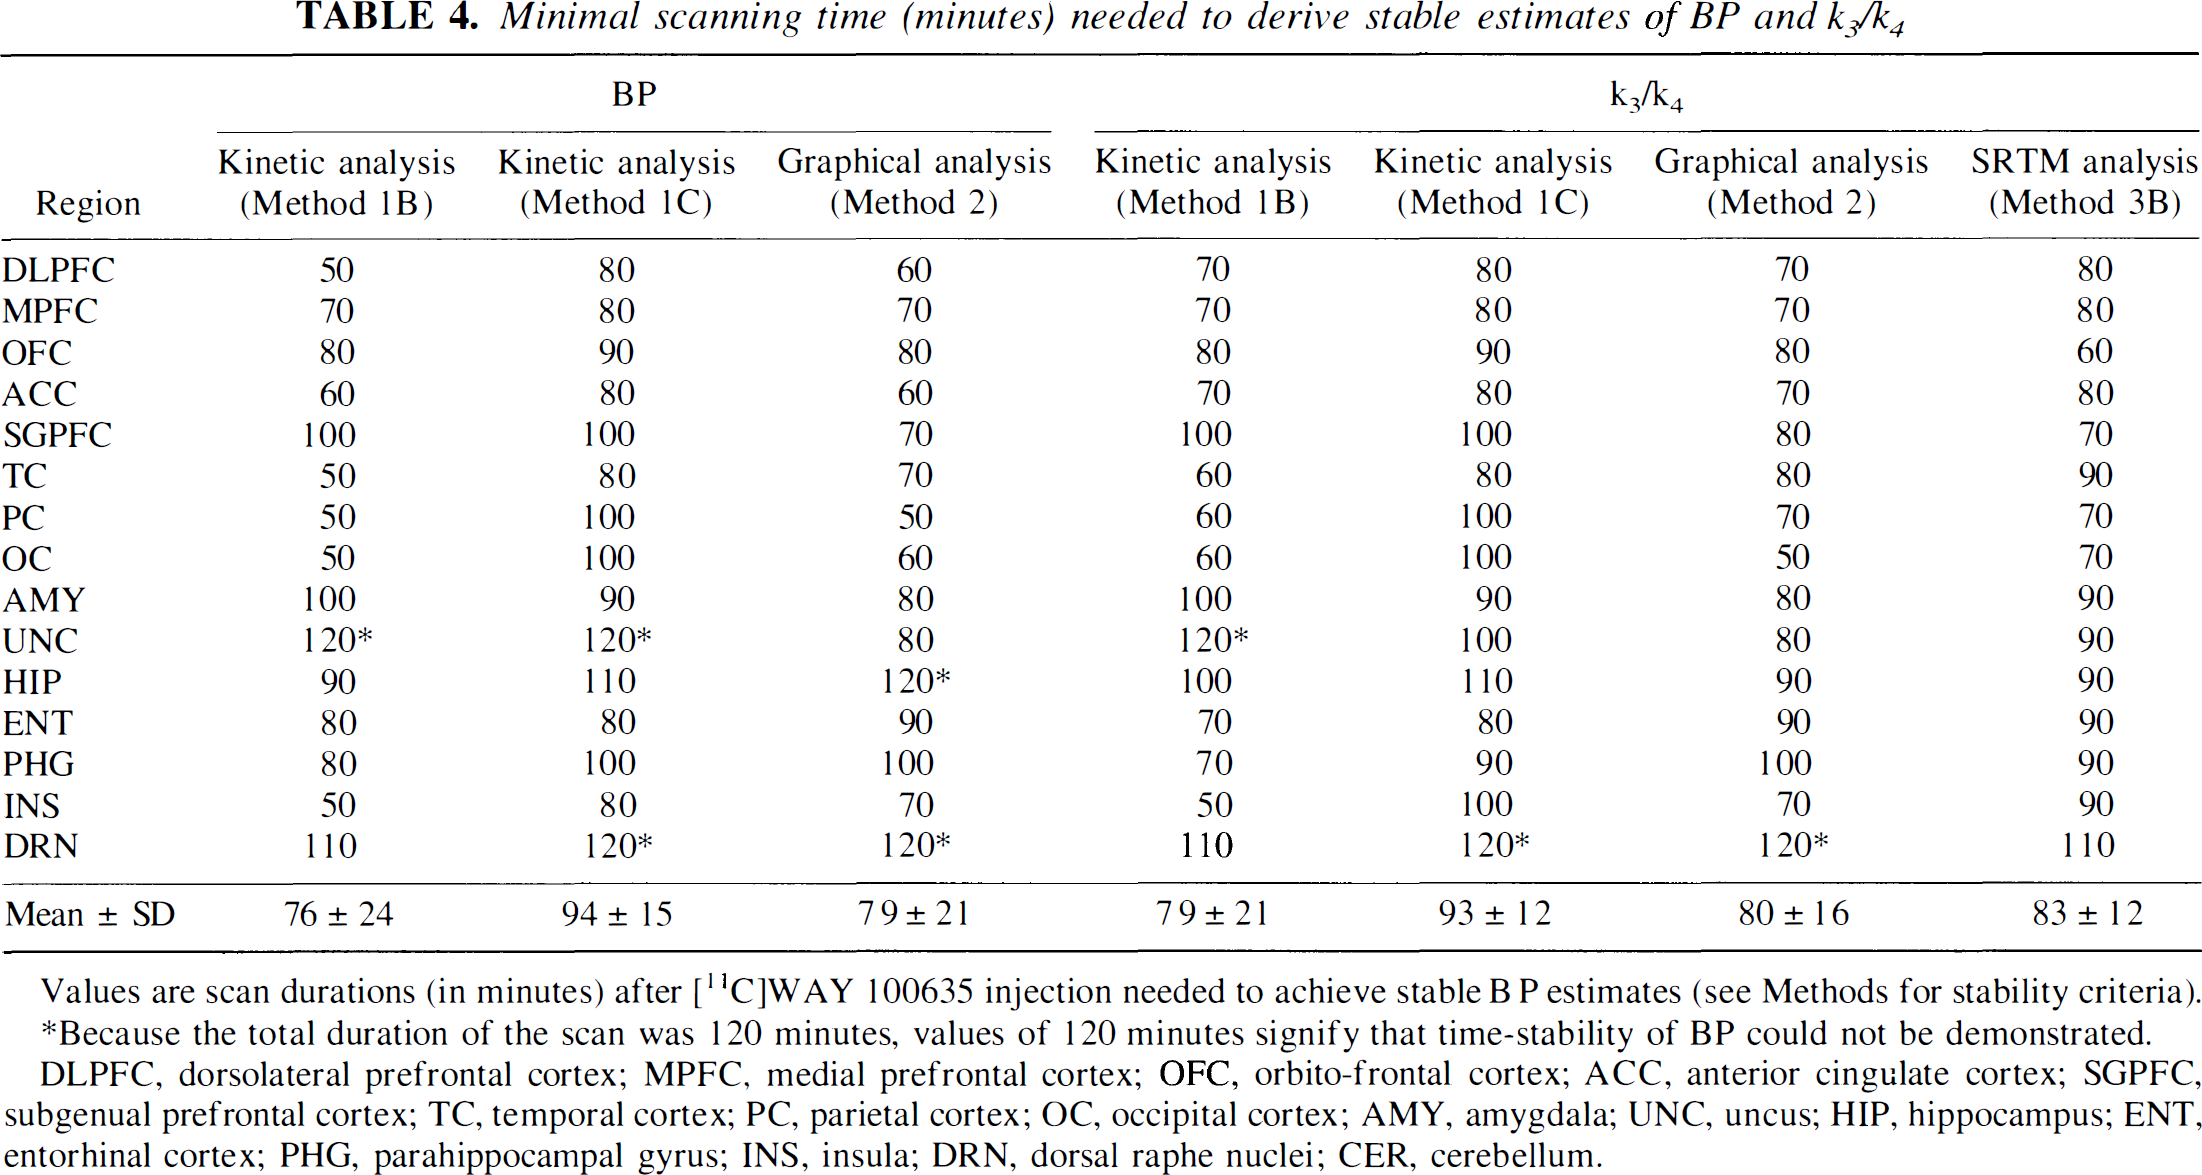
Values are scan durations (in minutes) after [11C]WAY 100635 injection needed to achieve stable B P estimates (see Methods for stability criteria).
Because the total duration of the scan was 120 minutes, values of 120 minutes signify that time-stability of BP could not be demonstrated.
DLPFC, dorsolateral prefrontal cortex; MPFC, medial prefrontal cortex; OFC, orbito-frontal cortex; ACC, anterior cingulate cortex; SGPFC, subgenual prefrontal cortex; TC, temporal cortex; PC, parietal cortex; OC, occipital cortex; AMY, amygdala; UNC, uncus; HIP, hippocampus; ENT, entorhinal cortex; PHG, parahippocampal gyrus; INS, insula; DRN, dorsal raphe nuclei; CER, cerebellum.
Reproducibility of [11C]WAY 100635 BP and k3/k4 in human brain: kinetic analysis with arterial input function (Method 1B)
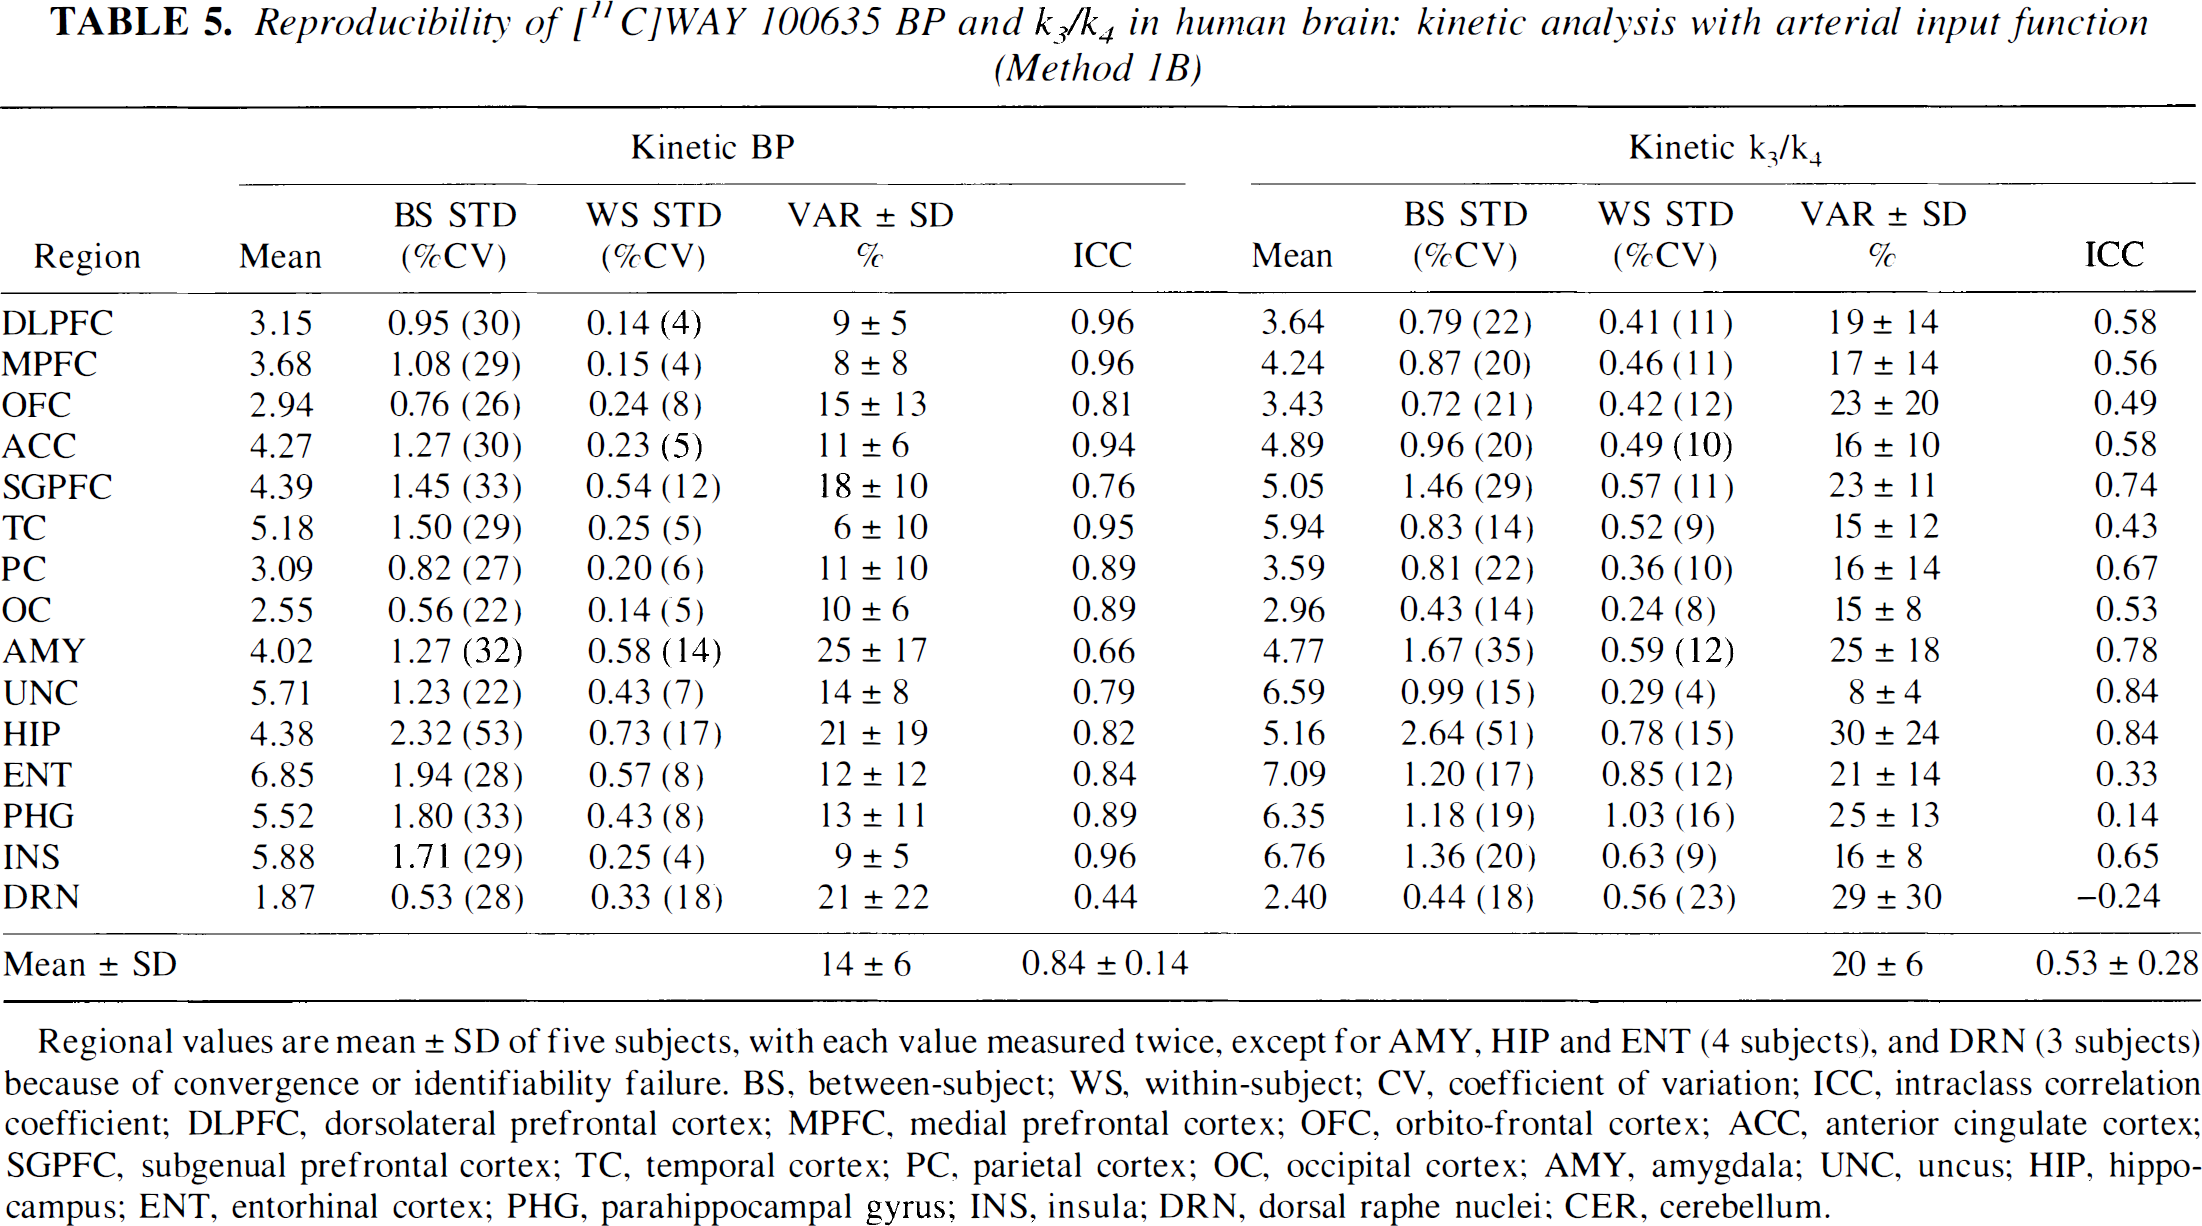
Regional values are mean ± SD of five subjects, with each value measured twice, except for AMY, HIP and ENT (4 subjects), and DRN (3 subjects) because of convergence or identifiability failure. BS, between-subject; WS, within-subject; CV, coefficient of variation; ICC, intraclass correlation coefficient; DLPFC, dorsolateral prefrontal cortex; MPFC, medial prefrontal cortex; OFC, orbito-frontal cortex; ACC, anterior cingulate cortex; SGPFC, subgenual prefrontal cortex; TC, temporal cortex; PC, parietal cortex; OC, occipital cortex; AMY, amygdala; UNC, uncus; HIP, hippocampus; ENT, entorhinal cortex; PHG, parahippocampal gyrus; INS, insula; DRN, dorsal raphe nuclei; CER, cerebellum.
Graphical analysis
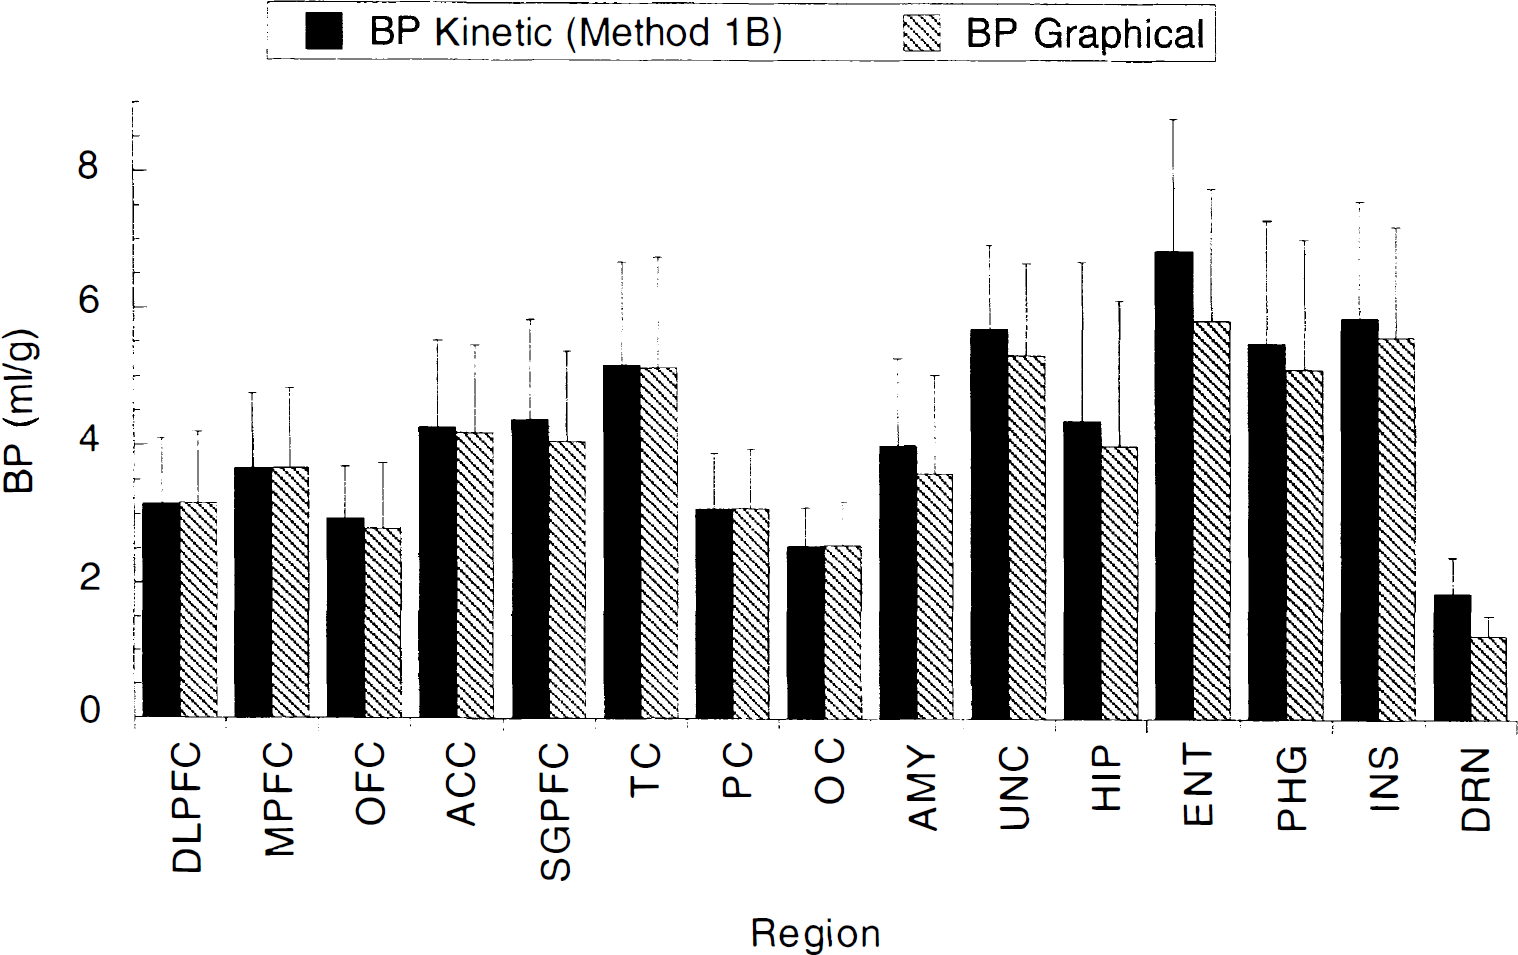
[11C]WAY 100635 BP in 15 regions of the human brain, derived by kinetic analysis [3CM model unconstrained, indirect, (Method 1B) and graphical analysis (Method 2), both methods using the arterial input function. Graphical BP values were slightly, but significantly, less than the kinetic 1C method BP values by an average of 5 ± 9% (repeated measures ANOVA, P < 0.001). Because this underestimation is caused by a noise dependent bias, this underestimation is noted in small noisy regions such as DRN or ENT, and not in large regions such as DLPFC. Regional values are the mean ± SD of five subjects, with each value measured twice, except for AMY, HIP, ENT (4 subjects), and DRN (3 subjects) because of convergence or identifiability failure. DLPFC, dorsolateral prefrontal cortex; MPFC, medial prefrontal cortex; OFC, orbito-frontal cortex; ACC, anterior cingulate cortex; SGPFC, subgenual prefrontal cortex; TC, temporal cortex; PC, parietal cortex; OC, occipital cortex; AMY, amygdala; UNC, uncus; HIP, hippocampus; ENT, entorhinal cortex; PHG, parahippocampal gyrus; INS, insula; DRN, dorsal raphe nuclei; CER, cerebellum.
Reproducibility of [11C]WAY 100635 BP and k3/k4 in human brain: kinetic analysis with arterial input function (Method 1B)
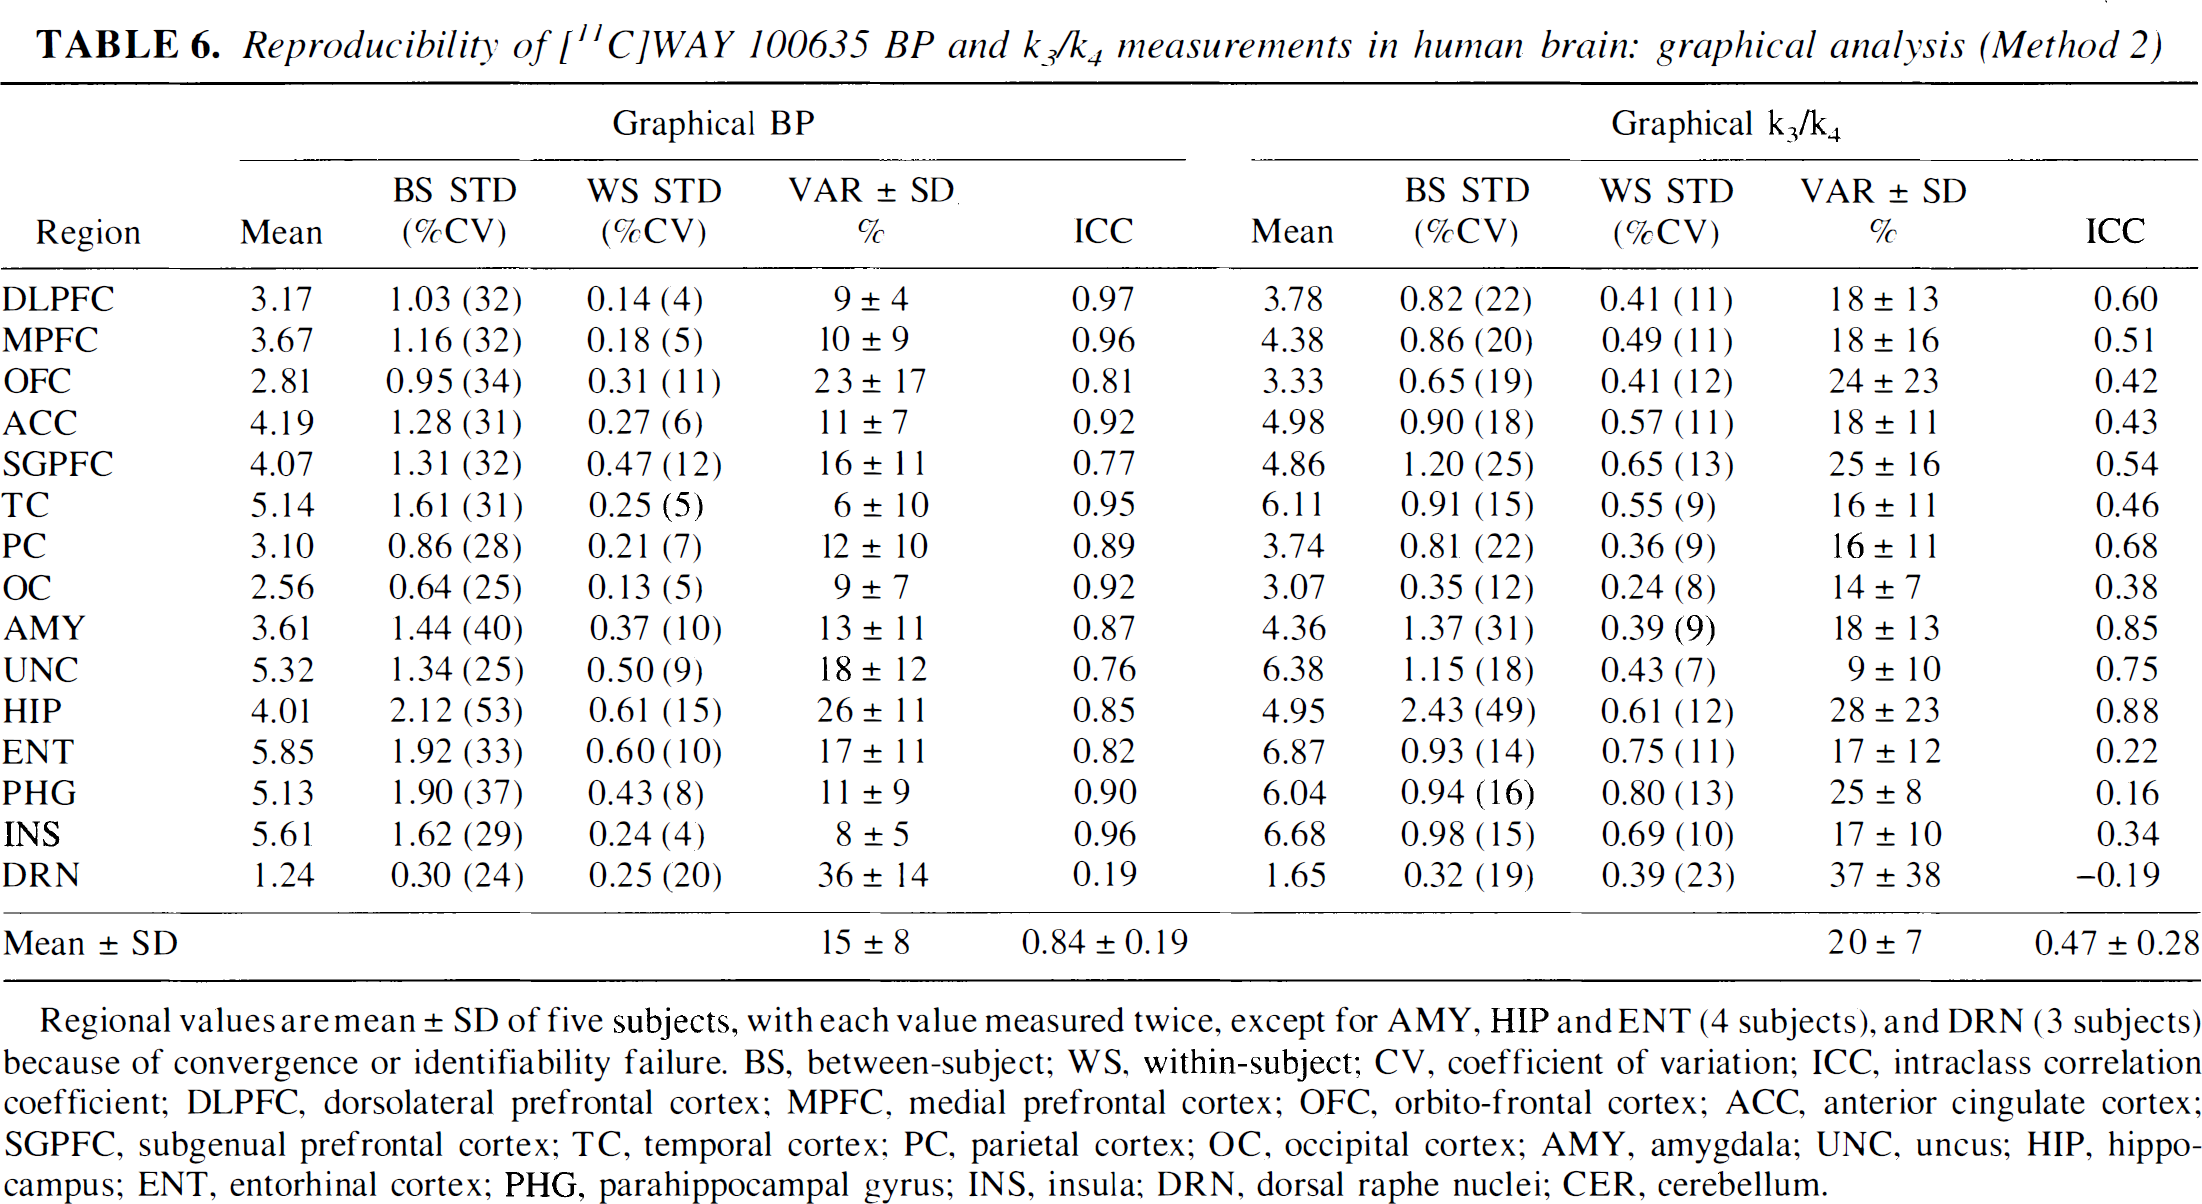
Regional values are mean ± SD of five subjects, with each value measured twice, except for AMY, HIP and ENT (4 subjects), and DRN (3 subjects) because of convergence or identifiability failure. BS, between-subject; WS, within-subject; CV, coefficient of variation; ICC, intraclass correlation coefficient; DLPFC, dorsolateral prefrontal cortex; MPFC, medial prefrontal cortex; OFC, orbito-frontal cortex; ACC, anterior cingulate cortex; SGPFC, subgenual prefrontal cortex; TC, temporal cortex; PC, parietal cortex; OC, occipital cortex; AMY, amygdala; UNC, uncus; HIP, hippocampus; ENT, entorhinal cortex; PHG, parahippocampal gyrus; INS, insula; DRN, dorsal raphe nuclei; CER, cerebellum.
Kinetic analysis with input function derived from region of reference
Regional values of k3/k4 derived by Method 3B are provided in Table 7. Regional k3/k4 values derived by Method 3B were well identified (error of 4.7 ± 4.9%) and highly correlated with k3/k4 values derived by the kinetic 1B Method (r2 = 0.95). However, Method 3B k3/k4 were significantly lower than kinetic 1B k3/k4 by an average of 17 ± 8% (repeated measures ANOVA, P < 0.001; Fig. 6). Figure 7 provides examples of fits of the anterior cingulate with Methods 1C and 3B. Despite the appropriate fits provided by both methods, the k3/k4 returned by Method 1C (7.35) was 28% more than the k3/k4 value returned by Method 3B (5.72).
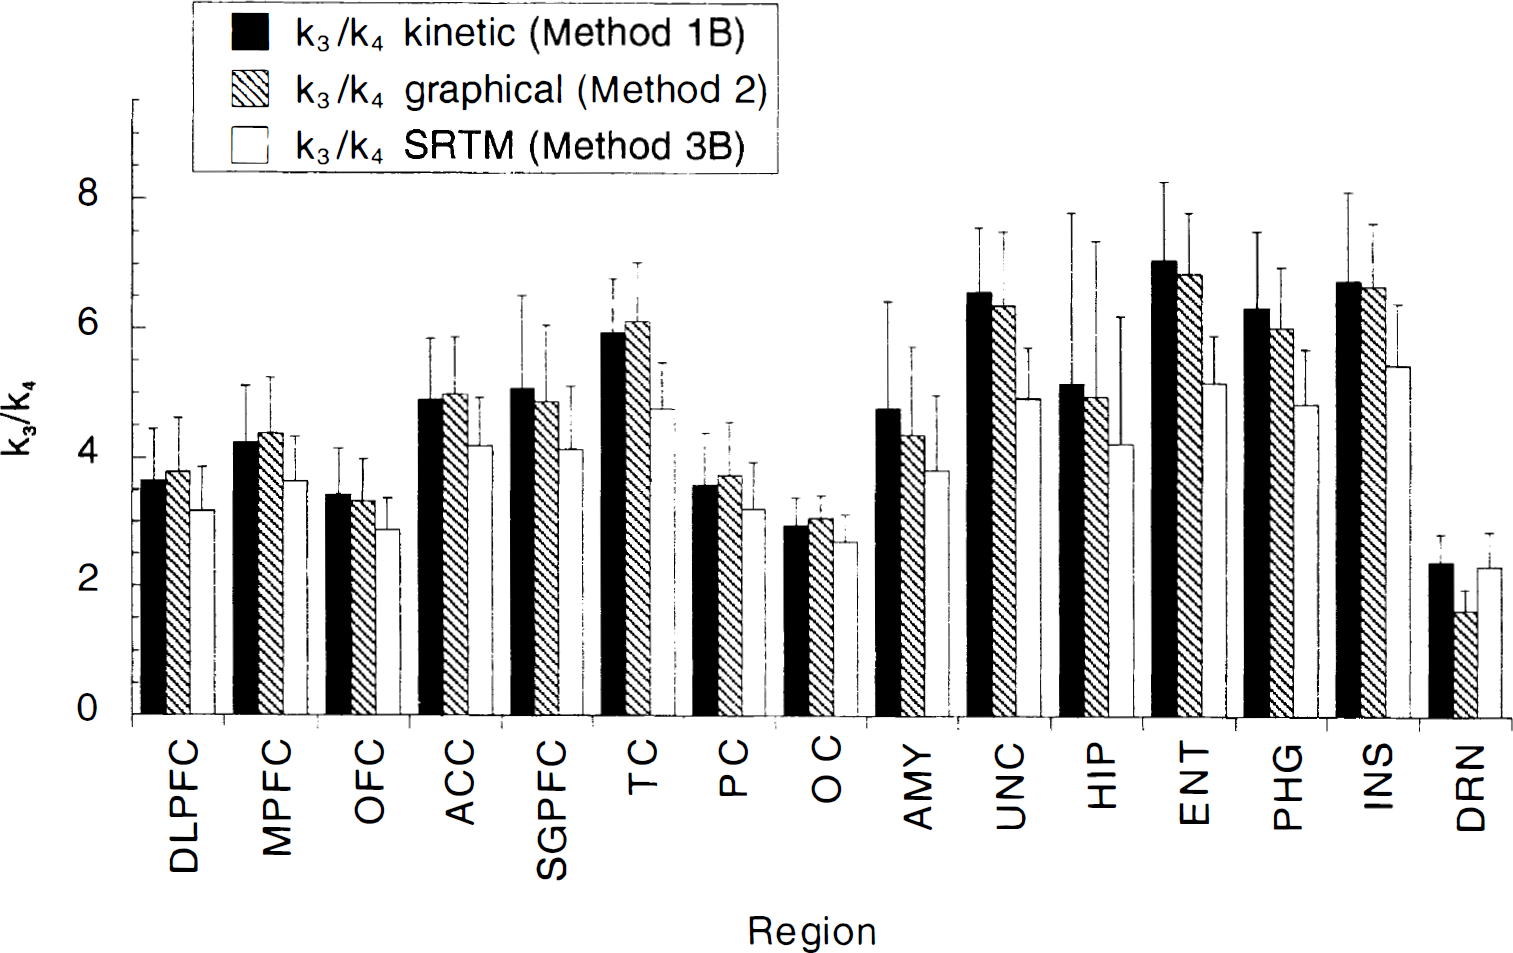
[11C]WAY 100635 k3/k4 in 15 regions of the human brain derived by kinetic analysis (3CM model, Method 1B), graphical analysis (Method 2), and simplified reference tissue model (SRTM, Method 3B). Graphical k3/k4 values were similar to kinetic 1C k3/k4 values except in small and noisy regions like the DRN, in which graphical k3/k4 was underestimated. SRTM k3/k4 values were significantly less than kinetic 1C k3/k4 values by an average of 17 ± 8%. Because this underestimation is more pronounced in regions with high receptor density and is noise independent, it is more pronounced in regions such as TC compared with regions such as DRN. See legend of Fig. 5 for abbreviations and number of subjects per regions.
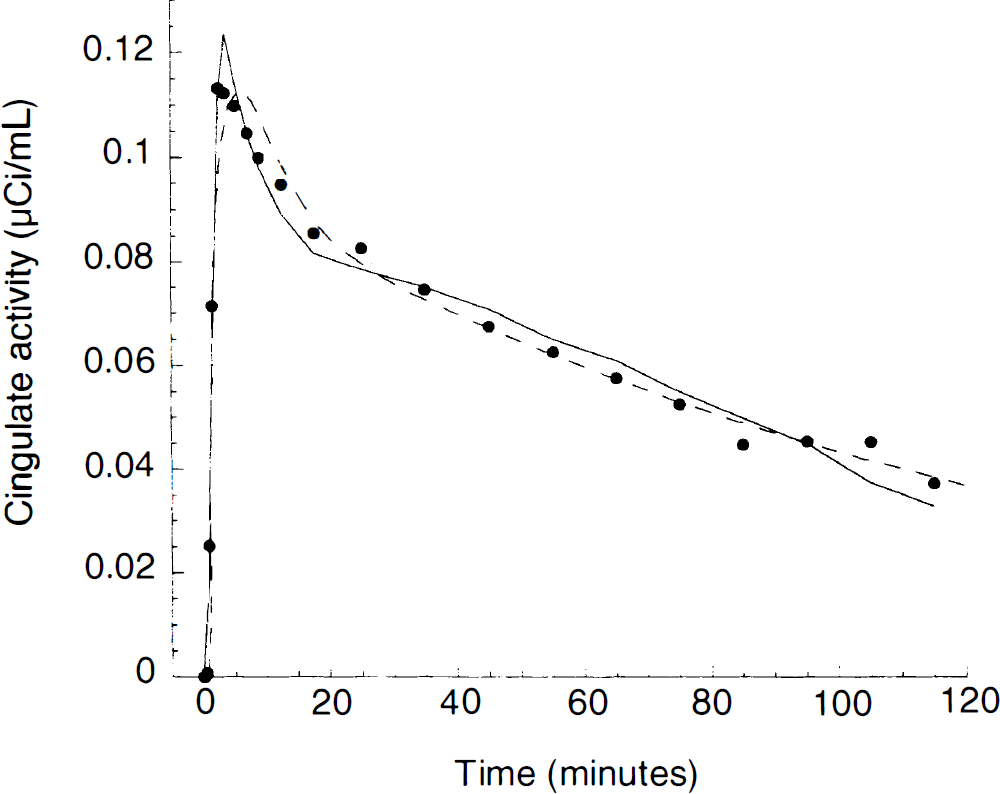
[11C]WAY 100635 activity in the anterior cingulate. Points are measured values, dotted line represents values fitted to a 3 compartment model using the arterial input function with K1/k2 constrained to cerebellum VT (Method 1C). Solid line represents values fitted to the simplified reference tissue (cerebellum) model (Method 3B). Although both methods provided appropriate fit to the data, the k3/k4 returned by Method 1C (7.35) was 28% higher than the k3/k4 value returned by Method 3C (5.72).
Reproducibility of [11C]WAY 100635 k3/k4 measurements in human brain: simplified reference tissue analysis (Method 3B)
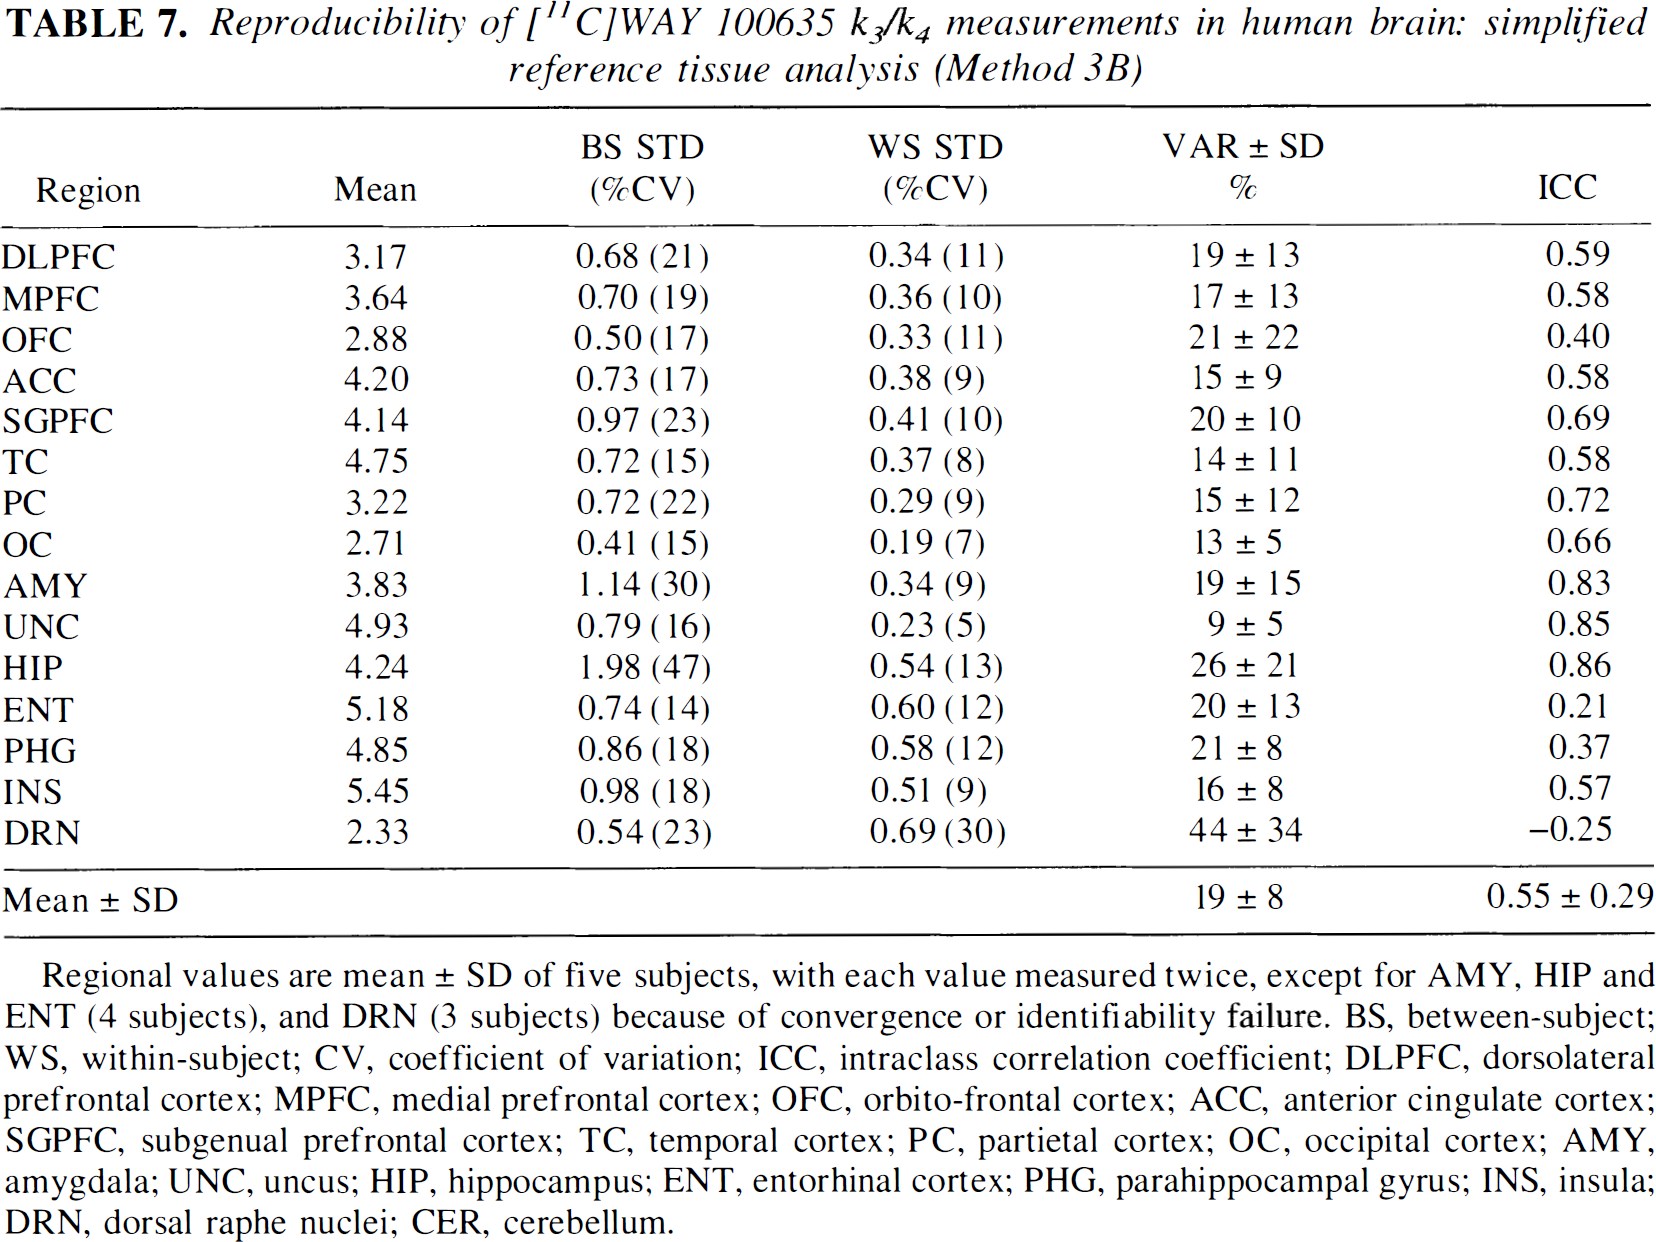
Regional values are mean ± SD of five subjects, with each value measured twice, except for AMY, HIP and ENT (4 subjects), and DRN (3 subjects) because of convergence or identifiability failure. BS, between-subject; WS, within-subject; CV, coefficient of variation; ICC, intraclass correlation coefficient; DLPFC, dorsolateral prefrontal cortex; MPFC, medial prefrontal cortex; OFC, orbito-frontal cortex; ACC, anterior cingulate cortex; SGPFC, subgenual prefrontal cortex; TC, temporal cortex; PC, partietal cortex; OC, occipital cortex; AMY, amygdala; UNC, uncus; HIP, hippocampus; ENT, entorhinal cortex; PHG, parahippocampal gyrus; INS, insula; DRN, dorsal raphe nuclei; CER, cerebellum.
The regression of Method 3B k3/k4 values to Method 1B k3/k4 values had an intercept of 0.65 and a slope of 0.68 (Fig. 8, left panel). The fact that the slope was different from unity and that the intercept was positive indicated that the SRTM method underestimates k3/k4 more in regions with high 5-HT1A receptor density compared with regions with low 5-HT1A density. This phenomenon was confirmed by plotting the underestimation of k3/k4 by SRTM relative to Method 1B as a function of the value of k3/k4 derived from Method 3B. This plot, presented in Fig. 8 (right panel), shows a scattered (r2 = 0.43), but significant (P < 0.001) relationship between the relative underestimation of k3/k4 by SRTM and k3/k4 returned by Method 1B. For example, the underestimation of k3/k4 by Method 3B relative to Method 1B was 10.1 ± 5.7% in parietal cortex (1B k3/k4 of 3.8 ± 0.8) and 26.6 ± 3.1% in ENT (1B k3/k4 of 7.1 ± 1.2).
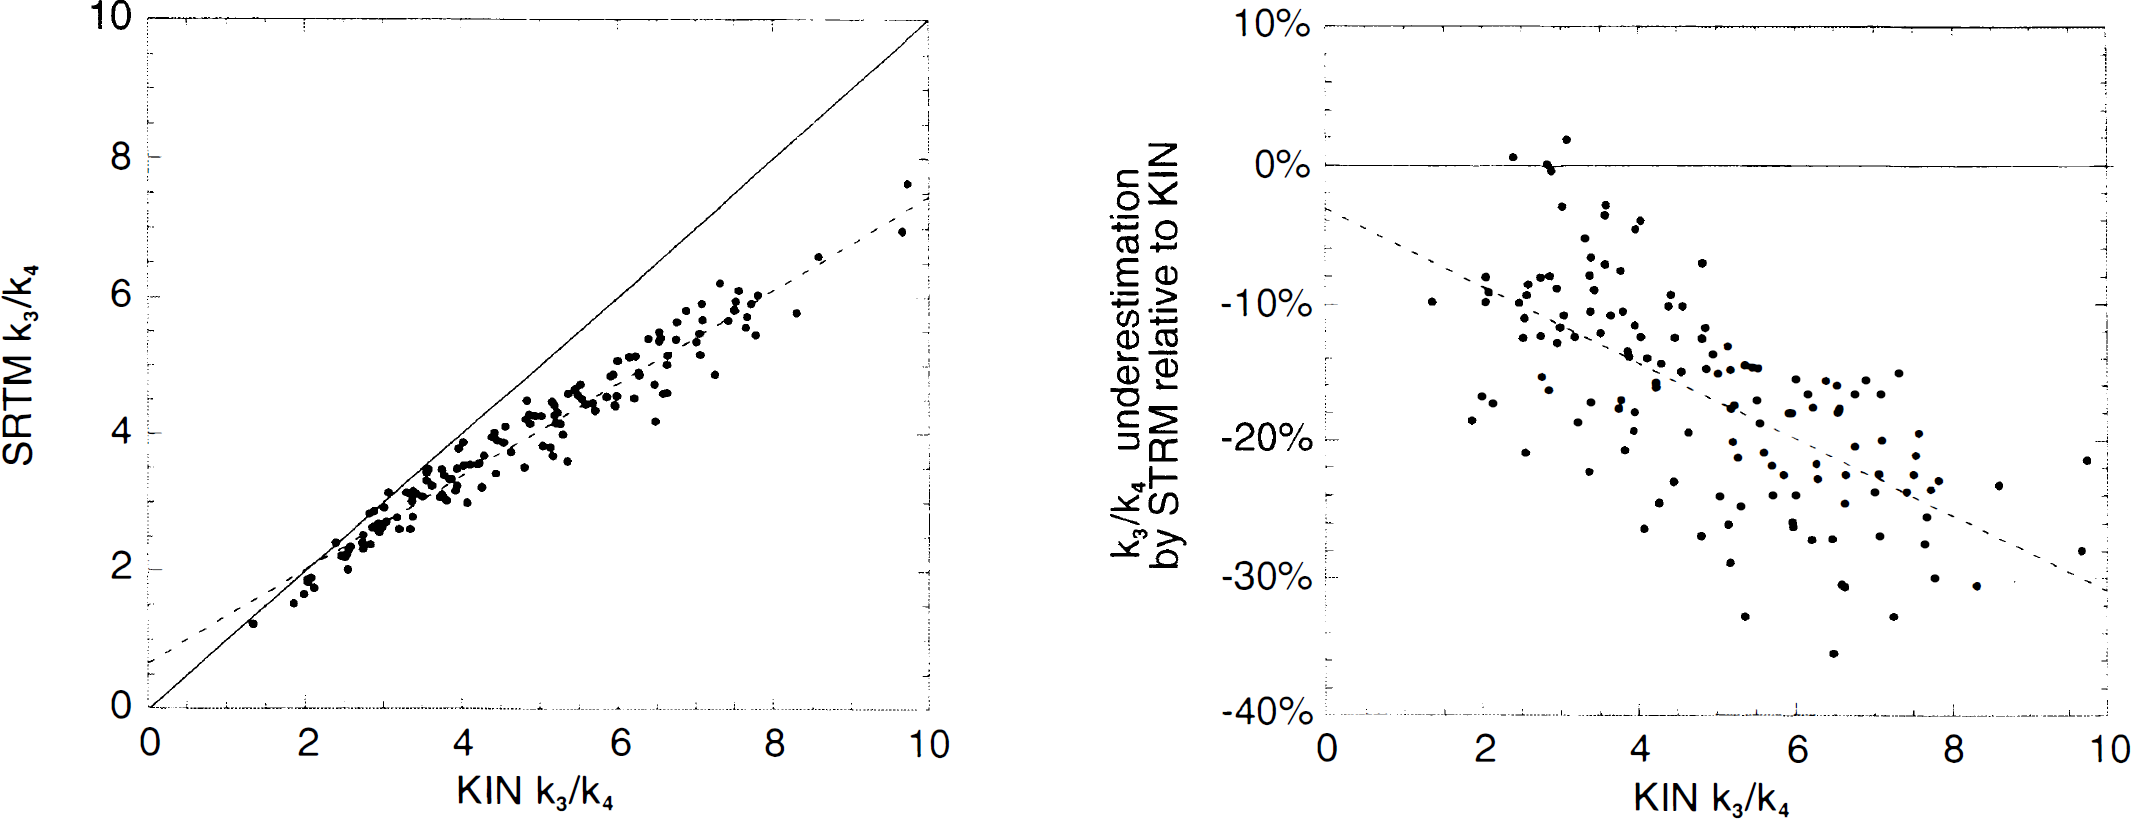
Relation between k3/k4 as derived with kinetic analysis and arterial input function. (left panel) Regression of kinetic 1B k3/k4 (Method 1C, × axis) and simplified reference tissue model k3/k4 (SRTM, Method 3B, y axis). The full line represents the line of identity. The dotted line represents the linear regression between k3/k4 as derived by each method (slope of 0.68). (right panel) Underestimation of k3/k4 by Method 3B relative to Method 1B (y axis) as a function of the value of k3/k4 derived by Method 1B (× axis). This significant relationship (P < 0.001) indicates that SRTM underestimates k3/k4 more in regions with high 5-HT1A densities than in regions with low 5-HT1A densities. However, the scattered aspect of the relationship (r2 = 0.43) suggests that other factors are implicated in this phenomenon.
DISCUSSION
The aim of the current investigation was to evaluate and compare different data analysis strategies to derive regional 5-HT1A receptor parameters after a single bolus injection of high specific activity [11C]WAY 100635. To address this issue, a comprehensive data set was collected (that is, with arterial input function and long scanning times), and each experiment was repeated to determine reproducibility.
Outcome measures, models, and methods
Independent measures of receptor density (Bmax) and affinity (1/KD) cannot be derived in experiments conducted at tracer doses. These experiments potentially provide BP, that is, the Bmax/KD ratio. At tracer dose, BP is mathematically equal to the equilibrium ratio between the specifically bound and the free radiotracer (Laruelle et al., 1994a). However, the free radiotracer is only a fraction of the total concentration present in the plasma (f1) or in a brain region devoid of receptors (f2). Thus, when the specific binding is expressed relative to the plasma radiotracer concentration, BP is in fact equal to f1Bmax/KD. When expressed relative to the brain tissue concentration in a region devoid of receptors, BP is in fact equal to f2Bmax/KD. In the current article, we use the term BP to designate the first (Eq. 11) and k3/k4 to designate the latter (Eq. 12). Without a reliable experimental method to measure f1, one is reduced to choose between BP as defined here or k3/k4. Both outcome measures are potentially biased, one by potential between-subject differences in binding to plasma proteins (f1), and the other by potential differences in nonspecific binding to the reference (cerebellar) tissue (f2).
Three general analytical methods were evaluated using this data set. The first, and most comprehensive method, was the kinetic analysis of regional brain uptake as related to the measured arterial input function (Method 1). This method assumed a given compartmental model, and had the potential to yield estimates of the rate constants governing the transfer of the radiotracer between these compartments and the distribution volumes of these compartments. The second and third methods were mathematically derived from the first method. The graphical analysis (Method 2) was introduced as a generalization of the compartmental model in that this method did not assume a given compartmental configuration (Logan et al., 1990). The third method, the reference tissue method (Method 3), was initially developed for rodent studies in which the measurement of the arterial input function is technically difficult (Hume et al., 1992). Like the graphical method, the reference tissue model was mathematically derived from the first method. Thus, the first method could be considered as the “parent” method from a mathematical point of view. In a perfect (noise free) world, in which radiotracers would strictly behave according to a particular compartmental model, all three methods should provide similar outcome measures.
Several points are important to recognize regarding the choice of outcome measures and analytical methods. The first point is that the use of Method 3 restricted the choice of outcome measures to k3/k4 and implied that between-subject differences in nonspecific binding are not significant. In contrast, Methods 1 and 2 enabled derivation and comparison of both outcome measures. Thus, five outcome measures were evaluated in this study—BP by Methods 1 and 2, and k3/k4 by Methods 1, 2, and 3.
The second point is that, in the absence of a “gold standard”, the comparison between analytical methods was based on various operational criteria. The first criterion used was the success rate. Although it was expected (and possibly desirable) that a given method fail on some particularly noisy regional data set, too high of a failure rate was not practical. Second, the answer must be determined with a reasonably low error term, that is, the identifiability should be acceptable. Third, the answer should not depend on the duration of the scan (after a given time). Fourth, the answer should be reasonably reliable when the same measurement is performed twice (low TRV) and reveal true between subject differences (high ICC).
A third consideration was whether mathematically equivalent methods return the same results. Because Methods 2 and 3 were mathematically derived from Method 1, one should expect outcome measures derived by Methods 1,2, and 3 to be highly correlated and not significantly different from each other. If this is not the case, the reasons for these discrepancies must be determined because these reasons often reveal either particular susceptibilities to noise or effects of model assumption violations.
Before comparing in detail the performance of the three Methods, we should first discuss the difficulties encountered with [11C]WAY 100635 in measuring both the arterial input function and the reference tissue region (cerebellum).
Measurement of plasma input function
[11C]WAY 100635 was rapidly metabolized (90% of the dose was metabolized within the first 10 minutes). This factor, combined with the rapid decay of C-11, prevented measurement of the unmetabolized fraction after 60 minutes. Unmetabolized fraction after 60 minutes were extrapolated by curve fitting (one exponential plus one constant). The use of this function over this interval (0 to 120 minutes) was supported by the observation that after 20 minutes the rate of decrease of the total plasma activity (that is, parent and metabolite activities) was nearly identical to the rate of decrease of the cerebellum activity. We should also note that fitting the unmetabolized [11C]WAY 100635 fraction to a sum of two exponentials resulted in a second exponential of exponent zero in nearly all cases. In essence, our approach here was similar to the one used by Gunn et al. (1998), who used a sigmoidal curve to fit the unmetabolized [11C]WAY 100635 fraction. Inspection of Fig. 3 of Gunn et al. (1998) reveals that the unmetabolized [11C]WAY 100635 fraction values at later times are practically constant, a finding we confirmed in our data set (fitting our data to the same function resulted in a metabolite fraction change of less than 0.0003% from t = 50 minutes to t = 120 minutes).
Despite these difficulties, [11C]WAY 100635 plasma clearance was measured with good reproducibility (TRV of 7 ± 4%) and high reliability (ICC = 0.83).
Cerebellum distribution volume
The nonspecific binding of [11C]WAY 100635 in brain tissue was low (cerebellum VT values less than unity). Cerebellum VT values reported in this study (0.89 ± 0.27 mL g−1) were in good agreement with values of 0.9 ± 0.2 mL g−1 reported by Farde et al. (1998) and 0.58 ± 0.12 mL g−1 reported by Gunn et al. (1998) (all values corrected for the vascular contribution).
Because of the low radiotracer uptake in the cerebellum, cerebellum activity was significantly contaminated by activity present in the vascular compartment. Without an input function measurement and correction for vascular contribution, k3/k4 would be underestimated and affected by between subject differences in plasma activity. Thus, vascular correction was important for this ligand and provided additional justification for the measurement of the input function, even if k3/k4 was the intended outcome measure. Because the vascular contribution to the total regional activity was high in the cerebellum, we investigated the effect of errors in blood volume assumptions on the outcome measures. Brain data was simulated using a typical input function, typical cerebellar and cingulate cortex kinetic parameters, and a blood volume of 7.5%. The data were then analyzed assuming a blood volume of 5%. The resulting curves yielded BP and k3/k4 values that were 101% to 104% of the true values used to generate the curves. Thus, errors in blood volume assumption would affect k3/k4 more than BP. We should also note that for the vascular correction we used the total plasma activity rather than the total blood activity, thus assuming that the plasma to cells partition coefficient was close to unity and constant over time. In fact, comparison of plasma and blood activities revealed that the plasma to cell partition coefficient was close to 2 but constant over time (data not shown). The impact of assumption violations regarding the plasma to cell partition coefficient was expected to affect k3/k4 more than BP.
As previously observed in baboons (unpublished data) and in humans (Gunn et al., 1997; Farde et al., 1998), a 3CM was needed to fit the cerebellum uptake of [11C]WAY 100635. The 2CM provided an obviously poor fit. Compared with cerebellar VT derived by 2CM, cerebellar VT derived by 3CM was more identifiable, equally stable, more reproducible, and closer to the graphical VT. The observation of a better fit by 3CM compared with 2CM for a region of reference is the rule rather than the exception in neuroreceptor imaging (Frost et al., 1989; Logan et al., 1990; Lammertsma et al., 1996; Ito et al., 1998). This second tissue compartment may correspond to a slow component of nonspecific binding or to a progressive buildup of metabolites in the brain (Osman et al., 1996; Farde et al., 1998). Because our HPLC conditions were optimized to separate unmetabolized [11C]WAY 100635 from metabolites, but not to identify the different metabolite peaks, further investigation of this later explanation was not possible in this data set. We also evaluated the cerebellum fit under various assumptions used to construct the input function (for example, by constraining the unmetabolized [11C]WAY 100635 fraction to a significant terminal half-life) or to perform vascular correction (such as under different blood volumes assumptions). In all cases, a 3CM was required to model the cerebellum. Thus, the need for a 3CM in the cerebellum was unlikely because of inaccuracies in measurement of the tail of the input function.
This additional compartment in the cerebellum was unlikely to represent binding to 5-HT1A receptors. The presence of 5-HT1A receptors in the cerebellum has not been demonstrated in vitro in humans (Hall et al., 1997) or in vivo in primates (Farde et al., 1997). We recently confirmed in humans that pretreatment with the 5-HT1A partial agonist pindolol (30 mg dose) did not affect the distribution volume of [11C]WAY 100635 in the cerebellum (Martinez et al., 2000). However, we should point out that 5-HT]A receptors have been detected in postmortem cerebellar tissue in patients with schizophrenia (Slater et al., 1998). Therefore, the use of the cerebellum to define nonspecific binding might not be appropriate in some pathologic conditions.
We should also note that it is likely that the nondisplaceable uptake in regions with 5-HT1A receptors would also be best described by a 3CM. This uptake was assumed to follow a 2CM in Method 1. Precise elucidation of the nature and configuration of these nonsaturable compartments would be required to develop a four compartment model to evaluate the effect of this assumption violation. However, since the total distribution volume of the cerebellum was used to define the nondisplaceable distribution volume in all methods (but 1A), this factor will affect k3/k4 to the same extent in all methods.
Impact of analytical methods on receptor parameters
The SRTM method (Method 3B) provided well identified estimates of k3/k4 in all cases. Method 3B k3/k4 values were well correlated with Method 1C k3/k4 values but were significantly lower by an average of 19 ± 7%. Similar results were reported by Gunn et al. (1998). Comparing k3/k4 values derived from the indirect kinetic method in Table 2 of Gunn et al. (1998) with the SRTM derived k3/k4 values presented in Table 4 of Gunn et al. (1998) shows that SRTM values underestimate kinetic 1B values by 32 ± 15%. The larger underestimation in the data of Gunn et al. (1998) compared with data reported here might be caused by two factors. First, SRTM data from Table 4 were not corrected for the vascular contribution. Second, the data of Gunn et al. (1998) were collected over 90 minutes as opposed to 120 minutes in the current study. Figure 4 demonstrates that an additional 10% underestimation of k3/k4 is present at 90 minutes with the SRTM method compared with the 120-minute value.
If the SRTM method was associated with a relative underestimation of k3/k4 that was independent of k3/k4 values, one could argue that this phenomenon is not of major concern (all values would be scaled down by a given factor). Unfortunately, this was not the case. The regression of Method 3B k3/k4 to Method 1C k3/k4 had a slope far from unity (0.67) and a positive intercept (0.65, Fig. 8). Similar results were reported by Gunn et al. (1998). The regression of SRTM k3/k4 values (without vascular correction) to k3/k4 derived with indirect kinetic modeling (the equivalent of Method 1B in this paper) had a slope of 0.54 and a positive intercept (0.99) (Fig. 7 of Gunn et al., 1998). The positive intercept and the slope lower than unity (0.67 here and 0.54 in Gunn et al., 1998) indicates that SRTM underestimates k3/k4 more in regions of high receptor density than in regions with low receptor density (Fig. 8). Thus, the underestimation of k3/k4 by SRTM was not just a scaling factor, but will significantly affect between subject comparisons.
This observation was unexpected to the extent that the RTM methods were mathematically derived from the differential equations governing Method 1 (Eq. 2 and 3). In contrast to the underestimation of BP by the graphical Method, the underestimation of k3/k4 by SRTM was not a noise dependent phenomenon; the analyses with SRTM of a “perfect” noise free data set returned k3/k4 values lower than the k3/k4 used to create the data set. This observation is illustrated in Fig. 9. A cerebellum time-activity curve was created by convolving a typical [11C]WAY 100635 arterial input function with a 3CM model with typical cerebellar rate constants (K1 = 0.130 mL g−1 min−1; k2 = 0.351 min−1; k5 = 0.030 min−1; k6 = 0.029 min−1, with k5 and k6 being the rate constants for the radiotracer transfer between the second and the third compartment). Similarly, an anterior cingulate curve was created with typical cingulate [11C]WAY 100635 parameters: K1 = 0.130 mL g−1 min−1; k2 = 0.171 min−1; k3 = 0.096 min−1; k4 = 0.013 min−1). Note that, in this simulation, R1 was 1, cingulate k3/k4 was 7.25, and the cingulate K1/k2 ratio was equal to the total cerebellum total distribution volume. These parameters (R1 = 1, k2 = 0.171 min−1, k3/k4 = 7.31) were then entered in the SRTM operational equation to derive the expected anterior cingulate values using the cerebellum as input function. As shown in Fig. 9, the cingulate time-activity curve derived by SRTM using the true parameters overestimated true cingulate values. The SRTM model was then allowed to adjust the values of the parameters to improve the fit and the model converged with R1 = 1.28, k2 = 0.102 min−1 and k3/k4 = 5.72. Thus, to optimize the goodness of fit, the SRTM model had to increase the value of R1 (from a true value of 1 to an estimated value of 1.28, that is, 28% overestimation) and to decrease the value of k3/k4 (from a true value of 7.31 to an estimated value of 5.72, that is, 21% underestimation). This overestimation of R1 and underestimation of k3/k4 were consistent with the errors observed in the real data set (overestimation of 44 ± 20% for R1, underestimation of 19 ± 7% for k3/k4). Because the error was replicated on a noise free data set, this error was intrinsic to the SRTM model applied to [11C]WAY 100635 data and was not caused by a particular bias because of experimental noise (as in the case of the graphical analysis).
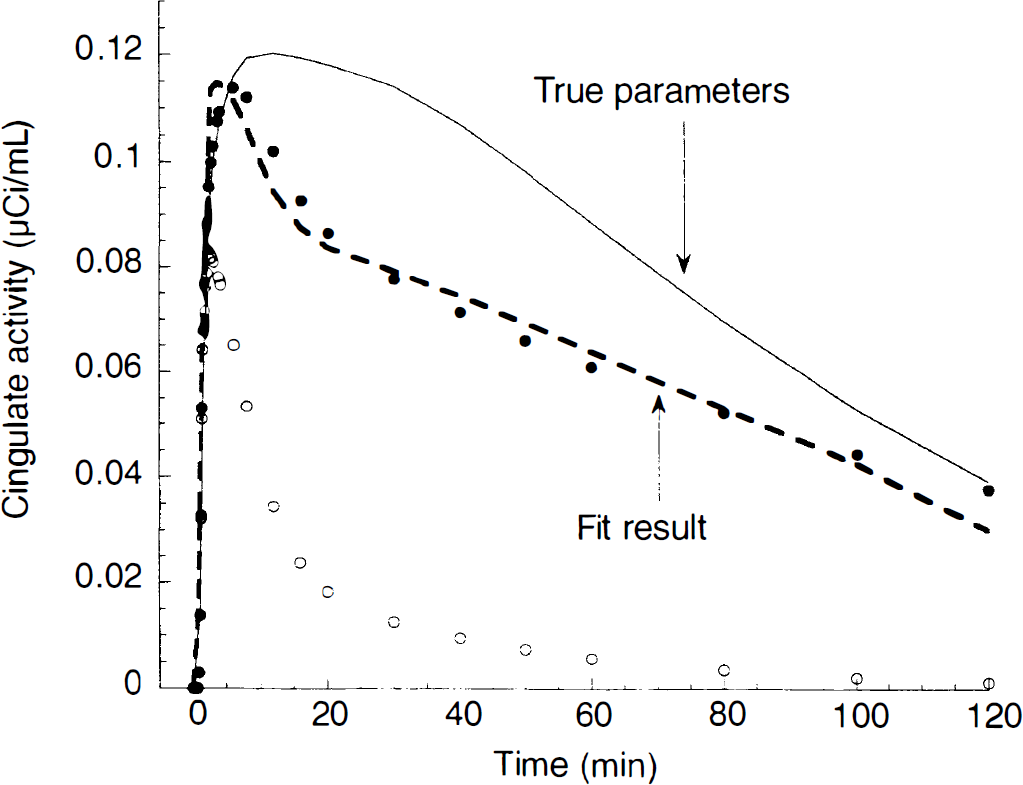
Demonstration of the difference between the simplified reference tissue method and the kinetic method based on arterial input function. Typical [11C]WAY 100635 cerebellum (open circle) and cingulate (closed circle) regions were created by convolving a typical [11C]WAY 100635 input function with 3CM model (cerebellum rate constants: K1 = 0.130 mL g−1 min−1; k2 = 0.351 min−1; k3 = 0.030 min−1; k4 = 0.029 min−1; cingulate rate constants: K1 = 0.130 mL g−1 min−1; k2 = 0.171 min−1; k3 = 0.096 min−1; k4 = 0.013 min−1). Note that, in this simulation, R1 was equal to 1, cingulate k3/k4 was 7.25, and the cingulate K1/k2 ratio was equal to the cerebellum total distribution volume. These parameters (R1 = 1; k2 = 0.171 min−1; k3/k4 = 7.31) were then entered in the SRTM operational equation to derive the expected anterior cingulate values using the cerebellum as input function. The cingulate time-activity curve derived by SRTM using the true parameters (solid line) overestimated true cingulate values. The SRTM model was then allowed to adjust the values of the parameters to improve the fit, and the model converged with R1 = 1.28; k2 = 0.102 min−1; and k3/k4 = 5.72 (dotted lines). Thus, to optimize the goodness of fit, the SRTM model had to increase the value of R1 (from a true value of 1 to an estimated value of 1.28, that is, 28% overestimation) and to decrease the value of k3/k4 (from a true value of 7.31 to an estimated value of 5.72, that is, 21% underestimation). This example, based on noise free data, demonstrates that estimates of k3/k4 derived by both methods are not equivalent.
This error could be derived from two violations of assumptions associated with SRTM. First, the RTM model (whether full or simplified) assumed that the region of reference (cerebellum) was appropriately modeled by a 2CM model. As discussed above, this condition was not met for [11C]WAY 100635. Second, the simplified RTM assumed that the ROI was also appropriately modeled by a 2CM, which was not the case (data not shown). However, when it converged, the full RTM also underestimated k3/k4 by 19 ± 18% (n = 69). Because the full RTM did not make the second assumption, we would propose that the violation of the first assumption was the most important factor. This proposition was reinforced by examination of previously published [11C]raclopride data (Table 3 in Lammertsma et al., 1996). [11C]raclopride k3/k4 values (n = 8) derived with full RTM (Method 3A here, Method C in Lammertsma et al., 1996) were 14 ± 9% lower than k3/k4 values derived with indirect 3CM model (Method 1B here, Method Ab in Lammertsma et al., 1996). [11C]raclopride cerebellar uptake also required a 3CM fit rather than a 2CM fit. This factor alone should not disqualify the RTM as an interesting alternative for deriving k3/k4 when arterial plasma data are not available. However, additional research is needed to define the factors that influence the magnitude of this error.
Time stability
A basic requirement of any analytical approach used to derive BP or k3/k4 is that after a given time, the outcome measure should be nonsignificantly affected by acquisition of additional data. Regions significantly differed in the scan duration needed to yield stable outcome measures. Everything else being equal, it would be expected that required scan duration would be longer for regions with higher receptor density. This relationship was not observed in this data set (relation between duration to reach stability and BP, r2 = 0.05; P = 0.38). However, the size of the region was a significant factor. Large neocortical regions (such as TC) became stable first, followed by small limbic regions, then by the DRN which, in fact, never met the stability criteria. This observation suggested that the noise in the regional measurement was the determining factor for the required scan duration. Indeed, we observed a significant relationship between the regional noise (as measured by the residual sum of squares of the 1C fit) and the minimal scan duration needed to achieve stable BP with Method 1C (r2 = 0.65; P < 0.001; Fig. 10).
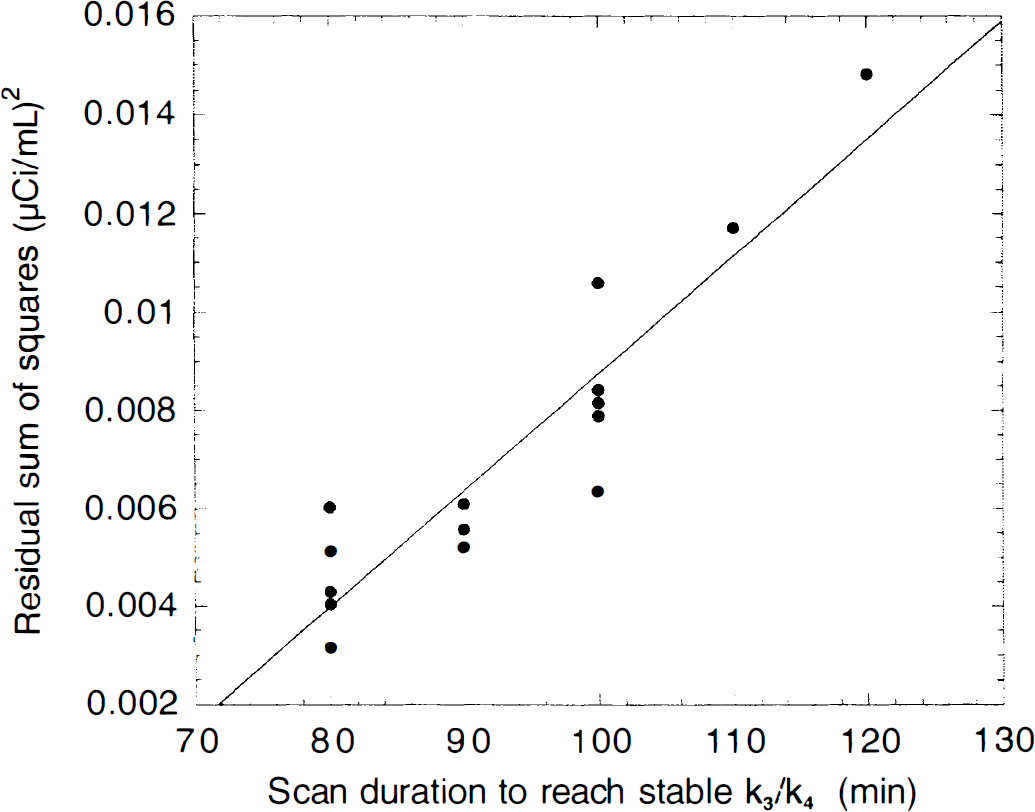
Relation between the noise measurement in each region (as estimated by the residual sum of squares of the Method 1C fit) and the minimal scan duration needed to achieve stable k3/k4 with Method 1C (r2 = 0.84; P < 0.001). This relation indicates that regions with larger noise (that is, smaller size regions) require longer scan duration to yield stable outcome measures.
Significant between method differences were also noted. The kinetic 1B, graphical, and SRTM methods required about 10 minutes less data to reach stability criteria compared with the kinetic 1C method. In addition, the error and the bias associated with shorter scans were much greater for kinetic 1C compared with the three other methods, as can be appreciated in Fig. 4. Kinetic 1B and graphical analysis presented only negligible bias, even at scan durations as low as 60 minutes, whereas SRTM was associated with a bias towards lower k3/k4 values. Finally, the error associated with graphical analysis was less than the error associated with kinetic 1B. Thus, from the point of view of scan duration, the graphical analysis offered the best analytical method (no bias, small error), followed by kinetic 1B (no bias, larger error), SRTM (small bias, small error), and kinetic 1C (large bias, large error).
Reproducibility
The reproducibility of the outcome measures was affected by the region size and the nature of the outcome measure (BP vs. k3/k4), but not by the method of analysis (Table 5). It was not surprising that 5-HT1A receptor parameters were measured with higher reproducibility in large regions such as TC or DLPFC compared with smaller regions such as UNC or ENT. Smaller regions have inherently lower counting statistics and are more vulnerable to head movement or coregistration errors. Nevertheless, with the exception of the DRN, all regional BP had acceptable (>0.50) to excellent (>0.75) ICCs, suggesting that BP can reliably be estimated in small regions of the medial temporal pole.
Usually, the TRV of BP is higher than that of k3/k4 (see Abi-Dargham et al., 2000). Because k3/k4 was essentially BP normalized to the cerebellum distribution volume, this measure should have been less vulnerable to experimental errors affecting plasma measurement and cross calibration between the gamma counter and PET camera. Typically, this normalization comes at the expense of losing some information regarding true between subject differences and, despite higher variability, the ICC of BP is frequently higher than the ICC of k3/k4. Thus, the data reported in the current study were unusual in that BP was superior to k3/k4 both in terms of TRV and ICC. This situation arose from the fact that the [11C]WAY 100635 cerebellum tissue concentration was very low (see above), that the measurement of cerebellum VT was associated with significant lack of reproducibility (TRV of 21 ± 9%), and that the error in cerebellum VT impacted more on k3/k4 computation (cerebellum VT was the denominator of k3/k4) than on BP computation (cerebellum VT was only a subtraction term in BP). This result is in agreement with the data reported by Gunn et al. (1998). Table 8 presents the TRV and ICC of BP and k3/k4 (Method 1B) in medial temporal cortex, insular cortex, and cingulate cortex reported here and in Gunn et al. (1998). In both studies, BP performs better than k3/k4 in terms of TRV and in terms of ICC values.
Comparison of [11C]WAY 100635 reproducibility parameters in three large regions between the current study and Gunn et al. (1998)
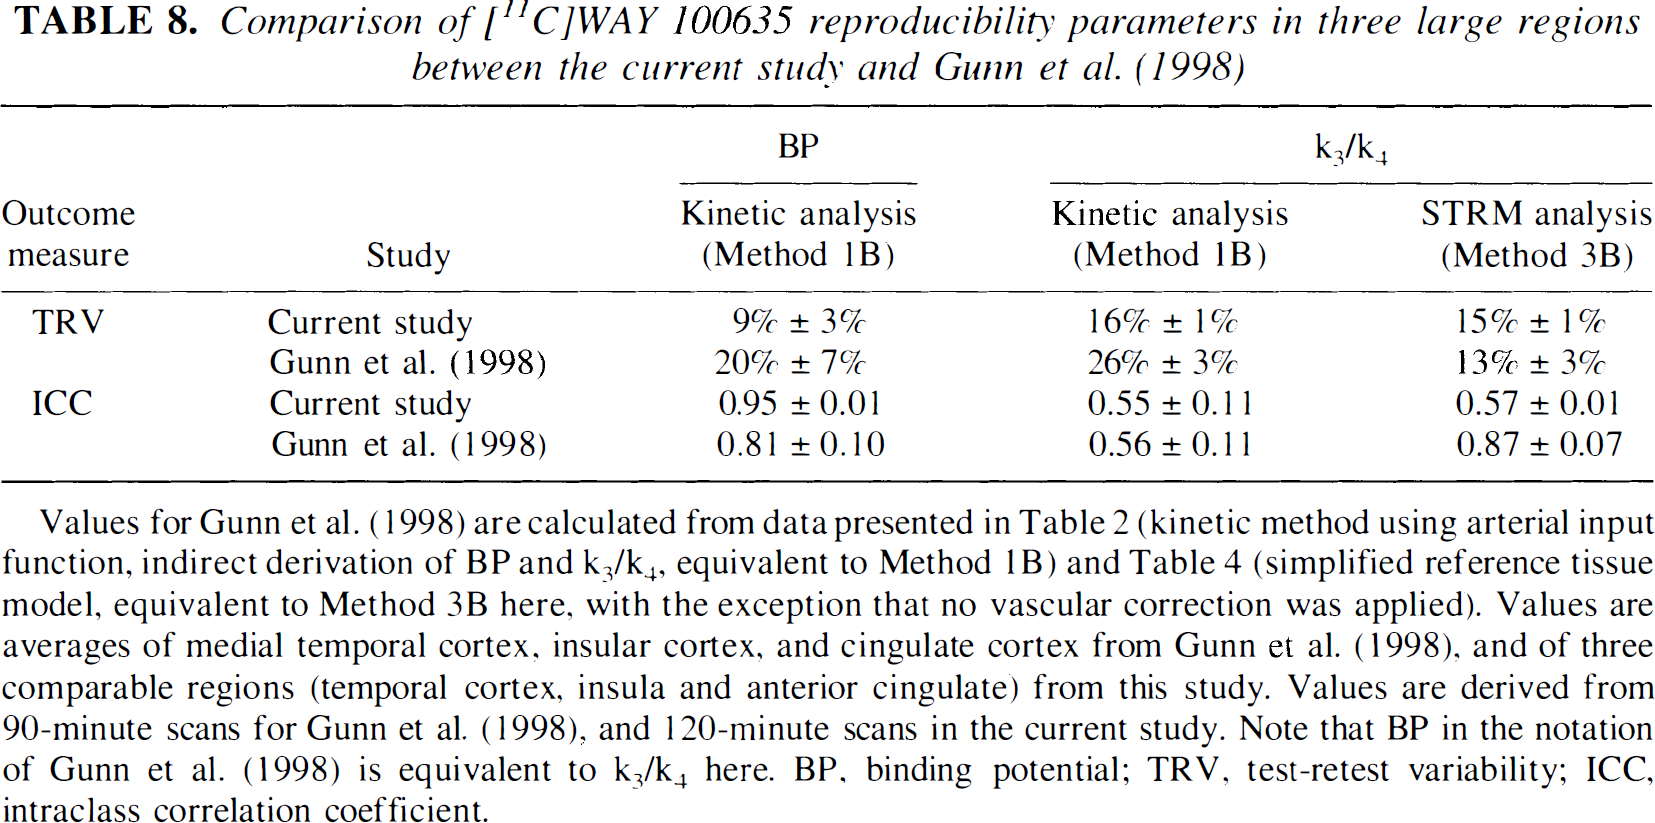
Values for Gunn et al. (1998) are calculated from data presented in Table 2 (kinetic method using arterial input function, indirect derivation of BP and k3/k4, equivalent to Method 1B) and Table 4 (simplified reference tissue model, equivalent to Method 3B here, with the exception that no vascular correction was applied). Values are averages of medial temporal cortex, insular cortex, and cingulate cortex from Gunn et al. (1998), and of three comparable regions (temporal cortex, insula and anterior cingulate) from this study. Values are derived from 90-minute scans for Gunn et al. (1998), and 120-minute scans in the current study. Note that BP in the notation of Gunn et al. (1998) is equivalent to k3/k4 here. BP, binding potential; TRV, test-retest variability; ICC, intraclass correlation coefficient.
In the current study, the reproducibility of [11C]WAY 100635 outcome measures was independent of the analytical approach used. For example, the TRV and ICC of k3/k4 were similar whether derived with (Method 1B and 2) or without (Method 3) arterial input function. This result was at variance with Gunn et al. (1998), who reported significantly better reproducibility of k3/k4 by SRTM compared with the kinetic 1B Method (Table 8). This observation suggests more within-subject variability in arterial input function measurements in the Gunn et al. (1998) data compared with data reported here, although the impact of a shorter scanning time (90 vs. 120 minutes) and the absence of vascular correction may also contribute to this different result.
Comparison between methods and outcome measures
Overall, method 1B appeared as the method of choice. Two methods (1A and 3A) were found clearly inappropriate; the direct kinetic method (1A) provided inaccurate values of B P and k3/k4, and the full RTM method (3A) provided values in only 62% of the cases. Method 1C should be used with caution because of the marked instability associated with shorter scan duration. Methods 2 and 3B were associated with underestimation of binding parameters, but for very different reasons. The underestimation of BP by Method 2 was moderate, a noise dependent phenomenon, and affected only the small and noisy regions (the DRN was the region most affected). The underestimation of k3/k4 by Method 3B was more pronounced. This underestimation was not noise dependent, but was dependent on regional 5-HT1A receptor density and affected regions with high k3/k4 more than regions with low k3/k4 (the DRN was the region least affected).
In this data set, a clear advantage was associated with BP as opposed to k3/k4, strongly suggesting that if an arterial input function is available, BP should be the outcome measure of choice. If an arterial input function is not available, Method 3B provides a useful method, if one keeps in mind the following limitations: (1) underestimation of k3/k4 by this method is significant and will vary across regions and across subjects as a function of 5-HT1A density, (2) this underestimation is accentuated for shorter data sets, (3) the cerebellum activity is contaminated by the activity in the blood, (4) cerebellum distribution volume may vary across subjects and across conditions.
Comparison with in vitro data
Figure 11 shows regional [11C]WAY 100635 BP values derived by Method 1B and regional [3H]WAY 100635 binding values reported by Hall et al. (1997) in autoradiographic studies of human brains (n = 3). A significant correlation was observed (r2 = 0.57; P < 0.001) between in vivo and in vitro values. Both studies identified ENT as the region of the human brain with the highest density of 5-HT1A receptors.
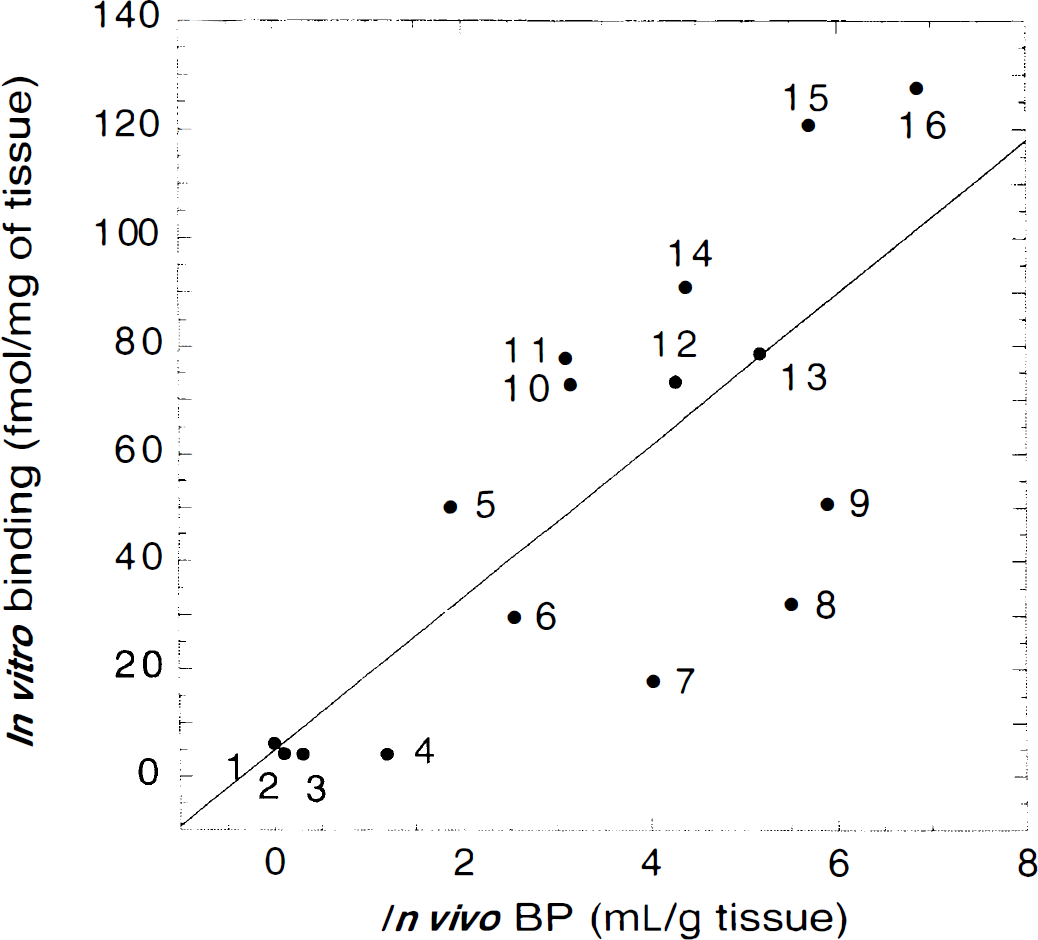
Comparison of in vivo [11C]WAY 100635 BP and in vitro [3H]WAY 100635 binding (r2 = 0.57; P < 0.001). Autoradiography values are from Hall et al. (1997) (total binding of [3H]WAY 100635, 2 nmol/L). Regions: 1, cerebellum; 2, caudate; 3, thalamus; 4, putamen; 5, dorsal raphe nuclei; 6, occipital cortex; 7, amygdala; 8, parahippocampal gyrus; 9, insula; 10, dorsolateral prefrontal cortex; 11, parietal cortex; 12, anterior cingulate; 13, temporal cortex; 14, hippocampus; 15, uncus; 16, entorhinal cortex.
Dorsal Raphe 5-HT1A receptors
The visualization of 5-HT1A autoreceptors in the dorsal raphe nuclei is a fascinating aspect of [11C]WAY 100635 PET scans. Because these receptors control the firing rate of 5-HT neurons, potential alterations of these receptors might have widespread consequences for 5-HT function. Unfortunately, the almost evanescent quality of this signal precludes accurate quantification. We are not referring here to the partial voluming effect, which is admittedly major in this structure, and quite difficult to correct for given the absence of anatomical boundaries detectable on the MRI. The noise associated with this measurement hinders even appropriate quantification of the primary signal. The noise of the DRN measurement, as assessed by the residual sum of squares of the 1C fit, was the highest of all regions. The average identifiability of DRN BP was marginal (error of ± 26.4 ± 4.8% with the kinetic 1C method, after deleting two values with errors higher than 30%). With most methods, the time stability of DRN outcome measures could not be demonstrated even with 120 minutes of data. The TRV of DRN BP by the kinetic 1B method was ± 21 ± 22%, with an ICC of 0.44. Worse, the TRV of the kinetic 1B DRN k3/k4 was ± 29 ± 30%, with a negative ICC value of −0.24 (a negative ICC indicates that larger differences were observed within-subjects than between-subjects). The reproducibility was equally limited with the other methods. Thus, irrespective of the method, a significant error was associated with measurement of 5-HT1A receptor density in the DRN, and this factor should be taken into account in power analysis for investigations comparing between- or within-subject DRN [11C]WAY 100635 BP.
In conclusion, the results of this study indicated that 5-HT1A receptor parameters can be measured with high reliability with [11C]WAY 100635 in the human brain, even in small regions such as the hippocampal formation or the entorhinal cortex. The DRN was the major exception, given the high noise associated with the measurement of [11C]WAY 100635 concentration in this region. Because of the low nonspecific binding of [11C]WAY 100635, the distribution volume of the reference region (cerebellum) was small (less than unity) and associated with a significant error. As a result, the normalization of BP by the cerebellum (that is, k3/k4) was associated with a larger error than BP itself. The 3CM kinetic analysis with indirect derivation of BP was the most satisfying approach. Derivation of BP by graphical analysis performed equally well, with the caveat of a noise dependent underestimation detected only in small and noisy regions. Both methods required careful measurement of the arterial input function and at least 90 minutes of data acquisition. If the input function was not available, the SRTM method provided an alternate method of analysis, limited by the nature of the outcome measure (k3/k4) and by the fact that multiple factors—intrinsic assumption violations, absence of vascular correction, and possibly inadequate data set length—will conspire towards a significant and variable underestimation of k3/k4. Additional work is warranted to better understand the factors that determine the magnitude of k3/k4 underestimation by SRTM and to evaluate other methods for deriving k3/k4 in the absence of an arterial input function.
Footnotes
Acknowledgments
The authors thank Analia Arevalo, Allegra Broft, Bryan Bergert, Suehee Chung, Alexei Kartachov, Julie Montoya, Justine Pidcock, Daniel Schneider, Ann Shinn, Richard Weiss, and the technologists of the Columbia PET Center for excellent technical assistance.