
Abstract
The purpose of this study was to compare two positron emission tomography (PET) tracers that were developed to follow serotonin (5HT) synthesis by performing sequential PET scanning of the same rhesus monkey (n = 4) on the same day. α-[11C]Methyl-
Introduction
Early efforts to determine tissue serotonin (5HT) synthesis rates in small mammals typically involved pharmacological manipulation of the 5HT system followed by the sampling of brain tissue (Brown et al, 1979; Goldman-Rakic and Brown, 1981; Karoum et al, 1984; Shannak and Hornykiewicz, 1980; Vriend et al, 1993). The tissue samples were then analysed for determination of the precursors tryptophan and 5-Hydroxytryptophan (HTP), 5HT itself, and the main metabolite 5-Hydroxyindole acetic acid (HIAA). The radiolabelled compounds α-[11C]Methyl-
[11C]AMT is a [11C]-methyl analogue of the essential amino acid tryptophan, which is a substrate for tryptophan hydroxylase, the first enzyme in the two-step synthesis of 5HT. Partial conversion of [11C]AMT to α-Methylserotonin (AM-5HT) in the brain has been showed in animals (Diksic et al, 1990; Gharib et al, 1999; Shoaf et al, 2000) in serotonergic neurons and nerve terminals (Cohen et al, 1995). However, there seems to be a time delay between uptake and conversion of the tracer into AM-5HT (Gharib et al, 1999; Shoaf et al, 2000). Further, under pathologic conditions, [11C]AMT can occasionally be metabolised by means of the kynurenine pathway and the measurements may thus reflect both pathways (Chugani and Muzik, 2000).
Apart from the radiolabel, [11C]HTP is identical to the endogenous compound that will undergo conversion to 5HT by aromatic
The endogenous concentrations of tryptophan and HTP in the brain are about equal to (Fernstrom and Wurtman, 1971; Young and Gauthier, 1981), or much less than (Zhu and Juorio, 1995), the half-saturation concentrations for either of the targeted enzymes (tryptophan hydroxylase and AADC). It has been suggested that measurement of either of these enzymatic steps could provide a value that is proportional to 5HT synthesis (Hagberg et al, 2002). In previous [11C]AMT/PET and [11C]HTP/PET studies, the net accumulation rate constant for tracer trapping was stable within an individual and the rank order was consistent with the rank order of regional concentrations of 5HT in the human brain (Chugani et al, 1998; Hagberg et al, 2002). Further, the net accumulation rate constants for tracer trapping obtained in separate [11C]AMT/PET and [11C]HTP/PET studies in humans were found to be correlated (Hagberg et al, 2002; Leyton et al, 2005). The purpose of this study was to directly compare [11C]AMT and [11C]HTP as PET ligands for 5HT synthesis capacity in rhesus monkeys.
Materials and methods
Animals
Four female rhesus monkeys (Macaca mulatta) (Primate Research Laboratory, Uppsala University), aged 15 to 20 years and weighing 6 to 13 kg, were allowed only water from the evening before the PET study. The Animal Ethics Committee of Uppsala University approved the protocol (C 117/04).
Radiochemistry
[11C]AMT and [11C]HTP were synthesised as described previously (Bjurling et al, 1989; Chakraborty et al, 1996). Radiochemical purity was greater than 95%. The mean specific radioactivity levels of [11C]AMT and [11C]HTP at the time of injection were 17 ± 10 and 15 ± 6 GBq/μmol, respectively. The average injected [11C]AMT radioactivity dose was 292 ± 125 MBq, corresponding to a total amount of injected unlabelled AMT of 20 ± 8 nmol. The average injected [11C]HTP dose was 284 ± 157 MBq and contained 19 ± 3 nmol of unlabelled HTP.
Positron Emission Tomography System
The studies were performed using the Hamamatsu SHR-7700 (Hamamatsu Photonics KK, Hamamatsu, Japan). The 16 detector rings of this instrument provide a 114 mm axial FOV and 31 two-dimensional image planes for every 3.6 mm distance. The transaxial resolution is 3 mm in 2D mode (Watanabe et al, 1997). Transmission scans with rotating 68Ge sources were used to correct the emission scans for the attenuation of 511keV photons through the tissue and head supports. Images were reconstructed using a 4 mm Hanning filter after correction for attenuation and scattered radiation.
Positron Emission Tomography Studies
After induction of anaesthesia with 100 mg intramuscular ketamine (Ketaminol, Vetpharma, Zurich, Switzerland), the animals were transported to the investigation site at Uppsala Imanet. A venous catheter was inserted in both hind legs of each monkey, one for administration of the anaesthetic agent propofol (8 to 12 mg/kg/h, Propofol-Lipuro, B/Brown) and one for administration of the radioactive tracer. After tracheal intubation, muscle relaxation was achieved with 5 mg/kg/h intravenous atracurium (Tracrium, GlaxoSmithKline). Ventilation was supported with 30% oxygen in air. Heating pads were used to maintain body temperature at 37°C to 38°C. A femoral artery catheter was inserted for blood sampling. PET scans with [11C]AMT and [11C]HTP were performed sequentially on the same day within the same monkey at least 2 h apart. The first PET scan was performed at least 2 h after ketamine administration. Radioactivity in the brain was measured in a series of sequential frames of increasing duration (from 15 secs to 3 mins) for a total of 60 mins after injection of the tracer. An automatic blood sampling system was used to measure radioactivity in arterial whole blood for the first 2 to 3 mins after radiotracer administration. Thereafter, 4 to 7 manual arterial blood samples were drawn at 5, 10, 15, 20, 30, 40, and 60 mins. The radioactivity concentration in blood and plasma was measured in a γ-counter (Well-type, NaI(Tl) scintillation counter), which was cross-calibrated against the PET scanner. Plasma-to-blood radioactivity concentration ratios determined from the manual samples were used to transform the blood radioactivity—time curve measured by the automatic sampling system into the full plasma radioactivity—time curve. Because plasma radioactivity after [11C]AMT is mainly associated with unchanged tracer (Gharib et al, 1999), [11C]AMT plasma/blood samples were directly counted on the γ-counter. For [11C]AMT, the generated total plasma radioactivity—time curve was then used in the model to represent the plasma input function (Cinp). For [11C]HTP, the remaining volume of each manual plasma sample collected at 5, 20, 40, and 60 mins was used to determine the fraction of unchanged radioligand and its radiolabelled metabolites in plasma over time. The metabolite-corrected plasma radioactivity—time curve generated from the plasma curve and the data describing the unchanged fraction of [11C]HTP was then used in the model to represent the plasma input function (Cinp).
Determination of [11C]HTP Metabolism in Plasma
The composition of the [11C]-derived radioactivity was analysed with high-performance liquid chromatography (HPLC) as described previously (Lindner et al, 1995), with minor modifications. Blood samples were centrifuged at 4000 r.p.m. for 2 mins at 4°C to obtain plasma (Beckman Allegra X-22R Centrifuge, Palo Alto, USA). Proteins were then precipitated with 1 mL acetonitrile in 1 mL plasma. After centrifugation for 1 min at 14000 r.p.m. (Eppendorf 5415R centrifuge, Eppendorf AG, Hamburg, Germany), the supernatant was filtered through a nylon membrane (0.2 μm, Corning Inc., Corning, NY, USA). The extent of sample recovery was determined by measuring the radioactivity in the plasma, the filters and the pellet. HPLC analysis was performed using a binary pump system (Gilson, Middleton, USA) with an automated solid phase extraction controller (ASPEC Gilson) connected to a dilutor (Gilson). Before injection of the sample (1.5 mL) into the HPLC column, 10 μL of unlabelled reference compounds (1 mg/mL of HTP, 5HT and HIAA) was added to the supernatant. Separation was performed on a C-18 column (Genesis, 7 μm, 250 × 10 mm2 Jones Chromatography). The mobile phase comprised acetonitrile and 50 mmol/L ammonium formiate (pH 3.5). The concentration of acetonitrile was varied during the process to provide graded concentration ratios with ammonium formiate: 0 to 9 mins, concentration ratio 5:95; 9 to 11 mins, ratio 70:30; 11 to 12 mins, isocratic; and then reconditioned with the 5:95 mobile mixture for at least 2 mins. A UV detector (Gilson) was used to detect the unlabelled reference substances at 275 nm. The outlet from the detector was connected to a switching valve on the arm of the ASPEC to enable automatic fraction collection. Seven fractions were collected and their respective radioactivity levels were measured in the γ-counter. A radio detector (Radiomatic 505TR, Packard, USA) was coupled online to the column to verify the fraction times and the radioactivity measurement.
Regions of Interest
Time frames were added to obtain a summation image, on which the regions of interest (ROIs; the frontal, occipital, parietal, and temporal cortices, the cerebellum, the striatum, the thalamus and the whole brain) were outlined, using a rhesus monkey brain atlas for guidance (Paxinos et al, 2000). Where appropriate, the same brain tissue region was delineated in two adjacent sections for both hemispheres, and data from the same region were pooled to obtain the average radioactivity concentration in that region. The total regional radioactivity concentration for each time frame corrected for radioactive decay (Cs, tiss) was plotted versus time for use in tracer modelling.
Data Analysis
Regional net accumulation rate constants were derived with kinetic and graphic analysis of the regional radioactivity—time curves using the plasma input function. The contribution of blood radioactivity to the measured regional radioactivity was removed, assuming a 3% to 5% blood volume in the ROI. In this study, the blood volume was fixed at 5% for the cerebellum and occipital cortex, 4% for the thalamus and temporal, parietal, and frontal cortices, and 3% for the striatum and whole brain. Values were based on estimates from previous quantitative blood volume measurements using labelled carbon monoxide performed at Uppsala Imanet, and literature values (Eichling et al, 1975; Hagberg et al, 2002; Muzik et al, 1997). The use of fixed blood volumes reduces the number of free parameters (from 4 to 3), which allowed a more precise estimation of the individual rate constants. Kinetic and graphic parameters were derived using software developed in-house implemented in MATLAB 6.5 (The Math Works Inc., Natick, MA, USA).
Kinetic analysis: The compartment model used for describing the kinetics of both [11C]AMT and [11C]HTP in humans is a two-tissue compartment model (2TCM, Figure 1), which assumes irreversible radioactivity trapping in the second tissue compartment (Chugani et al, 1998; Hagberg et al, 2002). The rate constants K1 (mL plasma/mL tissue/min) and k2 (min−1) describe the influx and efflux, respectively, for radioligand transport between vascular space and the cell cytoplasm (transport across the blood—brain barrier, the interstitial space, and the cell membrane). Once [11C]AMT is present in the cell cytoplasm it is converted to [11C]AM-5HT by means of two-step enzymatic process (via [11C]AM-HTP), which is characterised by the rate constant k3 (min−1). For [11C]HTP, the conversion to [11C]5HT is a 1-step enzymatic process. The rate constant k3 (min−1) describes the trapping of [11C]HTP and its decarboxylated products (i.e. [11C]5HT and the subsequently formed metabolite [11C]HIAA). The operational equation for the 2TCM is
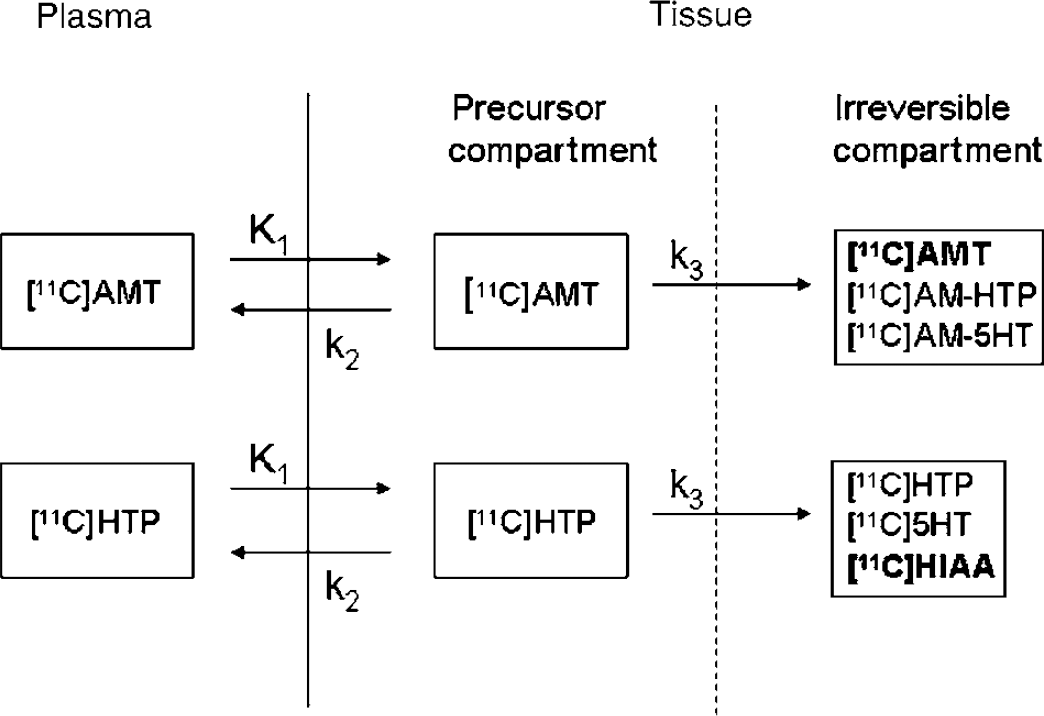
Tracer kinetic models for [11C]AMT and [11C]HTP. The bold components of the irreversible compartment illustrate the main contribution to the PET signal towards the end of the scan.
where Vb is the fractional blood volume for correction of the vascular component, Cinp is the plasma input function, θ(t) is the Heaviside step function, and Cb is the whole-blood radioactivity—time curve. Kinetic parameters were derived by nonlinear regression using a Marquardt—Levenberg least-square minimisation procedure implemented in MATLAB (Levenberg, 1944; Marquardt, 1963). The net accumulation rate constant, Kacc (mL plasma/mL tissue/min), was calculated from the estimated individual rate constants as the ratio
Graphic Analysis: For a tracer with irreversible kinetics, Patlak et al (Patlak et al, 1983) showed that, in a plot of Cs, tiss/Cinp versus ∫t0Cinp/Cinp, the data will eventually (t > t*) approach a straight line with a slope (KpPat) equal to the net accumulation rate constant. When the 2TCM model is valid, the slope will theoretically be equal to Kacc (equation 2). Thus, linear regression of the transformed data (straight line fitted to the data above t = t*) yields this macroparameter. The linear fits in this study were performed between 30 and 60 mins to correspond with previous analyses of human (Hagberg et al, 2002; Muzik et al, 1997) and rhesus monkey data (Lundquist et al, 2006; Shoaf et al, 1998; Shoaf et al, 2000).
Statistical Analysis
A two-way ANOVA for repeated measurements on both factors (ROI and tracer) was used for comparison of the parameters. The null hypothesis was rejected at a 5% significance level (Bonferroni post-test).
Results
Plasma Radioactivity
The time course of the radioactivity concentration in arterial plasma (input function) is shown in Figure 2A. The plasma-to-blood ratio was 0.8 to 0.9 at all measured time points for both tracers. The fraction of unmetabolised [11C]HTP in plasma decreased as the study progressed to 50% at 60 mins (Figure 2B). The major peripheral metabolite was [11C]HIAA; at the end of the scan, 39% of the total plasma radioactivity was associated with this metabolite.
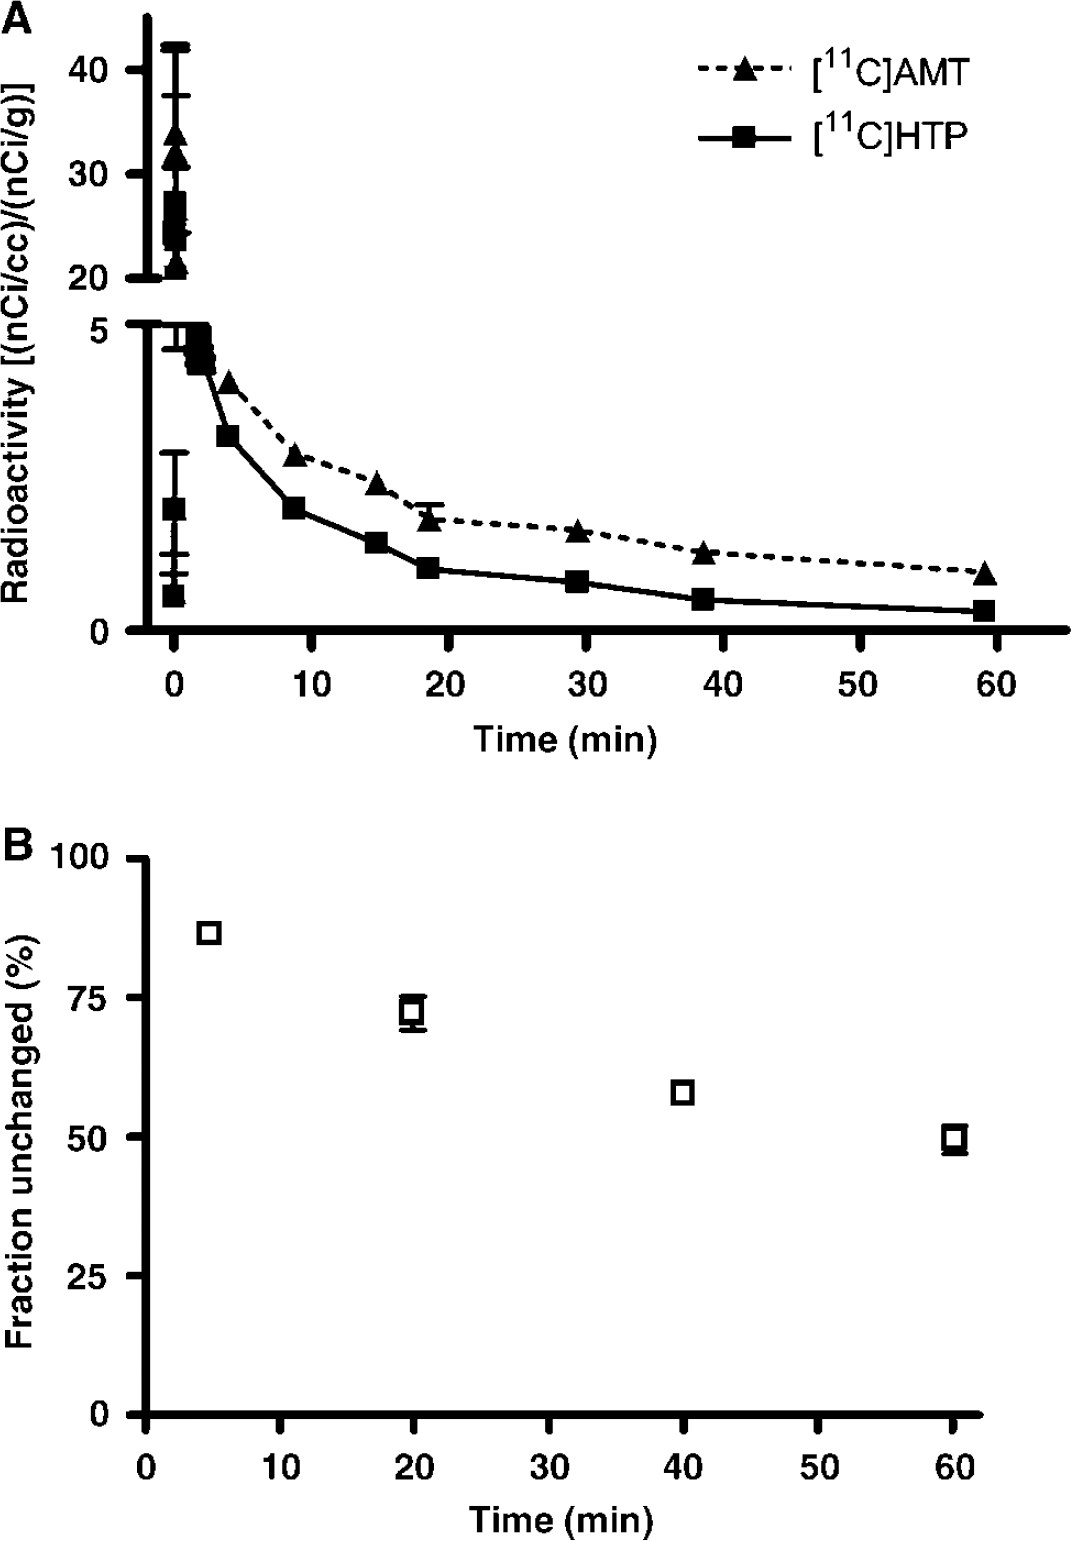
Plasma radioactivity concentrations (the input functions, normalised to accommodate the radioactivity dose and body weight) after injection of [11C]AMT and [11C]HTP (
Brain Tissue Radioactivity
Positron emission tomography images for the two radiotracers in one rhesus monkey are shown in Figure 3. The whole brain uptake of [11C]AMT and [11C]HTP was low, with only a small percentage of the injected dose present in the brain at peak values. Regional brain tissue radioactivity—time curves obtained after intravenous injection of [11C]AMT and [11C]HTP are shown in Figure 4. For [11C]AMT, there were no substantial differences in radioactivity concentrations among the outlined brain regions. The [11C]AMT radioactivity peaked later than the [11C]HTP-derived radioactivity. For [11C]HTP, the highest tissue radioactivity concentration was observed in the striatum. There were no substantial differences in radioactivity levels among the outlined extrastriatal brain regions for [11C]HTP. The striatal [11C]HTP-derived radioactivity concentration was almost the same as for [11C]AMT, but was higher for [11C]AMT in all other brain regions. This was expected, since the unchanged fraction of [11C]HTP in plasma available for brain uptake is lower than that of [11C]AMT after the same dose of radioactivity (Figure 2A).
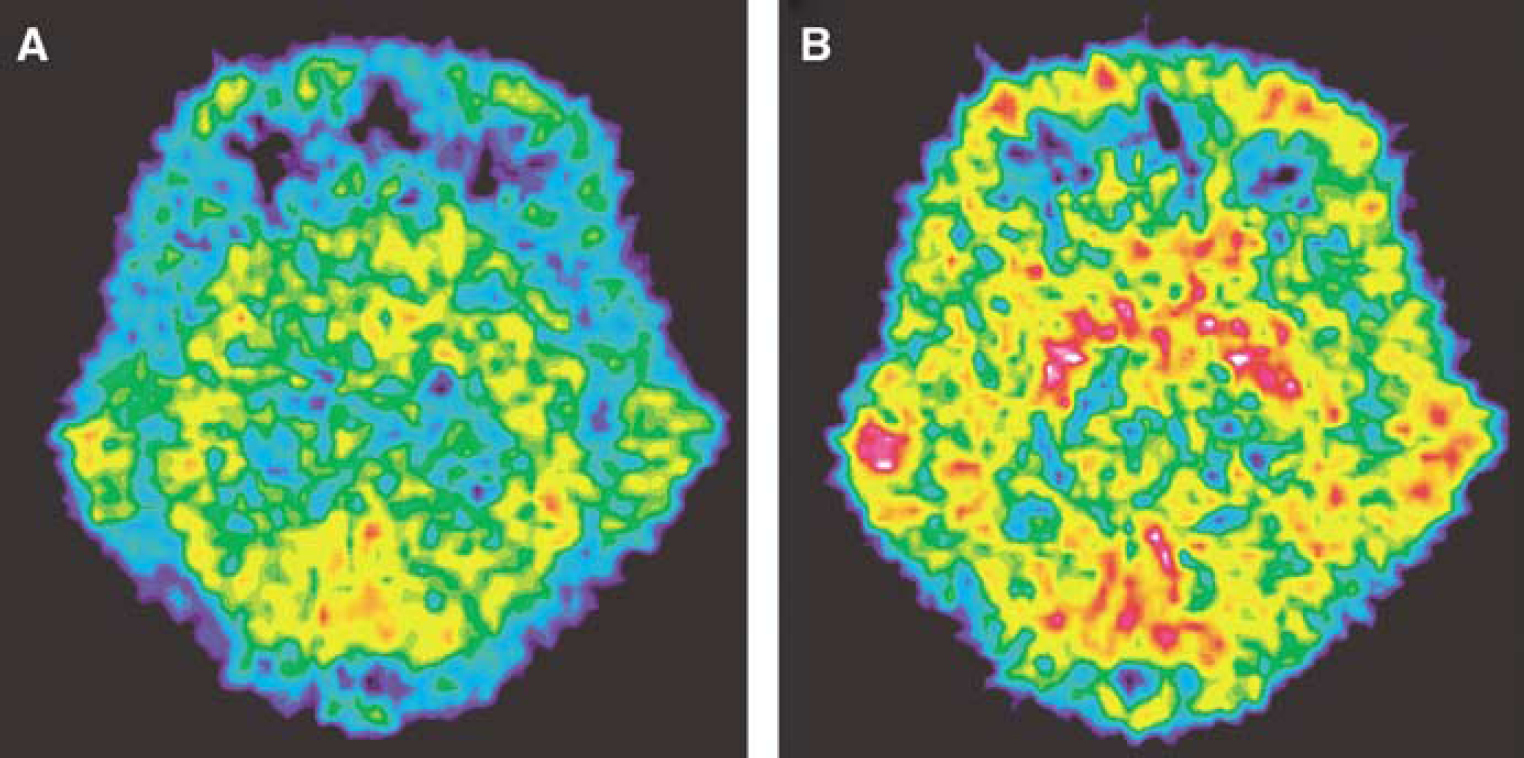
PET images for the radiotracers [11C]AMT (
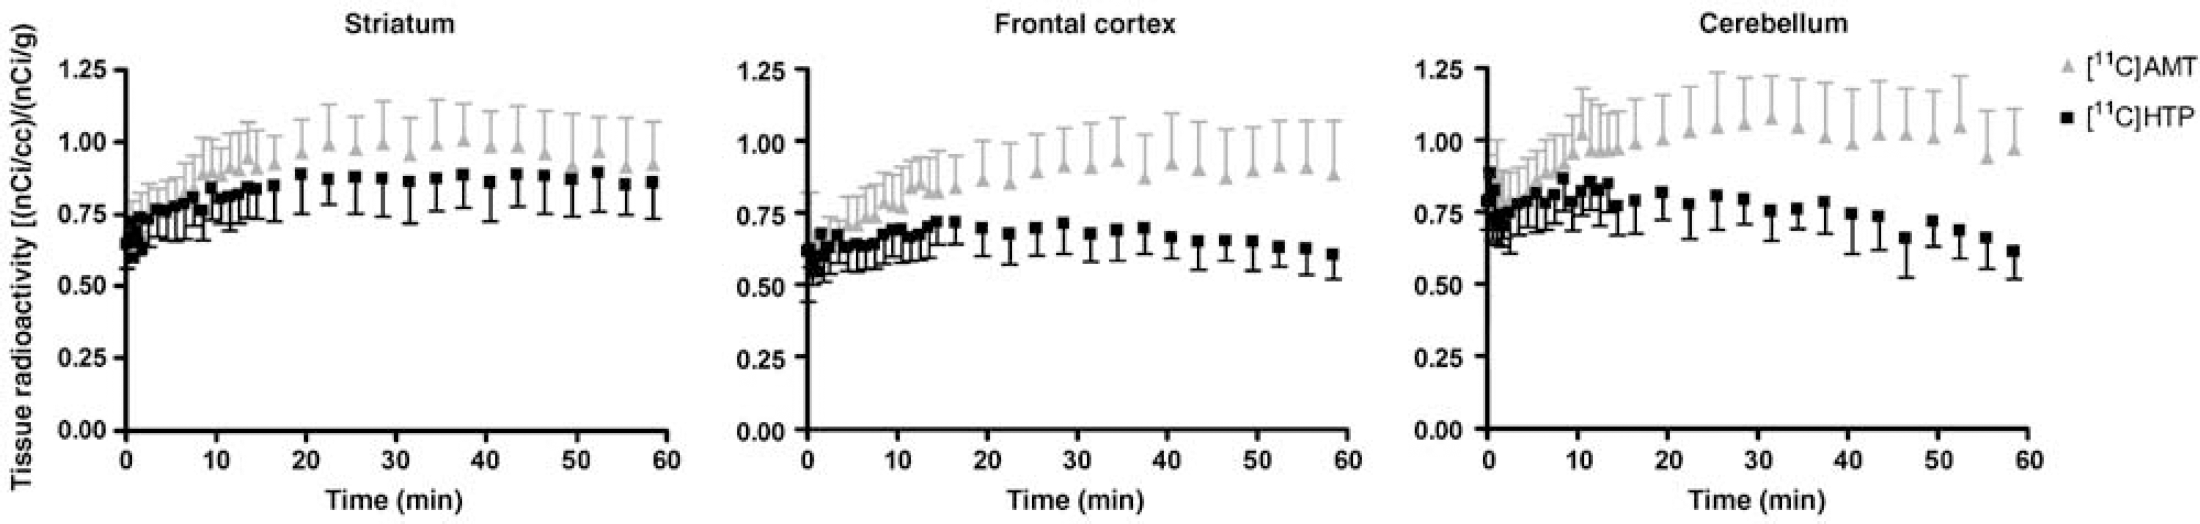
Total radioactivity—time curves in brain tissue (normalised for the radioactivity dose and body weight) after injection of [11C]AMT and [11C]HTR Data points represent means ± s.e.m. for four monkeys.
Kinetic Analysis
Results obtained using the 2TCM are presented in Table 1. Convergence was reached for 58 of 64 fits (four [11C]AMT and two [11C]HTP fits did not converge). Five of the six fits that did not converge came from the same PET experiment. The radioactivity signal was low, which probably contributed to the poor modelling of the data. The estimates of the individual rate constants and the net accumulation rate constant, Kacc, were highly variable for both tracers, as assessed by the relative standard deviation (100% s.d./mean). K1 was higher for [11C]HTP in the striatum (0.027 ± 0.009 versus 0.022 ± 0.008 mL/mL min) and thalamus (0.025 ± 0.011 versus 0.020 ± 0.008 mL/mL min) than for [11C]AMT (P < 0.05). In other brain regions, similar K1 values were observed for the two tracers. Compared with [11C]AMT, k3 was higher for [11C]HTP in the striatum (0.046 ± 0.024 versus 0.019 ± 0.006 mm-1) and thalamus (0.039 ± 0.013 versus 0.016 ± 0.007 min−1) (P < 0.05). In the same brain regions, Kacc was higher for [11C]HTP than the corresponding [11C]AMT scan value within the same monkey (P < 0.05).
Estimates of the individual rate constants (K1, k2, k3), the calculated free distribution volume (DV = K1/(k2 + k3)), and net accumulation rate constant (Kacc) after injection of [11C]AMT and [11C]HTP
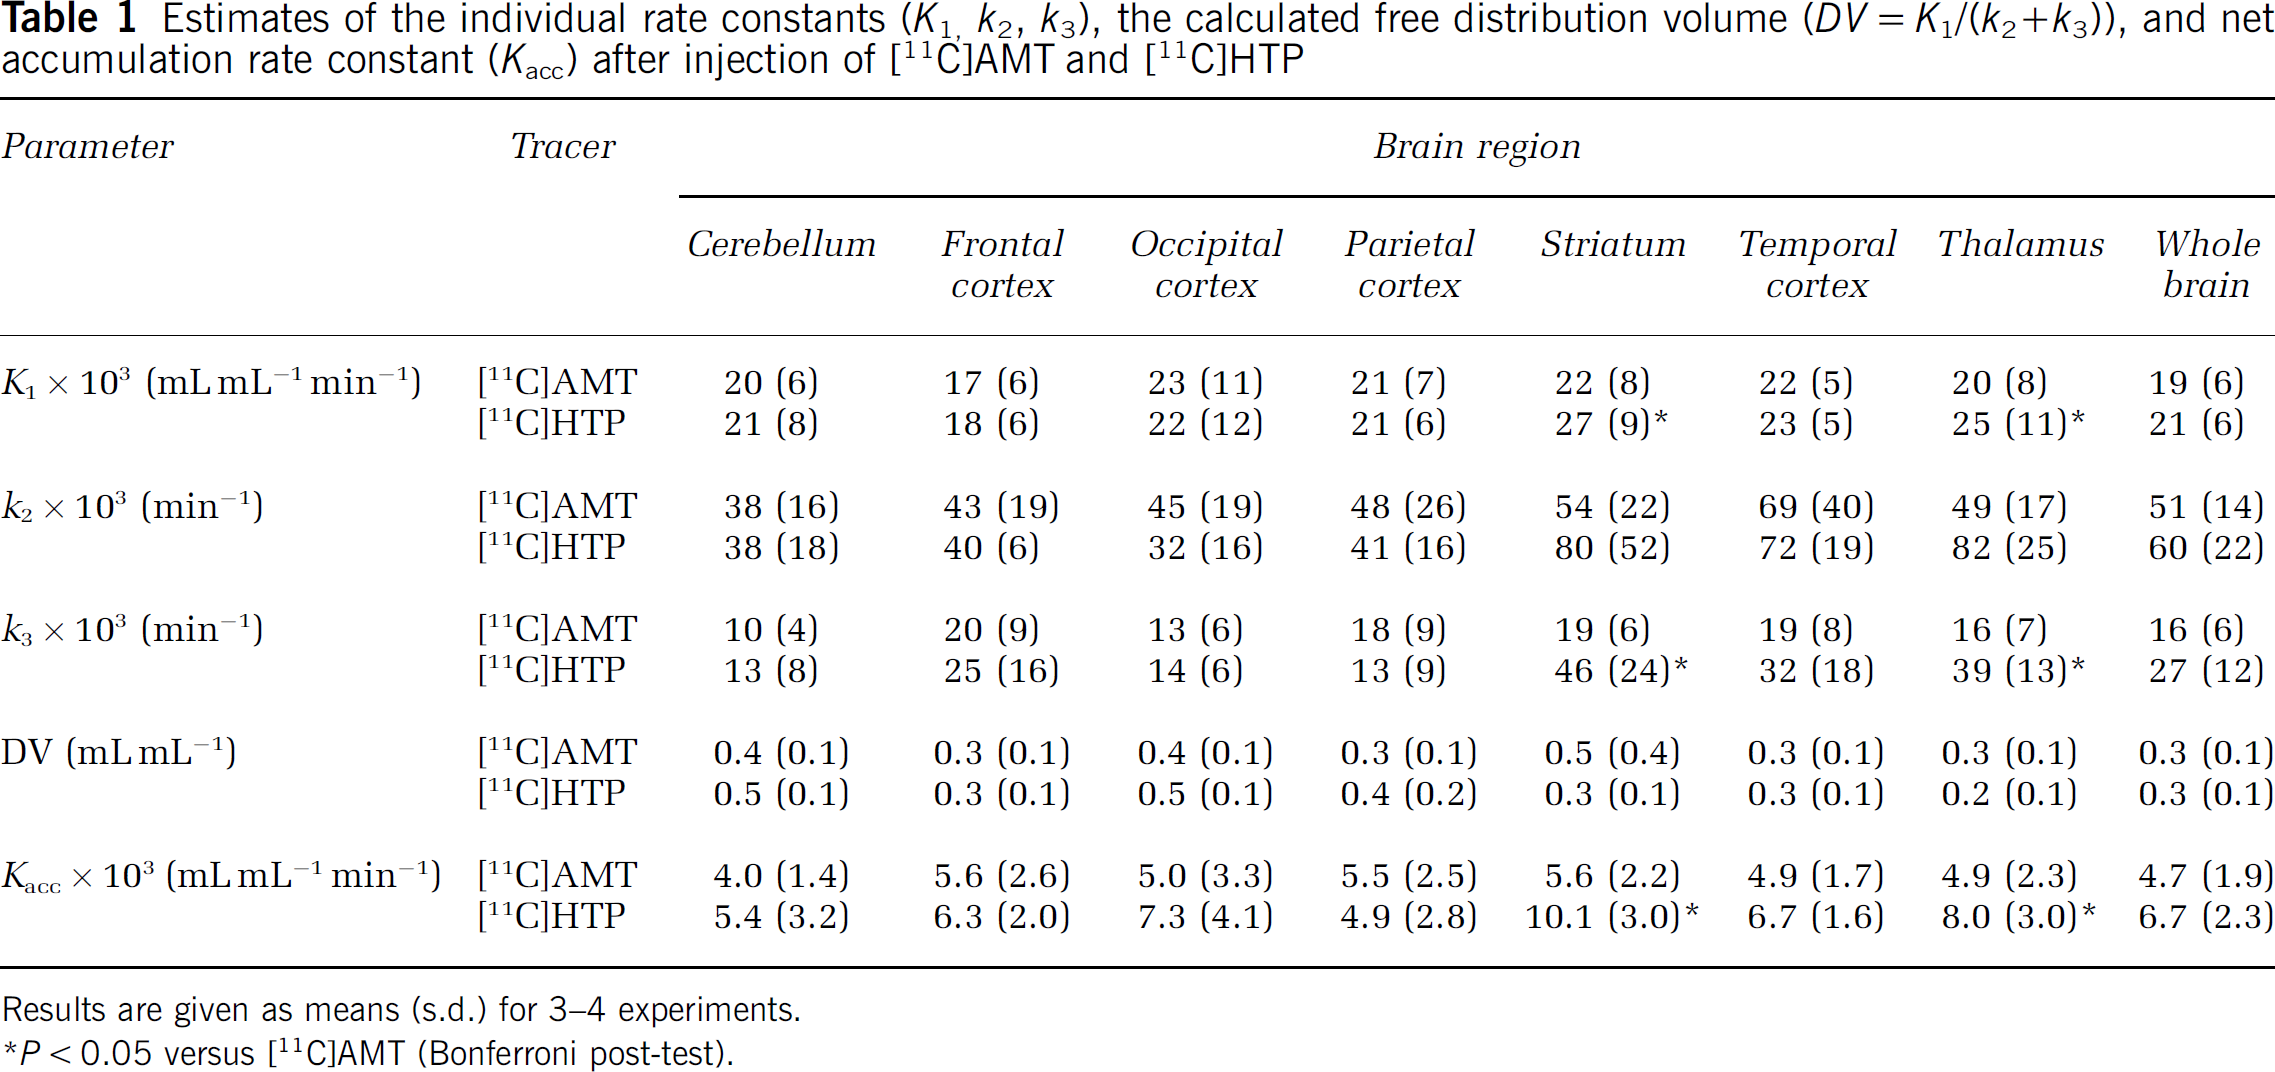
Results are given as means (s.d.) for 3–4 experiments.
P < 0.05 versus [11C]AMT (Bonferroni post-test).
Graphic Analysis
Examples of Patlak analysis of [11C]AMT and [11C]HTP data for one monkey are shown in Figure 5. The data indicate a linear relationship between the apparent partition coefficient (tissue: plasma ratio) for the brain regions and the normalised plasma concentration—time integral for both tracers from 30 to 60 mins of the experiment. The plots show that, with the same magnitude of the plasma input function, the net uptake over time is higher for [11C]HTP than for [11C]AMT.
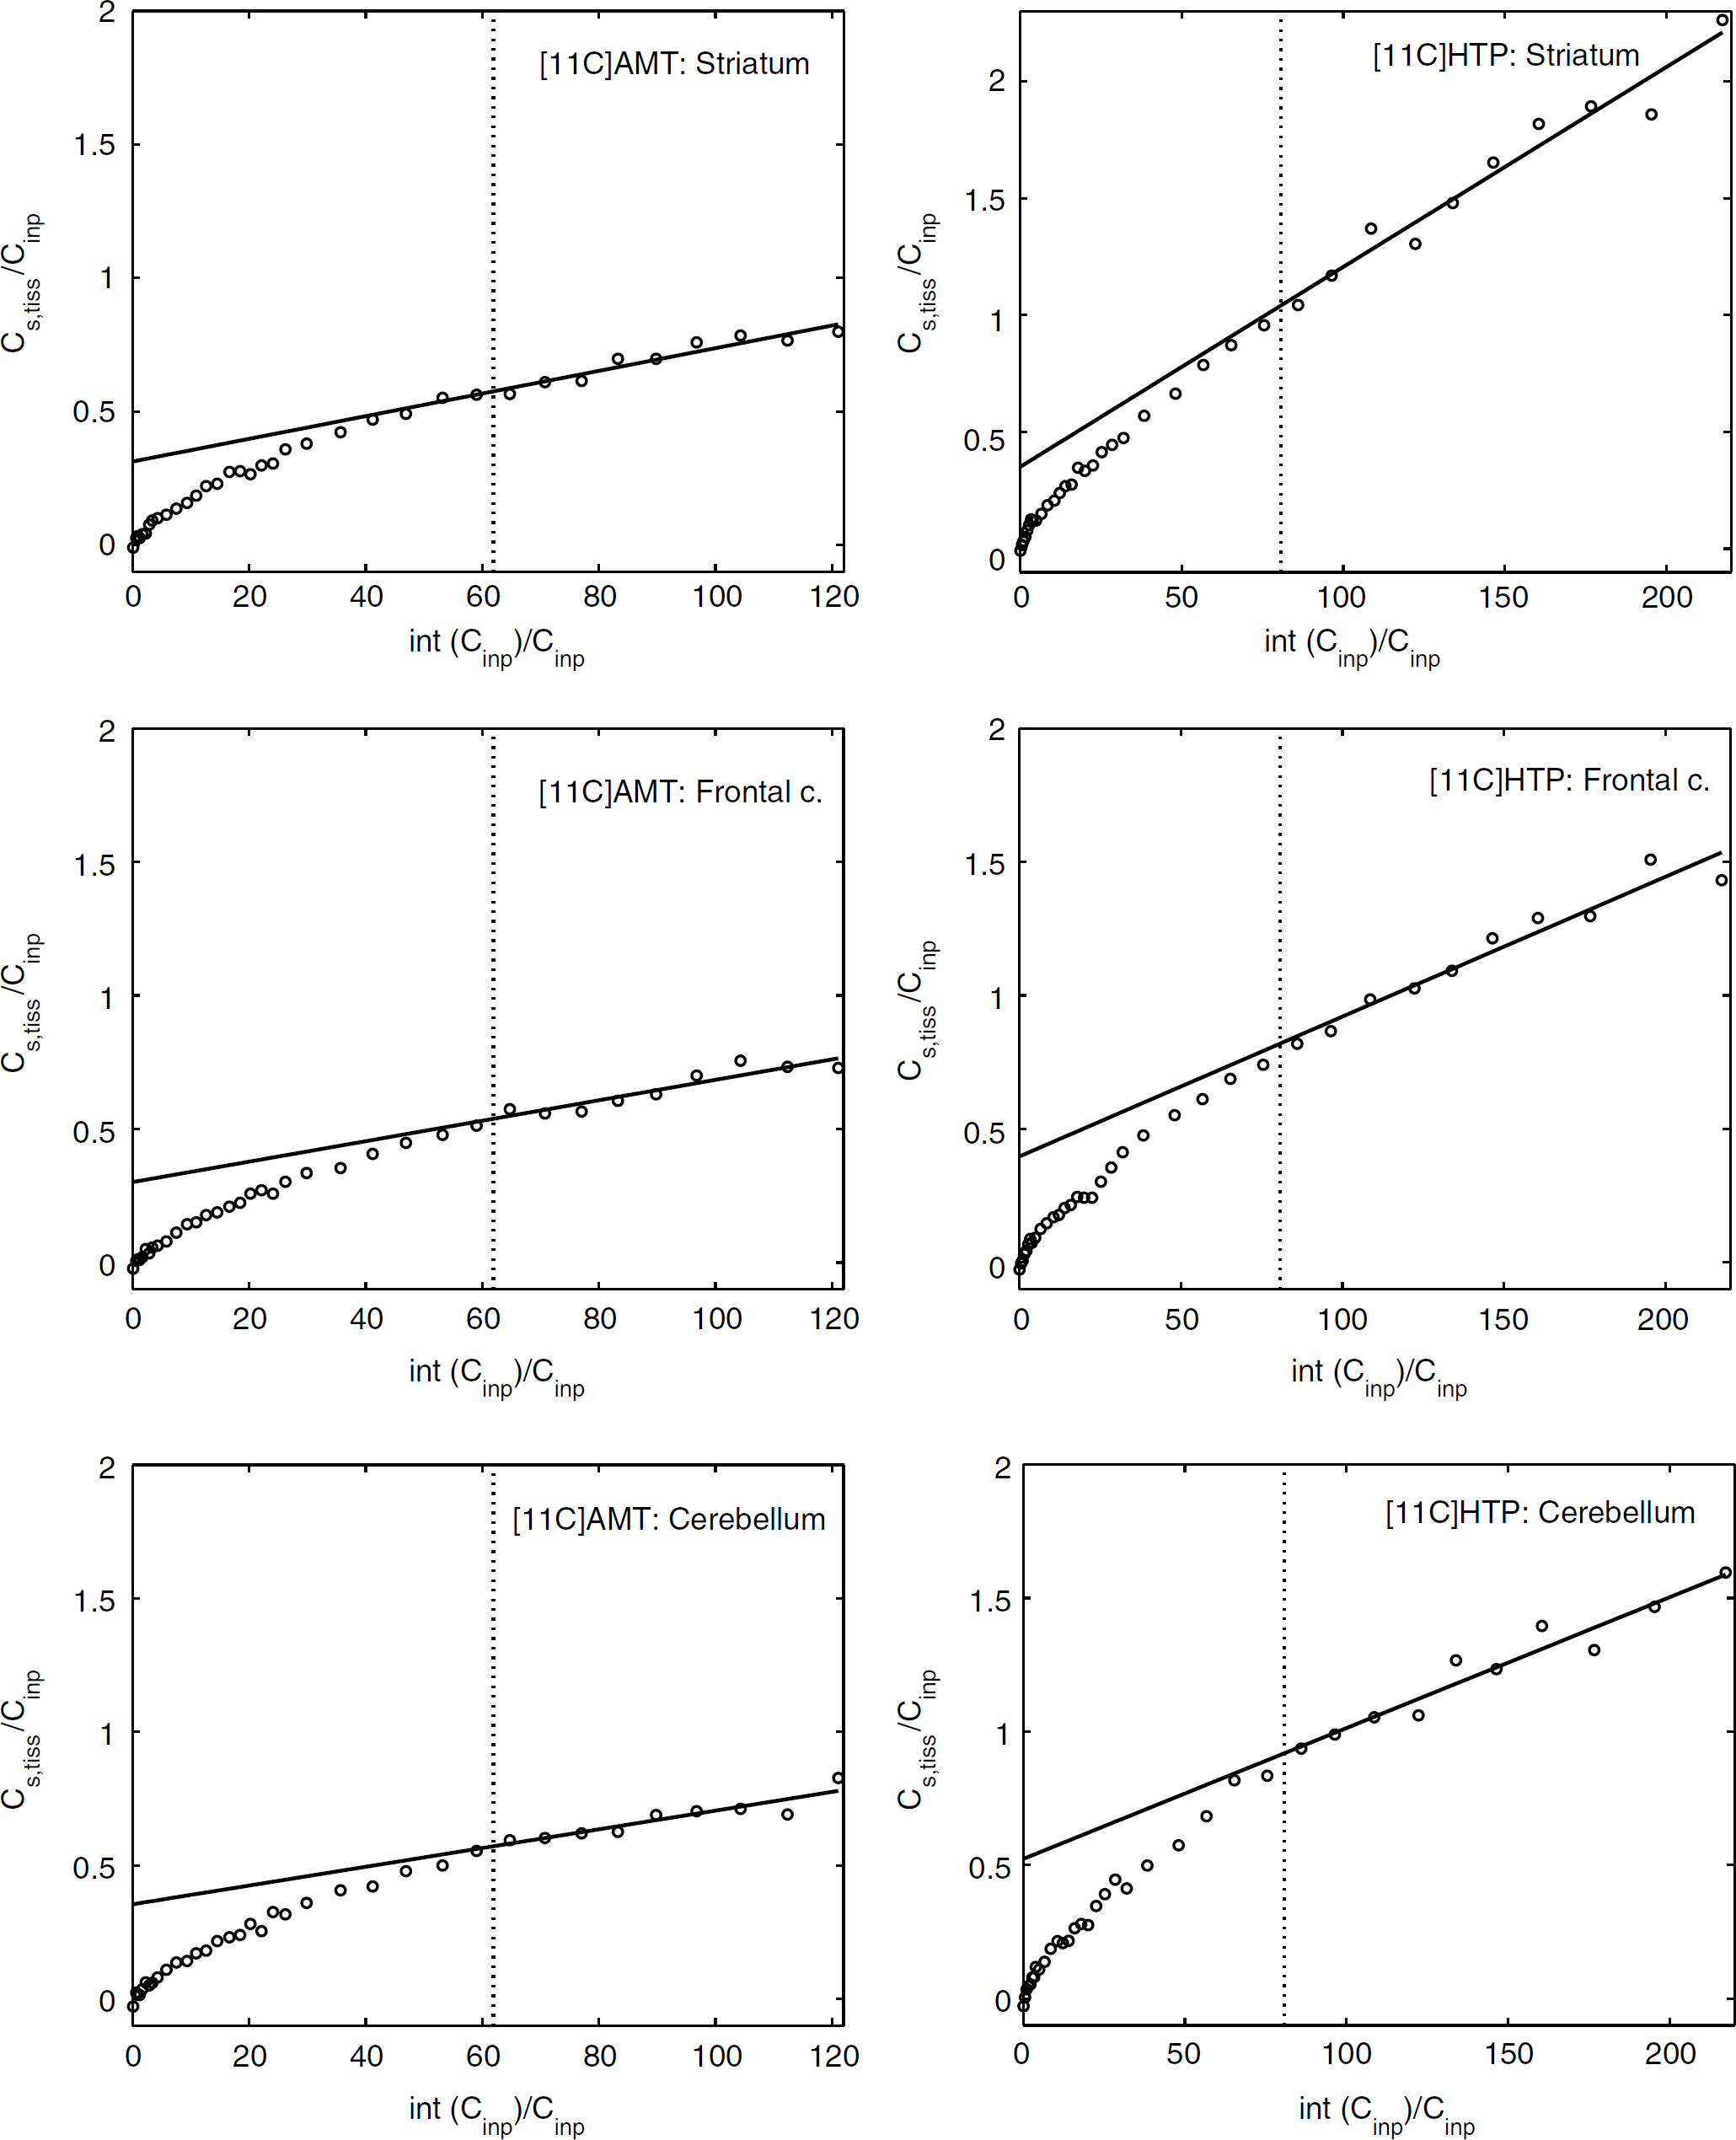
Patlak plots of the extent of tracer transport into a tissue (tissue:plasma) as a function of the exposure time (min) for [11C]AMT and [11C]HTP in the striatum (top graphs), frontal cortex (middle graphs), and cerebellum (bottom graphs) in one of the studied rhesus monkeys. Open circle: experimental data; solid line: linear fit from 30 to 60 mins after tracer injection; vertical dotted line: corresponds to 30 mins of actual time.
The result using graphic parameter estimation is shown in Table 2. In general, the Patlak fitted values (KpPat) agreed well with Kacc calculated from the individual rate constants. However, for [11C]AMT, the striatal KpPat value was lower than the corresponding Kacc value. In the occipital cortex, Kacc for [11C]HTP was higher than KpPat and showed greater variability. However, the two fits that did not converge for [11C]HTP in the kinetic analysis were from this particular brain region and the mean Kacc was therefore only based on estimates from two monkeys. The Patlak slope was higher for [11C]HTP in the striatum (0.009 ± 0.003 versus 0.004 ± 0.002 mL/mL min) and thalamus (0.008 ± 0.003 versus 0.005 ± 0.002 mL/mLmin) than the corresponding [11C]AMT scan value in the same monkey (P < 0.05).
Estimates of the macroparameter KpPat (Patlak slope, 30 to 60 mins) using the plasma input function after injection of [11C]AMT and [11C]HTP
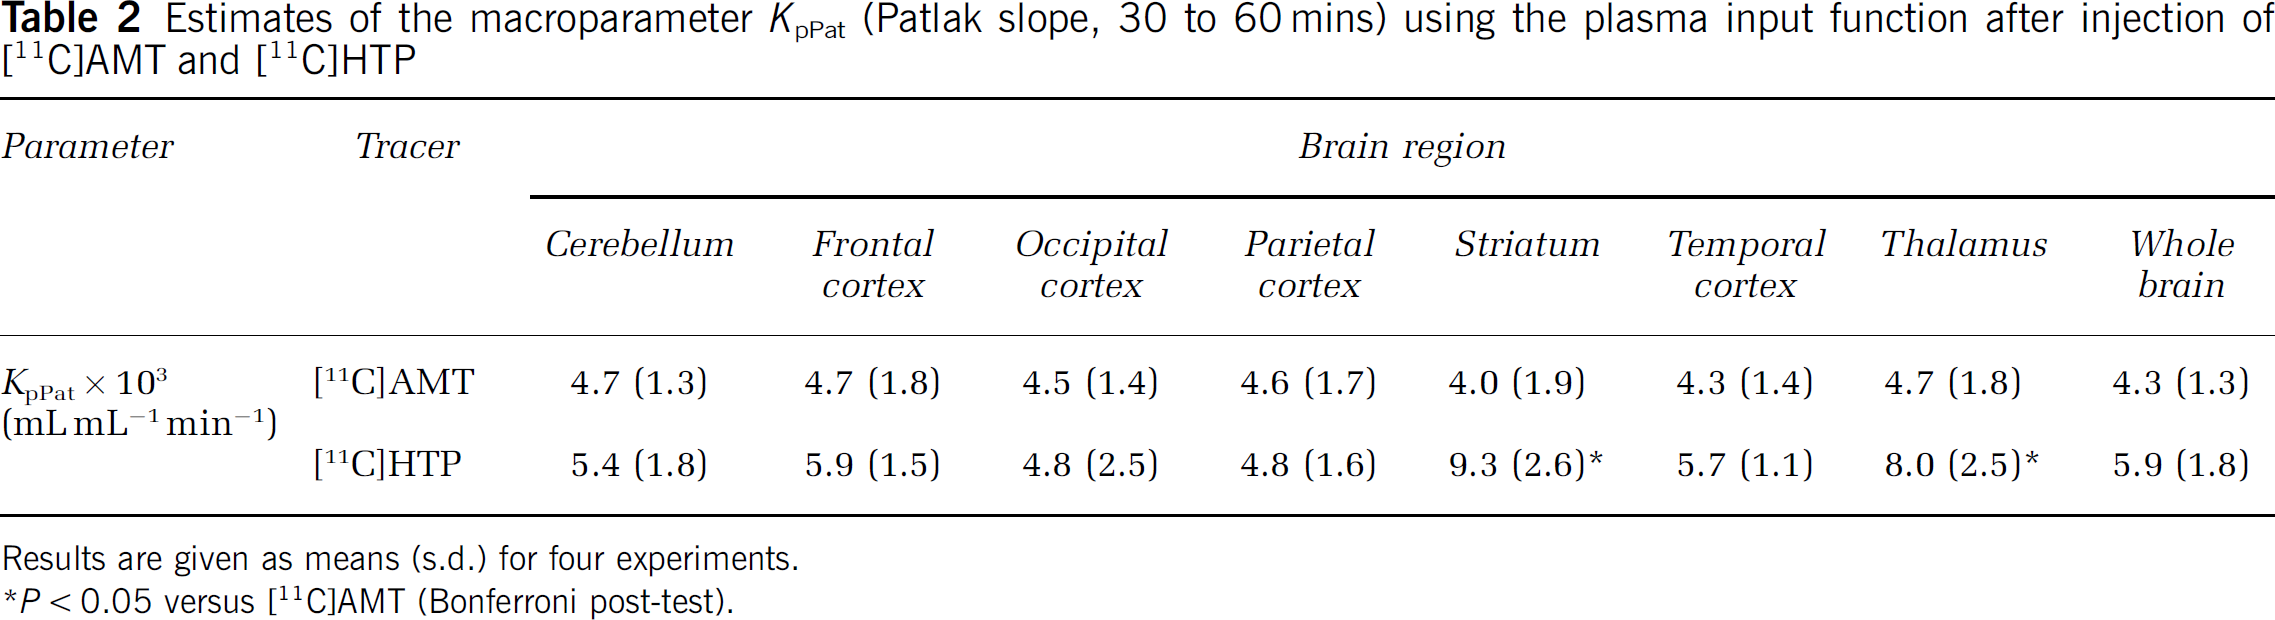
Results are given as means (s.d.) for four experiments.
P < 0.05 versus [11C]AMT (Bonferroni post-test).
Discussion
In this paper, a direct comparison of two tracers used in PET for probing the first and second enzymatic steps in the biosynthesis of 5HT is presented.
The only pathway available for blood-borne amino acid entry to the brain is carrier-mediated transport through the blood—brain barrier (Pardridge, 1998). For large neutral amino acids (LNAA: tryptophan, tyrosine, phenylalanine, valine, isoleucine, and leucine), the barrier across cell membranes, including the blood—brain barrier, comprises the sodium-independent L system (Pardridge and Oldendorf, 1977). The entry of plasma HTP into the brain is competitive with
Shoaf et al (1998, 2000) and Gharib et al (1999) argued that [11C]AMT cannot be used to measure 5HT synthesis since only a fraction of the AMT taken up into the tissue is converted to AM-5HT. In monkeys, approximately 2% to 4% of the total radioactivity in the dorsal raphe nucleus was [14C]AM-5HT after 90 mins (Shoaf et al, 2000). These research groups both concluded that [11C]AMT is primarily a measure of brain uptake of tryptophan and cannot be related to 5HT synthesis. A further concern was that tryptophan is also a substrate for protein synthesis. However, in subsequent autoradiographic studies, Diksic and co-workers showed that pharmacological inhibition of tryptophan hydroxylase with p-chlorophenylalanine (Tohyama et al, 2002) or AGN-2979 (Hasegawa et al, 2005) decreased the unidirectional trapping of [14C]AMT. A protein synthesis inhibitor (cycloheximide) was also examined but this had no effect on [14C]AMT trapping in brain tissue (Tohyama et al, 2002). These findings suggest that brain trapping of [14C]AMT relates to brain 5HT synthesis but not to brain protein synthesis.
In the present study, the rank order of the net accumulation rate constant measured with [11C]HTP/PET was in agreement with previous post-mortem regional HTP accumulation rates in the rhesus monkey brain (Brown et al, 1979), namely: highest in the striatum, intermediate in the thalamus and lowest in cortical areas. While there were no substantial differences in Kacc for [11C]AMT among the outlined brain regions, this was consistent with the results of an earlier study in rhesus monkeys (Shoaf et al, 2000). Thus, in contrast to two previous reports (Hagberg et al, 2002; Leyton et al, 2005), the net accumulation rate constants of [11C]HTP and [11C]AMT were not well correlated. Previously, it was observed that the rank order of regional [11C]AMT K-complex (or KpPat) values in humans matched that of the 5HT content, but the contrast (i.e. magnitude of difference) between brain regions was much lower for K-complex than for 5HT content (Chugani and Muzik, 2000). The authors interpreted the difference to mean that there is a large unmetabolised pool of [11C]AMT trapped in brain tissue. This might also explain the discrepancy between [11C]AMT and [11C]HTP in the regional contrast of the net accumulation rate constant seen in our study.
In this study, the compartmental analysis results for the net accumulation rate constant were compared with those obtained using the graphic method of Patlak. In view of the limited PET scanning time, it was critical for the linearity to appear early enough for accurate parameter estimation from the Patlak slope. In some regions, the Patlak plot linearity appeared later for [11C]AMT than for [11C]HTP. However, the graphically obtained estimates of the net accumulation rate constant for [11C]AMT were quite similar to or somewhat lower (striatum) than the corresponding values of the kinetic analysis. In a previous study using labelled AMT in rhesus monkeys, the final slope of the Patlak curve at 180 mins was small and not statistically different from zero (Shoaf et al, 2000). This limiting, almost horizontal Patlak distribution indicates that the tracer should be treated as reversible during extended measuring times (180 mins). A possible mechanism for the reversible kinetics can be derived from the observation that the rate constant for the [11C]HTP transfer out of the brain (k2) is substantial. If [11C]AMT follows the endogenous 5HT synthesis pathway, it will first be transformed into [11C]AM-HTP before it is converted into [11C]AM-5HT. It is, thus, likely that [11C]AM-HTP may leave the tissue via the same transport process as [11C]HTP. Such a mechanism might also be a factor behind the lower regional contrast observed for [11C]AMT than for [11C]HTP.
It seems reasonable that the measures obtained with these PET tracers should be different as the tracers target different enzymes that differ in their enzyme activity in the brain (Ichiyama et al, 1968). In recent autoradiographic studies, pharmacological inhibition of tryptophan hydroxylase with p-chlorophenylalanine or AGN-2979 decreased the unidirectional trapping of [14C]AMT (Hasegawa et al, 2005; Tohyama et al, 2002). In rats (Lindner et al, 1997) and rhesus monkeys (Lundquist et al, 2006), pharmacological inhibition of AADC by NSD1015 decreased the trapping rate constant of [11C]HTP. This suggests that Kacc of [11C]AMT gives a reasonable estimate of the activity of tryptophan hydroxylase while Kacc of [11C]HTP is providing an in vivo index of the activity of the decarboxylating enzyme AADC. In the present study, the extent and distribution of the irreversible binding of [11C]AMT was different from those for [11C]HTP. This also suggests that the two probe compounds provide estimates related to the enzyme activity of the different targeted steps. However, more in vivo validation studies involving drugs inhibiting the enzymes involved in 5HT formation need to be investigated if more general conclusions are to be drawn about the suitability of these tracers for estimating 5HT synthesis. It would be interesting to study the effect of a tryptophan hydroxylase inhibitor on [11C]HTP accumulation in vivo as well as possible reasons for the high tracer accumulation seen in striatal regions. Given the high level of dopaminergic innervation in the striatum, it seems likely that the discrepancy between the tracer accumulation in the striatum and that in other areas is due to the presence of AADC in dopaminergic terminals. Further, the combination of the two tracers in this study might provide a deeper insight into the pathways of tryptophan in the brain tissue. In certain pathologic states, the accumulation of [11C]AMT in tissue may represent metabolites of the kynurenine pathway rather than of 5HT synthesis. Thus, the combination [11C]HTP/[11C]AMT might provide a measure to distinguish between these two metabolic pathways as the two tracers probe different enzymatic steps. Further, in light of the large unmetabolised pool of [11C]AMT in contrast to the rapidly metabolised [11C]HTP, a combination might also be useful when investigating the regulation of amino acid transport across cell membranes and the distribution into different tissue compartments.
In conclusion, the PET tracers [11C]AMT and [11C]HTP might be useful for in vivo monitoring of 5HT synthesis capacity. Additional pharmacological in vivo studies using enzyme-inhibiting drugs in 5HT formation need to be performed, if more general conclusions are to be drawn about their respective predictive capacity of 5HT synthesis. The validated methodologies could be used to address a wide range of issues relevant to the regulation of enzyme activity and mechanisms of psychiatric and neurologic disorders.
Footnotes
Acknowledgements
The authors are grateful to the staff of the Uppsala Imanet Radiopharmaceutical Department, especially Madeleine Svennebäck, for producing [11C]AMT and [11C]HTP. The authors are also grateful to Gudrun Nylén (anaesthesia), Magnus Roman, and Helena Wilking (metabolite analysis) whose excellent technical skills made this work possible.