
Abstract
The effect of deep barbiturate anesthesia on brain glucose transport, TCA cycle flux, and aspartate, glutamate, and glutamine metabolism was assessed in the rat brain in vivo using 13C nuclear magnetic resonance spectroscopy at 9.4 T in conjunction with [1-13C] glucose infusions. Brain glucose concentrations were elevated, consistent with a twofold reduced cerebral metabolic rate for glucose (CMRglc) compared with light α-chloralose anesthesia. Using a mathematical model of neurotransmitter metabolism, several metabolic reaction rates were extracted from the rate of label incorporation. Total oxidative glucose metabolism, CMRglc(ox), was 0.33 ± 0.03 μmol·g−1 · min−1. The neuronal TCA cycle rate was similar to that in the glia, 0.35 ± 0.03 μmol · g−1 · min−1 and 0.26 ± 0.06 μmol · g−1 · min−1, respectively, suggesting that neuronal energy metabolism was mainly affected. The rate of pyruvate carboxylation was 0.03 ± 0.01 μmol·g−1 · min−1. The exchange rate between cytosolic glutamate and mitochondrial 2-oxoglutarate, Vx, was equal to the rate of neuronal pyruvate dehydrogenase flux. This indicates that Vx is coupled to CMRglc(ox), implying that the malate-aspartate shuttle is the major mechanism that facilitates label exchange across the inner mitochondrial membrane. The apparent rate of glutamatergic neurotransmission, VNT, was 0.04 ± 0.01 μmol·g−1 · min−1, consistent with strong reductions in electrical activity. However, the rates of cerebral oxidative glucose metabolism and glutamatergic neurotransmission, CMRglc(ox)/VNT, did not correlate with a 1:1 stoichiometry.
Glucose is the major fuel required to maintain normal brain function. At rest, the brain accounts for a major fraction of the body's oxidative glucose consumption even though the brain accounts only for a fraction of body mass. The brain thus has a high glucose metabolic activity, which is known to be modulated by brain function (Magistretti, 1999). In addition, a number of anesthetics can affect the rate of cerebral glucose metabolism. Of these, barbiturates can have a profound effect on brain function; they are known to depress cerebral glucose utilization and electrical activity (Hodes et al., 1985; Nilsson and Siesjo, 1975; Sokoloff et al., 1977; Strang and Bachelard, 1973).
Barbiturates are known to depress metabolism by inhibiting the oxidation of NADH in the respiratory chain (Aldridge and Parker, 1960; Chance and Hollunger, 1963). In cell cultures, barbiturates have been shown to reduce neuronal glutamate release and to inhibit astro-cytic glutamate uptake (Qu et al., 1999; Swanson and Seid, 1998). Most studies suggest that barbiturates have an effect on both glial and neuronal cells, although depression of oxygen uptake and CO2 production from glucose has been more profound in neuronal cell cultures than in astrocyte cell cultures (Hertz et al., 1986; Yu et al., 1983).
Barbiturates can induce a near complete depression of the electrical activity in the brain (Contreras et al., 1999; Yamazaki et al., 1994) and glutamatergic neurotransmission can be greatly reduced under such conditions. Glutamatergic action occurs by neuronal release of glutamate into the synaptic cleft, interaction with postsynaptic receptors, and elimination of glutamate from the synaptic cleft by uptake into neighboring cells, and uptake into astrocytes is the dominant if not exclusive process (Bergles and Jahr, 1998; Danbolt, 2001). To maintain the nerve terminal glutamate concentration, the glutamate taken up by the astrocytes is converted to glutamine, which is electrophysiologically inactive, and then transported to the neuron and converted back to glutamate to be packaged into vesicles ready for renewed release. Hence, the cycling of carbon between the large neuronal pool of glutamate and the large glial pool of glutamine can be indicative of the rate of glutamatergic action.
Using 13C nuclear magnetic resonance (NMR) spectroscopy, label incorporation into glutamate and glutamine can be measured in vivo (Gruetter et al., 1994; Sonnewald et al., 1997) and cerebral compartmentation can be assessed noninvasively (Gruetter et al., 1994, 2001; Shen et al., 1999; Sibson et al., 1998). We sought to assess the rates of cerebral metabolism in deep pentobarbital anesthesia in the intact rat brain in vivo. Under conditions of greatly depressed electrophysiologic activity, we expect the label transfer from glutamine to glutamate to be nearly completely suppressed. Previously, the condition of deep pentobarbital anesthesia was studied in vivo using 13C NMR spectroscopy by measuring label incorporation into the glutamate C4 and glutamine C4 positions only, and it was assumed that isoelectricity results in zero transfer of glutamate from neurons to glia (Sibson et al., 1998). The measurement of more label incorporation curves reduces the number of constraints and assumptions made in the modeling (Gruetter et al., 2001). To interpret labeling of glutamate and glutamine, the compartmentation of cerebral energy metabolism into at least a neuronal and a glial compartment is needed, and the metabolism in these two compartments needs to be distinguished from glutamatergic action.
In the present study, we have extended our previous methodology and modeling to the deeply anesthetized rat brain to assess the rate of several key fluxes simultaneously. In addition, we have combined this measurement for the first time with the direct measurement of cerebral glucose concentrations, which permits insight into the degree of depression on net glucose uptake into the brain. According to the finding by Sibson et al. (1998), oxidative glucose metabolism was close to zero at isoelectricity in the brain, and thus the concentration of brain glucose (on a per milliliter brain water basis) is expected to be close to that in plasma, given the nature of the glucose transport process by facilitated diffusion (Gjedde, 1992). Finally, we assessed the exchange rate between the mitochondrial TCA cycle intermediate 2-oxoglutarate and the cytosolic amino acid glutamate, Vx, under conditions of extremely depressed cerebral metabolism. We previously reported that Vx is on the order of the flux through pyruvate dehydrogenase, VPDH (Gruetter et al., 2001). Since oxidative glucose consumption in the brain is largely through pyruvate dehydrogenase, the reducing equivalents produced in glycolysis must be oxidized. Under normoxic conditions, the reducing equivalents are transported into the mitochondrion by several shuttles. Of these shuttles, the malate-aspartate shuttle is believed to be the most active in the brain. The exchange of carbon between mitochondrial 2-oxoglutarate and cytosolic glutamate occurs as an integral part of the malate-aspartate shuttle. Provided that the malate-aspartate shuttle is a major contributor to Vx, this exchange rate can depend on the rate of oxidative glucose consumption, CMRglc(ox), and thus affect the calculated metabolic rates, that is, VPDH, from glutamate turnover curves. All previous modeling of cerebral energy metabolism in the living rat brain, however, was done under the assumption that this exchange rate, Vx, is very fast compared with VPDH and that the net transport of reducing equivalents by the malate-aspartate shuttle is only a minor contributor to Vx. This assumption was made based on modeling of data from a single study, which was conducted in the awake, paralyzed rat (Mason et al., 1992). Based on our previous findings in the human brain (Gruetter et al., 2001), we expected Vx to vary in conjunction with changes in the flux through the pyruvate dehydrogenase complex in different metabolic conditions. Thus, this study is also the first to evaluate whether the exchange rate, Vx, indeed varies under conditions of greatly depressed cerebral metabolism.
MATERIALS AND METHODS
Animal preparation
The study was performed according to the guidelines for the care and use of laboratory animals at the University of Minnesota and was approved by the Institutional Animal Care and Use Committee (IACUC). Male Sprague-Dawley rats (n = 5, 246 ± 21 g, mean ± SD) were fasted overnight with access to water before studies. Animals were anesthetized using 2% isoflurane (Marsam Pharmaceuticals, Cherry Hill, NJ, U.S.A.) in a 1:1 mixture of nitrous oxide (N2O) and oxygen (O2) gases for surgery. The animals were then intubated and ventilated with a pressure-driven ventilator (Kent Scientific, Litchfield, CT, U.S.A.). End tidal CO2 was monitored during surgery and experiments with a capnometer (SC-300; BCI International, Waukesha, WI, U.S.A.). Catheters were inserted into both femoral arteries for blood gases and glucose analyses, and monitoring of arterial blood pressure, and also inserted into both femoral veins for intravenous infusion of pentobarbital and glucose. Arterial blood pressure and respiratory rate and pattern were continuously monitored with a multitrace recorder (AcqKnowledge, Biopak, CA, U.S.A.).
Right after surgery, anesthesia was switched to pentobarbital solution (10 mg/mL; Abbott Laboratories, North Chicago, IL, U.S.A.) administered intravenously (80 mg · kg−1 · h−1)to induce an isoelectric deep anesthesia state according to a previous report (Contreras et al., 1999). The animals were secured using a home-built Delrin holder with a bite bar and two ear-inserts to provide a fixed position of the skull. The animal was then placed in an acrylic holder attached to an insert in the gradient coil to ensure stability of the experimental setup during experiments. Body temperature was maintained at 37.0 ± 0.5°C with a warm water circulation system based on a feedback obtained from a rectal temperature probe (Cole Palmer, Vernon Hills, IL, U.S.A.).
Ninety-nine percent-enriched [1-13C] D-glucose (20% wt/vol solution; Isotec Inc., Miamisburg, OH, U.S.A.) was infused into the left femoral vein according to a previously described protocol to achieve rapid 13C enrichment of plasma glucose (Choi et al., 1999). In brief, the glucose infusion protocol was as follows: After an initial infusion rate of 1.30 g · kg body wt−1 · min−1 for 6 seconds and 0.26 g · kg body wt−1 · min−1 for 30 seconds, infusion rates were dropped in an exponentially decaying fashion over 16 minutes. Subsequently, the infusion rate of glucose (0.024 to 0.030 g · kg body wt−1 · min−1) was adjusted based on continuous monitoring of the NMR signals of brain glucose and the concomitantly measured plasma glucose concentrations to achieve stable target glycemic levels. At the end of amino acid turnover study, the infusion rate of glucose was increased in a stepwise fashion to achieve new steady-state target glycemia for the measurement of glucose transport kinetics. Arterial blood was withdrawn from the femoral artery through a Teflon-tubing line (Spectrum Chromatography, Houston, TX, U.S.A.) for blood gas analysis (PCO2,PO2) and glucose measurements. Blood was immediately centrifuged after sampling, and plasma glucose concentrations were measured using a hexokinase method (Sigma, St. Louis, MO, U.S.A.). The concentration of whole blood glucose was also measured using a glucose oxidase method (Roche Diagnostics, Indianapolis, IN, U.S.A.) and calibrated against the plasma glucose measurements. Physiologic parameters were adjusted and maintained within normal ranges throughout experiments.
Nuclear magnetic resonance methods
All experiments were performed on a 9.4-T, 31-cm-bore horizontal magnet (Magnex Scientific, Abingdon, U.K.), interfaced to a Varian INOVA console (Varian, Palo Alto, CA, U.S.A.). An actively shielded gradient coil (Magnex Scientific, Abingdon, U.K.) with an 11-cm inner diameter was used, which was capable of switching 300 mT/m in 500 μs. A quadrature 1H surface RF coil (14-mm diameter) and a linear three-turn 13C coil (12-mm diameter) was used as a transceiver for 1H MRI and 13C NMR (Adriany and Gruetter, 1997). A 99% 13C-enriched formic acid sphere was located at the center of the linear coil as an external reference, and the coil was placed on the animal's head directly over the brain. The position of the brain was identified by T1-weighted images acquired using a fast low-angle shot sequence (repetition time [TR] = 10 ms, echo time = 5 ms). The volume of interest (VOI) was placed in the brain and a nominal 510-μL volume was the typical size of VOI. Three-dimensional localization based on outer volume saturation was used to ensure complete elimination of signals from extracerebral tissues as demonstrated previously (Choi et al., 1999, 2000). The efficiency of localization was verified from the absence of the natural abundance lipid signal (30.5 ppm) in spectra optimized for the amino acid region (20 to 40 ppm) because the lipid signals are not detectable in the normal brain. The localized signals (64 scans) of glycogen and glucose were acquired with spectrometer offset set to 100 ppm (TR = 1 second) and interleaved with acquisition of localized signals (64 scans) from the amino acid region with spectrometer offset set to 30.5 ppm (TR = 1.5 second) to minimize chemical shift displacement errors.
The 13C-labeled glutamate, glycogen, and glucose resonances were quantified using the external reference method as described previously (Choi et al., 1999; Gruetter et al., 1998b). In short, in vivo 13C NMR signals were quantified by comparison with the measurements of solutions containing 250 mmol/L glutamate, ∼400 mmol/L natural abundance oyster glycogen and 0.9 mmol/L of 99%-enriched [1-13C] D-glucose. The external reference measurements were performed under identical experimental conditions as in vivo. The corrections of coil-loading effect on sensitivity were assessed by measuring the pulse duration of 180° for a square pulse applied to the signals of the 13C formic acid, which is placed at the center of the 13C coil. The nuclear Overhauser effect (NOE) and T1 effects were corrected by measuring the saturation factors from the 13C signals with a TR of 7.5 seconds without NOE generation, which is more than fivefold longer than the T1 of the metabolites (Choi et al., 2000).
Spectra were analyzed using the peak-fitting algorithm supplied by the spectrometer software. To reduce variability, peak line widths of 13C-13C doublets were set to that of the corresponding center peak, and the frequencies of the 13C-13C doublets were set relative to the main resonance in spectra based on their relative position determined in spectra summed for 1 hour at isotopic steady state. Concentrations of 13C label, e.g., 13Glu4, were calculated from the area of the fitted peaks, including the doublets. The residual was visually inspected to verify proper convergence of the peak fitting routine.
Isotopic enrichment was measured in spectra following summation of 32 spectra acquired toward the end of the study at isotopic steady-state using isotope isomer (isotopomer) analysis (Jeffrey et al., 1999). Since those glutamate molecules labeled at C4 that have a C3 labeled as well are represented by the doublet at glutamate C4, that is [3,4-13C2]Glu, the isotopic enrichment of glutamate C3 is given by the relative amount of doubly labeled glutamate C4, i.e., IE(13Glu3) = [3,4-13C2]Glu/13Glu4. Likewise, the isotopic enrichment of glutamate C4 can then be calculated from the relative amount of 13C incorporated into glutamate C4 and the isotopic enrichment of glutamate C3, as follows: IE(13Glu4) = IE(13Glu3) 13Glu4/13Glu3. The same pertinent equations hold true for the glutamine C3 and C4, respectively. From the quantification of the amount of 13C label incorporated and the isotopic enrichment at the given position, the total pool size of glutamate and glutamine was calculated.
Modeling 13C label turnover curves
We used a recently described mathematical model of compartmentalized neurotransmitter metabolism (Gruetter et al., 2001) to derive the following metabolic rates: neuronal TCA cycle flux, VPDH; glial TCA cycle flux, Vg; glial rate of pyruvate carboxylation, VPC; exchange between (mitochondrial) 2-oxoglutarate and (cytosolic) glutamate, Vx; label dilution, Vout; and the apparent rate of glutamate neurotransmission (glutamine-glutamate cycle rate), VNT. From these metabolic rates, the following rates were calculated: glial glutamine synthetase flux, Vsyn; total oxidative glucose consumption, CMRglc(ox); and the rate of ATP synthesis from glucose in neurons and glia. For a graphical representation of the model, see Fig. 5 in (Gruetter et al., 1998a) and Fig. 1 in (Gruetter et al., 2001). For the modeling, the measured pool sizes in Table 1 were used. Brain glucose isotopic enrichment was assumed to have a half-life of 5 min and the following time courses were fitted: 13Glu4(t), 13Gln4(t), 13Glu3(t), 13Gln3(t), 13Asp3(t) using graphical fitting software (SAAM II, The SAAM Institute, Seattle, WA), which provides an error analysis (SD of the fitted parameter, from which the 95% confidence interval can be calculated) as well as a covariance analysis.
Quantification of cerebral amino acid pools using an isotopomer analysis to determine isotopic enrichment and quantified amount of 13C label
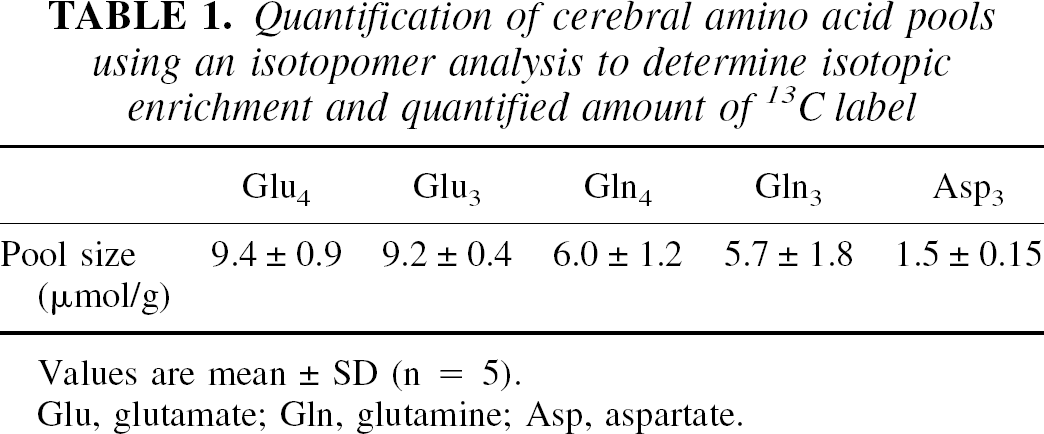
Values are mean ± SD (n = 5).
Glu, glutamate; Gln, glutamine; Asp, aspartate.
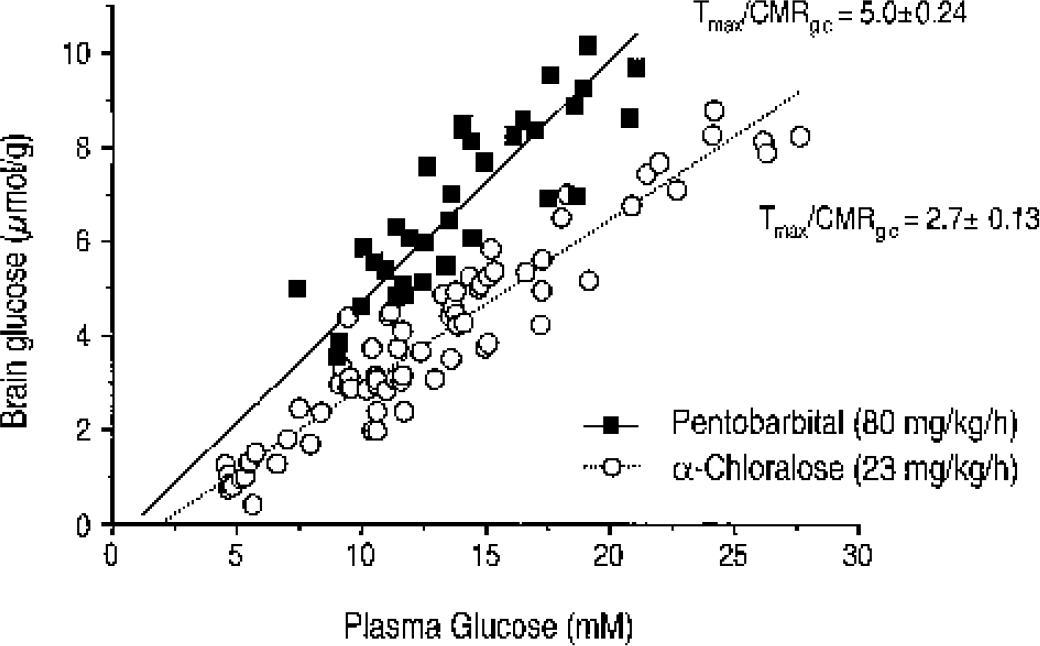
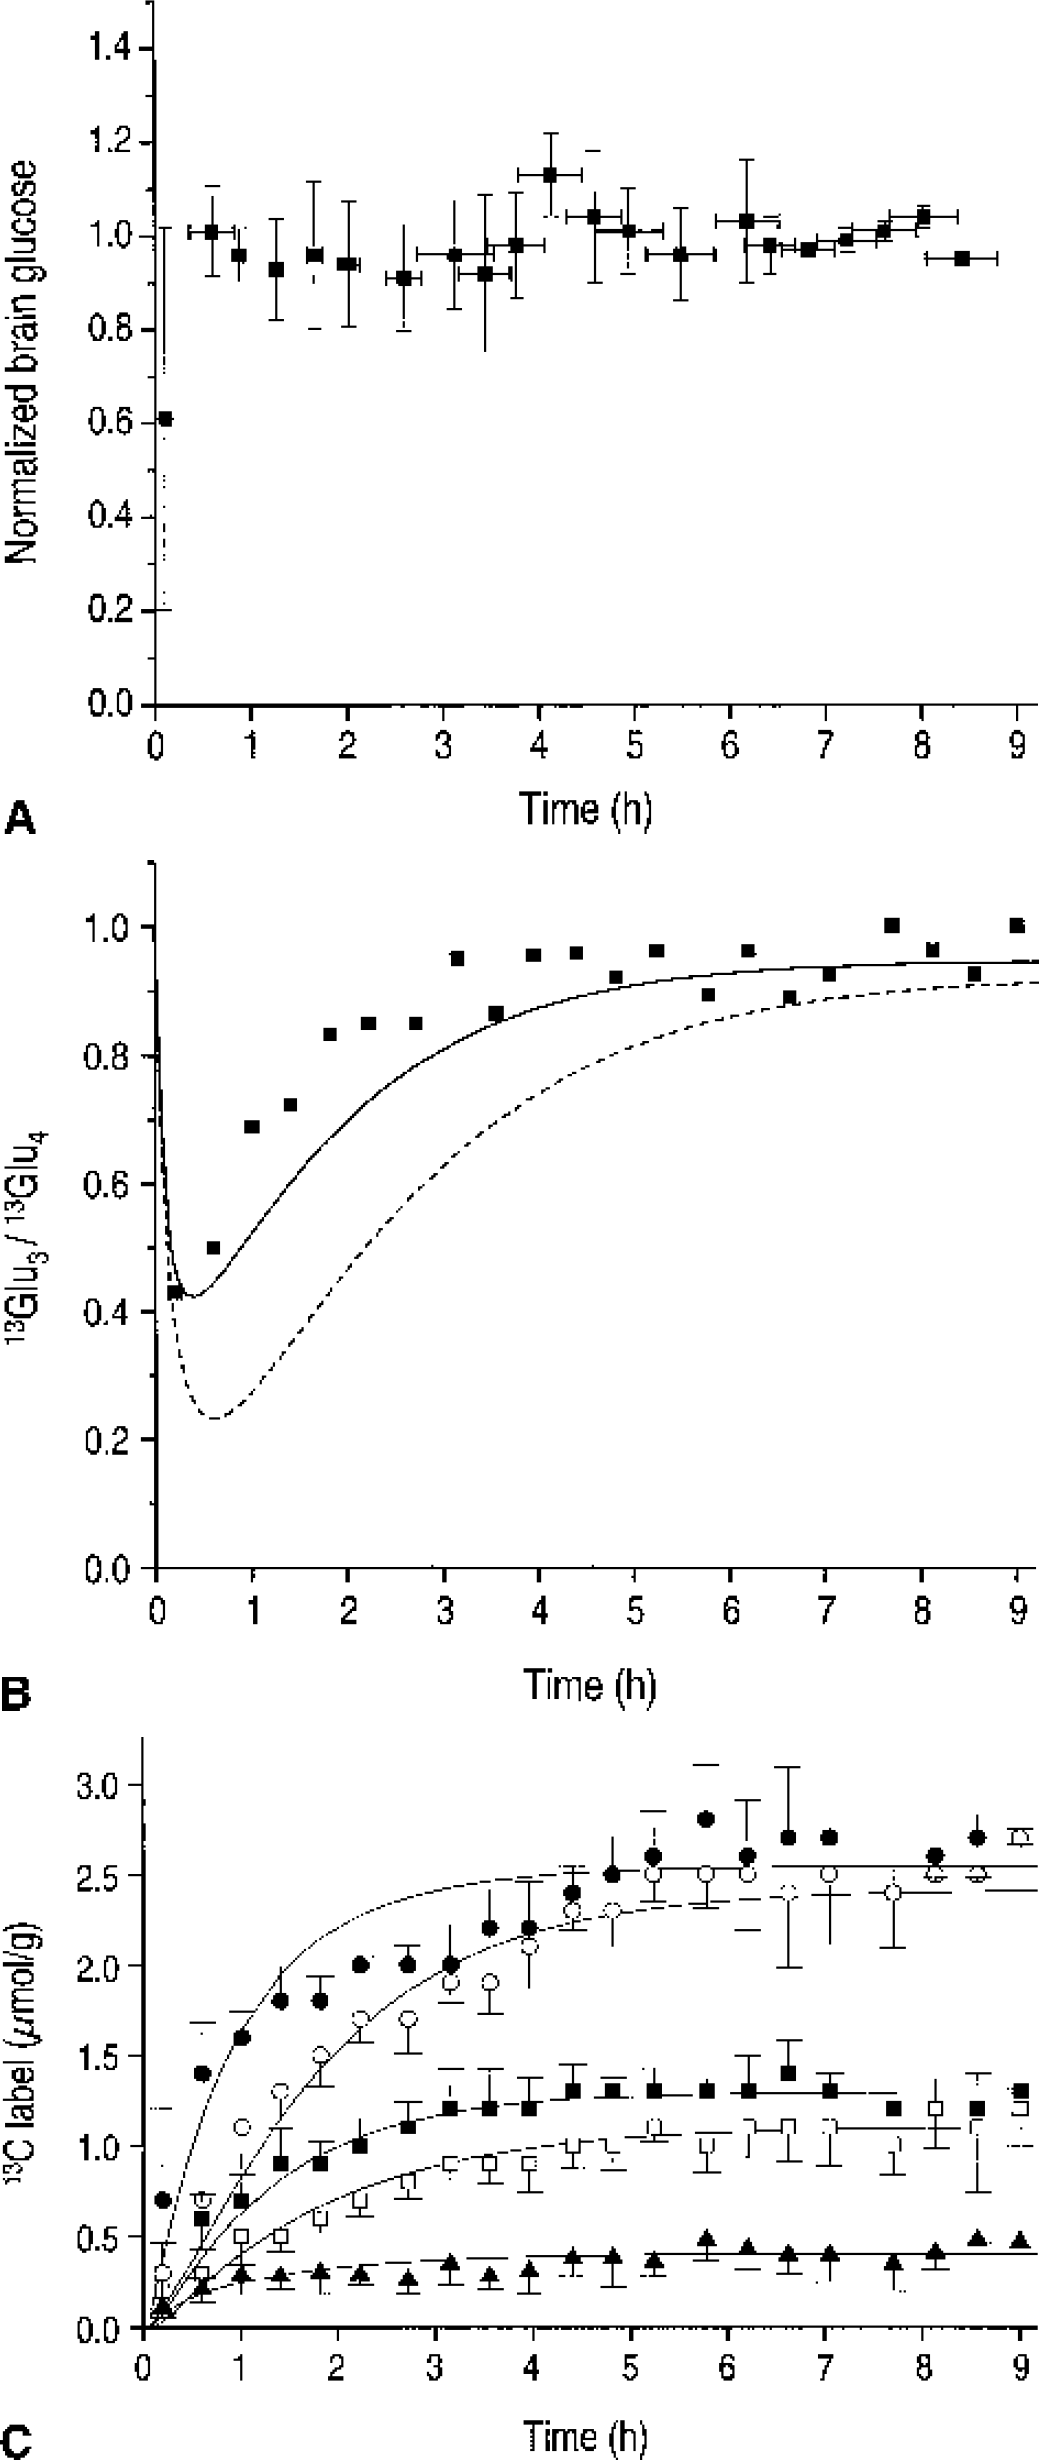
Quantification of brain glucose concentration as a function of plasma glucose in rats anesthetized with pentobarbital (▪). The solid line is the best fit of the reversible Michaelis-Menten model of glucose transport using Eq. 3 in Choi et al. (2001) to the data, assuming a fixed Kt of 3.3 mmol/L as previously reported. For comparison, the measurement of brain glucose in the lightly α-chloralose anesthetized rat (○; 24 mg-kg−1 · h−1) is reproduced from Choi et al. (2001), and the dotted line indicates the best fit of the glucose transport model. CMRglc, cerebral metabolic rate of glucose.
Modeling glucose transport kinetics
The steady-state measurement of brain glucose transport kinetics was analyzed using the reversible model of glucose transport kinetics (Cunningham et al., 1986) using procedures and equations previously described (Choi et al., 2001; Gruetter et al., 1998b). For the fitting, we assumed the apparent Michaelis-Menten constant Kt to be the same as in light α-chloralose anesthesia, namely, 3.3 mmol/L (Choi et al., 2001) and the model parameter Tmax/CMRglc was fitted using Eq. 4 in Gruetter et al. (1998b), where Tmax represents the apparent maximal rate of glucose transport across the blood–brain barrier.
RESULTS
The simultaneous measurement of the brain glucose concentration at different plasma glucose concentrations allowed an assessment of cerebral glucose transport kinetics at steady state. During deep pentobarbital anesthesia, the brain glucose concentration was clearly higher than what we previously reported in the lightly α-chloralose anesthetized rats (Choi et al., 2001), as shown in Fig. 1. Note that although the brain glucose concentration was substantially higher, it was still considerably lower than the plasma glucose concentration, which implies that brain glucose consumption was still substantial. The reversible Michaelis-Menten model of glucose transport was used to fit the data as in our previous studies (Choi et al., 2001; Seaquist et al., 2001; Gruetter et al., 1998b) and yielded a ratio of maximal transport rate to cerebral glucose consumption rate, Tmax/CMRglc of 5.0 ± 0.24. This ratio was approximately twofold higher than that in the α-chloralose anesthetized rats (Choi et al., 2001). In these calculations, we assumed that Kt (3.3. mmol/L) was constant between α-chloralose and pentobarbital anesthetized rats. Even when assuming that Kt varied by up to fivefold, however, the calculated Tmax/CMRglc did not vary by more than ±10%. This result indicates that net glucose uptake by the brain was only reduced by 50%.
Simultaneous measurement of brain glycogen concentrations indicated that brain glycogen C1 reached concentrations of 8.2 ± 2.7 μmol/g (mean ± SD, n = 3) after 7 hours of [1-13C] glucose infusion. A time course of the brain glycogen C1 signal and concomitant quantification of 13C label are shown in Fig. 2. The measurement of brain glucose and glycogen signals alternated in an interleaved fashion with measurements optimized for the spectral region containing signals from neurotransmitters and amino acids such as glutamate, glutamine, γ-aminobutyric acid, and aspartate. The turnover curves of glutamate, glutamine, and aspartate were used to extract a number of metabolic fluxes based on a recently described mathematical model of compartmentalized neurotransmitter metabolism (Gruetter et al., 2001).
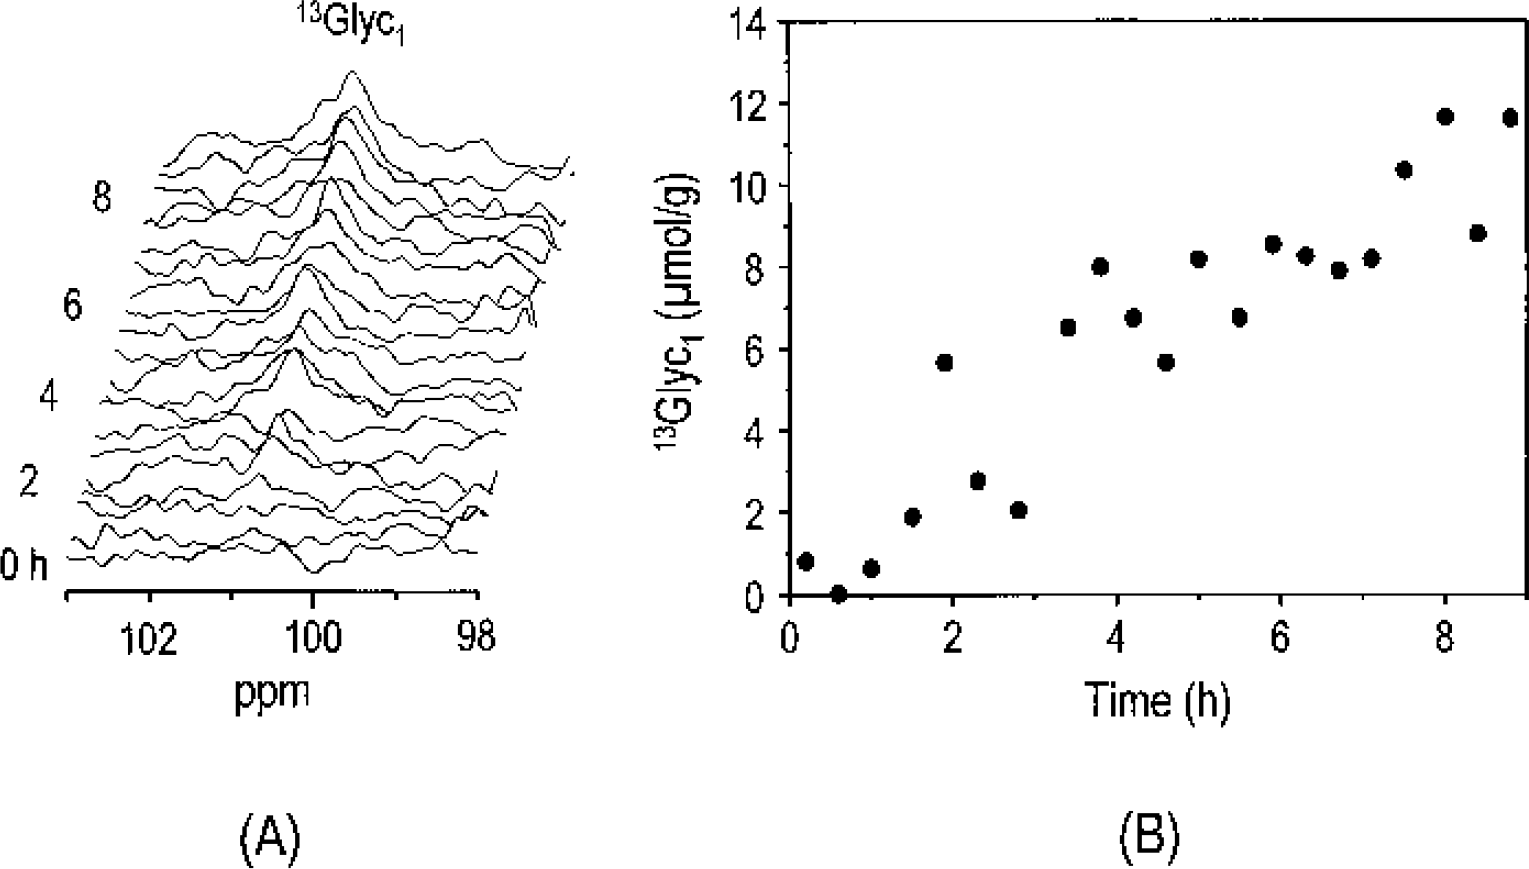
Observation of label incorporation into glycogen C1 (13Glyc1) during intravenous infusion of [1-13C] glucose. The 13C nuclear magnetic resonance spectra shown in the stack plot correspond to 25-minute temporal resolution. Time scale from the start of [1-13C] glucose infusion is shown on the left side. Gaussian resolution enhancement (20 Hz) was applied before zero-filling and fast Fourier transformation. No baseline correction was applied.
Label incorporation into the glutamate C4, 13Glu4, glutamate C3, 13Glu3, glutamine C4, 13Gln4, glutamine C3, 13Gln3, and aspartate C3 resonances, 13Asp3, was readily observed (Fig. 3). During pentobarbital anesthesia, optimized infusion of 99%-enriched [1-13C] glucose resulted in a rapid initial rise in plasma glucose and a concomitant stable brain glucose C1 signal (Fig. 4A). Isotopic steady state in the amino acid pools was achieved after several hours, consistent with depressed metabolism (Fig. 3). The spectra demonstrated the resolved detection of 13C-13C isotopomers as in previous studies (Choi et al., 2000; Gruetter et al., 1994, 2001). The isotopic enrichment of glutamate C3 was calculated from the isotopomers within glutamate as described in Materials and Methods and similarly for glutamine: at 348 ± 21 min into the infusion, the isotopic enrichment of 13Glu3 was IE(13Glu3) = 0.29 ± 0.03 and of 13Gln3, IE(13Gln3) = 0.20 ± 0.04 (mean ± SD, n = 5). The isotopic enrichment of 13Glu4 was IE(13Glu4) = 0.31 ± 0.03 and IE(13Gln4) = 0.21 ± 0.05. The similarity of the isotopic enrichment of C3 and of C4 in both glutamate and glutamine indicates that both glutamate and glutamine were completely turned over at this late time point. From the quantified amount of 13C label in C3 and C4, the total pool size of glutamate, glutamine, and aspartate was calculated assuming the same isotopic enrichment of aspartate and glutamate (Table 1). The measured time courses of label incorporation (Fig. 4C) using a mathematical model of compartmentalized neurotransmitter metabolism (Gruetter et al., 2001) yielded several metabolic rates (Table 2).
Derived metabolic fluxes (μmol · g 1 · min 1) by fitting the model (from Gruetter et al., 2001) to the time courses in Figure 4C
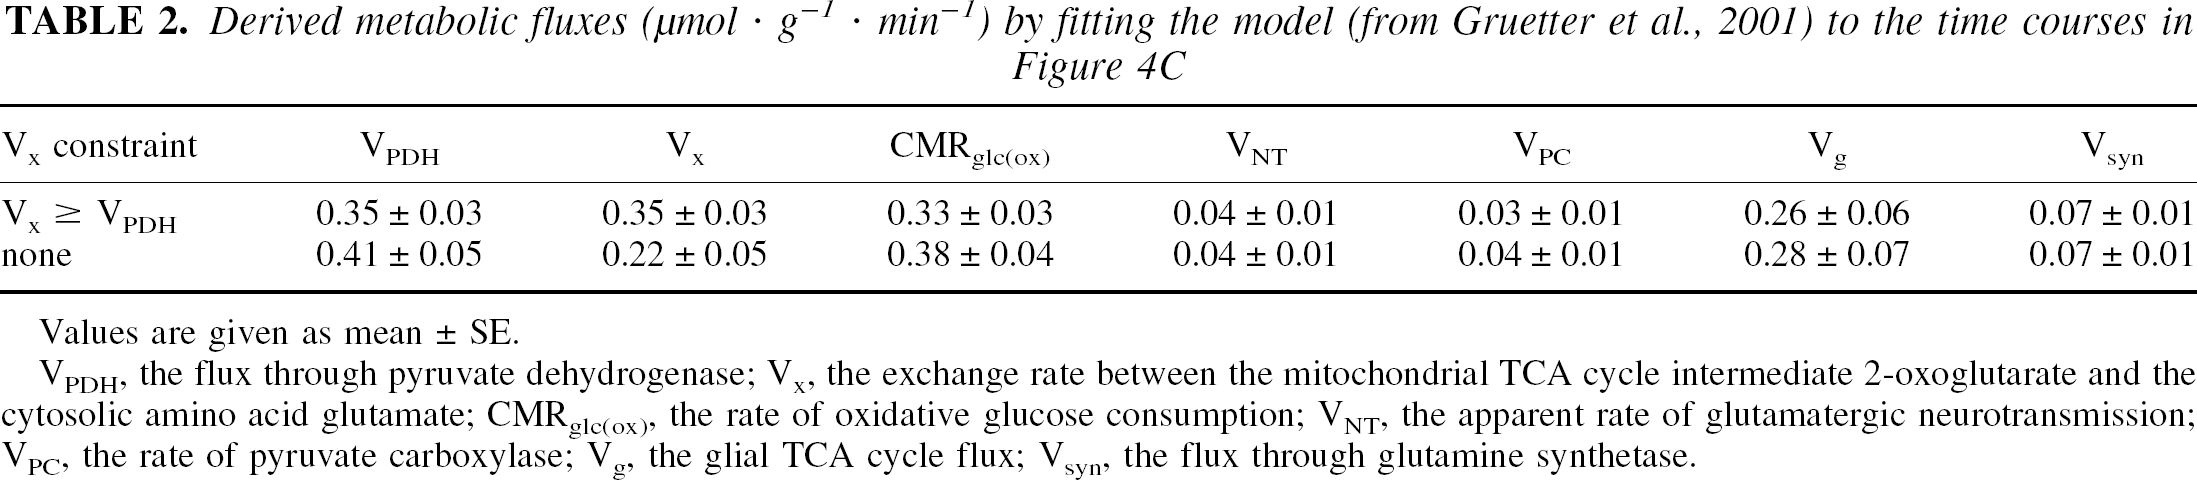
Values are given as mean ± SE.
VPDH, the flux through pyruvate dehydrogenase; Vx, the exchange rate between the mitochondrial TCA cycle intermediate 2-oxoglutarate and the cytosolic amino acid glutamate; CMRglc(ox), the rate of oxidative glucose consumption; VNT, the apparent rate of glutamatergic neurotransmission; VPC, the rate of pyruvate carboxylase; Vg, the glial TCA cycle flux; Vsyn, the flux through glutamine synthetase.
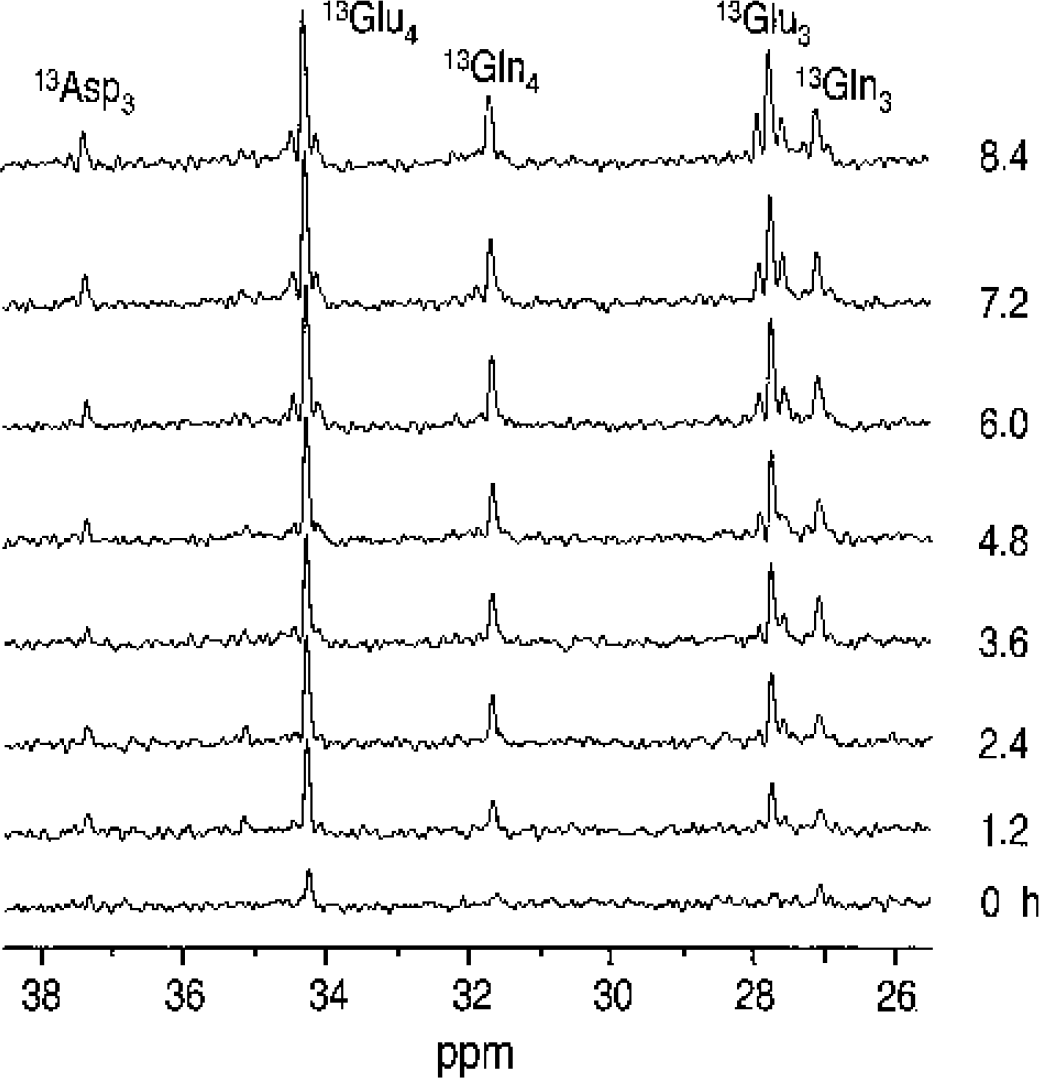
Observation of label incorporation into multiple positions of glutamate (Glu), glutamine (Gln), and aspartate (Asp). Time scale from the start of [1-13C] glucose infusion is shown on the right side. Each 13C magnetic resonance imaging spectrum in vivo in the stack plot is shown with 25-minute temporal resolution, 8-Hz Gaussian resolution enhancement applied before zerofilling and fast Fourier transformation. No baseline correction was applied.
Time course of 13C-labeled brain glucose during intravenous infusion of [1-13C] glucose.
Clearly, the rate of label incorporation into 13Glu4 was paralleled by a label increase in 13Glu3 and 13Gln4, the latter indicating active metabolism in glia (Fig. 4C). Although the labeling of 13Glu3 relative to 13Glu4 was slower, there was no discernible lag as would be expected if the glutamate pool were turned over completely before the label continues to the next turn of the TCA cycle (Fig. 4B). To further demonstrate that our data are incompatible with a fast Vx (Mason et al., 1992) and that Vx was rather on the order of the rate of the TCA cycle, VPDH, we fitted VPDH and Vout to the 13Glu4(t) and 13Gln4(t) data, assuming Vx was 57 μmol · g−1 · min−1, as was done in previous studies (Sibson et al., 1998), while keeping the other fluxes at the values shown in row 1 of Table 2 (dashed line in Fig. 4B). The resulting VPDH was 0.14 ± 0.02 μmol · g−1 · min−1. However, the calculated 13C label in glutamate C3 relative to that in C4, 13Glu3/13Glu4 is clearly less consistent with the experimentally measured 13Glu3/13Glu4 compared to the modeling done in this study as indicated by the solid line in Fig. 4B. It is noteworthy that the observation Vx∼VPDH did not depend on the assumed intercellular distribution of glutamate (Table 3).
Effect of assumed intercellular distribution on derived metabolic fluxes (μmol · g−1 · min 1) by fitting the model (from Gruetter et al., 2001) to the time courses in Figure 4C
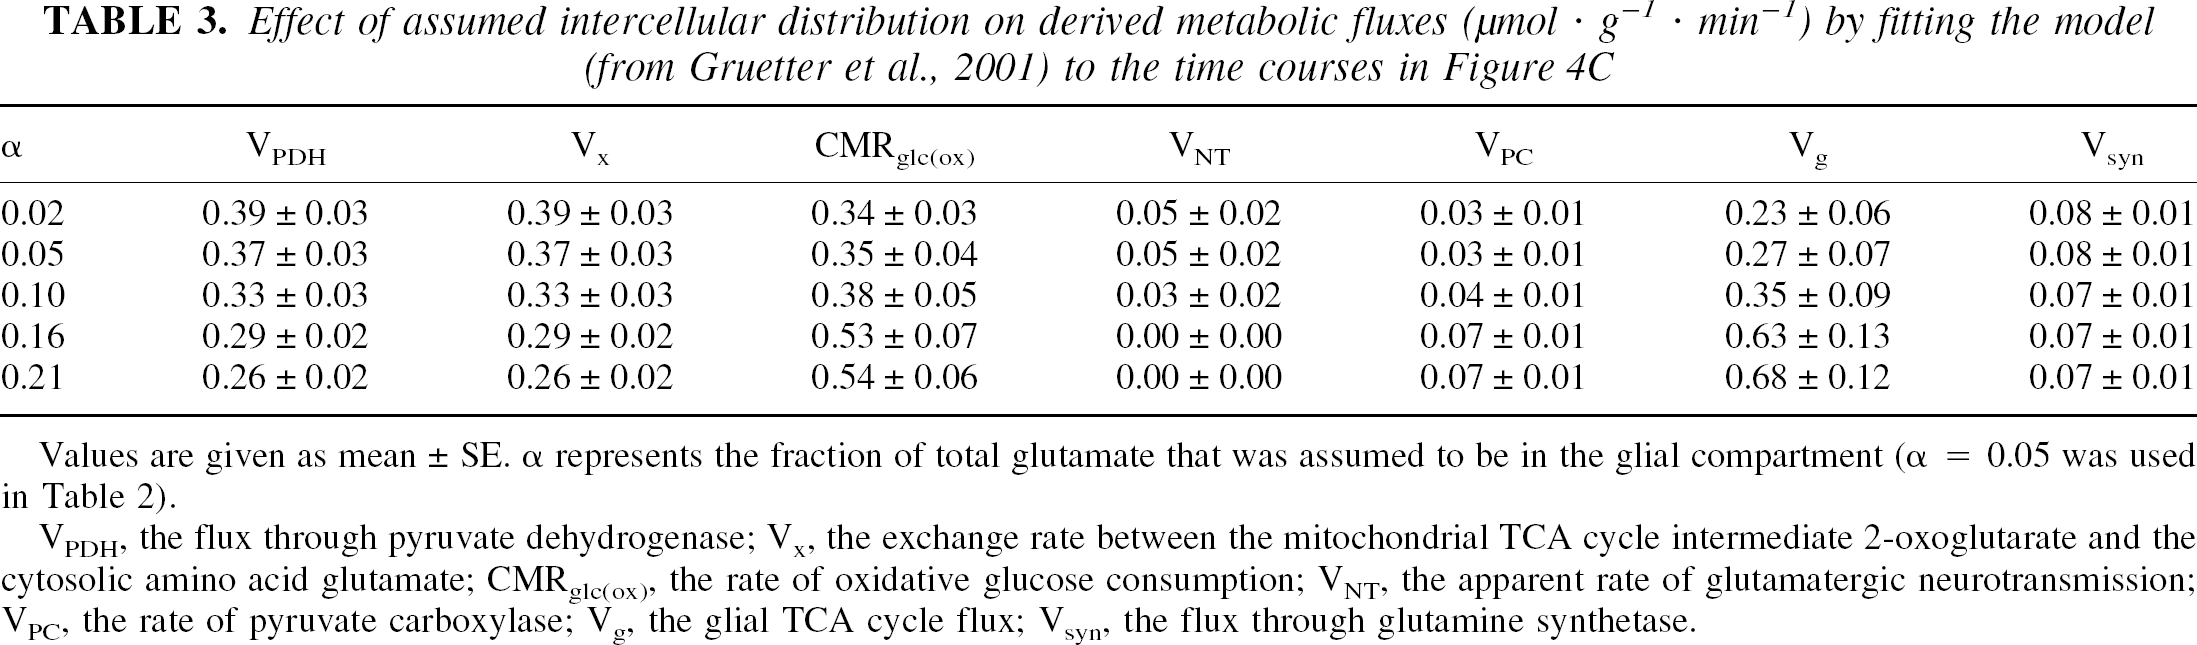
Values are given as mean ± SE. α represents the fraction of total glutamate that was assumed to be in the glial compartment (α = 0.05 was used in Table 2).
VPDH, the flux through pyruvate dehydrogenase; Vx, the exchange rate between the mitochondrial TCA cycle intermediate 2-oxoglutarate and the cytosolic amino acid glutamate; CMRglc(ox), the rate of oxidative glucose consumption; VNT, the apparent rate of glutamatergic neurotransmission; VPC, the rate of pyruvate carboxylase; Vg, the glial TCA cycle flux; Vsyn, the flux through glutamine synthetase.
The exchange rate between 2-oxoglutarate and glutamate, Vx, was very slow and constrained by the lower boundary afforded by the model, VPDH. Removing this constraint resulted in Vx < VPDH (second row in Table 2) and resulted in an increase of CMRglc(ox) because of the covariance of Vx and VPDH. In either case, the apparent rate of glutamatergic neurotransmission, VNT, was consistently close to zero (Table 2), consistent with reports suggesting isoelectricity for this dose of pentobarbital anesthesia (Contreras et al., 1999). However, the glial TCA cycle flux, Vg, and the rate of anaplerosis, i.e., flux through pyruvate carboxylase, VPC, were substantial. In both cases presented in Table 2, the modeling results in approximately half of the total ATP production or energy consumption being in the neuronal compartment.
DISCUSSION
This study is the first localized 13C NMR study to assess total glucose consumption changes and to measure the apparent rate of glutamatergic action under deep pentobarbital anesthesia. It is also the first simultaneous measurement and modeling of cerebral glucose content, and label incorporation into multiple positions in amino acids and neurotransmitters such as glutamate, glutamine, and aspartate. The increased information content achieved in this study allowed a robust assessment of cerebral metabolic rates in the glial and the neuronal compartments.
For example, the exchange between mitochondrial 2-oxoglutarate and cytosolic glutamate, Vx, involves transport of charged acids across the heavily polarized inner mitochondrial membrane and is achievable only through transporters (LaNoue and Tischler, 1974). Vx being on the order of the neuronal TCA cycle rate, VPDH (Table 2) implies that the malate-aspartate shuttle is the major mechanism in the deeply anesthetized rat brain, assuming that the glycerol-phosphate shuttle is a minor contributor to the flux of reducing equivalents from the cytosol into the mitochondria. Together these results also show that this exchange can depend on the metabolic activity of the cell. This is in agreement with measurements in the perfused heart, where the exchange rate was found to be on the order of the TCA cycle rate (Yu et al., 1997). Studies have suggested that the other major shuttle that transports reducing equivalents from the cytosol to the mitochondrion, namely, the glycerol-phosphate shuttle, may be active in the heart (Chatham et al., 1995) and the liver (Poso, 1979). When assuming that the glycerol-phosphate shuttle is also active in the brain, the condition that Vx is larger than VPDH can be eliminated from the fitting. In this case, Vx was indeed lower than VPDH (Table 2), suggesting that fluxes through shuttles other than the malate-aspartate shuttle may not be negligible in the brain in vivo. It was reported, however, that the degree of inhibition of transaminase flux and, therefore, malate-aspartate shuttle activity, was proportional to the degree of reduced oxygen consumption in the brain (Fitzpatrick et al., 1983), suggesting that very few reducing equivalents can be transported by other shuttle mechanisms. Removing the constraint Vx ⩾ VPDH has a strong effect on some of the rates. Because of the known negative covariance of VPDH and Vx, the increase in VPDH was not an unexpected result.
The rate of label incorporation into glutamate, glutamine, and aspartate was analyzed using a mathematical model of compartmentalized neurotransmitter metabolism. The derived metabolic rates provide further insight into the action of pentobarbital and depressed electrical activity on cerebral metabolism in neurons and glia. The apparent rate of neurotransmission, VNT, was reduced to very close to zero, 0.04 μmol · g−1 · min−1, which implies suppression of glutamatergic action, consistent with almost complete isoelectricity. It is interesting to note that under the present conditions, anaplerosis, although quantitatively small, constitutes about half of the flux through glutamine synthetase, Vsyn. Conversely, this means that glutamatergic action is not the dominant contributor to glutamine synthesis. In this context, it was intriguing to note that the rate of labeling for glutamine C4, 13Gln4, apparently reached steady state as fast as the glutamate C4, 13Glu4, as judged from the label incorporation shown in Figs. 3 and 4C. This is direct experimental evidence for either a high metabolic rate in the glial compartment relative to the neuronal compartment or a very fast rate of label transfer from neuronal glutamate to glial glutamine, VNT. Faster glutamatergic action (represented by VNT) under deep anesthetic states compared with states with higher electrical activity, however, is very unlikely and would be inconsistent with the low VNT.
Our results suggest that glial energy consumption is quite considerable and amounts to approximately half of the total ATP synthesis from glucose under deep pentobarbital anesthesia. This is rather surprising when we consider that it is generally assumed that most of the oxidative glucose metabolism is in the neuronal compartment, as we have observed, for instance, in the conscious brain (Gruetter et al., 2001). Therefore, our current finding of substantial glial energy metabolism implies a major site of action for barbiturates in the neuronal compartment. In cell cultures, barbiturates have been shown to depress neuronal metabolism more than in astrocytes (Hertz et al., 1986). In addition, some studies have reported increased deoxyglucose uptake in cultured astrocytes with increasing pentobarbital anesthesia (Swanson and Seid, 1998). Barbiturates are thought to act on the respiratory chain and the overall reduced oxygen consumption (Blacklock et al., 1987; Donegan et al., 1985), and thus likely reflects the larger effect of pentobarbital on the neuronal compartment than the glial compartment (Hertz et al., 1986; Yu et al., 1983).
In our study, the simultaneous measurement of brain glucose content allowed an assessment of the effect of pentobarbital on overall glucose metabolism. The considerable gradient remaining between brain and plasma glucose concentrations, as can be seen in Fig. 1, indicates substantial glucose uptake during deep pentobarbital anesthesia. Modeling glucose transport indicates that CMRglc was half of that in the light α-chloralose anesthetized rat brain. In this analysis, it was assumed that the apparent Michaelis-Menten constant for glucose transport, Kt, and the maximal apparent glucose transport rate, Tmax, were not affected by the deep pentobarbital anesthesia. A recent report suggested that the transport affinity for glucose may change under pentobarbital anesthesia in cultured cells and erythrocytes (Haspel et al., 1999). When we allow a fivefold change in the apparent Michaelis-Menten constant Kt (Kt ranging from 1 to 5 mmol/L), Tmax/CMRglc was affected by approximately 20%, which did not change the conclusions of this study, namely, that overall glucose metabolism was still considerable. If it is assumed that the twofold reduction in glucose metabolic rate reflects mainly changes in the neuronal energy metabolism, then we estimate that under α-chloralose anesthesia, glial energy metabolism represents only approximately 25% of total energy metabolism as measured by labeling from glucose.
The decrease in cerebral metabolic rate under pentobarbital anesthesia is substantially less than what has been reported in an earlier study (Sibson et al., 1998), where brain glucose transport under these conditions was not assessed. That study stated that cerebral metabolism in coma (a pentobarbital dose of 40 to 60 mg · kg−1 · h−1 intraperitoneally) was depressed to 10% of the basal metabolism. The study further reported that most of the cerebral oxidative glucose consumption rate was coupled in a 1:1 stoichiometric fashion to glutamatergic action. According to previous measurements of brain glucose content as a function of plasma glucose content in the awake rat (Mason et al., 1992) and the proposed 10-fold reduction in metabolism in coma (Sibson et al., 1998), brain glucose concentrations should rise to values close to the plasma glucose concentration according to the nature of the glucose transport process by facilitated diffusion. Our analysis of the glucose transport kinetics, however, is consistent with only a twofold reduction in the metabolic rate.
These findings shed light on the interpretation of “stoichiometric coupling of brain glucose metabolism and glutamatergic neuronal activity” (Sibson et al., 1998), which was recently challenged based on data obtained in the conscious human brain where glial and neuronal metabolism was simultaneously assessed (Gruetter et al., 2001). In the study by Sibson et al. and more recent reviews of that paper (Shulman and Rothman, 2001), it was suggested that the total oxidative glucose consumption in the brain is linearly correlated with glutamatergic action with a 1:1 stoichiometry. Energy metabolism in the glial compartment under deep pentobarbital anesthesia, however, was not assessed in that study, and neither was the glutamate-glutamine cycle (represented by VNT in our modeling); instead it was assumed to be zero at isoelectricity. Last, a further limitation of that study was that the turnover of only 13Glu4(t) and 13Gln4(t) was measured, which did not permit the measurement of Vx. Instead, that study was based on an assumed Vx of approximately 50 μmol · g−1 · min−1 (Mason et al., 1992). However, it is not clear to what extent the previous study by Mason et al. represents normal physiology, since data obtained from paralyzed, awake rats following tracheotomy and scalp retraction were used. In contrast, the present study reports a Vx of 0.35 μmol · g−1 · min−1, our previous study in awake humans reported 0.58 jimol · g−1 · min−1, and a recent study in α-chloralose anesthetized rats reported 0.9 μmol · g−1 · min−1 (Henry et al., 2002). In all studies of normal, anesthetized rats or humans, Vx was on the order of VPDH, which is strong supporting evidence that the malate-aspartate shuttle can be measured by 13C NMR in the brain and that it is a major flux-controlling mechanism.
Our studies suggest that the energy required for glutamate signaling is very low. In the present study, the total ATP consumption is estimated at 10 jimol · g−1 · min−1, of which approximately VNT x 2.25 = 0.1 μmol · g−1 · min−1 is devoted to the restoration of the ion concentration following glutamate uptake into astrocytes and conversion of the glutamate to glutamine and then export back to neurons. This amounts to glutamate signaling requiring less than 2% of the glial (or neuronal) energy consumed under deep anesthesia, where electrical activity is greatly or even completely depressed. A calculation of the ATP synthesis required for glutamate cycling from our previous study (Gruetter et al., 2001) indicated that approximately 3% of total ATP is devoted to that task in the conscious human brain. These calculations are in excellent agreement with recent theoretical considerations (Attwell and Laughlin, 2001).
Because the present results with the more complete modeling and more extensive analysis of cerebral energy metabolism suggest that there is considerable oxidative ATP synthesis in glia and that cerebral glucose consumption is still substantial under deep pentobarbital anesthesia, the “molar stoichiometric coupling of total glucose consumption with neuronal glutamate release” (Sibson et al., 1998) hardly exists. It was also suggested in our previous study (Gruetter et al., 2001) that there is potentially a correlation between neuronal glutamate release, VNT, and the TCA cycle rate in neurons, VPDH. However, a correlation between VNT, reflecting the glial energy demands of glutamate recycling, and VPDH, representing neuronal energy metabolism, eliminates the chemical basis for the proposed molar stoichiometry between glucose metabolism and glutamatergic action. Therefore, in light of these results, the findings by Sibson et al. require reinterpretation and additional work is needed. Based on the present results in the deeply anesthetized rat brain and our recent results in the conscious human brain (Gruetter et al., 2001), we offer the following interpretation: there is undoubtedly a coupling between glutamatergic action and glial energy metabolism, as suggested by the increased deoxyglucose uptake with increasing extracellular glutamate concentration (Magistretti et al., 1993) and increased oxygen consumption (Eriksson et al., 1995). The precise relation between changes in neurotransmission rates and energy metabolism, however, has not yet been satisfactorily established.