
Abstract
The relationship between local rates of cerebral glucose utilization (lCMRglc) and glucose transporter expression was examined during physiologic activation of the hypothalamoneurohypophysial system. Three days of water deprivation, which is known to activate the hypothalamoneurohypophysial system, resulted in increased lCMRglc and increased concentrations of GLUT1 and GLUT3 in the neurohypophysis; mRNA levels of GLUT1 and GLUT3 were decreased and increased, respectively. Water deprivation also increased lCMRglc in the hypothalamic supraoptic and paraventricular nuclei; mRNA levels of GLUT1 and GLUT3 appeared to increase in these nuclei, but the changes did not achieve statistical significance. Restoration of water for 3 to 7 days reversed all observed changes in GLUT expression (protein and mRNA); restoration of water also reversed changes in lCMRglc in both the neurohypophysis and the hypothalamic nuclei. These results indicate that under conditions of neural activation and recovery, changes in lCMRglc and the levels of GLUT1 and GLUT3 are temporally correlated in the neurohypophysis and raise the possibility that GLUT1 and GLUT3 transporter expression may be regulated by chronic changes in functional activity. In addition, increases in the expression of GLUT5 mRNA in the neurohypophysis after dehydration provide evidence for involvement of microglial activation.
Keywords
Glucose is the major substrate for cerebral energy metabolism, and regional alterations in functional activity are reflected in changes in the local rates of cerebral glucose utilization (lCMRglc; (Sokoloff, 1977; Schwartz et al., 1979). The delivery of glucose to the brain is mediated by the facilitative glucose transporter proteins, primarily GLUT1 in the blood-brain barrier and glia, and GLUT3 in neurons (see Maher et al., 1994; Vannucci et al., 1997b for review). Although transport is generally not considered to be rate-limiting for cerebral glucose utilization, the expression of both GLUT1 and GLUT3 proteins have been shown to vary under physiologic and pathologic conditions in which rates of glucose utilization are also altered, such as during development and in the brains of patients with Alzheimer's disease (Bondy et al., 1992; Simpson et al., 1994; Vannucci, 1994; Vannucci et al., 1994b). However, in order to fully assess the relationship between lCMRglc and glucose transporter expression, a system was required in which regional functional activity could be experimentally manipulated.
The hypothalamoneurohypophysial system in the rat is well suited to this investigation. Dehydration, produced by progressive water deprivation, results in activation of the magnocellular neurons of the supraoptic and paraventricular nuclei of the hypothalamus and secretion of vasopressin and oxytocin from their nerve terminals located in the neurohypophysis (Robinson, 1986; McKinley et al., 1987; Dyball and Leng, 1989; Hatton, 1990). In addition to the axon terminals, which presumably are the site of GLUT3 expression, the neurohypophysis is comprised of two glial elements, pituicytes and microglia, both of which express GLUT1 (Hatton, 1988; Mander and Morris, 1994; Vannucci et al., 1994a, 1997b). Microglia also express the putative fructose transporter, GLUT5 (Payne et al., 1993; Li et al., 1996; Vannucci et al., 1997b). Two to three days of water deprivation have been shown to result in increased neuronal firing and increased lCMRglc in the supraoptic and paraventricular nuclei and in the neurohypophysis (Schwartz et al., 1979; Kadekaro et al., 1992). We have previously demonstrated an associated increase in both GLUT1 and GLUT3 protein levels in the neurohypophysis under the same physiologic conditions (Vannucci et al., 1994a). In the present study, we have determined the time courses for changes in lCMRglc and concentrations of GLUT1 and GLUT3 (mRNA and protein) in the components of the hypothalamoneurohypophysial system in rats during water deprivation and subsequent recovery.
MATERIALS AND METHODS
Animals
All procedures were carried out in accordance with the National Institutes of Health Guidelines on the Care and Use of Animals and an animal study protocol approved by the National Institute of Diabetes, Digestive and Kidney Diseases Animal Care and Use Committee. Adult (225 to 250 g) male, Sprague-Dawley rats were obtained from Charles River Laboratories (Wilmington, MA, U.S.A.) and maintained in a central animal facility under controlled conditions of normal humidity and temperature with standard alternating 12-hour periods of light and darkness (lights on at 6 a.m.). Animals were housed two per cage and allowed free access to food (NIH standard rat chow) and water before the start of the experimental protocol. Rats were weighed and randomly divided into four groups: control, water deprived for 3 days, water-restored for 3 days, and water-restored for 7 days. During the experimental period all animals received food ad libitum, but water was withheld from all but controls for 3 days. After 3 days of water deprivation, water was returned to the water-restored groups of animals for 3 or 7 days.
Two sets of experiments were carried out: 1) Experiments to determine lCMRglc (n = 23) and 2) Experiments to determine glucose transporter and hormone concentrations (n = 98). Before the experimental determination of lCMRglc, polyethylene catheters were inserted into one femoral artery and vein under light halothane anesthesia. Catheters were tunneled under the skin and exited at the nape of the neck so that the rats could not gain access to the tubing. Rats were not restrained and could move freely throughout the experimental period. At least 2 hours were allowed for recovery from surgery and halothane anesthesia before initiation of the experimental procedure. As described previously (Sokoloff et al., 1977), the following physiologic variables were measured to evaluate each animal's physiologic state: arterial plasma glucose concentration, mean arterial blood pressure, arterial blood pH, Pco2, Po2, hematocrit, and rectal temperature.
All other animals were briefly anesthetized with 70% O2/ 30% CO2 and decapitated. Trunk blood was collected in heparin-coated tubes for measurement of hematocrit and blood glucose (Accucheck 3, Boehringer-Mannheim, Indianapolis, IN, U.S.A.), and the remainder was centrifuged (1,200 × g, 4°C, 10 minutes) to separate plasma and red cells. Plasma samples were stored at −70°C until assayed for concentrations of electrolytes (K+, Na+, Cl−) and vasopressin. The brain was removed from the cranial vault, rapidly frozen in isopentane (−40°C), and stored at −70°C. In some animals the neurohypophysis was dissected from the pituitary, quickly frozen on dry ice, and stored at −70°C. For in situ hybridization studies, the entire pituitary gland was removed, mounted on frozen O.C.T. Compound (Miles, Inc., Elkhart, IN, U.S.A.), and stored at −70°C.
Measurement of rates of glucose utilization
The [14C]deoxyglucose method (Sokoloff et al., 1977) was used to measure lCMRglc. Briefly, rats were given an intravenous pulse (120 μCi/kg) of 2-deoxy-
Western blot analysis
Neural lobe samples were prepared as previously described (Vannucci et al., 1994a). Briefly, each neurohypophysis was sonicated in 70 μL of TES Buffer (20 mmol/L tris[hydroxymethyl]aminomethane, 1 mmol/L EDTA, and 255 mmol/L sucrose) containing the following protease inhibitors: aprotinin, leupeptin, phenylmethylsulfonyl fluoride, and pepstatin, 1 μg/ mL each. Aliquots of solubilized protein (25 μg) were separated on a 10% sodium dodecyl sulfate-polyacrylamide gel and transferred to nitrocellulose filters. All gels contained a 15-μg aliquot of a vascular-free rat cortical membrane standard for comparison and quantification. Western blot analysis for GLUT1 and GLUT3 was performed as previously described (Maher et al., 1991, 1992) with anti-COOH-terminal peptide antisera specific to GLUT1 (9301, 1:1000) and mouse GLUT3 (9297, 1:500) proteins (generously provided by Hoffman-LaRoche, Nutley, NJ, U.S.A.). Blots of neural lobes and a vascular-free rat brain membrane standard were quantified by phosphorimage analysis (Molecular Dynamics, Sunnyvale, CA, U.S.A.) (Vannucci et al., 1994a). All experimental values were expressed in arbitrary units relative to the brain standard.
In situ hybridization
Cryosections (16 üm) from brains and pituitary glands were thaw-mounted onto poly-
Measurement of vasopressin concentration
Plasma and neural lobe samples were extracted and assayed as previously described (Vannucci et al., 1994a). To assure parallel displacement of the labeled antigen, serial dilutions of the plasma extracts and neural lobe homogenates were assayed. Vasopressin levels in plasma were corrected for recovery which averaged 63.5%. The sensitivity of the assay for vasopressin was 0.5 pg/tube with <0.01% cross-reactivity with oxytocin and arginine8 vasotocin. Intraassay coefficient of variation was 11.3% ± 0.2.
Measurement of plasma electrolytes
Concentrations of K+, Na+, and Cl− were determined in thawed plasma samples with three different ion-selective electrodes (Monarch Instruments).
Statistical analysis
Comparisons of data obtained from the four groups of animals were analyzed for statistical significance by Dunnett's t test for multiple comparisons.
RESULTS
Physiologic variables
Alterations in physiologic variables produced by 3 days of water deprivation (Table 1) were in complete agreement with previous studies (Kadekaro et al., 1992; Vannucci et al., 1994a). Compared with control rats, in dehydrated rats body weight was reduced by 25%, hematocrit was increased by 28%, and circulating electrolyte (Cl−, Na+, and K+) concentrations were increased by 7 to 10%. Blood glucose levels were lower (25%) than in controls, most likely because of suppression of appetite accompanying water deprivation. Concentrations of vasopressin were increased (600%) in plasma and decreased (72%) in the neurohypophysis. Within 3 days of restoration of water, hematocrit, blood glucose, and plasma levels of vasopressin, Na+ and Cl− had returned to control levels. Body weight and neurohypophysial stores of vasopressin were reversed within 7 days of water restoration, although circulating K+ still remained elevated.
Physiologic variables in water-deprived and water-restored rats
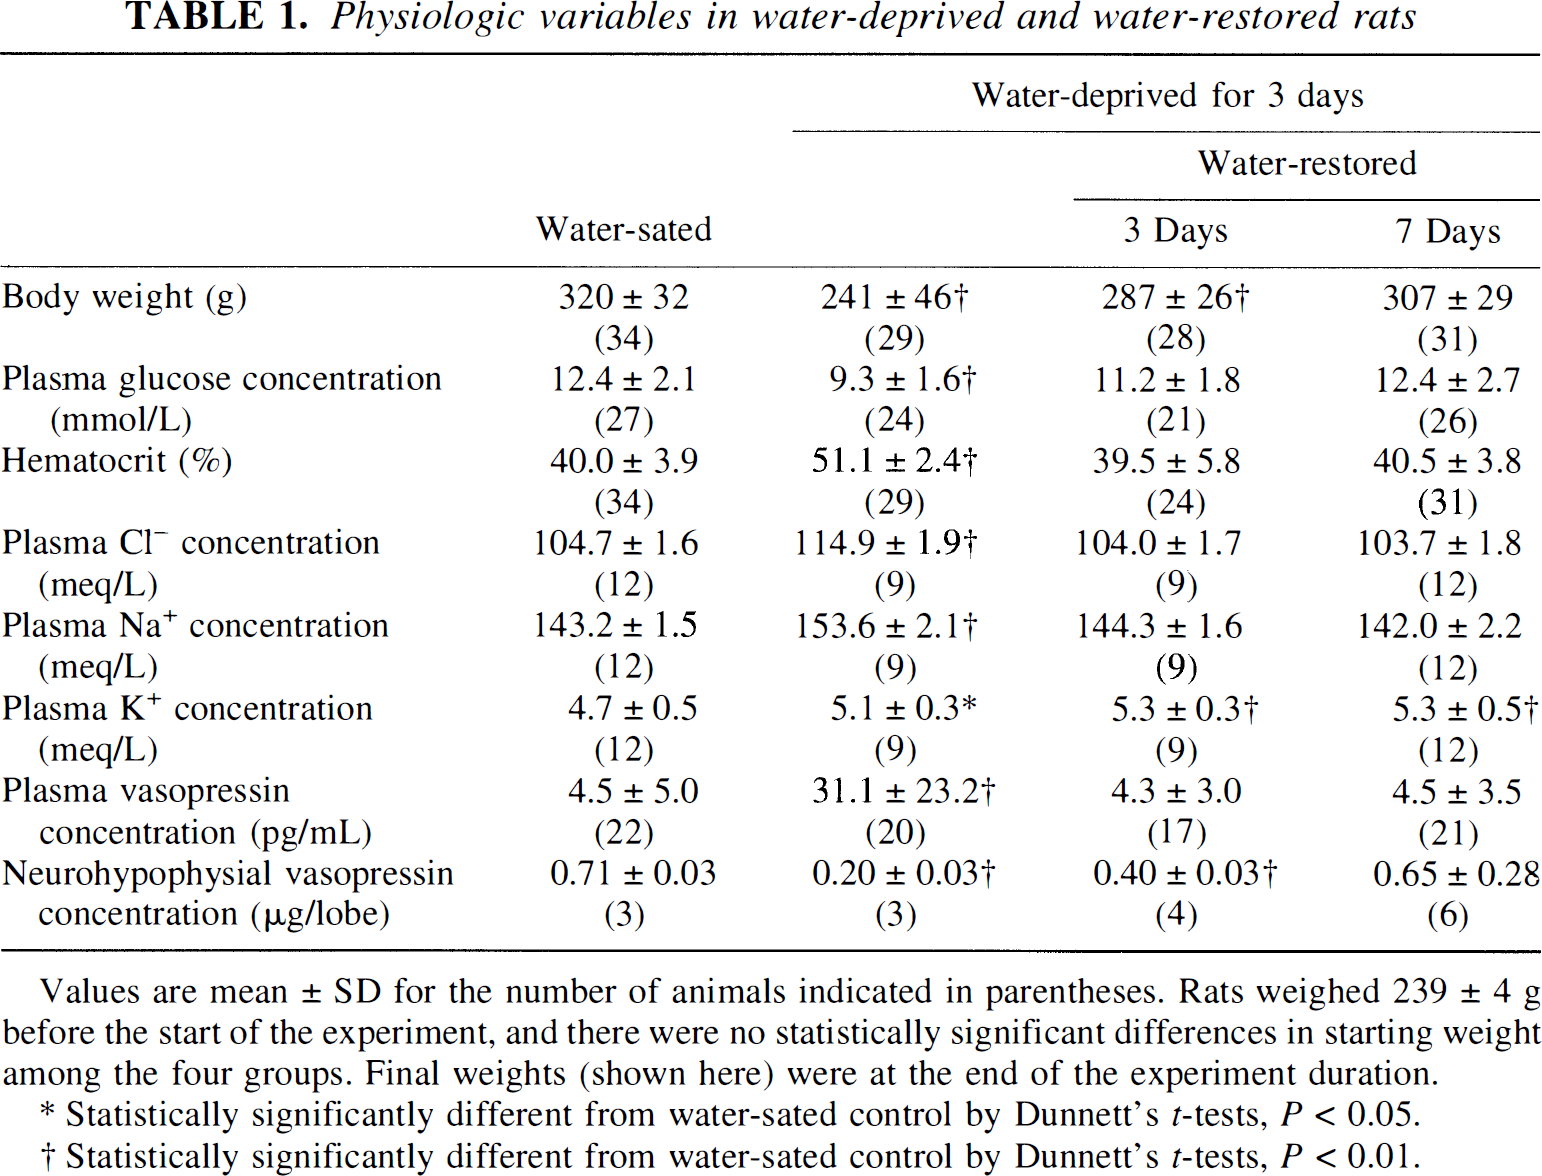
Values are mean ± SD for the number of animals indicated in parentheses. Rats weighed 239 ± 4 g before the start of the experiment, and there were no statistically significant differences in starting weight among the four groups. Final weights (shown here) were at the end of the experiment duration.
Statistically significantly different from water-sated control by Dunnett's t-tests, P < 0.05.
Statistically significantly different from water-sated control by Dunnett's t-tests, P < 0.01.
Rates of glucose utilization
The hypothalamoneurohypophysial system includes both the supraoptic and paraventricular nuclei of the hypothalamus in addition to the neurohypophysis. These hypothalamic nuclei also receive afferent input from the subfornical organ, the median preoptic nucleus, and the organum vasculosum laminae terminalis which are, themselves, activated by osmotic stimulation (Sawchenko and Swanson, 1983; McKinley et al., 1987; Dyball and Leng, 1989; Hatton, 1990). Three days of water deprivation significantly (P < 0.05) increased lCMRglc in the subfornical organ (28%), supraoptic nucleus (25%), and the neurohypophysis (164%; Fig. 1A; Table 2). Increases in lCMRglc approached statistical significance (0.05 < P < 0.1) in the paraventricular nucleus (15%), median preoptic nucleus (22%), and organum vasculosum laminae terminalis (36%). Within 3 days of water restoration, all alterations in lCMRglc had returned to control levels.
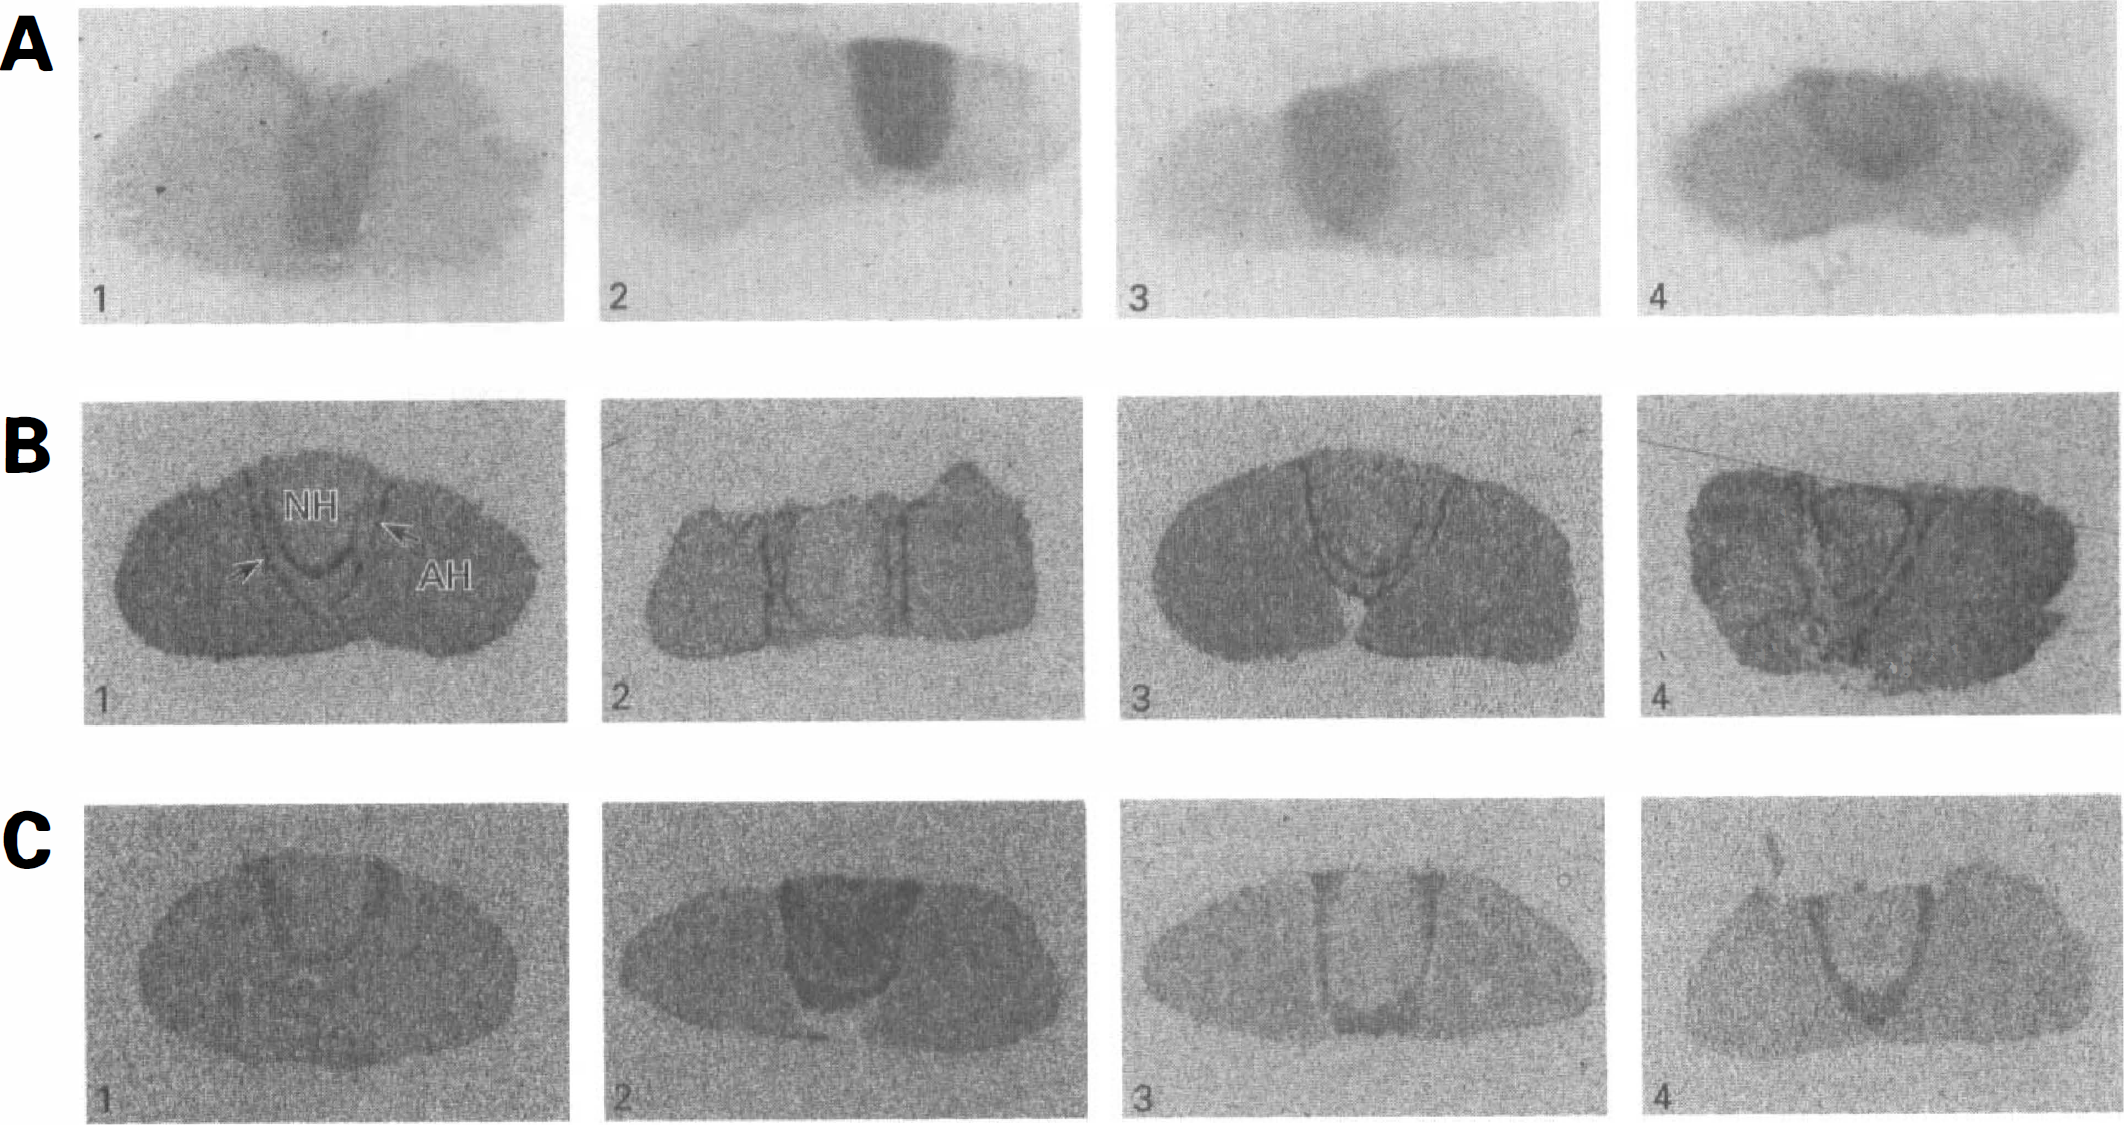
Effects of water deprivation and restoration on regional rates of cerebral glucose utilization and GLUT1 and GLUT3 mRNA expression in the pituitary gland.
Regional rates of cerebral glucose utilization (μmol · 100g−1 · min−1) in water-deprived and water-restored rats
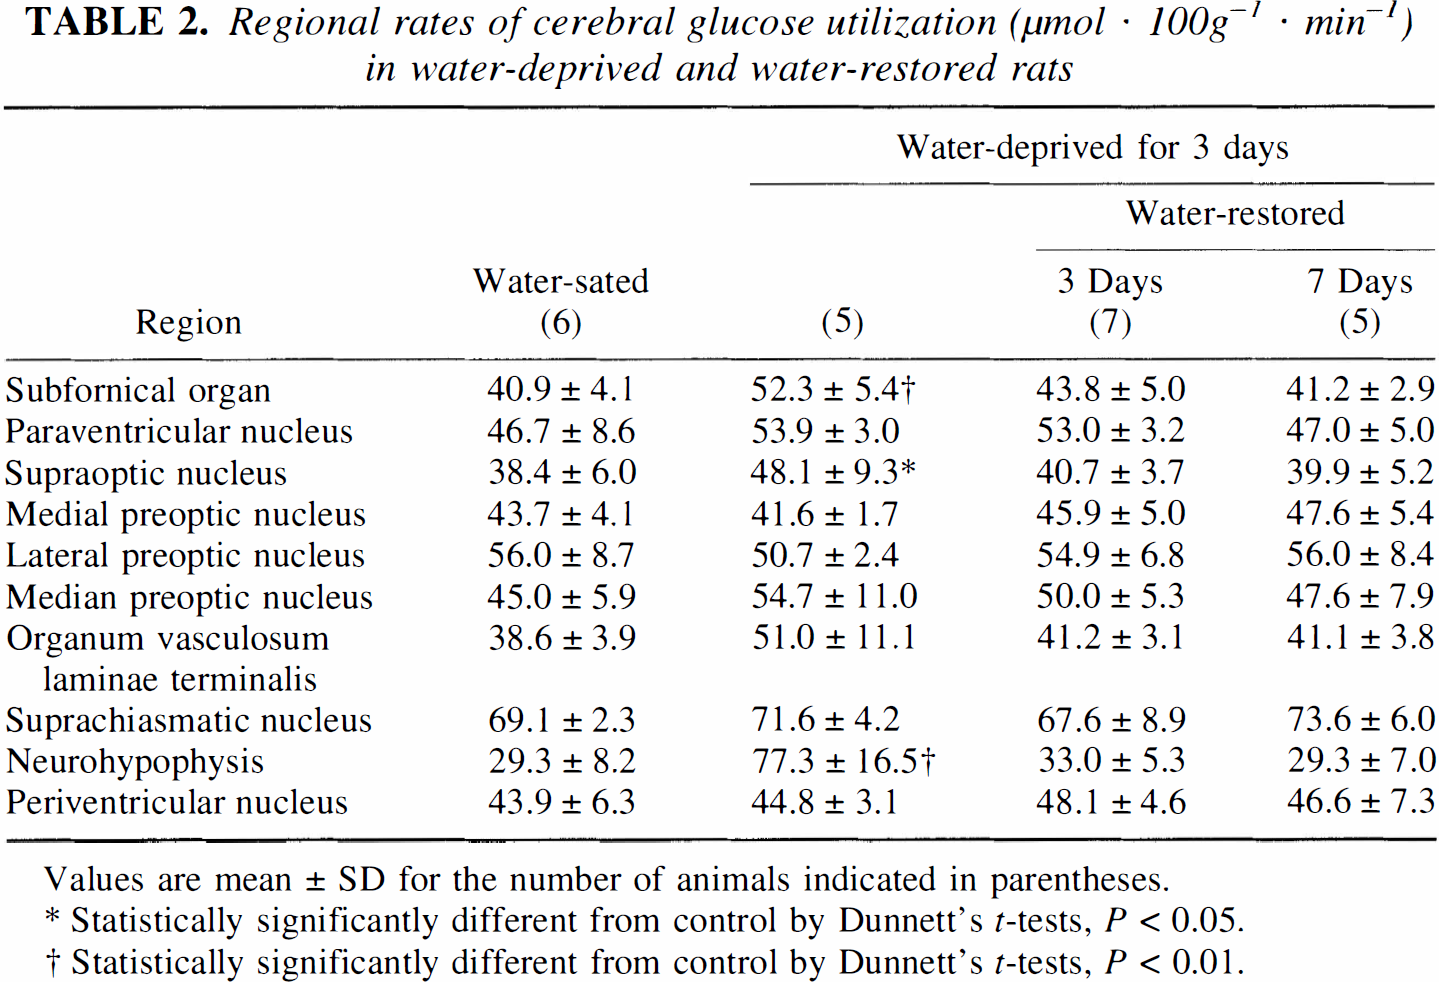
Values are mean ± SD for the number of animals indicated in parentheses.
Statistically significantly different from control by Dunnett's t-tests, P < 0.05.
Statistically significantly different from control by Dunnett's t-tests, P < 0.01.
Expression of glucose transporters
The neurohypophysis is comprised of the axon terminals of the magnocellular neurons surrounded by glial-like pituicytes and microglia. These elements express specific glucose transporters: neurons-GLUT3; pituicytes-GLUT1; microglia-GLUT1 and GLUT5. The 55-kDa form of GLUT1 is not detected as the neurohypophysis lacks a blood-brain barrier (Weindl and Sofroniew, 1981; Kadekaro et al., 1983). Three days of water deprivation induced an overall decrease in the expression of GLUT1 mRNA, whereas GLUT3 and GLUT5 mRNA were increased (Figs. 1B, 1C, and 2; Table 3). Levels of GLUTs 1, 3, and 5 mRNAs returned to control levels within 3 days of water restoration (Figs. 1B, 1C, and 2; Table 3). In agreement with our previous study (Vannucci et al., 1994a), GLUT3 protein levels were increased (43%; P < 0.01) after 3 days of dehydration and required 7 days of water restoration to return to control concentrations (Fig. 3). In contrast to its effect on GLUT1 mRNA expression, water deprivation induced a 28% increase in the concentration of the 45-kDa form of GLUT1 which was restored to control levels by 3 days of water repletion. All of the Western blot determinations were performed on individual neurohypophyses (50 to 60 μg/lobe). The combination of limited tissue availability and insensitive anti-GLUT5 antibodies prevented corresponding GLUT5 protein determinations.
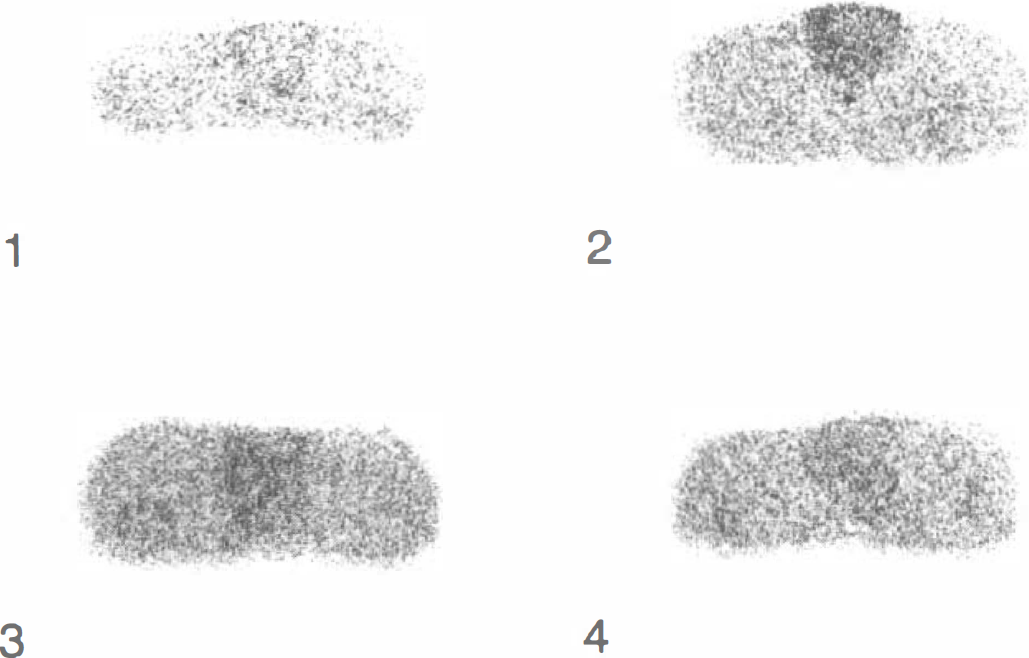
Effects of dehydration and rehydration on GLUT5 mRNA expression in the pituitary gland. Representative autoradiograms of pituitary sections subjected to in situ hybridization with a 35S-labeled riboprobe for GLUT5. Three rats were studied under each of the four conditions. Sections were taken from water-sated control (1) and from the rats after 3 days of water deprivation (2); 3 days of water deprivation followed by 3 days of water restoration (3); 3 days of water deprivation followed by 7 days of water restoration (4).
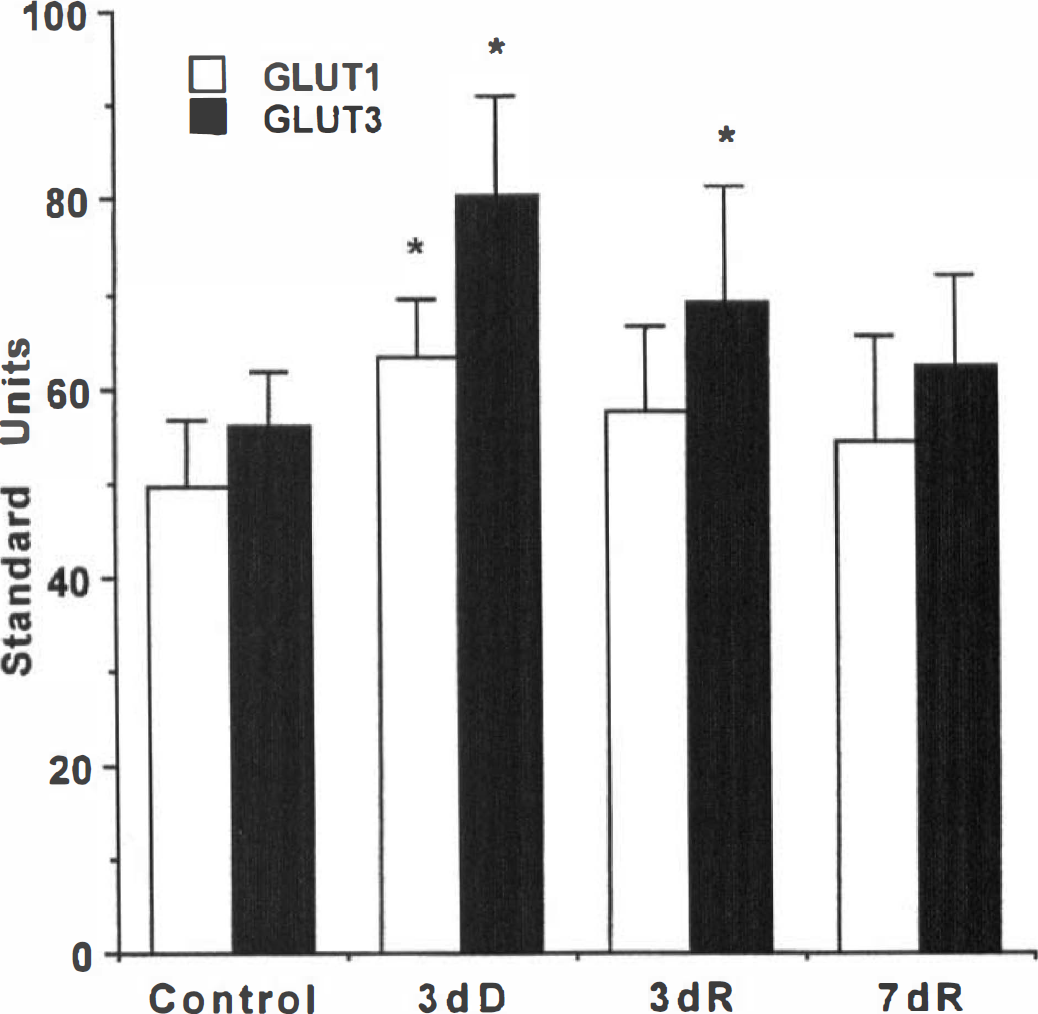
Effects of water deprivation and restoration on GLUT1 and GLUT3 protein expression in the neurohypophysis. Phosphorimage analysis of individual neurohypophyses Western blotted for GLUT1 and GLUT3 and expressed relative to brain standard in standard units. Bars represent mean ± SD for groups of 11 to 12 animals per group. 3dD, 3 days of water deprivation; 3dR, 3 days of water deprivation followed by 3 days of water restoration; 7dR, 3 days of water deprivation followed by 7 days of water restoration. *P < 0.01, statistically significantly different from water-sated control, Dunnett's.
GLUT1 and GLUT3 mRNA (% of water-sated control)
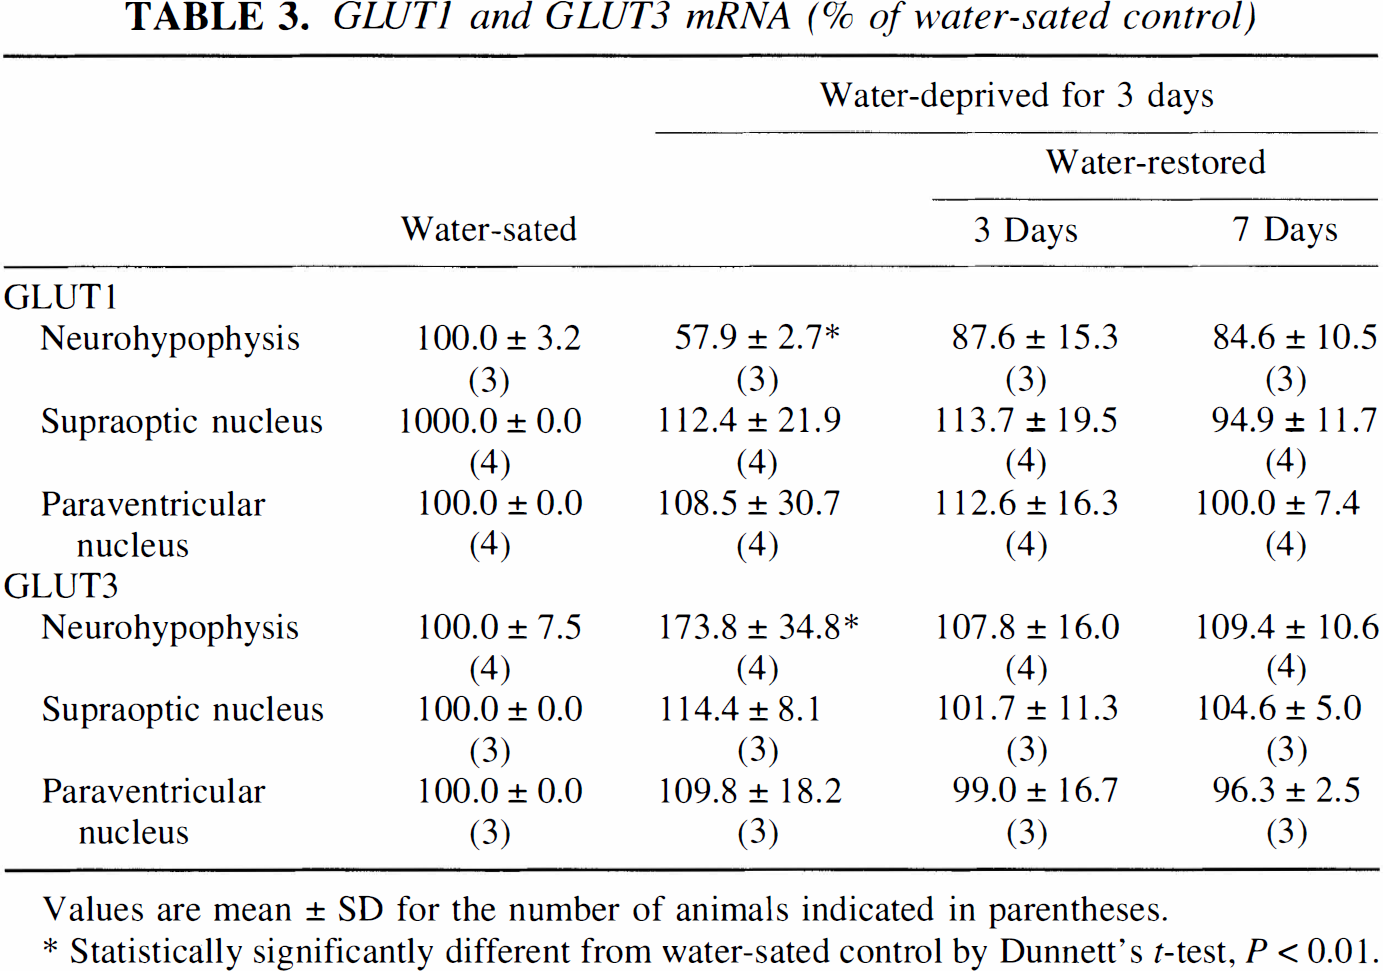
Values are mean ± SD for the number of animals indicated in parentheses.
Statistically significantly different from water-sated control by Dunnett's t-test, P < 0.01.
In the supraoptic and paraventricular nuclei which are comprised of both microvascular and nonvascular elements, GLUT1 mRNA levels appear to increase after 3 days of water deprivation and return to control levels after 7 days of water restoration (Fig. 4A, Table 3), although these changes did not reach statistical significance. Consistent with observations in the neurohypophysis, GLUT3 mRNA in the supraoptic and paraventricular nuclei also appears to increase after 3 days of water deprivation and to return to baseline after 3 days of water restoration (Fig. 4B, Table 3). No alterations in GLUT3 mRNA were detected in the subfornical organ (data not shown).
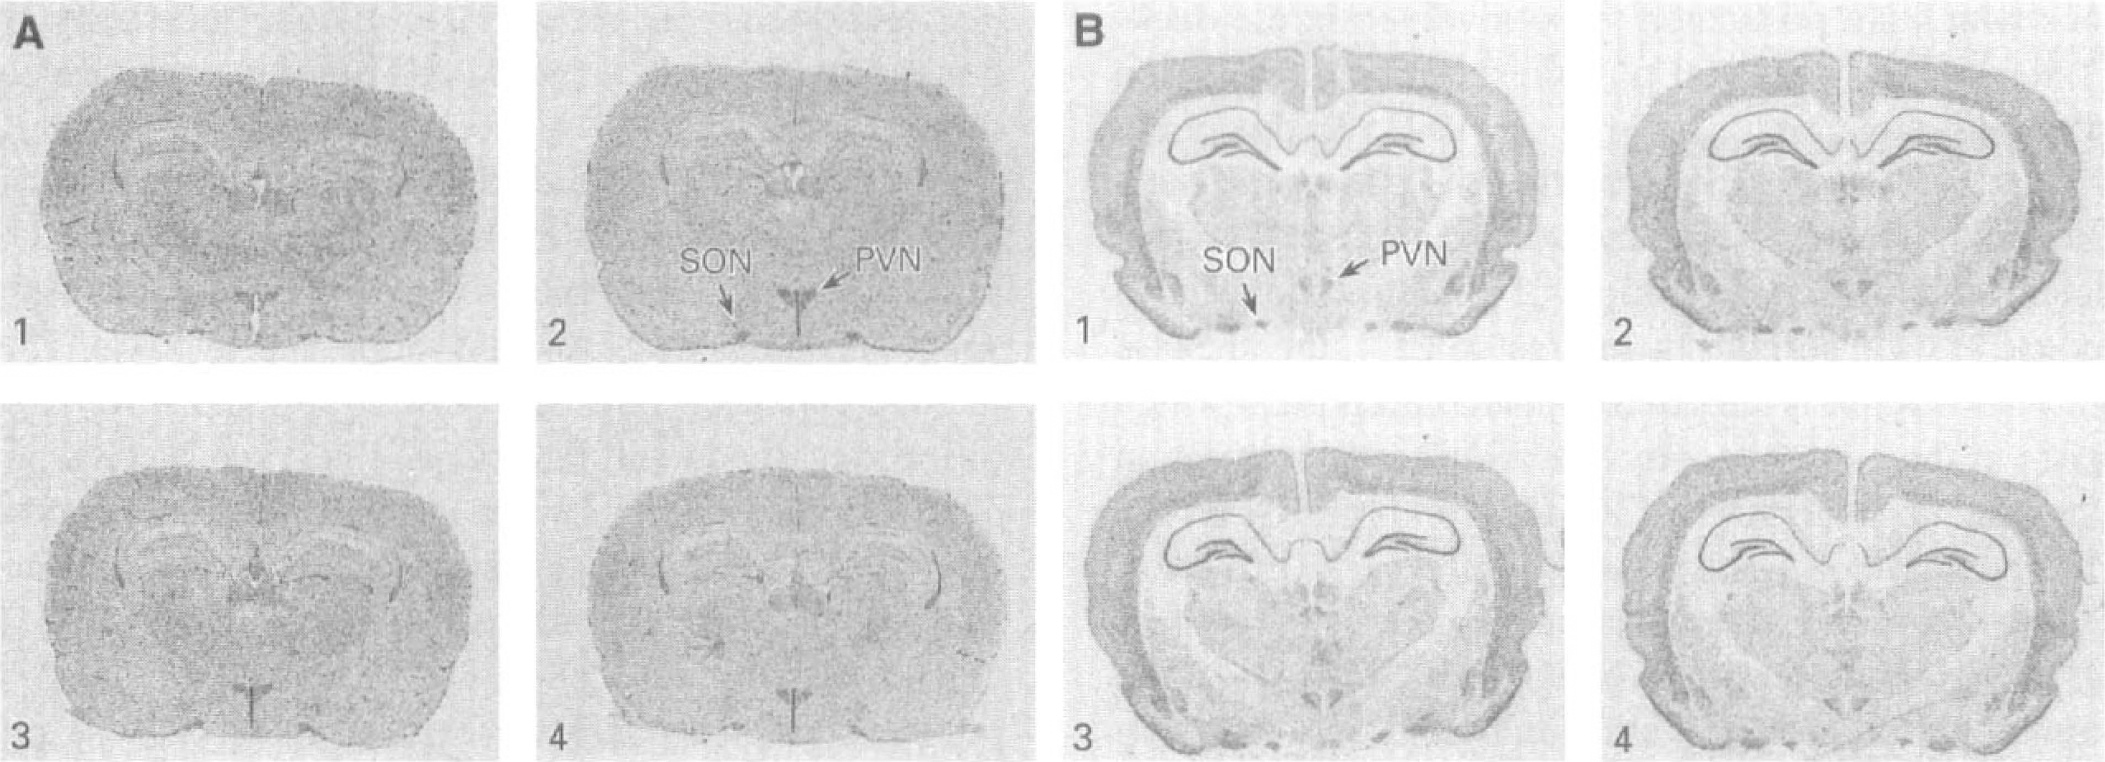
Effects of dehydration and rehydration on GLUT1 and GLUT3 mRNA expression in rat brain. Representative autoradiograms of brain sections subjected to in situ hybridization with 35S-labeled riboprobes for GLUT1
DISCUSSION
The results of the present study support a relationship between experimentally induced changes in lCMRglc and the expression of GLUT1 and GLUT3 in the neurohypophysis. These results confirm and extend our previous study, which reported increased GLUT1 and GLUT3 protein levels in the neurohypophysis after 3 days of water deprivation (Vannucci et al., 1994a). We further demonstrate that these changes are fairly rapidly reversed by water restoration and that the changes in functional activity are most closely reflected in levels of GLUT3 mRNA and protein.
We used the autoradiographic [14C]deoxyglucose method to measure regional rates of glucose utilization because this method can be applied to the study of awake, unrestrained animals and it provides quantitative results with good spatial resolution (<200 μm) (Smith, 1983). The results of our studies are in good agreement with the previous studies by Kadekaro and colleagues, both in the absolute rates of glucose utilization and the magnitudes of the changes associated with the dehydration (Kadekaro et al., 1992). In both studies, statistically significant increases in lCMRglc were seen in the supraoptic nucleus, subfornical organ, and the neurohypophysis (Table 2). Increases in lCMRglc in the paraventricular nucleus, median preoptic nucleus, and organum vasculosum laminae terminalis were statistically significant in the study of Kadekaro et al. (1992) and approached statistical significance (0.05 < P < 0.1) in our study (Table 2). The extent and rapidity of the reversal of these processes by water restoration has not previously been described.
In situ hybridization was used to determine the extent to which these changes in glucose utilization were accompanied by corresponding alterations in the levels of expression of either GLUT1 or GLUT3 mRNA in the supraoptic and paraventricular nuclei as well as the neurohypophysis. An increase in GLUT3 expression was observed in both the supraoptic and paraventricular nuclei in the dehydrated animals. However, the increase was small and variable and did not reach statistical significance; it was rapidly reversed upon water restoration (Figs. 4A and 4B, Table 3). This modest increase was surprising given the dramatic increase in GLUT3 protein expression in the neurohypophysis (Fig. 3), which is made up of axon terminals from both hypothalamic nuclei. Although we cannot preclude the expression of GLUT3 by other cell types in the neurohypophysis, GLUT3 has not been detected in any other neural cell. The limited correspondence between GLUT3 protein levels in the axon terminals and GLUT3 mRNA levels in the neuronal cell bodies might be explained by the significant increase in GLUT3 mRNA in the neurohypophysis (Fig. 1C; Table 3). The finding of significant levels of GLUT3 mRNA in the neurohypophysis of dehydrated rats is novel and adds GLUT3 to a select number of mRNAs present in the axons of the magnocellular neurons. These include the mRNAs for oxytocin, vasopressin, and BC1 (brain cytoplasmic 1), a small nontranslated RNA polymerase III transcript. Both BC1 and GLUT3 are induced by dehydration, and their increased axonal expression is reversed by 1 to 3 days of water restoration (Jirikowski et al., 1990; Mohr et al., 1991; Tiedge et al., 1993, 1999; Trembleau et al., 1995). The purpose and fate of axonal mRNA are still not clear. It is believed that protein synthesis takes place in the cell body and that proteins such as GLUT3, which are known to be present in synaptic terminals (Thoidis et al., 1998), rely entirely on anterograde axoplasmic transport to reach axon terminals (Droz and Lebond, 1963; Grafstein and Foreman, 1980). It is unlikely that the GLUT3 mRNA or other mRNAs are translated in the axon terminals because this region lacks rough endoplasmic reticulum and the Golgi apparatus necessary to synthesize and glycosylate membrane proteins such as GLUT3 (Gainer and Wray, 1994). There is, however, growing evidence that these axonal mRNAs become associated with ribonucleoprotein complexes which are postulated to be involved in the docking, storage, and potential posttranscriptional regulation (Jirikowski et al., 1990; Mohr et al., 1991; Tiedge et al., 1993, 1999). It is hypothesized that the purpose of such an axonal system of sorting and transport of mRNA is for efficient and timely regulation of protein synthesis in response to local stimuli. In contrast to BC1, the increase in GLUT3 mRNA is clearly translated into protein which persists in the neurohypophysis during water restoration beyond the normalization of lCMRglc and mRNA levels.
Interpretation of the results pertaining to the effects of the water deprivation/restoration protocol on regional GLUT1 mRNA and protein levels and lCMRglc is more complex which may be attributable to the fact that GLUT1 is expressed by more than a single cell type. In addition to nerve terminals arising primarily from magnocellular neurons, the neurohypophysis contains microglia, pituicytes, and endothelial cells, all of which express the 45-kDa isoform of GLUT1 (Lawson et al., 1993). Although in situ hybridization results do not distinguish between the two GLUT1 isoforms, it can be assumed that the alterations in GLUT1 mRNA correspond to the 45-kDa isoform because the 55-kDa isoform is not found in the neurohypophysis (Vannucci et al., 1994a). There is a consistent divergence between GLUT1 mRNA and protein expression in the neurohypophysis during the water deprivation/restoration regimen. For example, the increase in GLUT1 protein observed upon dehydration is associated with a decrease in mRNA expression, and the decrease in GLUT1 protein levels seen upon water restoration is accompanied by an increase in GLUT1 mRNA to normal levels (Figs. 1B and 3, Table 3). The observed increase in GLUT1 protein might be associated with the morphologic alterations that take place in response to water deprivation. After chronic dehydration, the pituicytes in the neurohypophysis retract allowing for increased contact between the nerve terminals and the basal lamina (Hatton, 1988, 1990). The microglia are also involved in this remodeling in that they begin to envelop more neurosecretory terminals (Mander and Morris, 1994), and they undergo a burst of DNA synthesis (Lawson et al., 1993). These latter changes which are indicative of microglial adaptation may also account for the observed increase in GLUT5 mRNA in the neurohypophysis (Fig. 2). There may be a neuronal component to the effect of water deprivation on GLUT1 levels in the neurophypophysis. GLUT1 is considered to be a stress-induced protein, which increases in response to glucose and oxygen deprivation (Wertheimer et al., 1991; see Klip et al., 1994 for review). Whereas neurons in vivo do not normally express GLUT1, transient GLUT1 mRNA expression has been observed in pyramidal neurons of the hippocampus in ischemic rat brains (Lee and Bondy, 1993). If magnocellular neurons do express GLUT1 in response to dehydration, it is clearly not sequestered in the axon terminals, indicating that regulation of GLUT1 and GLUT3 differ under the conditions of our study.
A variety of pre- and posttranslational mechanisms have been proposed to explain the increases in GLUT1 mRNA and protein expression associated with stress responses such as glucose deprivation and hypoxia. These include enhanced rates of transcription and mRNA stabilization (Boado and Pardridge, 1993; see McGowan et al., 1995 for review; Dwyer et al., 1996; Tsukamoto et al., 1998). However, such mechanisms do not appear to explain the observations made in this study. The increased concentration of GLUT1 protein in the neurohypophysis and the persistent expression of GLUT3 may, however, be because of a depression in the turnover of glucose transporter proteins as observed for GLUT3 in L6 cells (Khayat et al., 1998). The tight correlation between functional activity, cerebral blood flow, and metabolism, as measured by lCMRglc, is well established (Sokoloff, 1977; Klein et al., 1986). Under almost all circumstances the uptake of glucose across the blood barrier and into the neurons and glia, mediated by GLUTs 1 and 3, is sufficient to support the regional cellular activity. Kuschinsky and colleagues have quantified the regional distribution of the respective transporter proteins using a radioimmunolocalization technique and correlated these regional distributions with the corresponding lCMRglc in the resting conscious rat (Rahner-Welsch et al., 1995; Zeller et al., 1995, 1997). These studies suggest that lCMRglc is more closely related to capillary density and the distribution of the microvascular GLUT1 than GLUT3 (Zeller et al., 1997). Our own studies in the developing rat brain have demonstrated a positive temporal relationship between lCMRglc and GLUT3 during normal development, especially during the period of rapid synaptogenesis and the consequent increase in neuronal activity (Vannucci, 1994; Vannucci et al., 1994b, 1997b). Conversely, in Alzheimer's disease, there are decreases in GLUT3 concentration, particularly in the parietal and temporal cortices, two areas in which deficits in lCMRglc are characteristic of the disease (Simpson et al., 1994). Thus, the results of these studies would suggest that both development and neurodegeneration are accompanied by changes in the GLUT3 glucose transporters consistent with changing activity. The results presented in this study further support the close relationship between lCMRglc and GLUT3 under conditions of experimentally induced alterations in functional activity. The advantage of the hypothalamoneurohypophysial system in this regard is that in vivo activation of the hypothalamic magnocellular neurons results in increased glucose utilization in the neurohypophysis. The results of this study demonstrate that the observed alterations in glucose utilization are associated with alterations in levels of GLUT3 mRNA and protein and are independent of changes in blood-brain barrier GLUT1. This system should prove useful in the elucidation of the cellular mechanisms involved in regulating the expression and trafficking of GLUT3 mRNA and protein.
Footnotes
Acknowledgments
The authors thank Bill Ballew (National Heart, Lung, and Blood Institute) for the measurements of the electrolytes and Dr. Joan Summy-Long (Penn State University, Hershey Medical Center; HD-25498) for performing the vasopressin radioimmunoassays.