
Abstract
Glucose is the major substrate that sustains normal brain function. When the brain glucose concentration approaches zero, glucose transport across the blood–brain barrier becomes rate limiting for metabolism during, for example, increased metabolic activity and hypoglycemia. Steady-state brain glucose concentrations in α-chloralose anesthetized rats were measured noninvasively as a function of plasma glucose. The relation between brain and plasma glucose was linear at 4.5 to 30 mmol/L plasma glucose, which is consistent with the reversible Michaelis–Menten model. When the model was fitted to the brain glucose measurements, the apparent Michaelis-Menten constant, Kt, was 3.3 ± 1.0 mmol/L, and the ratio of the maximal transport rate relative to CMRglc, Tmax/CMRglc, was 2.7 ± 0.1. This Kt is comparable to the authors' previous human data, suggesting that glucose transport kinetics in humans and rats are similar. Cerebral blood flow (CBF) was simultaneously assessed and constant above 2 mmol/L plasma glucose at 73 ± 6 mL 100 g−1 min−1. Extrapolation of the reversible Michaelis–Menten model to hypoglycemia correctly predicted the plasma glucose concentration (2.1 ± 0.6 mmol/L) at which brain glucose concentrations approached zero. At this point, CBF increased sharply by 57% ± 22%, suggesting that brain glucose concentration is the signal that triggers defense mechanisms aimed at improving glucose delivery to the brain during hypoglycemia.
A supply of glucose is crucial to meet cerebral energy demands because the brain relies almost exclusively on glucose for sustained adenosine triphosphate (ATP) generation (Hawkins et al., 1983; McIlwain and Bachelard, 1985). Glucose enters cells through facilitated diffusion mediated by specific transporters (Crone, 1965). Glucose transport across the blood–brain barrier becomes the rate-limiting step in the regulation of brain function when brain glucose concentrations approach zero, for example, during hypoglycemia (Lewis et al., 1974; Pardridge, 1984). To understand the role of brain glucose in the regulation of brain energy metabolism, quantitative measurements of glucose transport are important. The knowledge of the mechanism of brain glucose transport and brain glucose concentrations also is important in the interpretation of tracer studies using radiolabeled glucose or glucose analogs (Betz et al., 1976; Blomqvist et al., 1991; Brooks et al., 1986; Feinendegen et al., 1986; Gjedde and Diemer, 1983; Gutniak et al., 1990).
Traditionally, glucose transport has been described based on the standard Michaelis–Menten kinetics, which assumes unidirectional product formation. The standard model also predicts that an upper limit exists for the brain glucose concentration at saturating plasma glucose concentrations. It is a basic assumption of standard Michaelis–Menten kinetics that the product formation does not result in substantial reverse flux, that is, binding of the product (transmembrane glucose) with the enzyme (glucose transporter). This condition can be achieved in vitro by measuring the initial rate of product formation right after combining enzyme and substrate in the solution. However, in vivo it is difficult to measure the formation of brain glucose content from zero without interfering with brain function and metabolism, which itself can affect brain glucose content. The standard Michaelis–Menten formulation is expected to be valid when the transmembrane glucose concentration is low compared with the Kt of glucose transport. However, in the literature, brain glucose concentrations approached and exceeded reported values of the Michaelis–Menten constant (Kt) at high plasma glucose concentrations (Bachelard et al., 1973; Cunningham, 1986; Gjedde and Diemer, 1985; Mason et al., 1992; Pardridge, 1984). From the formulation of the Michaelis–Menten kinetics, it is clear that when brain glucose concentrations are comparable with the measured Kt of glucose transport, a substantial fraction of the ablumenal side of the glucose transporter (“enzyme”) must be bound to brain glucose (“product”). Binding of glucose at the ablumenal membrane is expected to decrease the affinity for glucose transport as judged from the properties of the glucose transporter GLUT-1 present ubiquitously at the blood–brain barrier (Carruthers and Helgerson, 1991). For this reason and the additional reasons stated by Gruetter et al., the reversible Michaelis–Menten model is expected to describe glucose transport at steady state more reliably (Gruetter et al., 1998). A general consequence of the reversible model is a linear relation between brain and plasma glucose concentrations. The reversible model is indeed able to provide a more consistent description of cerebral glucose transport, and the resulting Kt is on the order of 1 to 3 mmol/L (Cunningham et al., 1986; Gruetter et al., 1998).
Noninvasive measurements of brain glucose under physiologic conditions are possible using in vivo nuclear magnetic resonance (NMR). Glucose signals have been observed in humans and animals using 1H nuclear magnetic resonance spectroscopy (MRS) (Gruetter et al., 1992b, 1996a, 1998; Inubushi et al., 1993; Keltner et al., 1998; Pfeuffer et al., 2000; van Zijl et al., 1993) or 13C MRS (Beckmann et al., 1991; Gruetter et al., 1992a, 1998; Mason et al., 1992). In humans, several localized measurements of brain glucose transport have been reported (Gruetter et al., 1992a, 1996b, 1998). In animals, glucose signals from enflurane-anesthetized rats were quantified based on the postmortem lactate signal (Mason et al., 1992). The significance of the animal study by Mason et al. may have been limited by the lack of localization as judged from the detection of intense extracerebral lipid resonances indicating contamination of the signal from noncerebral sources.
Currently, glucose transport kinetic measurements are available for rats anesthetized with enflurane or pentobarbital, but not for those anesthetized with light doses of α-chloralose. The type of anesthetic can affect the cerebral glucose concentration because of differential effects on the cerebral metabolic rate (Archer et al., 1990; Ueki et al., 1992). It is known that light α-chloralose anesthesia preserves functional activation during sensory stimulation, for example, in the somatosensory cortex (Ueki et al., 1988, 1992). Thus, it has become one of the most commonly used anesthetics for functional magnetic resonance imaging (fMRI) (Gyngell et al., 1996; Lee et al., 1999; Mandeville et al., 1997) and 13C isotopic turnover measurements (Hyder et al., 1996). Therefore, the authors sought to examine the relation between brain and plasma glucose using the reversible Michaelis–Menten model in α-chloralose anesthetized animals.
It is known that CBF increases with the cerebral metabolic rate of glucose utilization (CMRglc). A marked increase of CBF during acute hypoglycemia in humans and animals, despite an unchanged or decreased CMRglc, has been reported (Abdul-Rahman et al., 1980; Della Porta et al., 1963; Nilsson et al., 1981; Norberg and Siesio, 1976; Siesjo et al., 1983; Horinaka et al., 1997). However, the mechanism that triggers these increases in CBF is not clear to date (Nehlig, 1997) and is most likely different from that causing changes in CBF because of different brain activity. How CBF changes are related to brain glucose concentrations during hypoglycemia has not been reported in vivo. Therefore, the authors sought to simultaneously measure glucose transport and CBF to further understand the regulation of CBF and cerebral energy metabolism in vivo during hypoglycemia, which may shed light on what metabolic signal can be responsible for triggering cerebral protection mechanisms.
The purpose of this study was twofold: (1) to determine whether the reversible Michaelis–Menten kinetics accurately describe brain glucose transport from hypoglycemia to hyperglycemia in the rat, and (2) to determine the brain glucose concentration at which CBF is acutely increased during hypoglycemia. Direct measurements of cerebral glucose and global cerebral blood flow were performed in the α-chloralose anesthetized rat brain using localized NMR methods.
MATERIALS AND METHODS
Animal preparation
The current study was performed according to the guidelines for the care and use of laboratory animals at the University of Minnesota and was approved by the Institutional Animal Care and Use Committee (IACUC). Male Sprague–Dawley rats (n = 24; 262 ± 27 g, mean ± SD) were fasted overnight with access to water before studies. Animals were anesthetized using 2% isoflurane (Marsam Pharmaceuticals, Cherry Hill, NJ, U.S.A.) in a 1:1 mixture of nitrous oxide (N2O) and oxygen (O2) gases for surgery. Animals then were intubated and ventilated with a pressure-driven ventilator (Kent Scientific, Litchfield, CT, U.S.A.). End-tidal CO2 was monitored with a capnometer (SC-300; BCI International, Waukesha, WI, U.S.A.) during surgery and experiments.
Catheters were inserted into both femoral arteries for blood gases and glucose analyzes and monitoring of arterial blood pressure, and catheters also were inserted into both femoral veins for intravenous infusion of α-chloralose, glucose, and insulin. Arterial blood pressure, respiratory rate and pattern were continuously monitored with a multitrace recorder (AcqKnowledge, Biopak, CA, U.S.A.).
Right after surgery, anesthesia was switched to α-chloralose, which was administered as follows: 40 minutes after a 40 mg/kg bolus injection, a continuous intravenous infusion was started (24 to 26.7 mg kg−1 h−1). Animals were secured using a home-built Delrin holder with a bite bar and two ear inserts to provide a fixed position of the skull. The animal then was placed in an acrylic holder attached to an insert in the gradient coil, which ensured stability of the experimental setup for extended measuring times. Body temperature was maintained at 37.0°C ± 0.5°C with a warm water circulation system based on a feedback obtained from a rectal temperature probe (Cole Palmer, Vernon Hills, IL, U.S.A.).
Following a previously described protocol, 99% enriched [1-13C] D-glucose (20% weight/volume solution; Isotec, Miamisburg, OH, U.S.A.) was infused into the left femoral vein (Choi et al., 1999). The infusion rate of glucose was continuously adjusted based on the NMR signals of brain glucose and the concomitantly measured plasma glucose concentrations to achieve stable target glycemic levels. Measurements were performed after each glucose level had been stable for more than 20 minutes. To induce hypoglycemia, insulin (6 to 10 IU/kg, Humulin R; Eli Lilly & Co., Indianapolis, IN, U.S.A.) was infused intravenously for 20 to 50 minutes (Choi et al., 2000a, 2000c). Arterial blood was withdrawn from the femoral artery through a Teflon tubing line (Spectrum Chromatography, Houston, TX, U.S.A.) for blood gas analysis (Pco2, Po2) and glucose measurements at 25-minute intervals. Blood was immediately centrifuged after sampling, and plasma glucose concentrations were measured in a spectrophotometer using a hexokinase method. The concentration of whole blood glucose also was measured using a glucose oxidase method (Roche Diagnostics, Indianapolis, IN, U.S.A.), calibrated against the plasma glucose measurements. Physiologic parameters were adjusted and maintained within normal ranges throughout experiments.
Nuclear magnetic resonance methods
All experiments were performed on a 9.4 Tesla, 31-cm bore horizontal magnet (Magnex Scientific, Abingdon, U.K.), interfaced to an INOVA console (Varian, Palo Alto, CA, U.S.A.). An actively shielded gradient coil (Magnex Scientific) with an 11-cm inner diameter was used, which was capable of switching 300 mT/m in 500 microseconds. A quadrature 1H radiofrequency (RF) coil (14 mm in diameter) and a linear three-turn 13C RF coil (12 mm in diameter) (Adriany and Gruetter, 1997) were used as a transceiver for 1H MRS and MRI, as well as for 13C MRS, respectively. A 99% 13C-enriched formic acid sphere was located at the center of the 13C coil as an external reference, and the coil was placed on the animal's head as described previously (Choi et al., 2000b). A butterfly-shaped RF coil (5 mm in diameter) was built according to Silva et al. (1995) for arterial spin labeling (see below). The neck coil was positioned under the neck of the animals, approximately 2 cm from the center of the brain. Automated, localized shimming using a fully adiabatic version of FAST(EST)MAP (Gruetter, 1993; Gruetter and Tkac, 2000) was used to adjust the currents in all first-and second-order shim coils. The field homogeneity resulted in approximately 20-Hz full width at half maximum of the in vivo water signal in a nominal ∼500 μL volume (8.5 × 6 × 10 mm3, as defined by the pulse sequence parameters). The nominal volume defined by the RF pulses and the concomitant gradients is larger than the sensitive volume of the small surface coil because of the rapid fall-off of the RF field along the small 13C RF coil axis. However, the external reference method is based on the comparison of identical in vivo and phantom experiments; thus, potential effects on the quantification of the signals because of B1 inhomogeneity are minimized (Choi et al., 1999; Gruetter et al., 1998 and references therein). Three-dimensional localization based on outer volume saturation was used to ensure complete elimination of signals from outside of the volume of interest (VOI) (Choi et al., 2000b). The VOI was placed in the rat brain to avoid signal contamination from extracerebral tissues, such as adipose tissue and muscle, which have been shown to provide contamination to the whole head signal even when using a small surface coil (Choi et al., 1999).
Quantification of brain glucose signals
13C magnetic resonance spectroscopy
A 99% enriched [1-13C] D-glucose solution (20% weight/volume solution) was infused for at least 1.5 hours before the first measurement of brain glucose was performed. Brain glucose concentrations were measured after the NMR signals had been stable within 10% for at least 25 minutes. The in vivo 13C NMR signals of glucose were quantified using the external reference method by comparison with the measurements of a phantom containing 0.9 mmol/L of 99% enriched [1-13C] D-glucose after calibration of loading differences and Nuclear Overhauser effects. Lorentzian fitting using spectrometer software was used to obtain the integral of glucose C1. Glucose concentration in the brain was calculated based on the following equation (Choi et al., 1999; Gruetter et al., 1998):
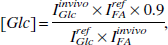
where IGlc and IFA are the integrals of glucose and the formic acid signals, respectively, and 0.9 is the 13C glucose concentration in the reference [1-13C] D-glucose phantom. Superscripts “ref” and “in vivo” refer to the reference phantom and the in vivo rat brain, respectively.
1H magnetic resonance spectroscopy
To estimate the 13C fractional enrichment of plasma glucose, 1H NMR spectra of plasma samples were obtained using a stimulated echo acquisition mode (STEAM) sequence. Plasma samples were obtained 1 hour after the start of glucose infusion for each animal and deproteinized using perchloric acid.
In addition, 1H NMR spectra were acquired in three animals for absolute quantification of brain glucose signals with 12C glucose infusion. The glucose infusion protocol was identical to the 13C NMR experiments as described above. Glucose quantification was performed by frequency domain analysis with LCModel (Pfeuffer et al., 1999) from 150-μL volume in the brain relative to the water signal. A STEAM sequence with a VAPOR water suppression scheme was used (echo time = 2 milliseconds, repetition time = 5 seconds, and mixing time = 20 milliseconds) (Tkac et al., 1999).
Determination of glucose transport kinetics
The reversible Michaelis–Menten kinetics of glucose transport assumes that the product formation (that is, the transport of glucose into the brain or the formation of brain glucose from plasma glucose) is not unidirectional:
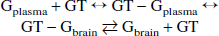
Gbrain (μmol/g) denotes brain glucose, Gplasma (mmol/L) denotes plasma glucose, and GT denotes the glucose transporter protein at the blood–brain barrier, GLUT-1. Using this model at steady state, brain glucose concentrations can be expressed by the following equation (Gruetter et al., 1998):
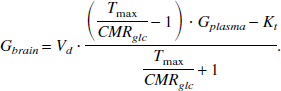
Because incorporation of multiple membranes in the glucose entry process does not change the linearity of brain glucose as a function of plasma glucose, the authors assumed the formulation for a single membrane (Gruetter et al., 1998). Tmax (μmol g−1 min), therefore, denotes the apparent maximal transport rate, Kt (mmol/L) denotes the apparent Michaelis-Menten kinetic constant, and Vd (0.77 mL/g) denotes the physical distribution space of glucose in the brain. The model assumes that the rate-limiting step for glucose transport is at the blood–brain barrier with a uniform physical distribution of glucose in extracellular and intracellular spaces (Gjedde, 1992; Gjedde and Diemer, 1983; Holden et al., 1991; Pfeuffer et al., 2000). From Eq. 3, it is clear that the reversible Michaelis–Menten model predicts a linear relation between brain glucose and plasma glucose in contrast to the standard Michaelis–Menten model, which predicts an asymptotic upper limit for the brain glucose concentration (Gruetter et al., 1998).
Glucose transport at steady state described by the reversible model is depicted schematically in Fig. 1A. The reversible model assumes that sufficient glucose molecules are present at the ablumenal membrane and that the glucose molecules bind a significant fraction of the transporter, as evidenced by brain glucose concentrations approaching the previously published Kt of transport (Gruetter et al., 1998). The reversible model further assumes that glucose bound to one side of the transporter will inhibit glucose transport from the other side of the membrane, as evidenced by cytochalasin B and maltose binding studies (Carruthers and Helgerson, 1991; Hamill et al., 1999). In contrast, the standard model, which is depicted schematically in Fig. 1B, assumes that flux of glucose in either direction is not affected by the concentration of the transported glucose. Therefore, this formulation is functionally equivalent to the assumption that two functionally distinct transporters are present for import and export of the glucose. To indicate the difference between the models with respect to the effect of product inhibition, those glucose molecules that have an effect on the glucose transport rates are indicated as filled circles in Fig. 1.
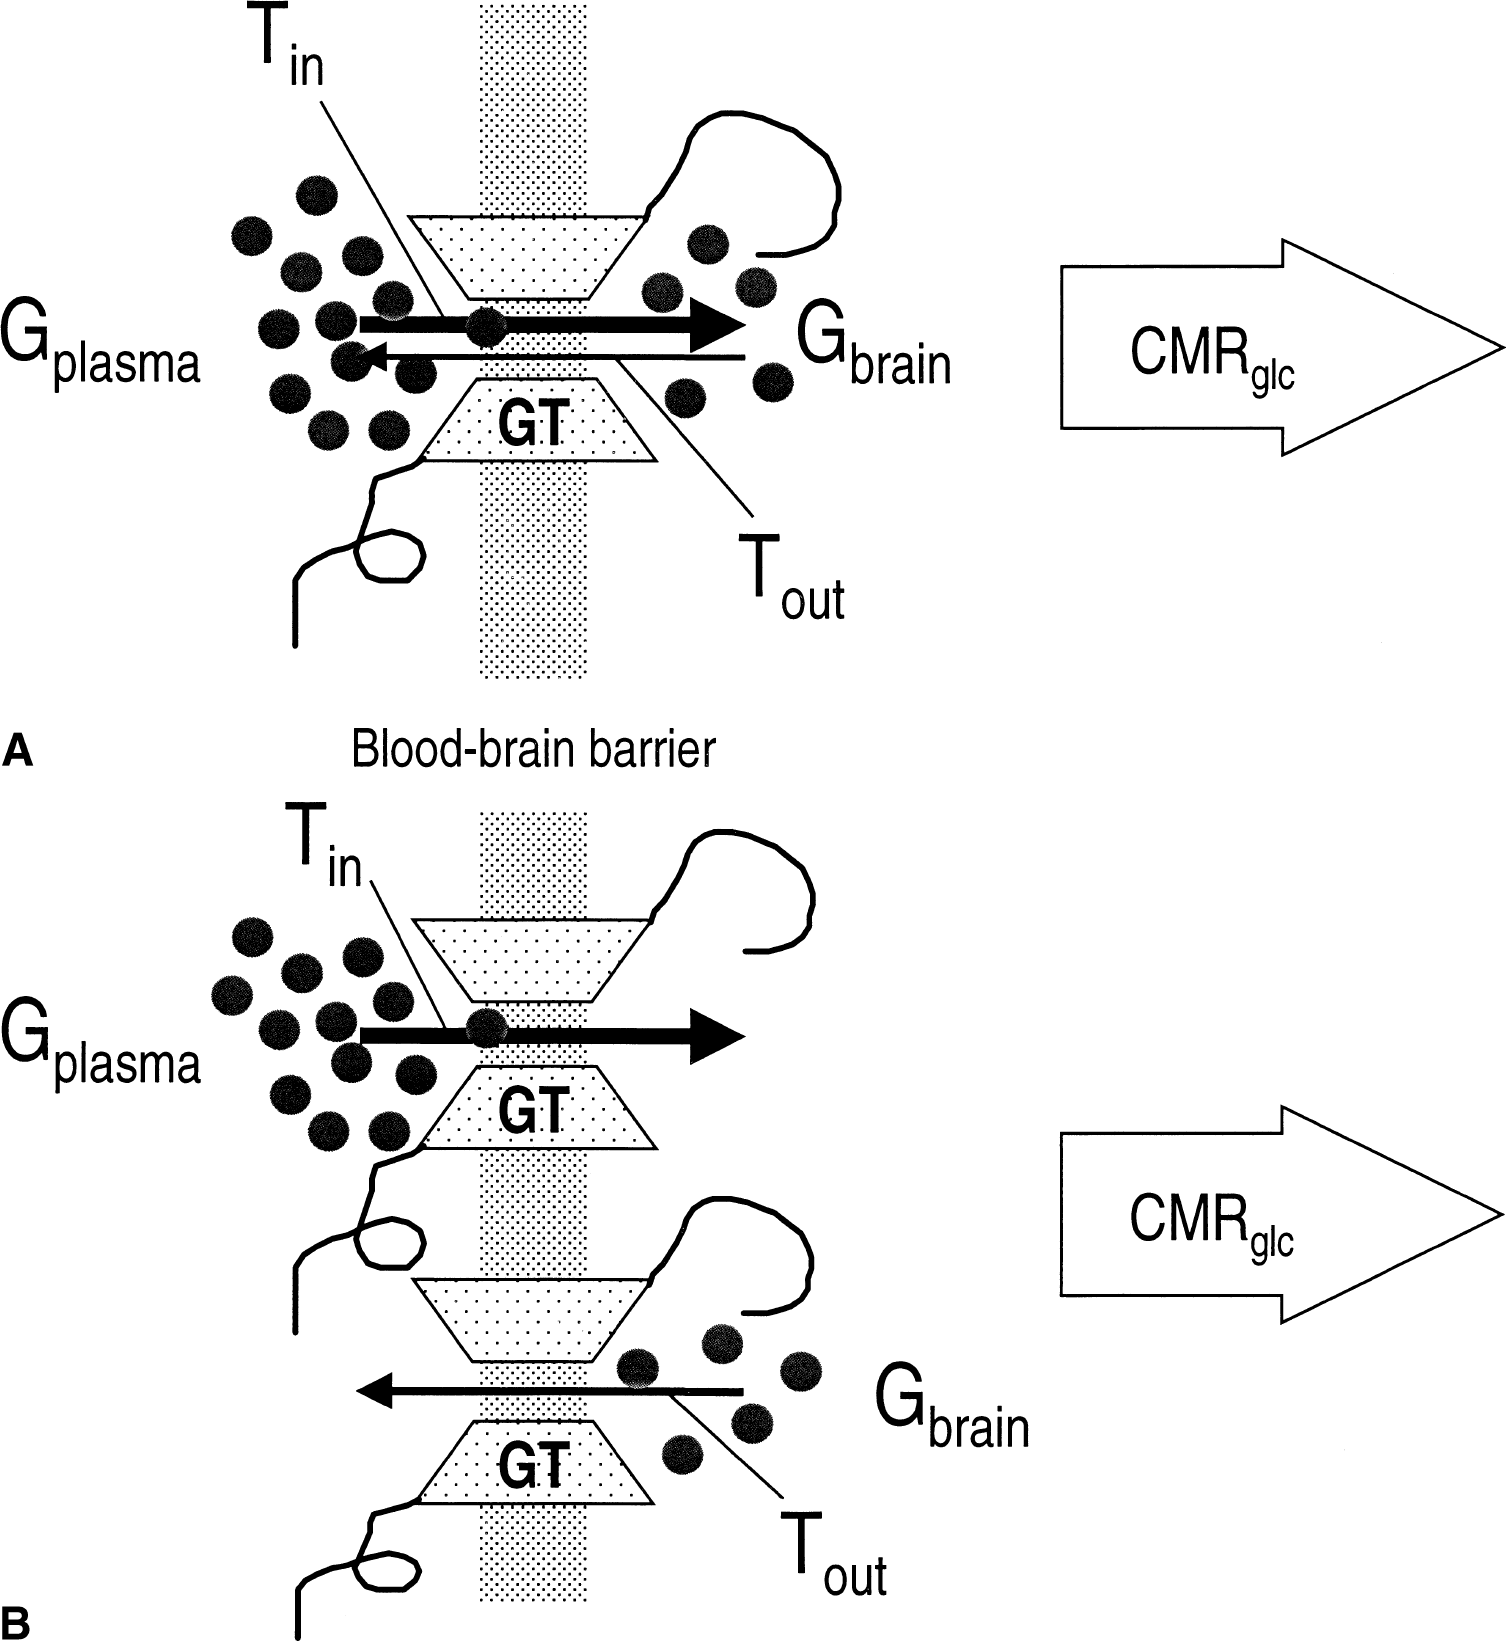
Reversible Michaelis–Menten kinetics of glucose transport.
The small blood volume in the rat brain of 3.4 mL/100 g (Shockley and LaManna, 1988) is expected to result in small contributions to the total glucose signal. Taking into account those signal fractions, the kinetic constants decrease by less than 8%. Therefore, the signal from blood glucose does not affect the conclusion of the current study and the contribution of plasma glucose to the total glucose signal was neglected. Fitting was performed using the Levenberg–Marquardt algorithm as described previously (Gruetter et al., 1998). Errors were determined using a Monte Carlo simulation with a 0.7 μmol/g root-mean-square noise level, which on average produced the same sum of residuals squared.
Cerebral blood flow measurement
Cerebral blood flow was measured in seven animals using a continuous arterial spin labeling method (Silva et al., 1995; Zhang et al., 1995). Measurements were performed when brain and plasma glucose levels were stable. A butterfly-shaped RF coil (5 mm in diameter) was placed under the neck (Silva et al., 1999). Coronal images (2-mm-thick) located at the center of the VOI were obtained using echo-planar imaging (EPI). Inplane resolution was 0.5 × 0.5 mm2, and images were averaged over 24 seconds (8 averages with TR = 3 seconds or 4 averages with TR = 6 seconds). To label arterial spins in the carotid arteries, RF pulses were applied to the neck coil for 3 seconds at +8.5 kHz relative to the brain water signal with a concomitant 10 mT/m gradient along the z-axis. Control images were acquired by changing the frequency of the RF irradiation symmetrically relative to the water frequency.
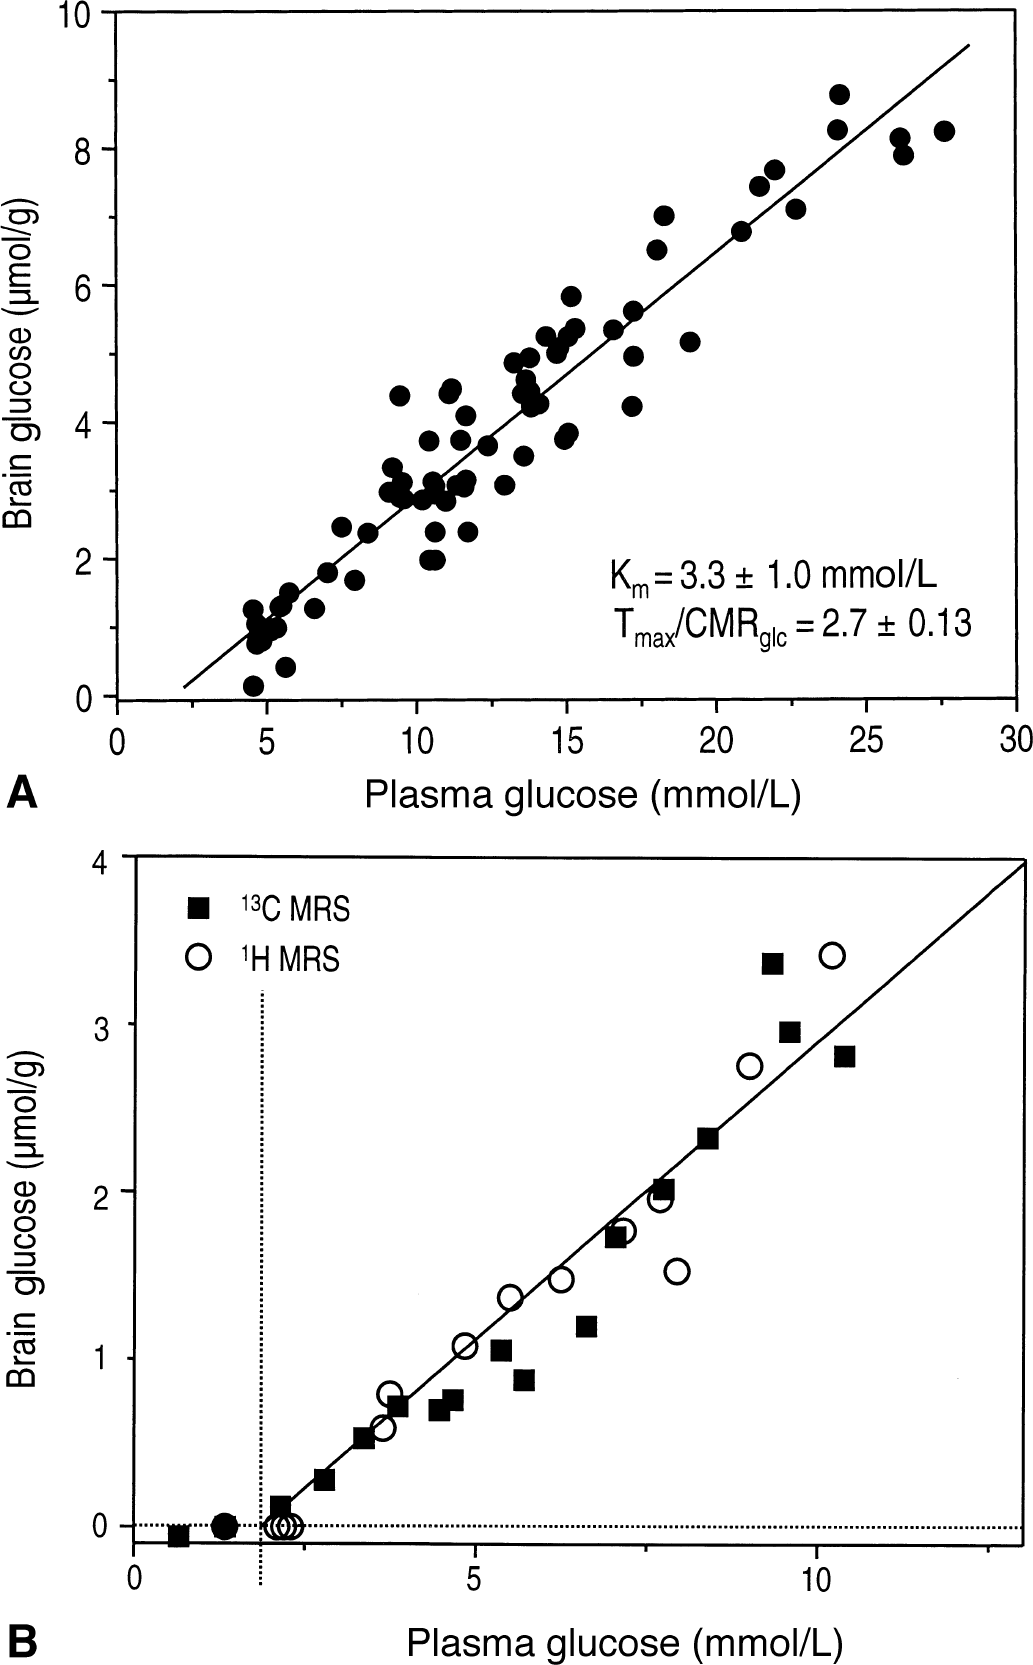
Cerebral blood flow maps were calculated according to the following equation (Silva et al., 1999; Zhang et al., 1995):
where λ (mL/g) denotes the brain–blood partition coefficient of water, T1 (s) the longitudinal relaxation time of tissue water, α is the efficiency of arterial spin labeling, and So and ST are signal intensities of control and arterial spin labeled images, respectively. The values used for the CBF calculation were λ of 0.9 mL/g (Herscovitch and Raichle, 1985) and T1 of 1.9 seconds (Tsekos et al., 1998). In the current study, it was verified that α was in agreement with the value of 0.81 (Silva et al., 1999 and references therein). The average value of CBF was calculated for an 8.5 × 6 mm2 region of interest. Continuous arterial spin labeling generally results in magnetization transfer (MT) from bound macromolecules to the free water signal within the sensitive volume of the tagging coil. This MT effect can be neglected if the RF field of the tagging and detection coils does not couple (Silva et al., 1999). However, in the current study, coupling was not negligible, resulting in RF being transferred from the tagging coil to the quadrature detection coil and concomitant MT effects (Pekar et al., 1996). Therefore, arterial spin labeling experiments were performed on each rat postmortem, where blood flow is zero, using identical methods as in the in vivo experiments. The postmortem signal difference (So − ST) was subtracted from each CBF measurement and incorporation of this correction term reduced interindividual scatter of CBF values.
RESULTS
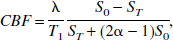
All brain glucose measurements (n = 24) were performed after glucose levels had been stable for more than 20 minutes. The physiologic parameters such as Pco2, Po2, pH, end-tidal CO2, and body temperature were well within the normal range for each measurement and are shown in Table 1 for four different levels of plasma glucose—hypoglycemia, mild hypoglycemia, euglycemia, and hyperglycemia. 13C NMR spectra were obtained with a 2.7-minute temporal resolution throughout the experiment. To eliminate any noncerebral signal contamination from outside the VOI, a three-dimensional localization method was used (Choi et al., 2000b). The choice of gradient strengths and RF bandwidths resulted in a nominal VOI of ∼500 μL, however, the sensitive volume of the surface coil (12 mm in diameter) actually results in a much smaller effective sensitive volume. The correlation between brain glucose and plasma glucose concentrations is clearly shown in the 13C NMR spectra in Fig. 2A. The spectra in Fig. 2A are from one animal, and quantification of brain glucose resulted in 0.1 (bottom), 3.4 (middle), and 7.9 (top) μmol/g with corresponding plasma glucose concentrations of 2.4, 11, and 26 mmol/L, respectively. During prolonged [1-13C] glucose infusion, the brain glycogen signal was clearly observable at 100.6 ppm (Fig. 2A middle trace).
13C and 1H MRS of 13C-labeled glucose in the brain and plasma.
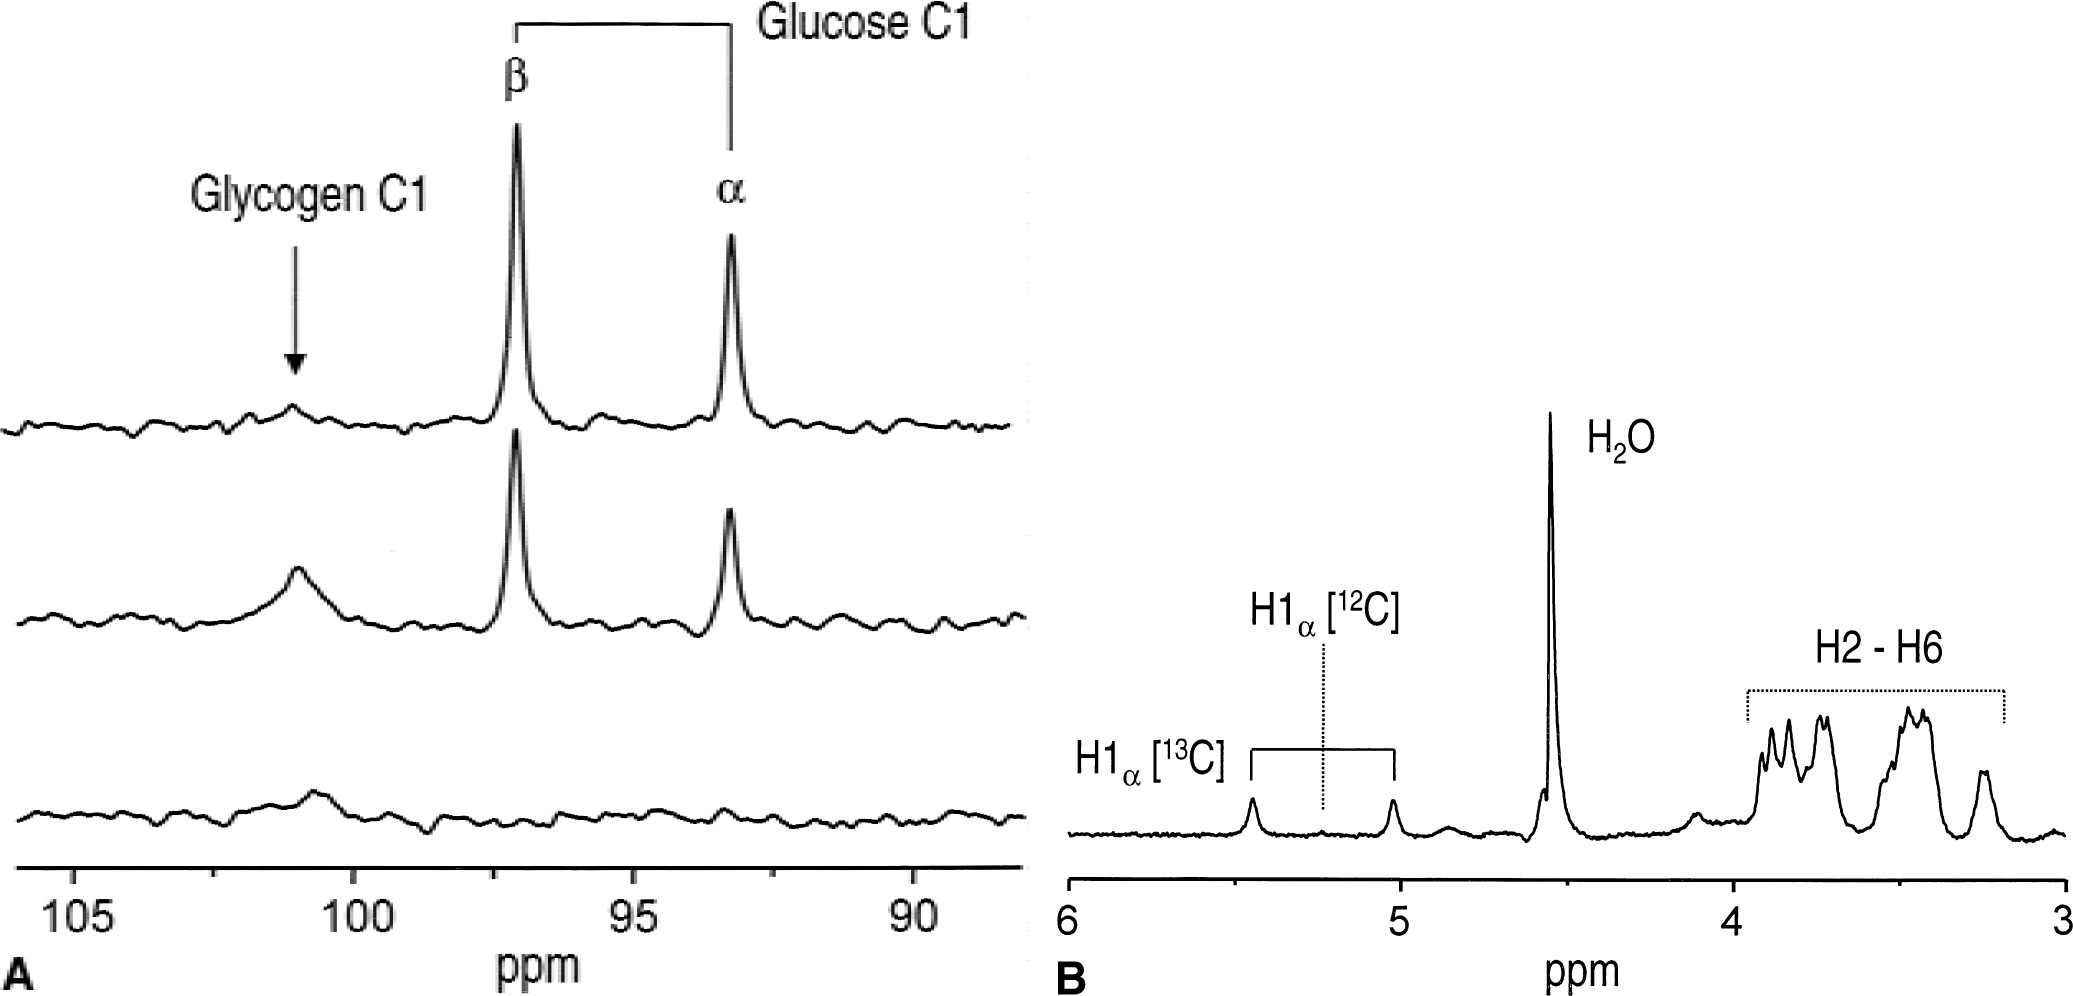
Physiologic parameters
Values are given as mean ± SD. Glc, glucose; CBF, cerebral blood flow.
Number of measurements is shown in parentheses.
1H NMR spectra of several plasma samples (50 μL each) were acquired to verify that the 13C fractional enrichment of plasma glucose was close to that of the infusate (99%). The 1H signals of 13C1 α-glucose were observable at 5.44 and 5.02 ppm, but the signal at 5.23 ppm attributed to 12C H1 α-glucose was close to the noise level (Fig. 2B). This indicates that the 13C fractional enrichment of C1 proton glucose was close to 99%.
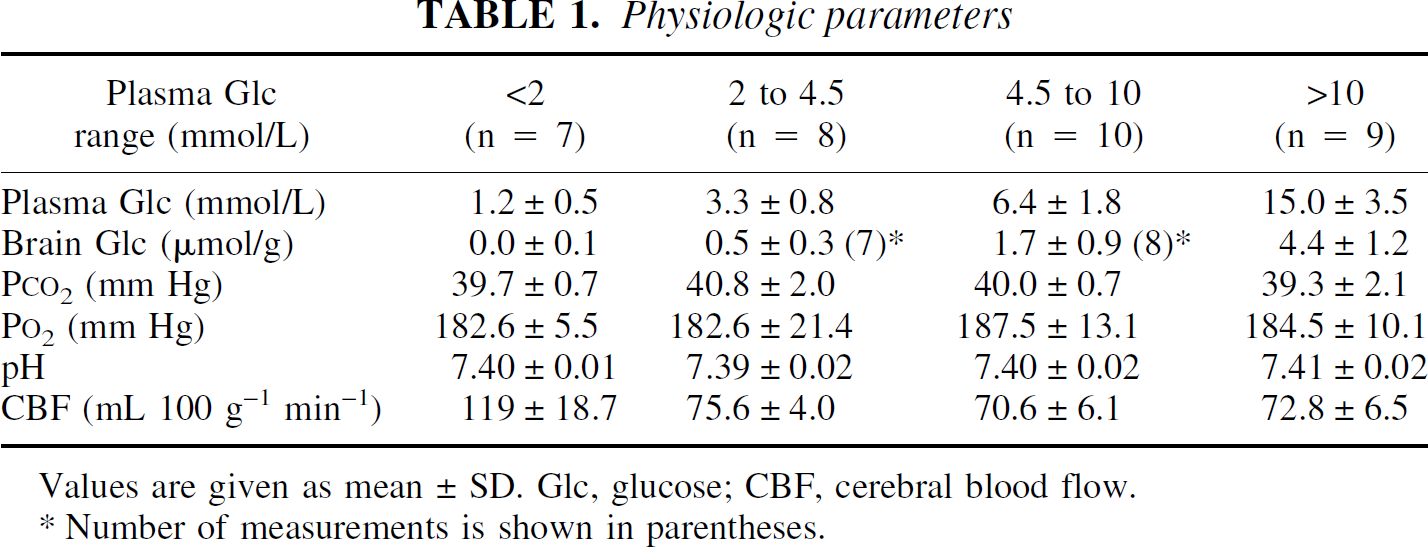
The brain glucose concentration was a linear function of the plasma glucose concentration in the range from 4.5 to 30 mmol/L (Fig. 3A). Second-order polynomial fitting (y = a + bx + cx2) to the data resulted in c = −0.003 ± 0.002, indicating that curvature was not significant in the data, further verified by visual inspection of the residuals (not shown). The linear relationship between plasma and brain glucose is a consequence of using the reversible Michaelis–Menten model of glucose transport to describe glucose content (Gruetter et al., 1998). The corresponding Eq. 3 was, therefore, used to fit the model to the data measured at plasma glucose concentrations greater than 4.5 mmol/L, which is indicated by the solid line in Fig. 3A. The best fit to the data resulted in an apparent Michaelis–Menten constant Kt of 3.3 ± 1.0 mmol/L, and the ratio of the maximal transport rate relative to CMRglc, Tmax/CMRglc, was 2.7 ± 0.13.
Linear relation between brain and plasma glucose concentration.
The solid straight line in Fig. 3B is identical to the fit of the reversible Michaelis–Menten model (also shown as a straight line in Fig. 3A) and was back-extrapolated to plasma glucose concentrations less than 4.5 mmol/L (hypoglycemia). This line was in excellent agreement with experimental measurements (Fig. 3B). 1H MRS measurements (Fig. 3B, open circles) show excellent agreement with 13C MRS measurements (Fig. 3B, solid squares), further supporting the reliability of the quantification by 13C MRS. At a plasma glucose concentration of 2.1 ± 0.6 mmol/L, brain glucose concentrations approached the Km of hexokinase, ∼0.05 μmol/g (McIlwain and Bachelard, 1985). When the plasma glucose level was less than 2 mmol/L, the brain glucose concentration was on average 0.0 ± 0.1 μmol/g (Table 1, n = 7), which is consistent with the inability to detect NMR signals at these plasma glucose concentrations, as shown in Fig. 2A.
In seven animals, the authors simultaneously measured CBF using perfusion MRI. CBF-weighted images of the rat brain during mild hyperglycemia (left) and hypoglycemia (right) are shown in Fig. 4A, and the corresponding concentrations of plasma glucose were 12 mmol/L (left) and 1 mmol/L (right), respectively. These images were proportional to CBF and showed a significant increase in image intensity during hypoglycemia. Corresponding CBF values were 75 (left) and 146 mL 100 g−1 min−1 (right) (Fig. 4A). Above 2 mmol/L plasma glucose, CBF was 73 ± 6 mL 100 g−1 min−1 (Fig. 4B, open triangles) and no trend with plasma glucose was observed (P > 0.77 using regression analysis), nor was there a substantial variation of Pco2 during these measurements (Table 1).
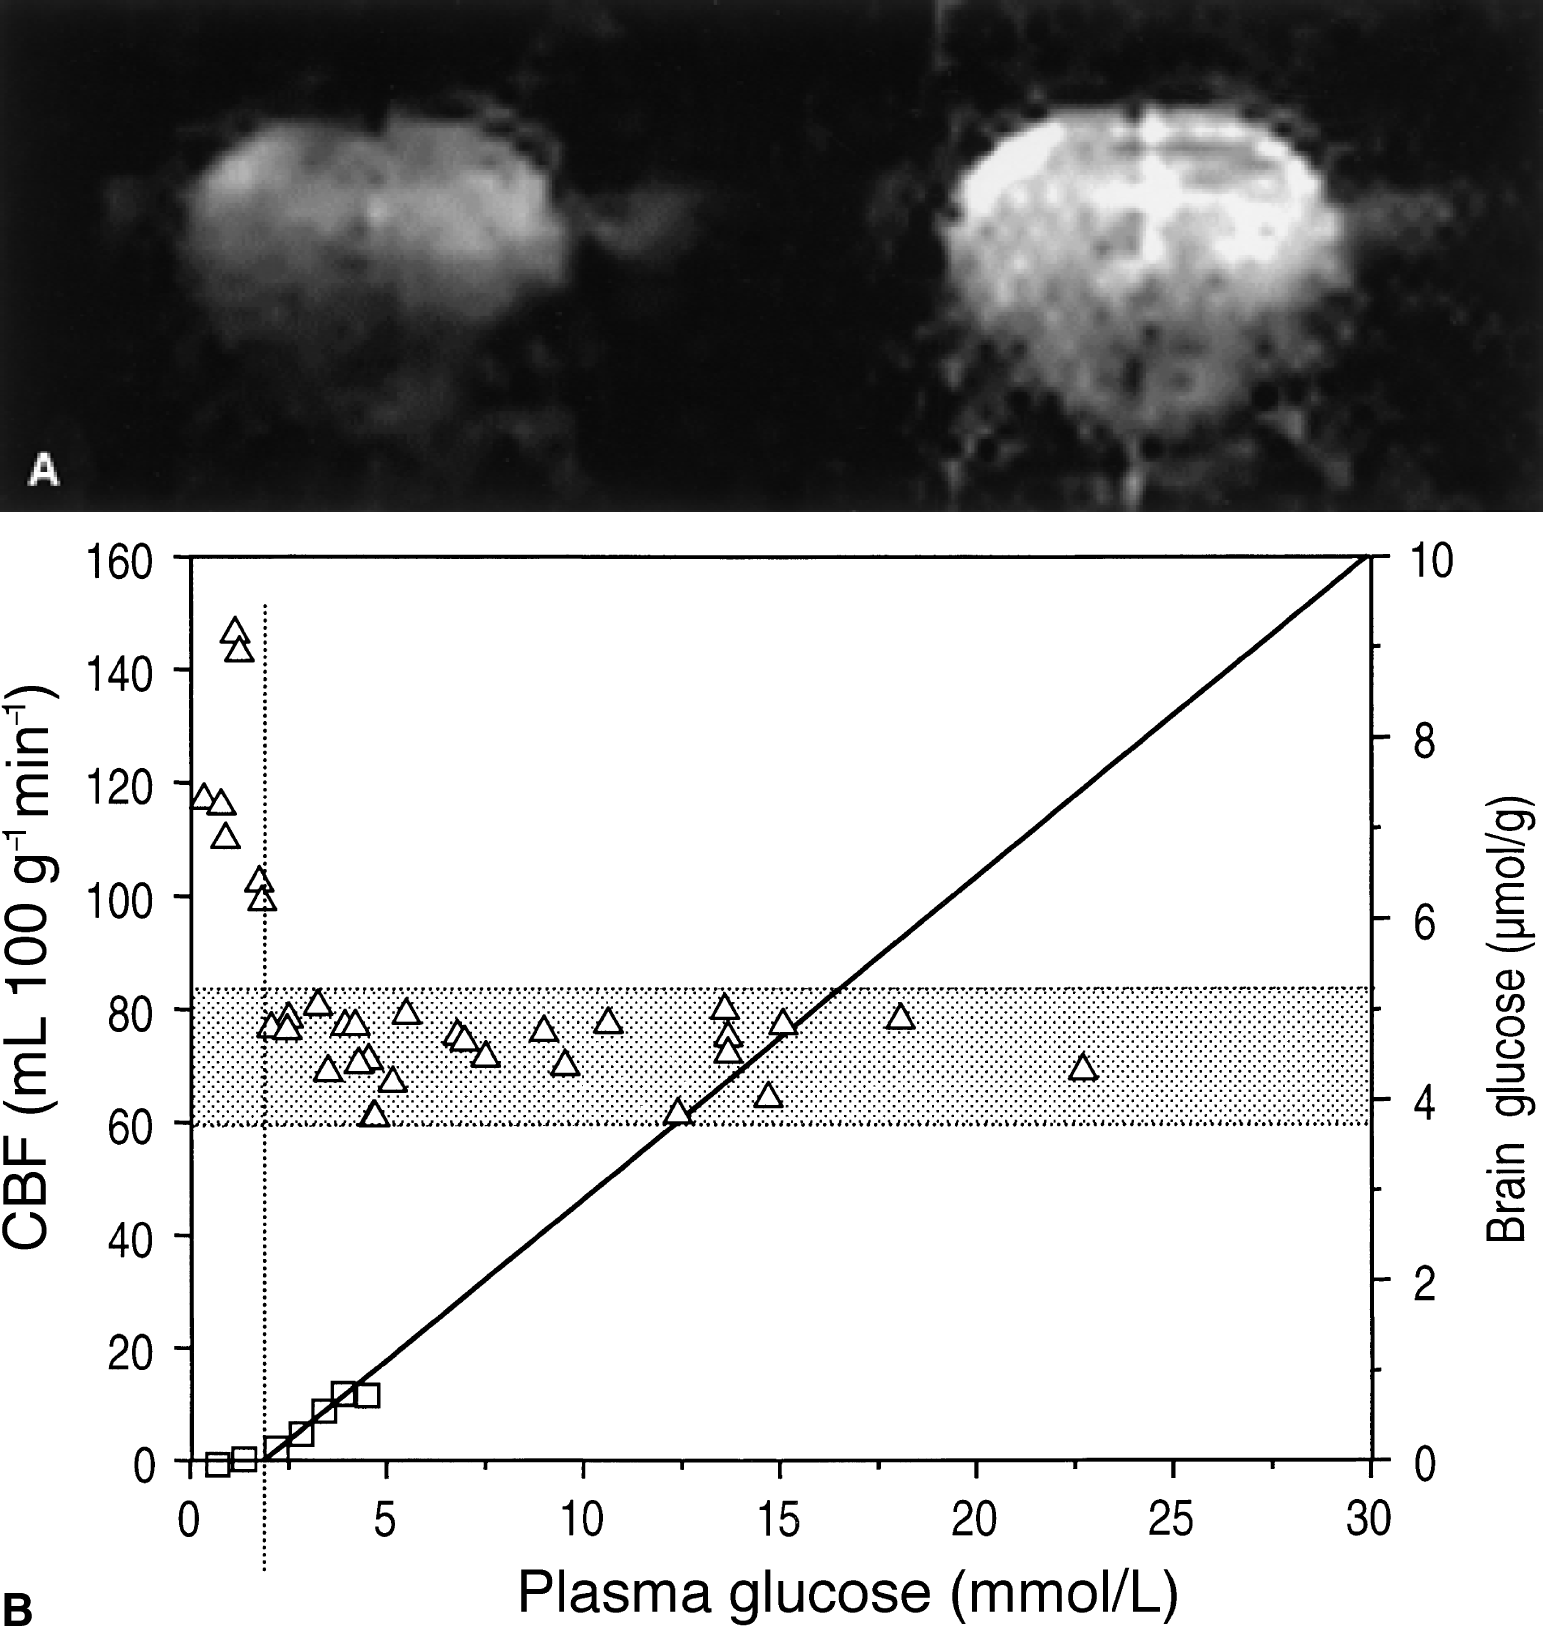
Cerebral blood flow (CBF)-weighted MRI during mild hyperglycemia and hypoglycemia.
When the plasma glucose level dreased to less than 2.1 mmol/L, a sharp increase in CBF above the 95% confidence interval of the normal CBF value was observed, which is indicated by the shaded area in Fig. 4B. Back-extrapolation of the reversible Michaelis–Menten model to zero brain glucose was in excellent agreement with the plasma glucose concentration, at which CBF sharply increased. The average increase in CBF was 57% ± 22% (P < 0.001) (Table 1).
DISCUSSION
This is the first study to directly quantify cerebral glucose concentrations in the α-chloralose anesthetized rat brain in vivo over a large range of plasma glucose concentrations (from hyperglycemia extending to severe hypoglycemia) with concomitant measurements of CBF.
This study confirms that the reversible model provides an apparent Michaelis–Menten constant of glucose transport (Kt = 3.3 ± 1.0 mmol/L) that is identical to previous studies (for example, Kt on the order of 1 to 3 mmol/L) within experimental errors (Gruetter et al., 1998). The result implies that the kinetics of glucose transport across the blood–brain barrier in rats is similar to that in humans (Gruetter et al., 1998).
Using the three-dimensional localization method for 13C MRS and the external reference method, a highly reliable quantification of brain glucose was achieved. The 13C MRS quantification was further underlined by the excellent agreement with the localized 1H MRS quantification (Fig. 3B). Therefore, quantification errors are most unlikely and if present, they are expected to be multiplicative and thus independent of the concentrations of plasma glucose. When using a surface coil as the only means to localize the signals, noncerebral glucose can interfere with the measurements even when performed using a small surface coil (Choi et al., 1999).
A comparison of the kinetic constants (Kt) for brain glucose transport in Table 2 indicates that the reversible model provides highly consistent Kt values spanning a 2.7 mmol/L range, and all reported values are identical within experimental error (top three rows in Table 2). Whereas, when using the standard model (bottom five rows in Table 2), Kt spans a range of 9 mmol/L, which exceeds the reported errors by more than threefold. It is interesting to note that all Kt obtained with the reversible model (indicated by the scheme in Fig. 1A) are less than than the lowest Kt obtained with the standard model (indicated by the scheme in Fig. 1B). The lower Kt resulting from the reversible model implies that a more efficient transport system is present at the blood–brain barrier than is implied by the standard model. For example, a high Kt requires a greater density of transporters for a given Tmax per transporter molecule to achieve the same glucose transport capacity. Moreover, the current data show that the kinetic parameters of the reversible model correctly predict the level of brain and plasma glucose at which glucose transport becomes rate limiting for metabolism (Fig. 4B).
Overview of cerebral glucose transport kinetic constants
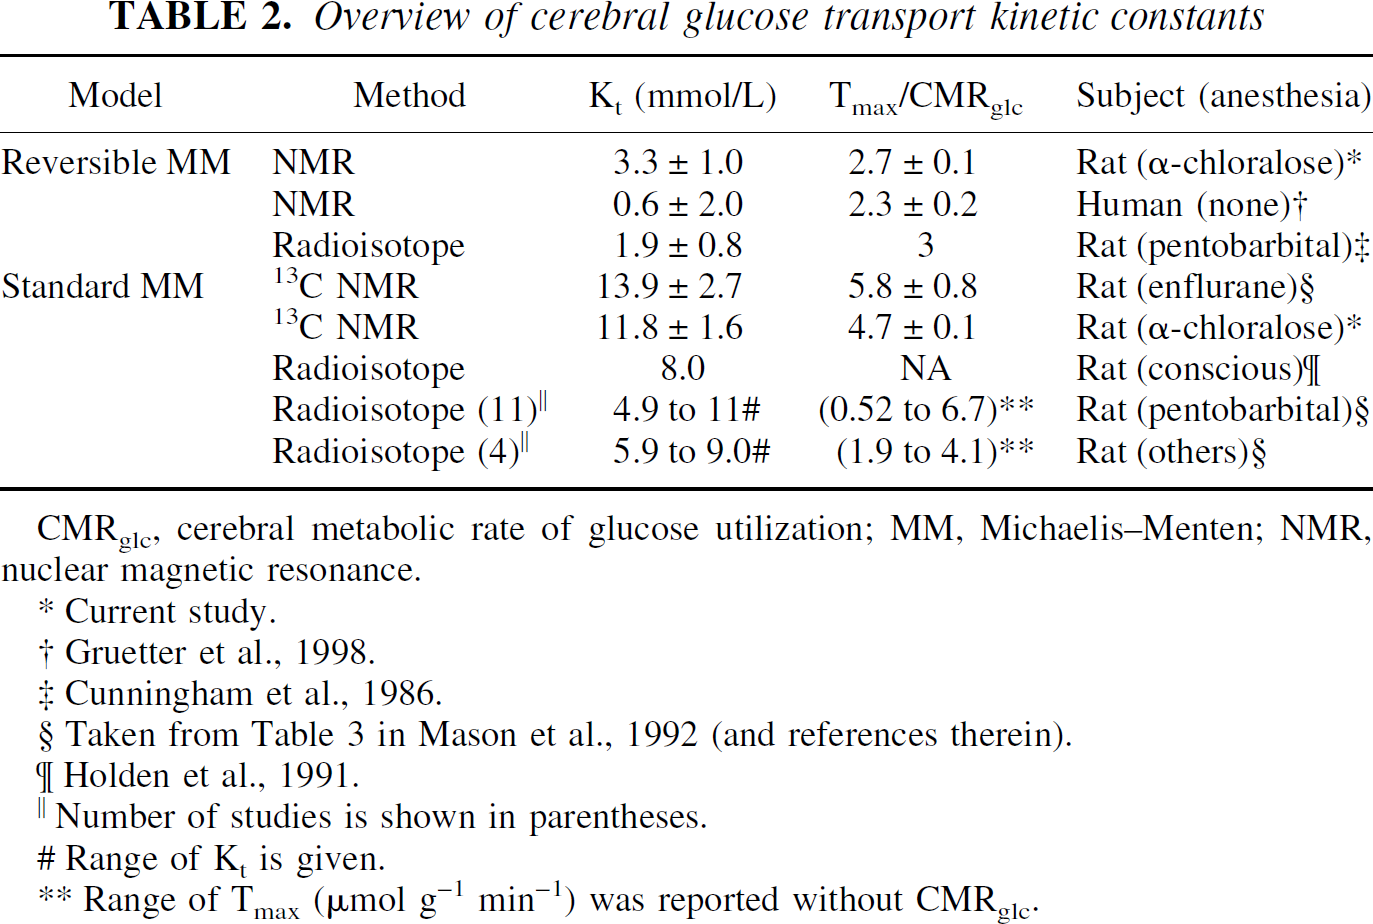
CMRglc, cerebral metabolic rate of glucose utilization; MM, Michaelis–Menten; NMR, nuclear magnetic resonance.
Current study.
Gruetter et al., 1998.
Cunningham et al., 1986.
Taken from Table 3 in Mason et al., 1992 (and references therein).
Holden et al., 1991.
Number of studies is shown in parentheses.
Range of Kt is given.
Range of Tmax (μmol g−1 min−1) was reported without CMRglc.
The authors recently have provided extensive arguments in support of the reversible model being a more consistent and adequate description of glucose transport across the blood–brain barrier (Gruetter et al., 1998). One of the features of the reversible model is the linear relation between brain and plasma glucose at steady state, whereas the standard Michealis–Menten kinetic formulation generally implies an asymptotic upper limit for the brain glucose concentration. A near linear relation is nevertheless possible within the standard model when assuming that Tmax >> CMRglc. In this case, brain glucose concentrations must approach those in plasma, a condition that is clearly not present in the brain. On the other hand, near linear behavior is observed when Kt/Gplasma is large. Therefore, the authors' observation of a linear relation between brain and plasma glucose up to 30 mmol/L plasma glucose implies a high Kt when measured in the context of standard Michaelis–Menten kinetics. Indeed, it was found that fitting the standard Michaelis–Menten model to the measured brain glucose concentrations, measured as a function of plasma glucose, yielded a Kt of 11.8 ± 1.6 mmol/L and Tmax/CMRglc of 4.7 ± 0.14. This Kt is approximately an order of magnitude greater than the Km reported for GLUT-1 and for erythrocyte systems in zero-trans and zero-cis experiments (Carruthers, 1990; Kasahara and Kasahara, 1996; Vannucci et al., 1997). (Note that the Kt in the reversible Michaelis–Menten kinetic model is equivalent to the Km measured using the standard model in the absence of product, that is, the zero-trans and zero-cis experiments.)
The kinetic constants afforded by the reversible Michaelis–Menten model imply that glucose transport across the blood–brain barrier can fully support sustained increases in glucose metabolism approximately two-thirds greater than the basal consumption rate at 5 mmol/L plasma glucose concentration (euglycemia), calculated from the maximally possible unidirectional transport rate, Tin*, into the brain:
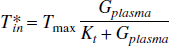
This value is generally greater than that predicted by the constants of the standard model. However, glucose metabolism alone cannot fully explain the increase of CMRglc during prolonged functional activation studies such as the 240% increase reported in the α-chloralose anesthetized rat (Hyder et al., 1996). To support such an increase in metabolism, substrates other than glucose must be used—for example, endogenous sources such as brain glycogen, which can be detected by NMR (Choi et al., 1999). Increased use of brain glycogen during sensory stimulation and hypoglycemia has been reported (Choi et al., 2000a; Swanson et al., 1992).
When glucose transport becomes rate limiting for metabolism, that is, when brain glucose concentrations approach zero, CBF increases significantly (Fig. 4B). Cerebral blood flow increases during hypoglycemia have been reported in several studies (Abdul-Rahman et al., 1980; Bryan et al., 1987; Della Porta et al., 1963; Norberg and Siesio, 1976), and the velocity of the blood in the sagittal sinus increased by 80% at a whole blood glucose concentration less than 20 mg/dL in the rat brain anesthetized with halothane (Ogawa et al., 1990). The authors' observation that the glucose concentration of ∼18 mg/dL in whole blood is the critical point where CBF increases is consistent with these studies. As shown in Fig. 4B, back-extrapolation of the model fit to zero (Gplasma ∼2 mmol/L) predicts the point at which CBF increased sharply above the 95% confidence interval.
Therefore, the current data provide direct in vivo evidence that the plasma glucose concentration of 2 mmol/L is the point in which brain glucose approaches zero, suggesting that the rate-limitation of metabolism by glucose transport appears to be the signal that triggers cerebral defense mechanisms, possibly directly controlled by brain glucose. The increase in CBF during hypoglycemia can be considered neuroprotective because it represents an attempt to increase capillary glucose concentration for improved glucose supply to the brain when circulating glucose levels are decreased below a critical level (Abdul-Rahman and Siesjo, 1980; Bryan et al., 1986, 1987). The current study suggests that this critical level is defined by the brain glucose concentration approaching zero.
Conclusions
The authors conclude that the reversible Michaelis–Menten model of glucose transport provides consistent kinetic parameters of glucose transport across different species and during hypoglycemia. The authors propose that brain glucose is the signal that triggers defense mechanisms (for example, CBF increases and glycogen utilization) aimed at improving glucose delivery to the brain during hypoglycemia.
Footnotes
Acknowledgments:
The authors thank Dr. Chaodong Wu for assistance in the preparation of plasma glucose samples and Profs. E.R. Seaquist and K. Ugurbil for their continued support and helpful discussions.