
Abstract
The Simplified Reference Tissue Model (SRTM) produces functional images of receptor binding parameters using an input function derived from a reference region and assuming a model with one tissue compartment. Three parameters are estimated: binding potential (BP), relative delivery (R1), and the reference region clearance constant k′2 Since k′2 should not vary across brain pixels, the authors developed a two-step method (SRTM2) using a global value of k′2. Whole-brain simulations were performed using human input functions and rate constants for [18F]FCWAY, [11C]flumazenil, and [11C]raclopride, and parameter SD and bias were determined for SRTM and SRTM2. The global mean of k′2 was slightly biased (2% to 6%), but the median was unbiased (<1%) and was used as the global value. Binding potential noise reductions with SRTM2 were 4% to 14%, 20% to 53%, and 10% to 30% for [18F]FCWAY, [11C]flumazenil, and [11C]raclopride, respectively, with larger reductions for shorter scans. R1 noise reduction was larger than that of BP. Simulations were also performed to assess bias when the reference and/or tissue regions followed a two-tissue compartment model. Owing to the constrained k′2, SRTM2 showed somewhat larger biases due to violations of the one-compartment model assumption. These studies demonstrate that SRTM2 should be a useful method to improve the quality of neuroreceptor functional images.
Tracer kinetic modeling techniques have been used extensively for quantification of neuroreceptors with positron emission tomography (PET) and single-photon emission computerized tomography (SPECT). Given the logistical difficulties of obtaining an arterial input function corrected for radiolabeled metabolites, several methods have been developed to instead use the concentration information from a reference region in which there are few or no specific binding sites. In general, such methods assume that the distribution volume of free and nonspecifically bound tracer in the reference region is the same as that in the tissue region-of-interest (ROI). One approach that uses the full time–activity curve (TAC) has been developed by Lammertsma et al. (Hume et al., 1992; Lammertsma et al., 1996). This original approach used a model having two tissue compartments (2T) for the ROI and one tissue compartment (1T) for the reference region. Later, Lammertsma and Hume (1996) reduced the original reference tissue model to one where both the ROI and the reference region followed a 1T model. This simplified reference tissue model (SRTM) eliminated one parameter from the fit, and reduced the variability in the parameter estimates. Subsequently, an algorithm for rapid estimation of functional images with the SRTM model was developed using basis functions (Gunn et al., 1997) following similar approaches developed previously for rapid cerebral blood flow calculations (Holden et al., 1981; Koeppe et al., 1985).
The SRTM operational equation estimates three parameters for each pixel or ROI: binding potential (BP), the relative delivery in the ROI compared to the reference region (R1), and the clearance rate constant from the reference region (k′2). BP is the ratio at equilibrium between the specifically bound tracer and the free plus nonspecifically bound tracer, and is equal to Bmax/KD under tracer conditions (Mintun et al., 1984). Although there is only one reference region and therefore only one true value for k′2, a different value of k′2 is estimated for every pixel by SRTM. We therefore developed a two-step method (SRTM2) using a fixed value of k′2 for all pixels within the brain; k′2 is estimated from a first-pass application of SRTM. Because of fewer estimated parameters, SRTM2 would be expected to have reduced noise in the parameter estimates and functional images.
To evaluate the method, replicate whole-brain simulations were performed for three receptor binding ligands: [18F]FCWAY (5-HT1A), [11C]raclopride (D2), and [11C]flumazenil (benzodiazepine). Using arterial input functions, TACs for several brains ROIs were generated, noisy pixel TACs were simulated, and SRTM and SRTM2 were then applied with varying total scanning durations for each tracer. Bias and standard deviation (SD) for BP and R1 were determined. A rapid calculation method for SRTM2 was also developed and used to calculate functional images from a [11C]raclopride study.
Because of its ease of use, the SRTM method has been applied to data even from tracers where the 1T assumptions do not apply for both ROI and reference region (Gunn et al., 1998; Slifstein et al., 2000). In these cases, SRTM BP estimates have been found to be biased compared with results from the full compartment models. For the tracers in the noise simulation, a bias simulation was therefore performed to assess the error in BP and R1 for SRTM and SRTM2 in cases where the ROI and/or the reference region were more accurately described by a 2T model.
MATERIALS AND METHODS
SRTM2 algorithm
The SRTM and SRTM2 models are based on the assumptions of one tissue compartment to describe the influx and efflux in the tissue ROI (K1 and k2) and the reference region (K′1 and k′2). In accordance with the methods of Lammertsma and Hume (1996), the SRTM operational equation is as follows:

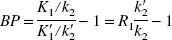
Even though there are three parameters that are estimated by SRTM with Eq. 1, there is only one reference region in the brain, so ideally there should only be a single value for k′2. To fit the data with one whole-brain value, the following two-step algorithm named SRTM2 was developed:
Use SRTM to calculate R1, k2, and k′2 for all brain voxels. Calculate a global k′2 from all pixels outside the reference region.
Fix k′2 to the global value and calculate functional images of BP and R1 using a two-parameter fit to Eq. 1.
SRTM2 was evaluated with two simulation studies and one test with human data. The first simulation assessed the magnitude of noise reduction by SRTM2 over SRTM. The second simulation assessed the sensitivity of SRTM and SRTM2 to violations in the assumption of a 1T model for the reference region and/or the ROI.
Simulation I: noise reduction
The metabolite-corrected input function for [18F]FCWAY was obtained from studies in normal controls after a 10-mCi bolus injection. The human input function for [11C]flumazenil was derived from a 25-mCi bolus injection (Koeppe et al., 1991), which was then scaled to a 15-mCi injection for compatibility with the three-dimensional simulations performed here. The [11C]raclopride input function was determined from human data derived from bolus/infusion (B/I) administration (Breier et al., 1997). For consistency, a comparable bolus input function was calculated from the B/I data, as described elsewhere (Watabe et al., 2000).
For [18F]FCWAY and [11C]raclopride, two metabolite-corrected arterial input functions were used to perform the tissue simulations in order to assess the sensitivity of the method to input function shape. To select these input functions, arterial curves from six control subjects were chosen, whole-brain TACs were computed for each subject (see below), and the TACs were normalized to have a constant area under the curve. The two plasma input curves which produced the highest and lowest tail portion of the simulated whole-brain curves were used for the simulations.
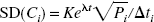
For evaluation of noise, it is customary to simulate independent noisy replicates of the tissue TACs. In this case, since SRTM2 estimates k′2 using all brain pixels, it was necessary to perform whole-brain simulations. Furthermore, in order to assess the effects of bias and variability in the estimation of k′2, replicate whole-brain simulations were required. For each tracer, a set of regions was defined. The number of PET pixels (2 × 2 × 4.25 mm = 17 mm3) in each region was determined from regional volumes based on segmented MR images (Kabani et al., 1998)*. The kinetic parameters and number of pixels for each region are listed in Table 1. The reference regions were cerebellum for [18F]FCWAY and [11C]raclopride, and pons for [11C]flumazenil.
Simulation parameters
Parameters used in simulation of 3 tracers: [18F]FCWAY, [11C]flumazenil and [11C]raclopride. For each tracer, whole-brain simulations were performed with multiple regions of interest (ROIs). The table lists the number of simulated pixels for each ROI determined by the volume (mL) divided by voxel volume (0.017 mL) reduced by a factor of 8 to account for the correlations between voxel values (see text for more details). Parameters from the 1T model (K1 and V) are listed, from which the Simplified Reference Tissue Model parameters (BP, R1, and k′2) can be calculated.
SRTM and SRTM2 are based on the assumption that tracer kinetics in the reference and tissue region are described with the 1T model. For the purpose of the noise simulation, therefore, TACs were simulated consistent with this assumption. Since the published rate constants for the three simulation tracers often include two tissue compartments, these values were modified as follows: K1 was taken from the original parameter values and k2 was calculated as k2/(1 + k3/k4), so that the distribution volume (V = K1/k2) in the 1T model was the same as that of the 2T model.
For each tracer and input function, fifty noisy replicates of TACs for all brain pixels were generated for each of three scan durations. Scan durations were 120, 90, and 60 minutes for [18F]FCWAY, and 60, 45, and 30 minutes for [11C]flumazenil and [11C]raclopride. The frame durations for [18F]FCWAY were 12 × 0.25, 6 × 0.5, 4 × 1, and 44 × 2.5 minutes. For [11C]raclopride and [11C]flumazenil, scan durations were 6 × 0.5, 4 × 0.75, 4 × 1, 12 × 2.5, and 12 × 1.67 minutes. These sampling rates were chosen by halving the frame times of the original human acquisition protocols to minimize any bias introduced by the use of integrated Cr(t) values on the right-hand side of Eq. 1.
To use Eq. 4, Eq. 3 is solved for Pi and substituted into Eq. 4. Then, under the assumption that noise for filtered back-projection images is relatively uniform across the field of view (Pajevic et al., 1998), the pixel value Ci is replaced with the whole-brain average concentration C̅i yielding the following noise model:
Pixel values in reconstructed PET images are not statistically independent. Therefore, in simulating data for the entire brain, it would be inappropriate to simulate TACs with independent noise for each brain pixel. A large number of positively correlated pixel TACs is roughly equivalent to a smaller number of independent pixel TACs; that is, the whole-brain simulation can be performed by reducing the number of pixels by an appropriate factor. To estimate this pixel-reduction factor, it is useful to compare pixel and ROI noise values. If pixels were independent, then the SD of ROI data would be lower than that of pixel data by a factor of  , where n is the pixel count in the region. For correlated pixels, that factor would be smaller. In three-dimensional PET images on the GE Advance, Watabe et al. (2000) found that factor to be
  , that is, a ROI with n pixels has equivalent noise to n/8 independent pixels. Note that the value of 8 is specific to the pixel size and reconstruction method. Thus, we approximated the correlated PET pixel TACs by simulating independent TACs for one eighth the original number of pixels.
 is approximately:
SRTM2 functional images
Rapid calculation of functional images for SRTM2 was performed based on methods first used for cerebral blood flow (Holden et al., 1981; Koeppe et al., 1985) and subsequently employed for reference region analysis with SRTM (Gunn et al., 1997). The operational equation (Eq. 1) has only one nonlinear parameter; we therefore defined an a priori set of sampled k2 values. For each value of k2, the weighted least-squares estimates for the remaining parameters (R1 for SRTM2, R1 and k′2 for SRTM) can be calculated since they appear in a linear fashion in the operational equation. Then a simple search for the value of k2 that produced the minimum of the weighted least-squares optimization function was performed for each pixel.
For SRTM2, the three-parameter SRTM was performed to estimate k′2 in all brain pixels. Next, a global k′2 value from regions outside the reference region was determined. Finally, SRTM2 was applied to estimate BP and R1 for all brain pixels. (See Appendix for details of the SRTM2 implementation.)
As an example, functional images were calculated from dynamic human PET images of [11C]raclopride (Breier et al., 1997) from three-dimensional acquisition on the GE Advance. The radioactivity was administered as a bolus/constant infusion with a total dose of 8 mCi over 100 minutes. Image data from 0 to 30 and 0 to 50 minutes, during the control period of the study, were used in the calculation. Regions of interest were manually drawn on several slices of the cerebellum and the reference region TAC was generated. SRTM was applied to all brain voxels, defined by applying an automatic edge-tracing procedure to smoothed summation images from 0 to 5 minutes postinjection. The data were weighted based on the noise model of Eq. 5. The search range of k2 was 0.02 to 0.50 min−1 with 500 values spaced logarithmically. To calculate the global k′2 value, pixels in the cerebellum (or with very low BP) should be excluded. Therefore, the SRTM BP image was first smoothed with a three-dimensional Gaussian filter (5-mm full-width halfmaximum), and the global k′2 value was taken as the median value from pixels with BP greater than 1.0 (2,006 and 1,742 pixels for 50- and 30-minute durations, respectively). Then, the second step of SRTM2 was performed to calculate functional images of BP and R1 with fixed k′2.
Simulation II: 2T bias analysis
The previous analyses were performed with the reference and tissue TACs simulated with a 1T model; that is, the simulation was consistent with the model fitting. In many cases, however, one or both regions might have kinetics more consistent with a 2T model. The three parameters used by SRTM could allow it to do a “better” job fitting such inconsistent data, and possibly produce small biases. By fixing one parameter in SRTM2, however, there is no flexibility in this method to adapt to data that is inconsistent with the 1T model. Therefore, it was important to assess whether model parameters, particularly BP, are more biased with SRTM2 than SRTM.
Noise-free simulation data were generated with the reference region and tissue ROI following 1T or 2T models. These combinations are labeled R2T1, R1T2, and R2T2 (i.e., RmTn), where the reference region was simulated with m tissue compartments and the tissue ROI had n compartments. Time–activity curves were simulated for each region of [18F]FCWAY, [11C]flumazenil, and [11C]raclopride and analyzed with SRTM and SRTM2. The 2T parameters for the simulations were taken from the literature as follows: [18F]FCWAY (Carson et al., 2000a), [11C]flumazenil (Koeppe et al., 1991), and [11C]raclopride (Ito et al., 1998). The k′2 value for SRTM2 was chosen as the median SRTM k′2 determined by replicating each ROI's value by the number of pixels in that region (Table 1). The percent bias of SRTM and SRTM2 estimates of BP, R1, and k′2 were calculated with respect to the true parameter values. In the cases with two input functions, the differences in bias were small, so these values were averaged.
RESULTS
Simulation I: noise reduction
Step 1 of SRTM2 produces a global estimate of k′2 by applying SRTM. Figure 1 shows the average histogram of estimated k′2 values from 120-minute whole-brain simulations for [18F]FCWAY from one input function. The histogram is asymmetrical around its true value (0.324 min−1) leading to a bias in the sample mean k′2 value. Because of this bias, the use of the median was evaluated in addition to the mean. The biases of mean and median k′2 estimation for each tracer and two scan durations are shown in Table 2. For all three tracers, the mean is somewhat positively biased (2% to 6%), with larger biases for the shorter analysis periods, where estimation noise is greater. Bias of the median is always much smaller than of the mean (<1%), so in the remaining calculations, the median SRTM k′2 value was used for SRTM2. The SD values across replicates for the median and mean k′2 values were quite small. Larger SD values were found for [11C]raclopride where a small number of pixels (basal ganglia only) were used in the first-pass SRTM fitting.
Percent bias and percent standard deviation of whole-brain mean and median k′2 values
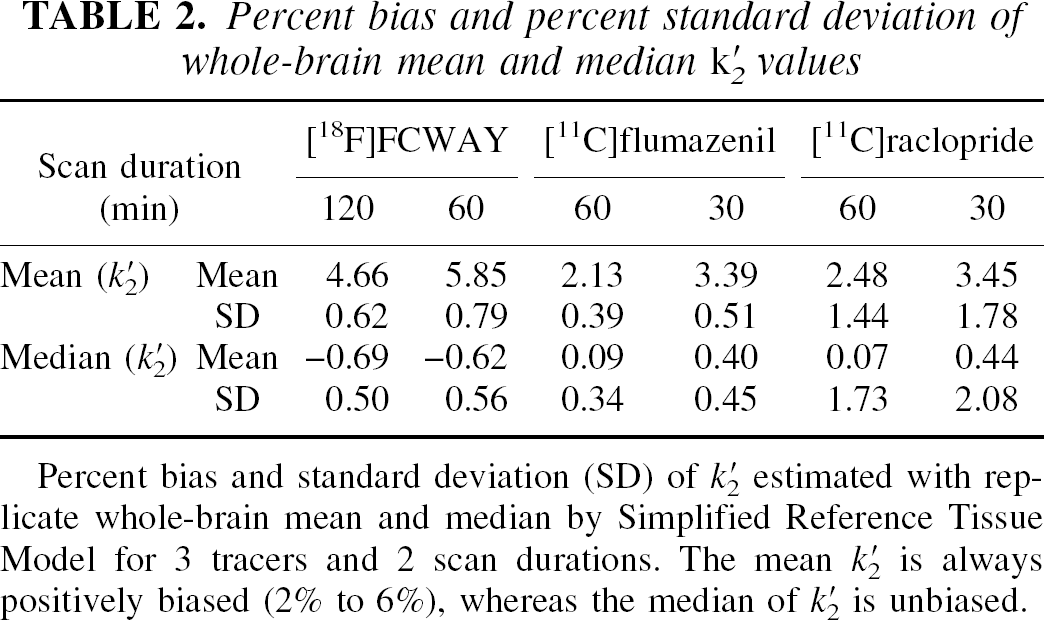
Percent bias and standard deviation (SD) of k′2 estimated with replicate whole-brain mean and median by Simplified Reference Tissue Model for 3 tracers and 2 scan durations. The mean k′2 is always positively biased (2% to 6%), whereas the median of k′2 is unbiased.
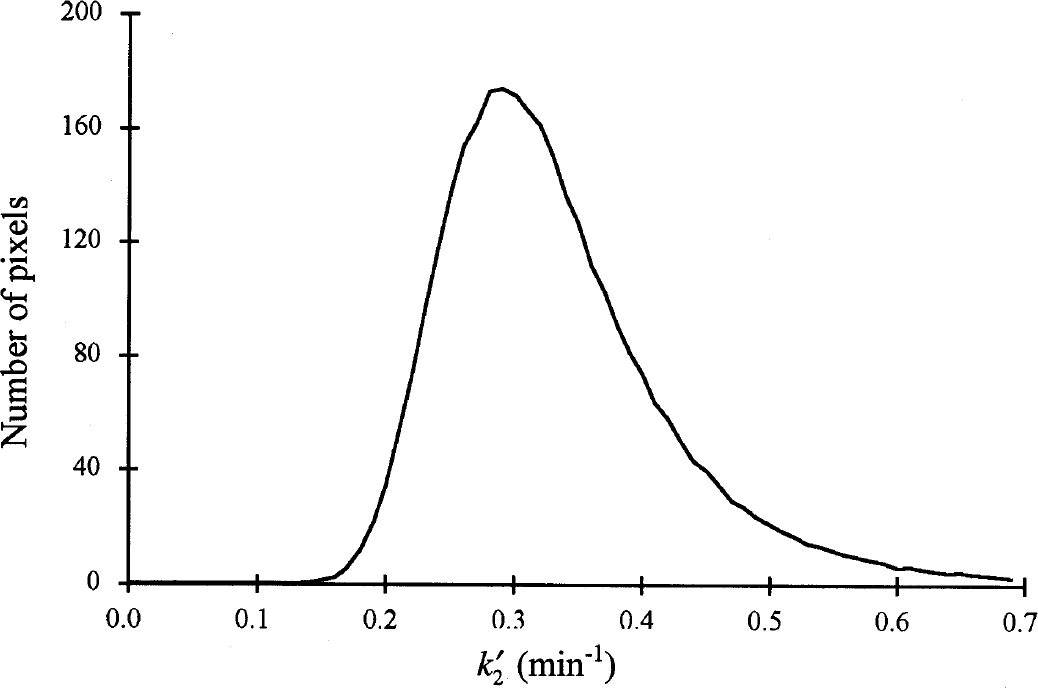
Average histogram of estimated values from fifty 120-minute whole-brain noisy simulations for [18F]FCWAY determined by the Simplified Reference Tissue Model (Eq. 1). There is an asymmetrical distribution around the true value (0.324 min−1), such that the sample mean has a small positive bias whereas the median has no bias.
In performing the ∼1.7 million fits to the simulated data, there were only 200 excluded outliers for SRTM2, all for [18F]FCWAY, medial temporal, 60-minute analysis. For SRTM, 2,300 outliers were detected, with the worst case being ∼4% of fits for [11C]flumazenil, putamen, 30-minute fits. Outliers are thus dramatically reduced using SRTM2.
In general, the sample bias of the parameter estimates was small. For [18F]FCWAY BP, bias was usually less than 1% (2% for SRTM 60-minute scan duration in medial temporal). All R1 biases were less than 0.8%. For [11C]flumazenil with 60-minute scan duration, all SRTM biases were less than 1% except for caudate nucleus, where BP and R1 bias were 1.8 and −1.1%, respectively. For the 30-minute scan duration, the SRTM BP bias becomes much larger, 2.5% to 4.2% across regions. For SRTM2, no bias for BP or R1 was greater than 0.3%. For [11C]raclopride, biases of BP and R1 are less than 0.7% for SRTM and 0.3% for SRTM2.
The percent SD of SRTM and SRTM2 estimates of BP and R1 are shown in Fig. 2 ([18F]FCWAY), Fig. 3 ([11C]flumazenil), and Fig. 4 ([11C]raclopride). Values are given for each region in order of decreasing BP for two different scan durations. In Fig. 2A, SRTM2 shows slightly lower SD for BP than SRTM. This noise reduction is larger when the scan duration is decreased to 60 minutes. In Fig. 2B, the R1 SD with SRTM2 is much smaller than that of SRTM, dropping from a mean of 19% to 5% for 120-minute estimation. The time duration of fitting had little effect on R1 SD. Unlike SRTM, SRTM2 shows a slight dependence of R1 SD with BP.
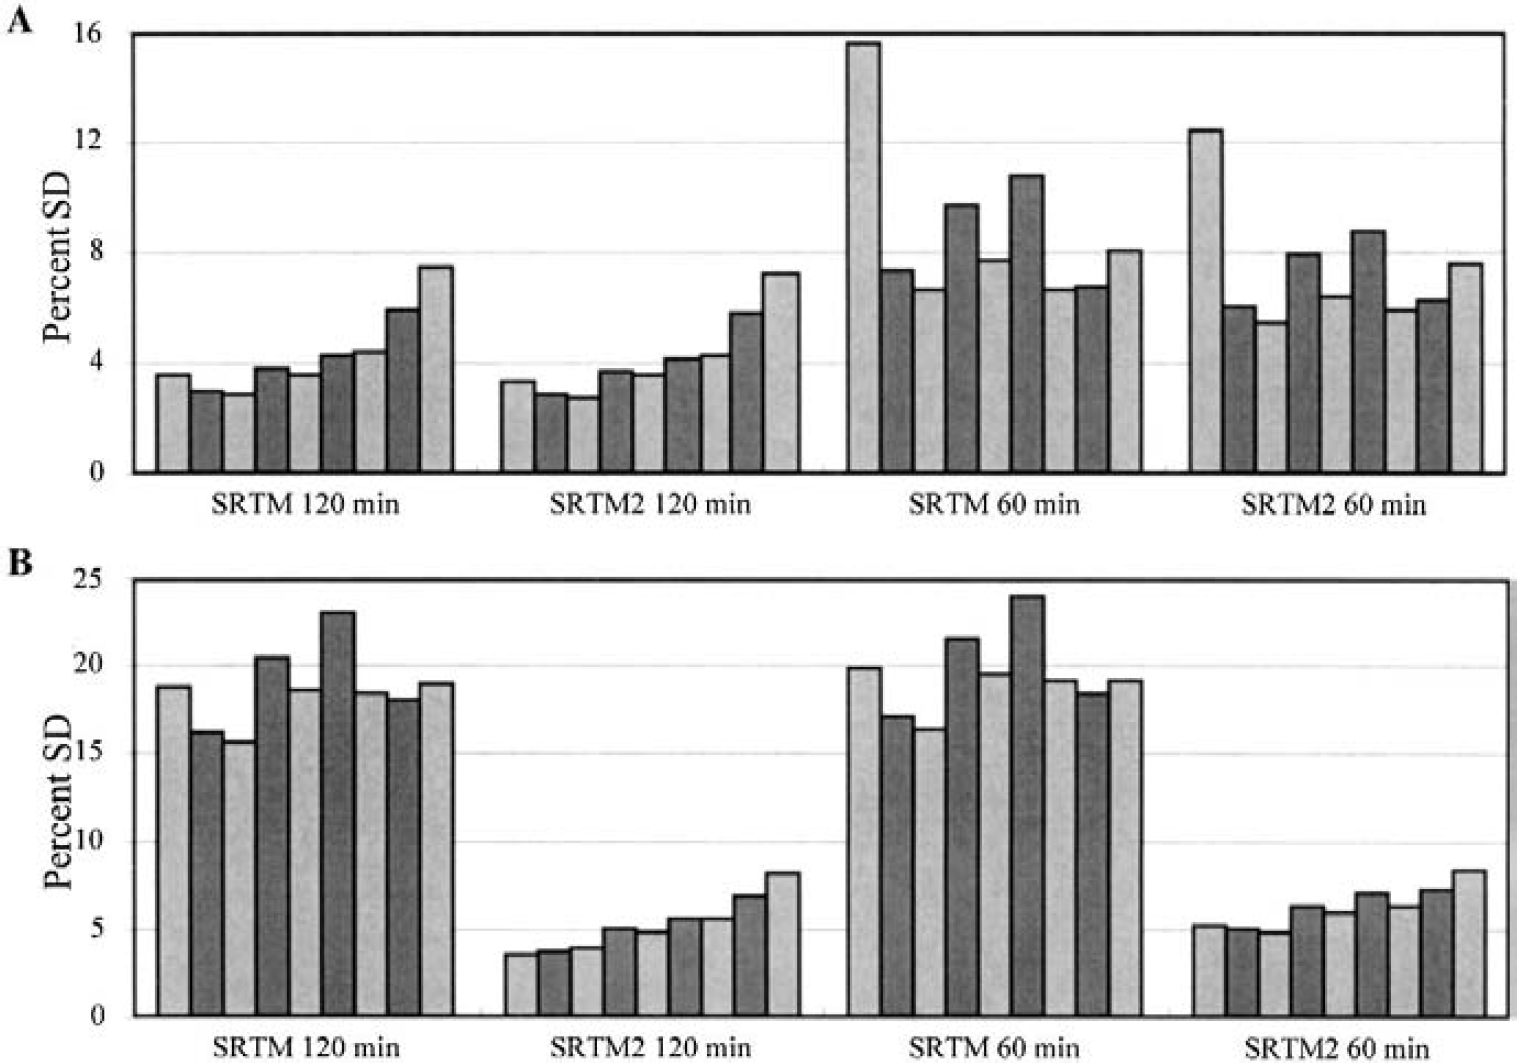
Simulation results for [18F]FCWAY.
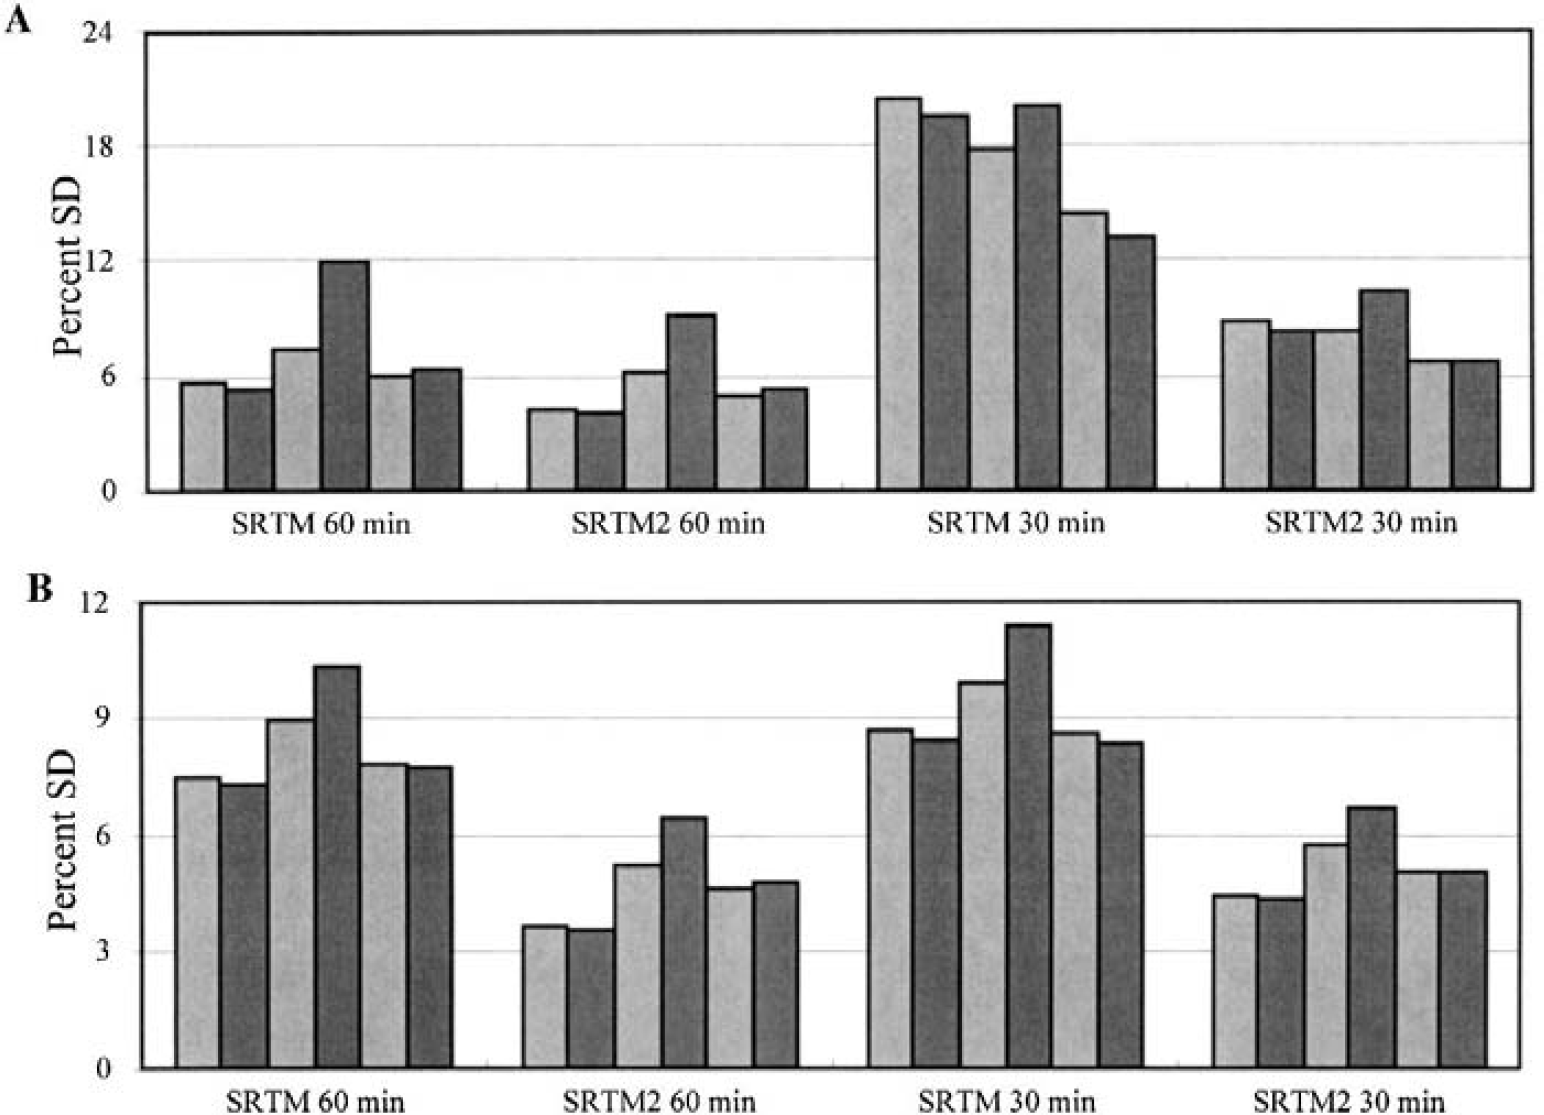
Simulation results for [11C]flumazenil.
Trends for [11C]flumazenil SD in Fig. 3 are somewhat different than those of [18F]FCWAY (Fig. 2); the SD reduction by SRTM2 is much larger for the 30-minute estimation, while the reduction in R1 SD is smaller. The mean BP SD values were 7.1% and 5.7% for 60-minute SRTM and SRTM2, respectively, and 17.6% and 8.2% for 30-minute estimation. In Fig. 3B, the mean R1 SD was reduced by ∼43% with SRTM2 for 30- and 60-minute estimation periods. Figure 4 shows the analysis for [11C]raclopride, where the results were more similar to those of [18F]FCWAY (Fig. 2).
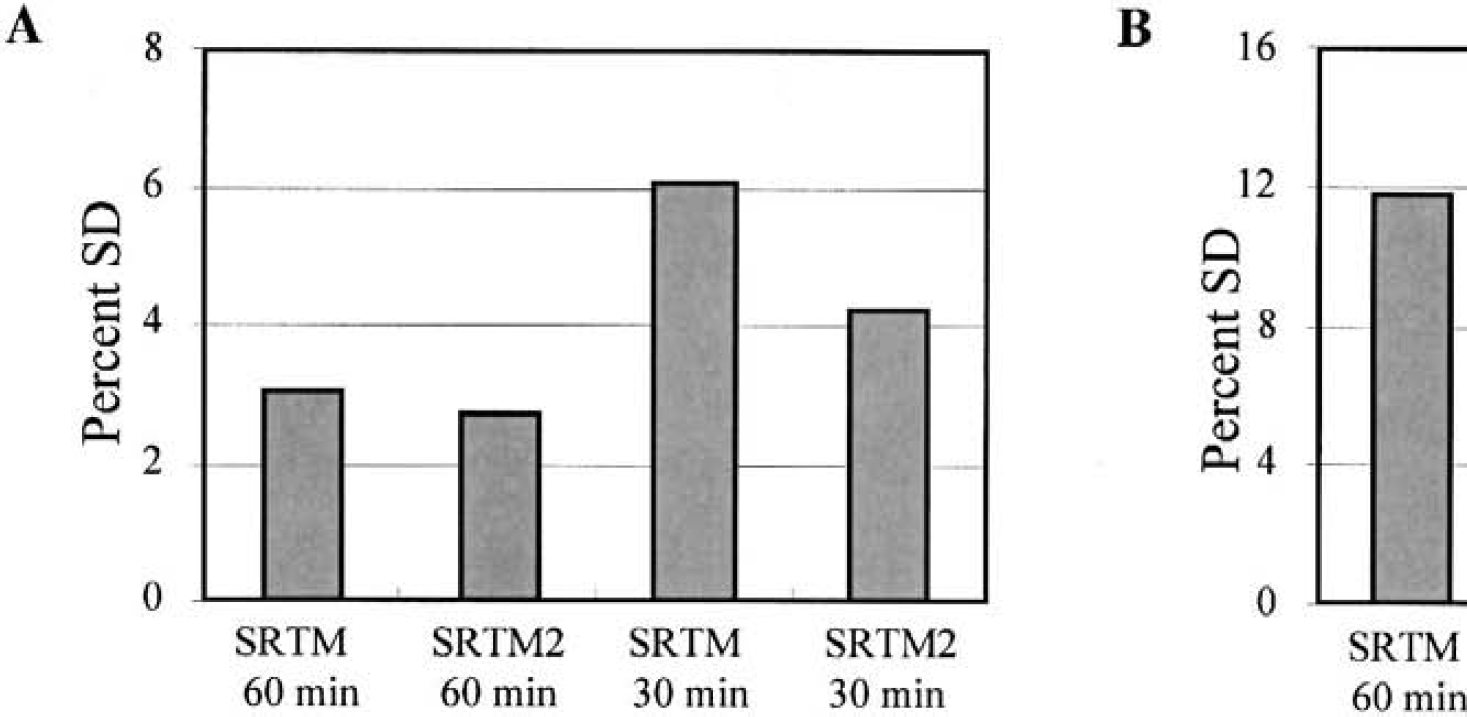
Simulation results for [11C]raclopride.
Since the noise differences between SRTM and SRTM2 were time dependent, we calculated the theoretical noise estimate (Eq. 6) for BP and R1 as a function of total scan duration and compared these estimates to the simulated values. The comparison for [18F]FCWAY is shown in Figs. 5A (BP) and 5B (R1) for medial temporal cortex and the comparison for [11C]flumazenil is shown in Figs. 5C (BP) and 5D (R1) for frontal cortex. In Fig. 5A, predicted BP noise increases nonlinearly with decreasing scan duration. SRTM2 shows lower noise than SRTM, with the reduction in noise by SRTM2 being larger for shorter durations. The simulated noise values were slightly higher than the theoretical values, particularly for the shorter scan durations, where the absolute noise levels are higher and the deviations from the asymptotic assumptions underlying Eq. 6 are more substantial. In Fig. 5B, the R1 noise results show a dramatic noise reduction by SRTM2 compared to SRTM. In this case, fixing the value of k′2 has its largest effect on R1, rather than BP. The theoretical and simulated results match very well, perhaps because R1 appears as a linear term in the model equation (Eq. 1). There is little scan duration effect with R1 since most of the R1 information is in the early scan frames.
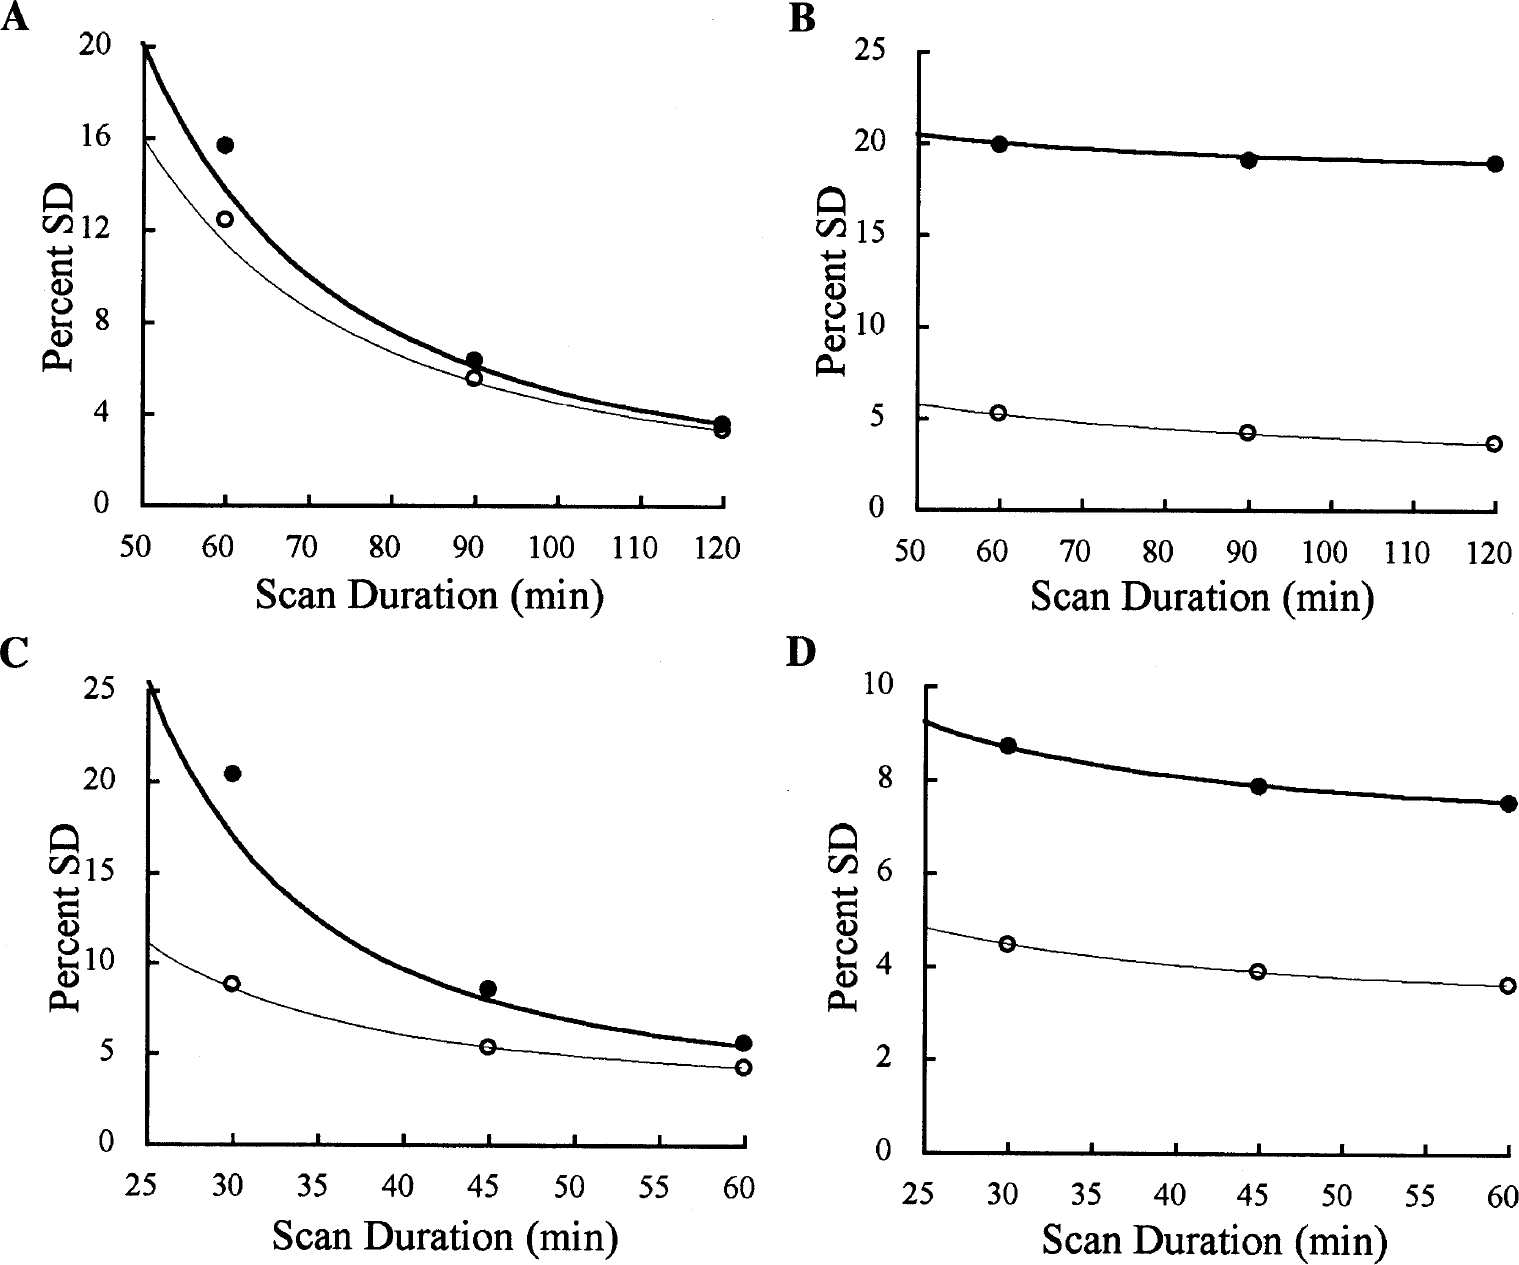
Percent SD values for SRTM and SRTM2 from whole-brain simulations (symbols) and the theoretical noise estimate of Eq. 6 (lines) as a function of scan duration. Bold lines and filled symbols are SRTM values, and fine lines and open symbols are derived from SRTM2.
In Figs. 5C and 5D, the trends for [11C]flumazenil SD were generally similar to [18F]FCWAY, although SRTM2 showed a greater improvement in BP estimation and a smaller improvement in R1 percent SD. The discrepancy between theoretical and simulated values is larger at the shorter, high-noise scan durations. The [11C]raclopride results were similar to those in Fig. 5 (data not shown). Figure 6A shows the simulated and theoretical BP noise reduction from SRTM to SRTM2 for [18F]FCWAY for different scan durations as a function of BP. There are discontinuities in the theoretical predictions, when plotted against BP, because K1 values were varied based on the regional parameters (Table 1); if K1 was fixed, and thus k2 varied continuously with BP, the theoretical curves would be smooth. With increasing BP, the percent noise reduction increases for each scan duration. The reduction in noise is always higher for the shorter scan durations, with mean sample SD reductions of 14%, 7%, and 4% for durations of 60, 90, and 120 minutes, respectively. Figure 6B shows the [11C]flumazenil noise reduction, which is substantially larger than that of [18F]FCWAY. The pattern of sensitivity to BP is less evident. The mean reductions in sample SD were 53%, 31%, and 20% for 30, 45, and 60 minutes, respectively. Because of the high noise level for the 30-minute scan duration, the simulated noise reductions were much larger than the theoretical values. The percent noise reductions for [11C]raclopride BP for scan durations of 30, 45, and 60 minutes were 30%, 15%, and 10%, respectively.
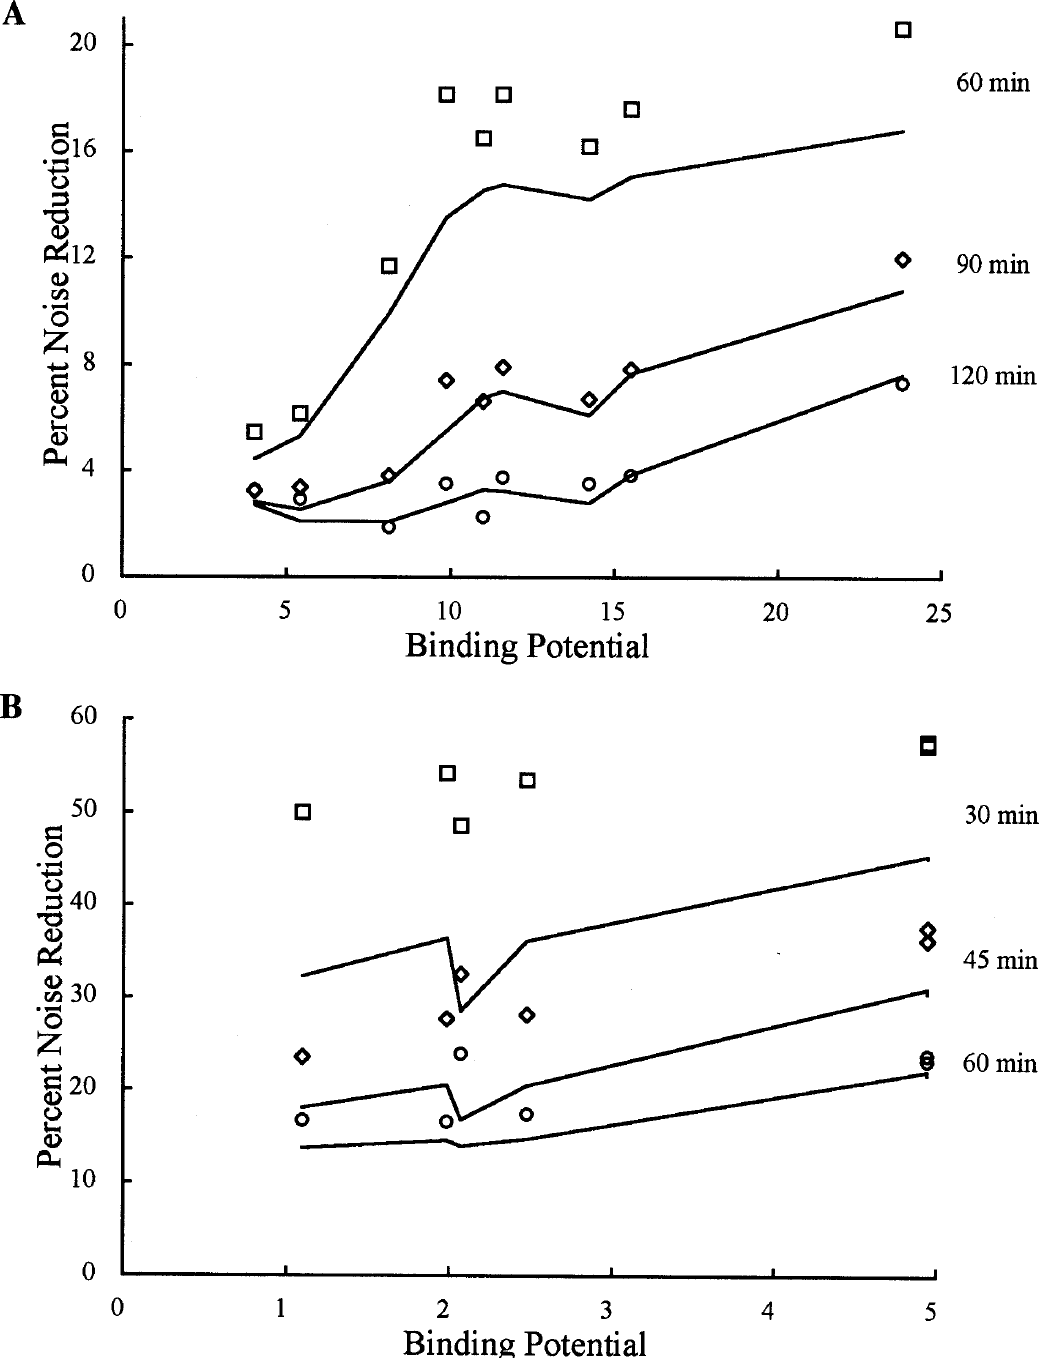
The percent reduction in BP noise using SRTM2 compared with SRTM calculated by the theoretical noise estimates (lines) and the simulation data (symbols) as a function of BP value for different scan durations.
SRTM2 functional images
Figure 7 shows functional images of BP and R1 calculated by SRTM and SRTM2 from one [11C]raclopride human study. The calculated k′2 from SRTM for pixels with BP greater than 1.0 was 0.216 and 0.213 min−1 for scan durations of 30 and 50 minutes, respectively. The noise reduction pattern in the functional images is similar to that found in the simulation (Fig. 4). The 30-minute BP images show a moderate noise reduction; this effect is smaller in the 50-minute BP images. The noise reduction in R1 is more dramatic and is comparable in the 30-and 50-minute images.
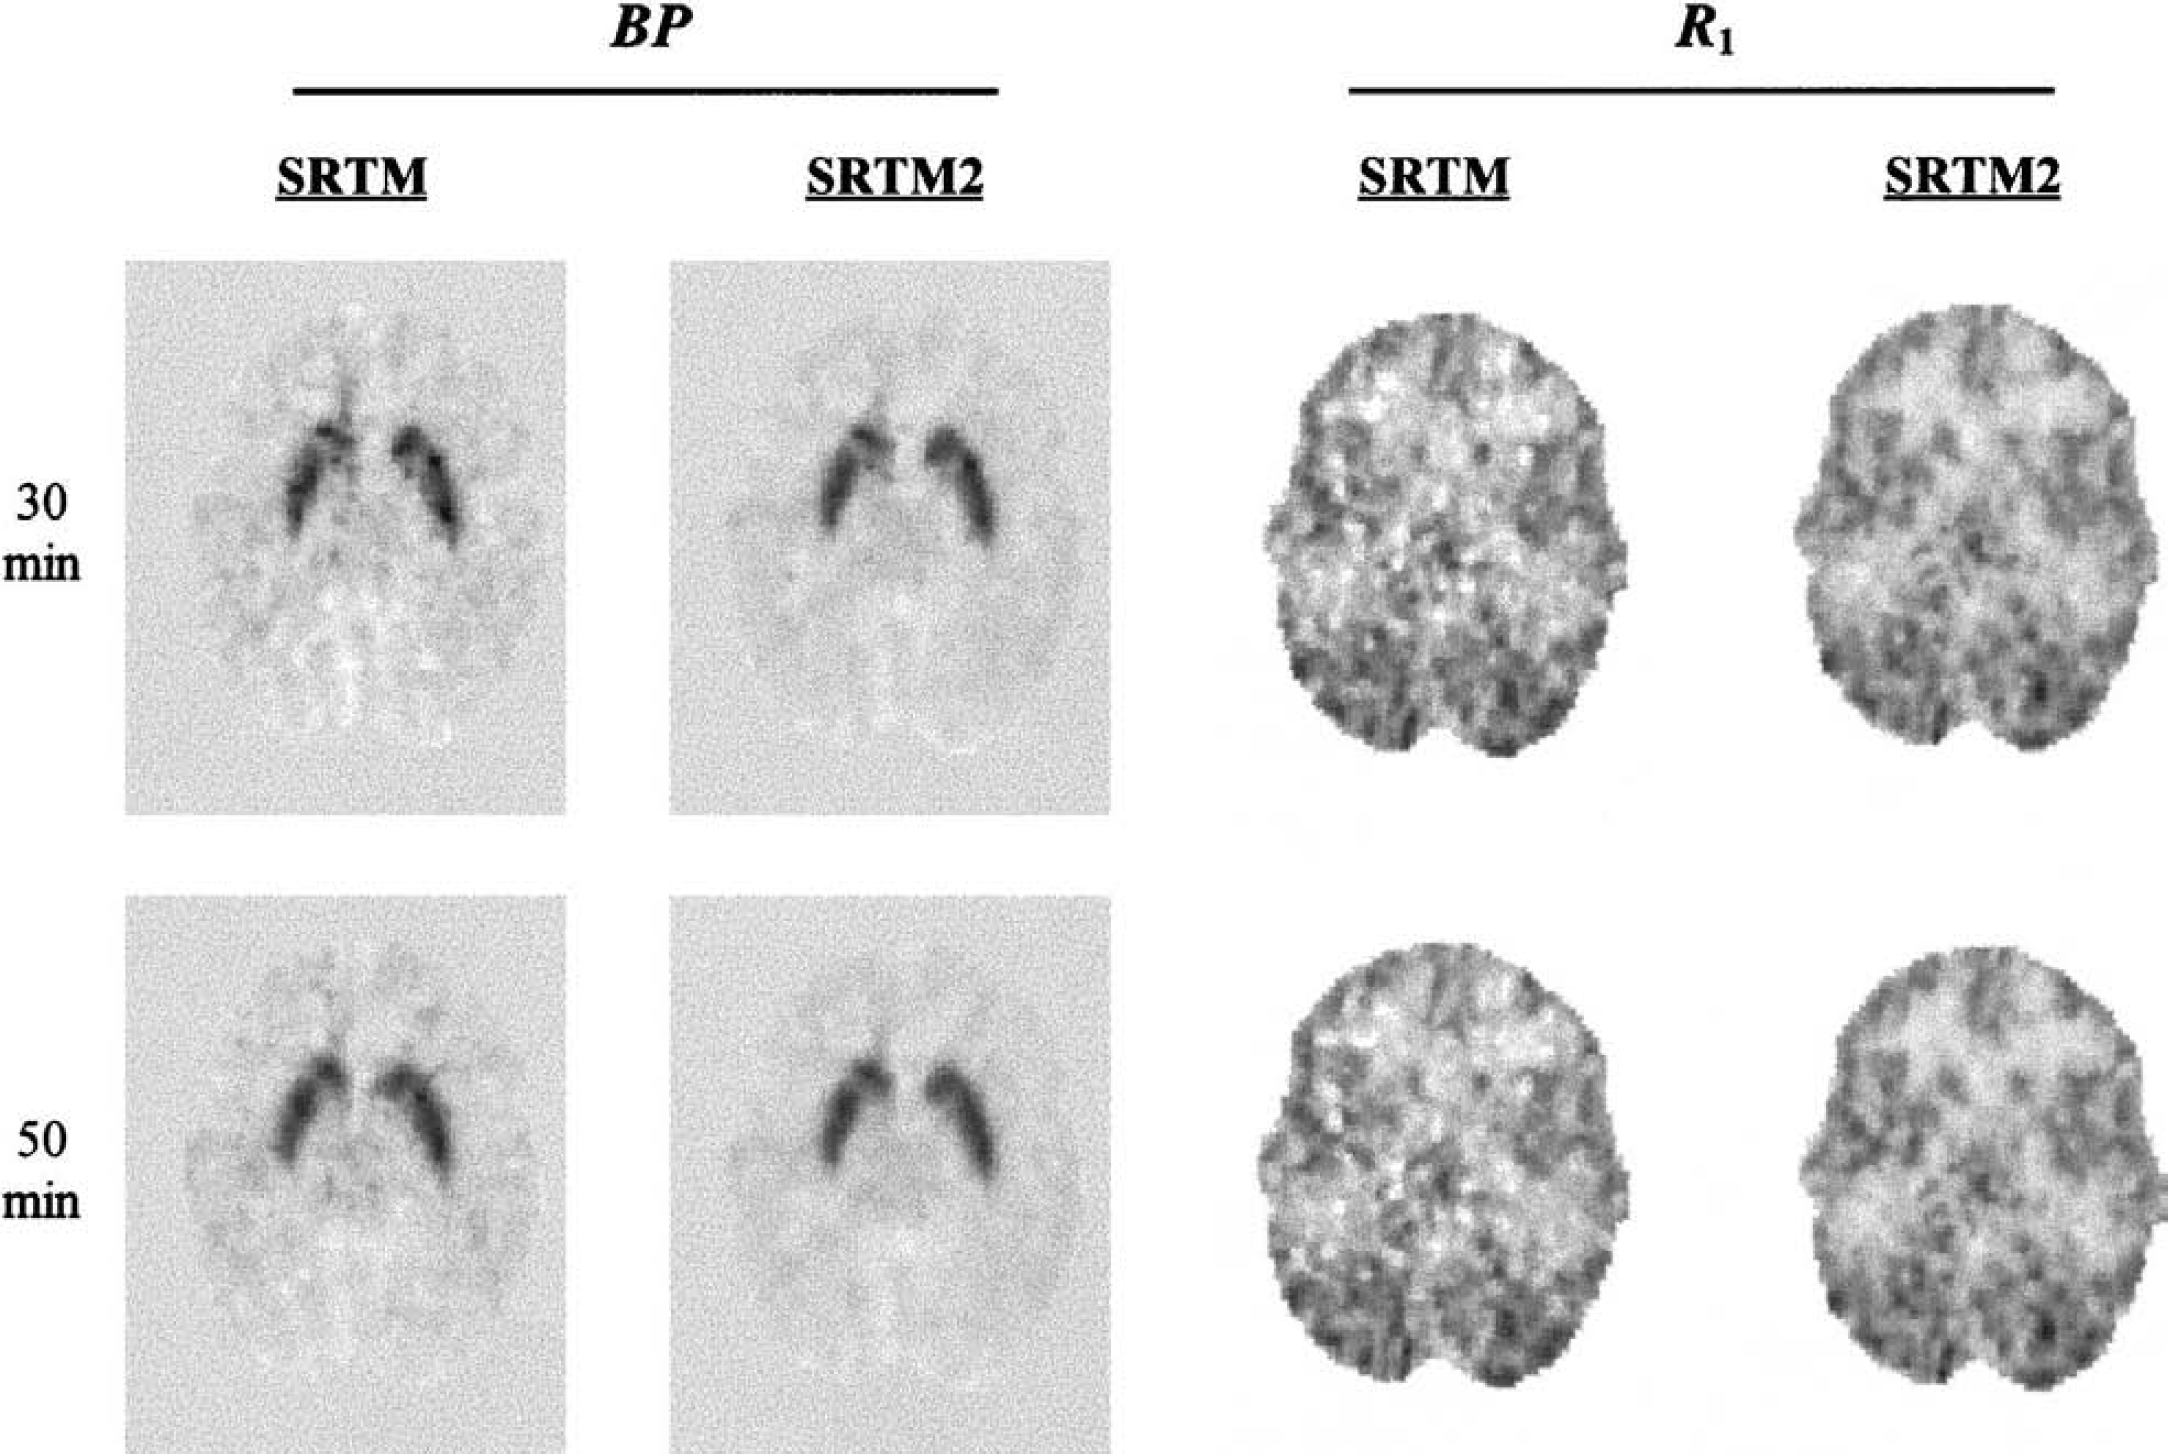
Functional images of BP and R1 calculated by SRTM and SRTM2 for [11C]raclopride. The two rows of images used scan durations of 30 and 50 minutes, respectively. The display range for BP images is −1.0 to 5.0. The display range for R1 images is 0 to 2. BP, binding potential; R1, relative delivery in the region of interest compared with the reference region; SRTM, Simplified Reference Tissue Model.
Simulation II: 2T bias analysis
The SRTM and SRTM2 biases calculated with different model combinations are shown in Figs. 8 and 9. Figure 8 shows the percent bias in BP for [18F]FCWAY (120-minute estimation). The different model configurations produced large changes in k′2, with bias of 7 ± 18%, −56 ± 18%, and −60 ± 17% (mean ± SD across regions) for R2T1, R1T2, and R2T2, respectively. For R1T2 and R2T2, the BP value had some effect on the SRTM estimate of k′2, whereby the lowest BP values corresponded to the lowest k′2 estimates.
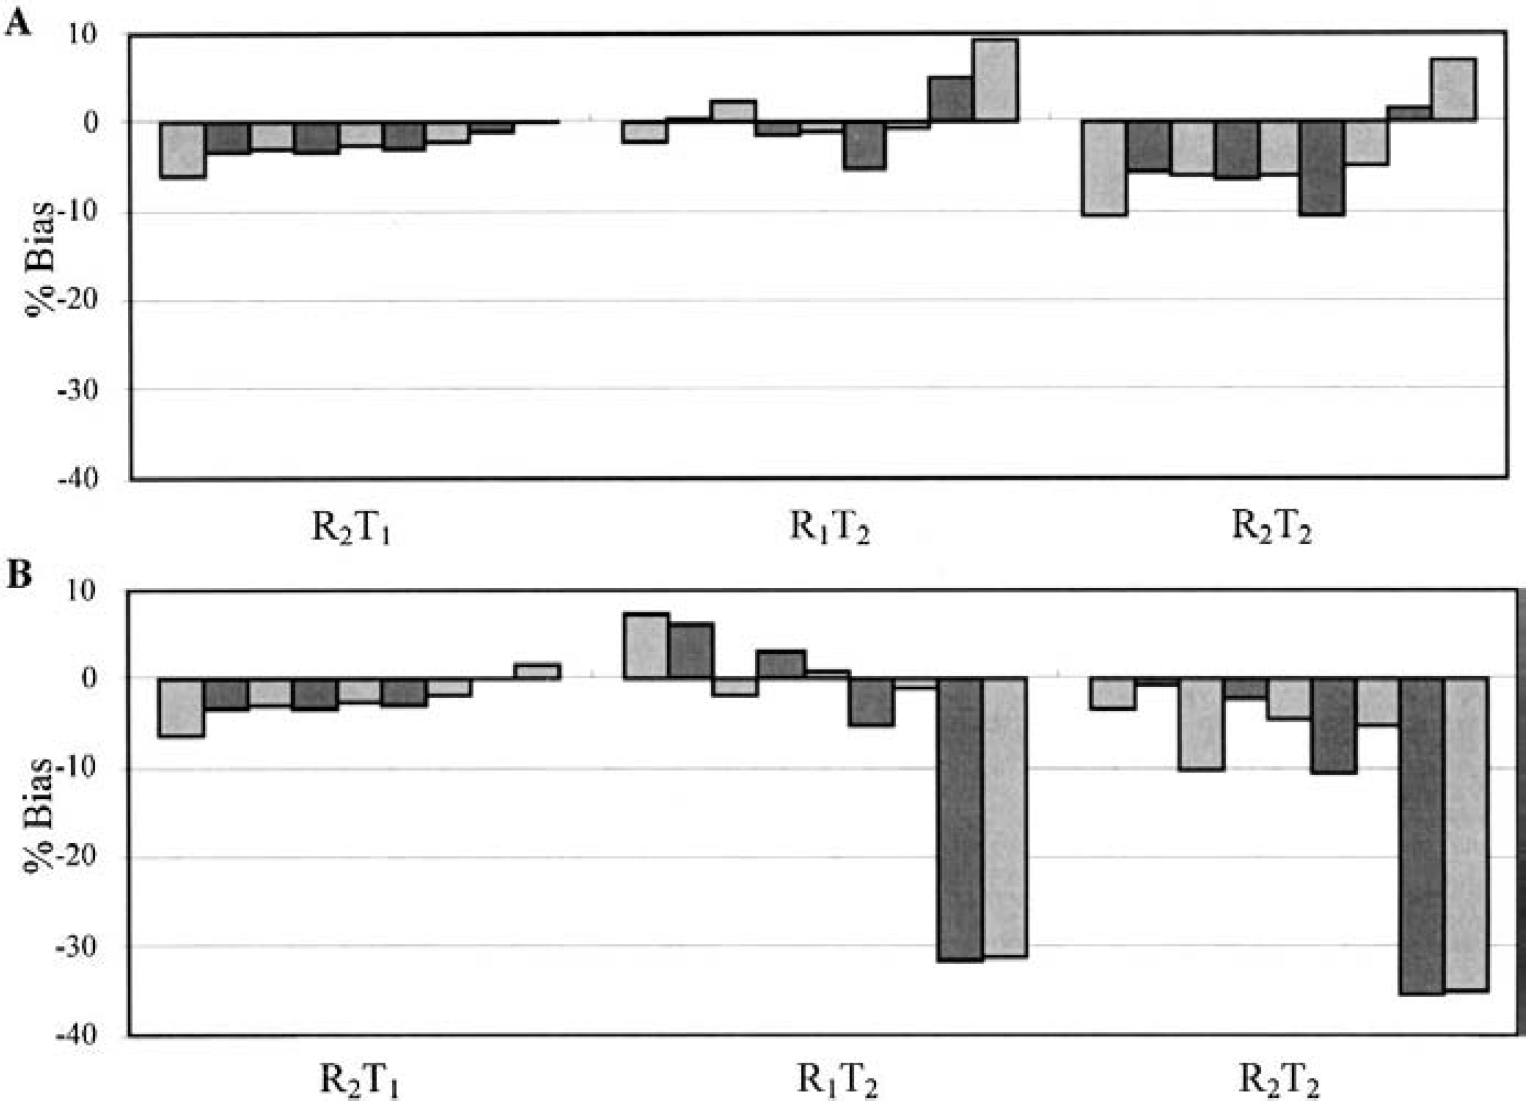
Percent bias of binding potential (BP) estimation for [18F]FCWAY (120-minute scan duration) calculated with
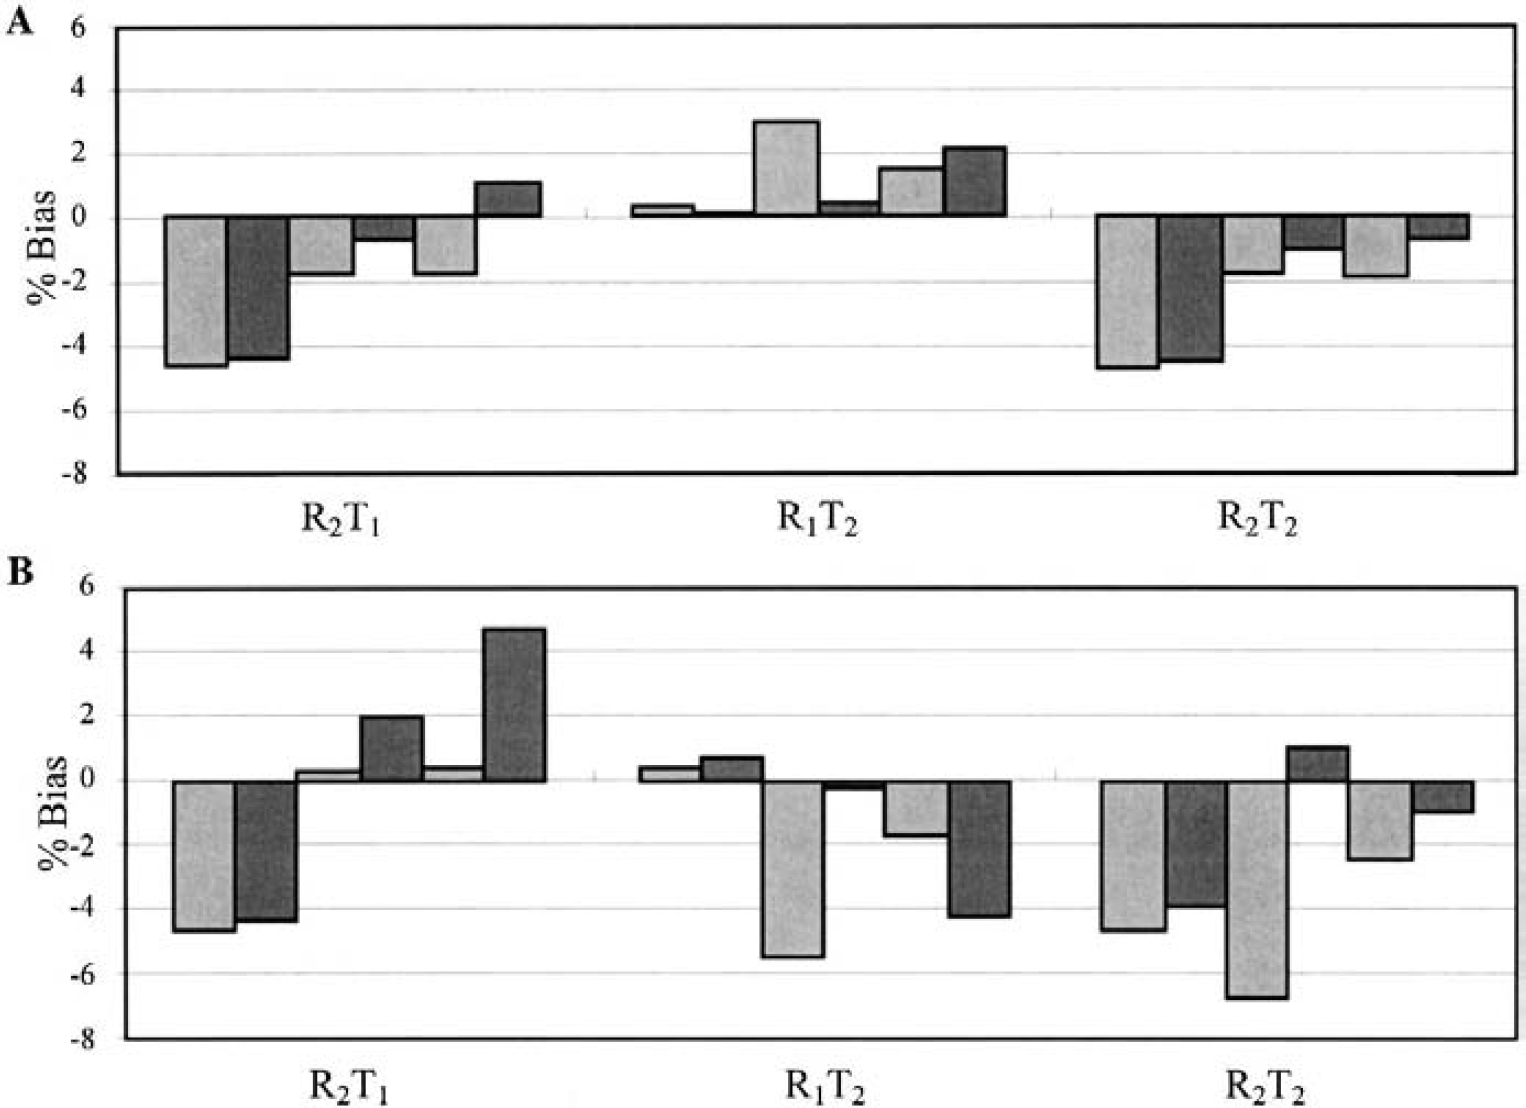
Percent bias of binding potential (BP) estimation for [11C]flumazenil (60-minute scan duration) calculated with
For SRTM and SRTM2, a 2T model for the reference region (R2T1) produced negative biases of 0% to 6% in BP. It is not surprising that this case produced similar results with the two methods since both methods would estimate a similar and incorrect k′2 value to best fit the data. In addition, R1 was also misestimated for R2T1 by 0% to 22% for SRTM and 13% to 25% for SRTM2.
The pattern of BP biases was different between SRTM and SRTM2 if the tissue region followed the 2T model. In most cases, SRTM produced biases of less than 10% for R1T2 since the parameter k′2 could be used to fit the curves well. For example, in regions of medial temporal and medial frontal cortices, SRTM estimated k′2 with a negative bias of ∼40%, while BP biases were less than 2%. For SRTM2, R1T2 yielded small biases only in the regions with intermediate BP where the fixed (median) k′2 compensated for the model's lack of fit. In regions with higher or lower BP, the biases were positive and negative respectively, because of the fixed k′2. Note that the large negative percent biases occur for the regions with the smallest BP (thalamus and basal ganglia). When both reference and tissue regions followed the 2T model (R2T2), the biases were approximately equal to the sum of the R1T2 and R2T1 bias.
Figure 9 shows the percent bias in BP for the 2T models for [11C]flumazenil for 60-minute estimation. The mean and SD of percent bias of k′2 for R2T1, R1T2, and R2T2 were 44 ± 32%, −17 ± 14%, and 4 ± 16%, respectively; these values are quite different than those of [18F]FCWAY. Here, the biases of BP are relatively small and comparable for SRTM and SRTM2. Thus, the specific kinetic characteristics of each tracer control the magnitude of bias when the data and model are inconsistent. For [11C]raclopride, the simulation gave the same BP bias of 0% to 3% across models for SRTM and SRTM2, because there is only one specific binding region.
DISCUSSION
We developed the two-step SRTM2 method to improve the statistical quality of functional images for receptor-binding radiopharmaceuticals. This method depends on the assumption that there is only one clearance rate constant from the reference region (k′2). In the first step, the three-parameter SRTM method is used to calculate k′2 from all brain pixels, and the median is calculated. In the second step, k′2 is fixed, and two-parameter estimation is performed for the entire brain volume. For N pixels in the brain, SRTM estimates 3N parameters (BP, R1, and k′2 for each pixel), whereas SRTM2 estimates 2N+1 parameters (a single k′2 for the entire brain). As expected, SRTM2 provides a reduction in noise. The magnitude of reduction, however, varies between tracers and was larger for R1 than BP. SRTM2 did provide a more substantial decrease in BP noise as scan duration was shortened; that is, the reduced number of parameters maintained a stable estimation environment for BP as the scan duration was shortened. This was also reflected in the reduction in outliers by SRTM2 compared to SRTM.
SRTM2 calculates k′2 from all brain pixels (excluding the reference region) to provide accurate whole-brain estimation. The distribution of estimated k′2 values, however, is not symmetric around its true value (Fig. 1). This was particularly true for k′2 estimates from regions with low BP, where the sensitivity for k′2 estimation in Eq. 1 is small. The simulation results showed that use of the median produced little or no bias as compared to the sample mean of k′2.
The magnitude of SRTM2 BP noise reduction was much larger for [11C]flumazenil than for [18F]FCWAY (Fig. 6). Since SRTM2 uses a fixed value for k′2, the noise reduction effects depend on two factors: (1) the magnitude of k′2 noise and (2) the correlation of this estimate with BP or R1. The average percent SD of estimation was similar for [11C]flumazenil and [18F]FCWAY (25% and 23%), so the difference in noise reduction was not caused by the first effect. Using the covariance matrix (Eq. 6), parameter correlations were determined for [18F]FCWAY and [11C]flumazenil for different regions and time durations. The correlation values between k′2 and BP or R1 showed a consistent relation with the SRTM2 noise reductions. For example, the BP to k′2 correlation was smaller in absolute value for [18F]FCWAY (−0.5 to −0.2) compared with [11C]flumazenil (−0.8 to −0.4), consistent with the smaller noise reduction for [18F]FCWAY. The R1 to k′2 correlation was larger in absolute value for [18F]FCWAY (−0.97 to −0.90) compared with [11C]flumazenil (−0.9 to −0.7), in agreement with the larger noise reduction for [18F]FCWAY. In addition, BP to k′2 correlations increased (in absolute value) with shorter scan durations and higher BP values, consistent with the larger noise reductions in these cases (Fig. 6).
In calculating the sample functional images (Fig. 7), k′2 was determined by SRTM for all brain voxels. For regions with very low BP values and R1 ∼ 1, however, k′2 is not numerically identifiable in Eq. 1 (i.e., where k′2 ≅ k2). For these pixels, the error in the estimated k′2 value is large and is compensated by a large matching error in the estimate of k2. In calculating the global k′2 values, the median value changes if more of these low BP pixels are included. For example, if the BP threshold for pixel inclusion was lowered from 1.0 to 0.6, the median k′2 changed from 0.21 to 0.16 min−1, whereas if the BP threshold was raised to 2.0, median k′2 was changed by less then 0.01 min−1. We calculated median k′2, therefore, only in pixels where BP was not too small. In this case, the distribution of estimated k′2 values was similar to that in Fig. 1. This approach was necessary for [11C]raclopride, where many brain voxels have low BP. This BP thresholding approach may be less important for other tracers where more brain voxels have a large enough BP to allow reasonable estimation of k′2.
For functional imaging with SRTM and SRTM2, a search range for k2 must be defined. Although this range usually has no effect on the least-squares solution point in regions with substantial BP, it can contribute to the noise in the SRTM image in pixels with low BP. If k2 is not numerically identifiable, extending the search range to include very small k2 values leads to noisier BP images, with little or no effect on R1 (data not shown). For SRTM2 with only two parameters, however, the k2 search range is not critical, since BP and R1 are identifiable in all regions.
The functional image calculation (Fig. 7) was applied to data acquired with bolus/infusion (B/I) tracer administration, while the simulations were performed using a bolus injection. To assess whether the improvement of SRTM2 over SRTM in Fig. 7 was comparable to what would have been seen with a bolus injection, we calculated the theoretical parameter SD (Eq. 6) for SRTM and SRTM2. Assuming the same injection dose between bolus and B/I administrations, there was ∼10% higher noise for the B/I data for both BP and R1 for both SRTM and SRTM2. Therefore, we would expect SRTM2 to produce a comparable statistical advantage for bolus studies as that seen in the Fig. 7 B/I study.
SRTM and SRTM2 functional image calculation was not applied to human [18F]FCWAY data because ROI analysis has demonstrated that the kinetic characteristics of these data do not meet the assumptions of these models (Carson et al., 2000a; Toczek et al., 2002). In particular, tissue and reference regions are best described by a 2T model, rather than a 1T model, and a substantial fraction of the radioactivity in the cerebellum reference region can be attributed to brain uptake of the radiolabeled metabolite [18F]fluorocyclohexanecarboxylic acid, as well as to intravascular radioactivity. In addition to the noise comparisons, we evaluated the sensitivity of SRTM and SRTM2 to violations in model assumptions, that is, the need for a 2T model for the reference and/or tissue regions. In most cases, the biases were small, although biases were larger for SRTM2, particularly for regions with low [18F]FCWAY BP. Generally, SRTM produced small bias since the parameter k′2 could be used to fit the curves well, even when the 1T model was not appropriate. In our data, the fits with SRTM were generally good, although there was some lack of fit when the reference region was simulated with the 2T model. There were large errors in the estimated values of R1 and k′2. For [18F]FCWAY estimation with SRTM, the mean R1 biases were 13%, −1%, and 18% for R2T1, R1T2, and R2T2, respectively. For SRTM2, fits were comparable or worse than those of SRTM. The worst fits were found for R1T2 and R2T2 for thalamus and basal ganglia, which produced the largest biases (Fig. 8B). Biases were often larger for SRTM2 since this method did not have the capability of floating k′2. Thus, both methods, SRTM2 in particular, are more sensitive to model violations in the tissue region, rather than the reference region.
For [11C]flumazenil, the biases of R1T2 and R2T2 (Fig. 9) were generally much smaller than those of [18F]FCWAY (Fig. 8). This can be understood by the nature of the kinetic parameters for these two tracers. For [18F]FCWAY, a 2T model was found to be best for all regions (Carson et al., 2000b), whereas for [11C]flumazenil, although 2T fits could be performed, a 1T model was found to be sufficient (Koeppe et al., 1991). Another approach to consider the bias due to lack of fit produced by applying a 1T model to 2T data is the impulse response fraction (IRF) (Carson et al., 1998). The IRF is the fraction of the area under the impulse response function attributable to the second exponential of the 2T model; smaller values suggest less need for a 2T model. The IRF for [18F]FCWAY for all regions excluding the cerebellum ranged from 0.03 to 0.19, implying that the second exponential plays a nontrivial role in the impulse response. For [11C]flumazenil, the IRF ranged from 0.01 to 0.08; thus, a 1T model would more closely describe its kinetics.
Slifstein et al. (2000) reported simulation analyses for SRTM with the 5-HT1A tracer [11C]WAY 100635. When the tissue TAC was simulated with a 2T model (R1T2 case), SRTM overestimated BP by ∼10%. When both the tissue and reference TACs were simulated with a 2T model (R2T2 case), SRTM underestimated BP by ∼20%. The bias patterns in their calculation are larger than those shown here for the fluorine analog [18F]FCWAY (Fig. 8A), where R1T2 had negligible bias and R2T2 had a bias of −5% to −10% (excluding regions with small BP). These discrepancies appear to be due to differences in kinetic parameters, particularly in the reference region. For example, if the [18F]FCWAY cerebellum reference region is simulated with a k2 of 0.073 min−1 rather than the original value of 0.324 min−1, the R1T2 bias increased for medial temporal region by 9%. Alternatively, for the R2T2 simulation, different 2T parameters in the reference region, particularly a higher k3/k4 ratio, can lead to a larger underestimate of BP by SRTM, similar to that found by Slifstein et al. (2000). Thus, the magnitude of biases caused by application of SRTM or SRTM2 to data consistent with a 2T model substantially depends on the specific parameter values. These types of simulations studies should therefore be performed for all tracers before application of methods based on the 1T model.
Another potential source of bias with these reference region methods is the use of the scan data for the reference region input, that is, while the model formulation (Eq. 1) assumes that Cr(t) is an instantaneous measurement, these values are derived from scan data that integrate over each frame duration. This suggests that short frame durations, particularly at the beginning of the study, are desirable to minimize any bias introduced by the scan integration effects. To reduce this potential bias in this study, scan frame durations were reduced by a factor of two from the original human scan protocol, that is, each frame of duration Δt was replaced with two frames of duration Δt/2. To assess the bias in the estimated parameters due to this effect, SRTM and SRTM2 were applied to noise-free data with the original and “doubled” sampling. With the original frame sampling, the maximum absolute bias in R1 or BP was 2.5%, 0.9%, and 2.5% for [18F]FCWAY, [11C]flumazenil, and [11C]raclopride, respectively. With the doubled sampling, these maximum biases were reduced to 0.7%, 0.2%, and 0.7%, respectively.
An important assumption of the SRTM methods is that there is no specific binding in the reference region. For [11C]flumazenil, the pons has very low tracer uptake and has been used to estimate the level of free plus nonspecifically bound tracer (Abadie et al., 1996; Koeppe et al., 1991). It has been demonstrated, however, that there is a moderate level of specific binding in the pons, resulting in biased estimates or the application of correction algorithms (Delforge et al., 1996; Litton et al., 1994). Kinetically, if the tissue and reference regions are well described by the 1T model, the presence of specific binding in the reference region will not affect the ability of SRTM or SRTM2 to estimate the kinetic parameters. Rather, the effect of this specific binding will be underestimation of the BP values since the volume of distribution in the reference region will overestimate the true free plus nonspecific volume of distribution.
In this study, SRTM and SRTM2 were applied using a reference region TAC Cr(t) without noise. This choice was made because, in many cases, the reference region is large (such as the cerebellum) and the noise in Cr(t) is much smaller than that in the TAC from a single pixel. Even if there is higher noise in the reference region (e.g., when a small region such as the pons is used), the noisy Cr(t) curve will be applied in common to all pixels. This should not increase the apparent noise in the functional images, but may introduce a subject-specific global bias in the results. For cases with noisy reference TACs, some preliminary noise reduction should be applied, such as multiexponential fitting of the tail of this curve.
CONCLUSIONS
SRTM2 provides reduced noise for the calculation of functional images of binding potential and relative delivery. The magnitude of the improvement depends on the tracer's kinetics and tends to have a larger impact on R1 than BP. This noise reduction improves the stability of the fitting process and may permit the use of shorter scan durations where the magnitude of noise reduction is larger. We conclude that SRTM2 should be a useful method to reduce noise in functional receptor imaging.
Footnotes
Acknowledgments:
The authors thank Dr. Masanori Ichise for helpful comments and Dr. Robert Koeppe for supplying the [11C]flumazenil input function.
APPENDIX: FUNCTIONAL SRTM2 IMAGES
A rapid implementation of SRTM2 is required in order to find the weighted least-squares solution for each pixel. The approach of this method is that the model equation (Eq. 1) has only one nonlinear parameter, so that the optimal value for the linear parameter (R1) can be determined as a function of the nonlinear one (k2). Then, a one-dimensional search in the space of the nonlinear parameter can be performed to find the weighted least-squares minimum.
Let Ci be the pixel value at time ti, i = 1,…, N. Define a set of M k2 values covering the physiologic range, indexed by j = 1, …, J. Define the basis vector bij: