
Abstract
Reduced signal on [11C]]flumazenil (FMZ) positron emission tomography (PET) is associated with epileptogenic foci. Linear correlations within individuals between parametric and nonparametric images of FMZ binding have been shown, and various methods have been used, without comparison of diagnostic usefulness. Using hippocampal sclerosis (HS) as a test case, we formally compare the diagnostic yield of parametric images obtained either with a parent tracer arterial plasma input function and spectral analysis (yielding volume-of-distribution (VD) images), or with an image-based input function and the simplified reference tissue model (binding potential images, BP-SRTM) with the diagnostic yield of semiquantitative-integrated (ADD) images from 10 to 20 or 20 to 40 mins (ADD1020 and ADD2040). Dynamic 90-min [11C]FMZ PET datasets and arterial plasma input functions were available for 15 patients with medically refractory medial temporal lobe epilepsy (TLE) and histologically verified unilateral HS and for 13 control subjects. SPM2 was used for analysis. ADD1020 and ADD2040 images showed decreased FMZ uptake ipsilateral to the epileptogenic hippocampus in 13/15 cases; 6/13 had bilateral decreases in the ADD1020 analysis and 5/13 in the ADD2040 analysis. BP-SRTM images detected ipsilateral decreases in 12/15 cases, with bilateral decreases in three. In contrast, VD images showed ipsilateral hippocampal decreases in all 15 patients, with bilateral decreases in three patients. Bilateral decreases in the ADD images tended to be more symmetrical and in one case were more marked contralaterally. Full quantification with an image-independent input should ideally be used in the evaluation of FMZ PET; at least in TLE, intrasubject correlations do not predict equivalent clinical usefulness.
Keywords
Introduction
In the forebrain, γ-aminobutyric acid (GABA) is the principal inhibitory neurotransmitter acting at the GABAA receptor complex. [11C]Flumazenil (FMZ) positron emission tomography (PET) images the benzodiazepine-binding site of GABAA receptors that contain α- subunits 1, 2, 3, or 5.
Reductions in [11C]FMZ uptake have repeatedly been reported in the medial temporal lobe of hippocampal sclerosis (HS) patients (Debets et al, 1997; Hammers et al, 2001; Henry et al, 1993; Koepp et al, 1997a; Koepp et al, 1996, 1997b; Ryvlin et al, 1998; Savic et al, 1993; Szelies et al, 1996) and cases of temporal lobe epilepsy (TLE) with normal magnetic resonance imaging (MRI) (Debets et al, 1997; Hammers et al, 2002; Koepp et al, 2000; Lamusuo et al, 2000; Ryvlin et al, 1998; Szelies et al, 2000). [11C]Flumazenil PET may also localize extratemporal seizure foci (Hammers et al, 2003b; Muzik et al, 2000; Richardson et al, 1998; Ryvlin et al, 1998; Savic et al, 1995). Areas of reduced focal [11C]FMZ uptake are clinically relevant in that their presence is associated with spiking cortex (Muzik et al, 2000), and their removal during epilepsy surgery under electrophysiological guidance results in a good postoperative outcome (Juhász et al, 2001, 2000).
Hippocampal sclerosis is the most common pathologic substrate found in surgical specimens of TLE patients (Bruton 1988). Magnetic resonance imaging is now the method of choice for demonstrating HS, but even optimal quantitative MRI does not show abnormalities in 15% to 30% of TLE patients being evaluated for surgery (Van Paesschen et al, 1997). [11C]Flumazenil PET has been shown to be useful in this MRI-negative group of patients (e.g., Hammers et al, 2002). Preoperatively acquired [11C]FMZ PET scans in HS offer a unique opportunity to estimate the yield of various methods of analysis.
Previous work has directly correlated regional binding values obtained with kinetic modeling versus regional simple summed activity obtained from integrated (ADD) images. Significant linear intrasubject correlations were reported and some groups have gone on to use simplified methods. Most studies with a methodological focus, however, investigated healthy volunteers only (Millet et al, 1995; Mishina et al, 2000; Okazawa et al, 2004).
Statistical parametric mapping requires spatial registration of a large number of images to enable mass univariate statistical testing at the voxel level, with appropriate corrections for multiple comparisons. Statistical parametric mapping has been adapted and shown to be suitable for the statistical comparison of ligand PET images (Koepp et al, 1996). It is particularly suited for exploratory investigation of imaging datasets when the exact location or extent of abnormalities cannot be predicted. When a control group is used, statistical parametric mapping (SPM) offers the additional advantage of detecting bilateral changes in patients and to attribute directionality to any changes detected, in contrast to region of interest (ROI)-based measures of asymmetry. There has not been a formal comparison of the yield of clinically relevant information from analysis of ADD images and parametric maps of binding potential (BP) or volume of distribution (VD).
While ADD1020 [11C]FMZ PET images (Juhász et al, 1999, 2000, 2001; Muzik et al, 2000; Niimura et al, 1999), ADD2040 images (Mishina et al, 2000; Ryvlin et al, 1998, 1999) and BP images (Lamusuo et al, 2000) have been widely used in the study of epilepsy, further alternatives to quantification with kinetic modeling using Spectral Analysis are available. It is possible to distinguish between analytical approaches without a reference (ADD images), methods using a reference region from the images themselves (e.g., pons or brainstem (Lamusuo et al, 2000)), including those with equilibrium scanning (Szelies et al, 2000) and partial saturation (Delforge et al, 1997), and those using an external reference (e.g., an arterial plasma input function).
Our objective was to compare, in HS, the diagnostic yield of images obtained through quantification of binding using metabolite-corrected arterial plasma input functions and spectral analysis with the diagnostic yield of a kinetic method using an image-derived input function (simplified reference tissue model, SRTM, using the pons as reference) and the diagnostic yield of semiquantitative methods (ADD images over two different time periods that have been used previously). Being able to use BP-SRTM would obviate the need for arterial cannulation and blood and plasma analysis including determination of the parent fraction, while being able to use ADD images would obviate the need for reference region definition and kinetic analysis. Either of the simplified approaches would thus provide benefits in terms of the burden to patients as well as in terms of resource requirements relating to these PET studies.
Materials and methods
Patients and Controls
We have described previously the HS and control subjects in clinical papers (Hammers et al, 2005). Data for 15 patients with HS and 13 controls were available. All patients had strictly unilateral HS on quantitative MRI (Van Paesschen et al, 1997) and interictal/ictal ipsilateral epileptic activity on the electroencephalogram; all controls had normal MRI studies. Before scanning, written informed consent and the approval of local Ethics Committees and of the UK Administration of Radiation Substances Advisory Committee were obtained.
Positron Emission Tomography Image Acquisition and Analysis
The acquisition protocol for [11C]FMZ PET has been described previously in detail (Hammers et al, 2005; Koepp et al, 1996). In brief, a dynamic three-dimensional series, consisting of 20 frames over 90 mins, was acquired in temporal lobe orientation on a Siemens/CTI 953B scanner after injection of ∼370MBq of [11C]FMZ, axially normalized and movement-corrected. Voxel-based parametric images of FMZ-VD were computed from these time series and arterial plasma input functions corrected for parent fraction using spectral analysis (Cunningham and Jones, 1993) with a correction for activity in the blood volume, implemented in Roger Gunn's Receptor Parametric Mapping software (RPM; available via http://www.cu.mrc.ac.uk/resources/rpm.shtml). The frequency boundaries for data uncorrected for decay of 11C were kept at the default values of 0.1 to 0.0008 s−1.
Binding potential images were created using the SRTM (Gunn et al, 1997; Lammertsma and Hume 1996) implemented in RPM (BP-SRTM images). The input kinetics were derived from the pons. This was defined by spatial warping of a version of our frequency-based human brain atlas (Hammers et al, 2003a) onto each subject's MRI using SPM software (Wellcome Department of Imaging Neuroscience, UCL, London, UK) (Ashburner and Friston 2005), subsequent coregistration of MRI and transformed atlas onto a weighted 90 mins summed activity image of that subject, and sampling of the radioactivity concentration in all time frames of the dynamic data using Analyze AVW 7.0.
Finally, decay-corrected ADD images of frames 12 and 13 (10 to 20 mins after start of the acquisition; ADD1020) and of frames 14 and 15 (20 to 40 mins after start of the acquisition, ADD2040) were created from the preprocessed dynamic PET scans.
All images were interrogated with SPM2. The images were spatially normalized (Ashburner et al, 2000) to a FMZ-VD template created in our unit from native and right—left reversed control studies. The FMZ-VD template occupies the space defined by the SPM2 MRI templates, averages of 152 brains (International Consortium for Brain Mapping (ICBM)/Montreal Neurological Institute (MNI)). As the ADD images, BP-SRTM images and VD images are in perfect register, having been derived from the same dynamic time series, we only derived spatial normalization parameters once, from the VD images, and applied them to the BP-SRTM and ADD images as well. Magnetic resonance images were coregistered with SPM2's normalized mutual information option and spatially normalized using the same parameters as for the PET images. All individual images were analyzed in their native orientation. Only for group comparisons the FMZ images of the six patients with left-sided HS were left-right reversed before normalization, making the HS appear on the right side in all 15 patients. Normalization was performed using SPM2's default settings for both the affine and the nonlinear part. Voxel sizes of normalized images were 2 mm × 2 mm × 2 mm. After normalization, images were smoothed using a 12 mm × 12 mm × 12 mm (full-width at half-maximum) isotropic Gaussian kernel.
Statistical Analysis
Global values were computed as a mean over the entire image matrix, thresholded at one-eighth of this value to create a brain mask, and averaged again within this mask. Global differences between patient and control scans were assessed with two-tailed t-tests.
Potential correlations between FMZ uptake or VD and age or gender were assessed at the voxel level.
We then compared each control subject's scans with the remaining 12 control subjects, and each patient with the 13 control subjects. In all analyses, the global cerebral signal was included as a covariate of no interest; no other covariates were included in the design matrix.
The search volume was restricted to the brain including white matter by using a combination of a low proportional threshold with an explicit mask in MNI space, as described previously (Hammers et al, 2003b).
For assessment of changes anywhere in the brain, the statistical parametric maps resulting from the above analyses were subjected to an initial threshold at P = 0.001. The resulting statistical map was then interrogated for any clusters of significant differences (significance defined as the conventional P < 0.05 threshold), which were characterized in terms of P-value, Z score, spatial extent (k), and coordinates in MNI/ICBM152 space. No extent threshold was applied.
For assessment of medial temporal changes, statistical parametric maps were re-thresholded at P = 0.01 uncorrected, assessed using a medial temporal lobe mask, and significant changes assessed at a threshold of Z >2.5 and characterized in terms of Z score, extent (k), and coordinates, as described and used previously (Hammers et al, 2001, 2002; Koepp et al, 1997a, 1997b, 2000). This combination of thresholds has a theoretical foundation in the correction for approximately four independent comparisons at the smoothing level of the final SPM (±Z = 2.5 corresponds to a P of 0.0124, that is ∼0.05/4, a traditional Bonferroni correction for multiple comparisons) and has been empirically validated by approximately yielding the expected false-positive rates in our previous studies.
The localization of all clusters was determined by overlaying onto subjects’ coregistered MRIs.
Group analyses were performed in the same fashion for all four methods, comparing patients (side reversed to show the HS on the right side where necessary) with controls, and otherwise in the same way as described above, except for localization which was achieved with reference to the MNI/ICBM152 average MRI.
Results
Global Values
There were no global differences in FMZ uptake between controls and patients in the ADD1020, ADD2040, BP-SRTM, or VD groups (P >0.26; see Table 2). The coefficients of variation (CVs; s.d./mean) ranged from 10% to 15% for controls across all groups. Patients had a CV of 14% for the VD group, but these were markedly higher in the BP-SRTM group at 28% and highest in the ADD1020 and ADD2040 groups at 34% (Table 2).
Correlation with Sex and Age
There were no significant regional correlations with age or gender in the FMZ images; neither was therefore included in the subsequent statistical models.
Group Analysis
Highly significant clusters of ipsilaterally decreased FMZ uptake were seen in the ipsilateral medial temporal lobe with all four methods.
Effect size estimates increased from ADD1020 to BP to ADD2040 to VD groups (Z = 5.11, 5.93, 6.53, and 6.73, respectively). Cluster size was smallest in the ADD1020 group (k = 1042), largest in the ADD2040 group (k = 2531; full length of ipsilateral hippocampus, involving parts of the amygdala and ipsilateral thalamus) and intermediate in the BP and VD groups (k = 1179 and k = 1182, respectively; full length of ipsilateral hippocampus and amygdala).
The difference in group analyses is illustrated for ADD2040 and VD images in Figure 1.
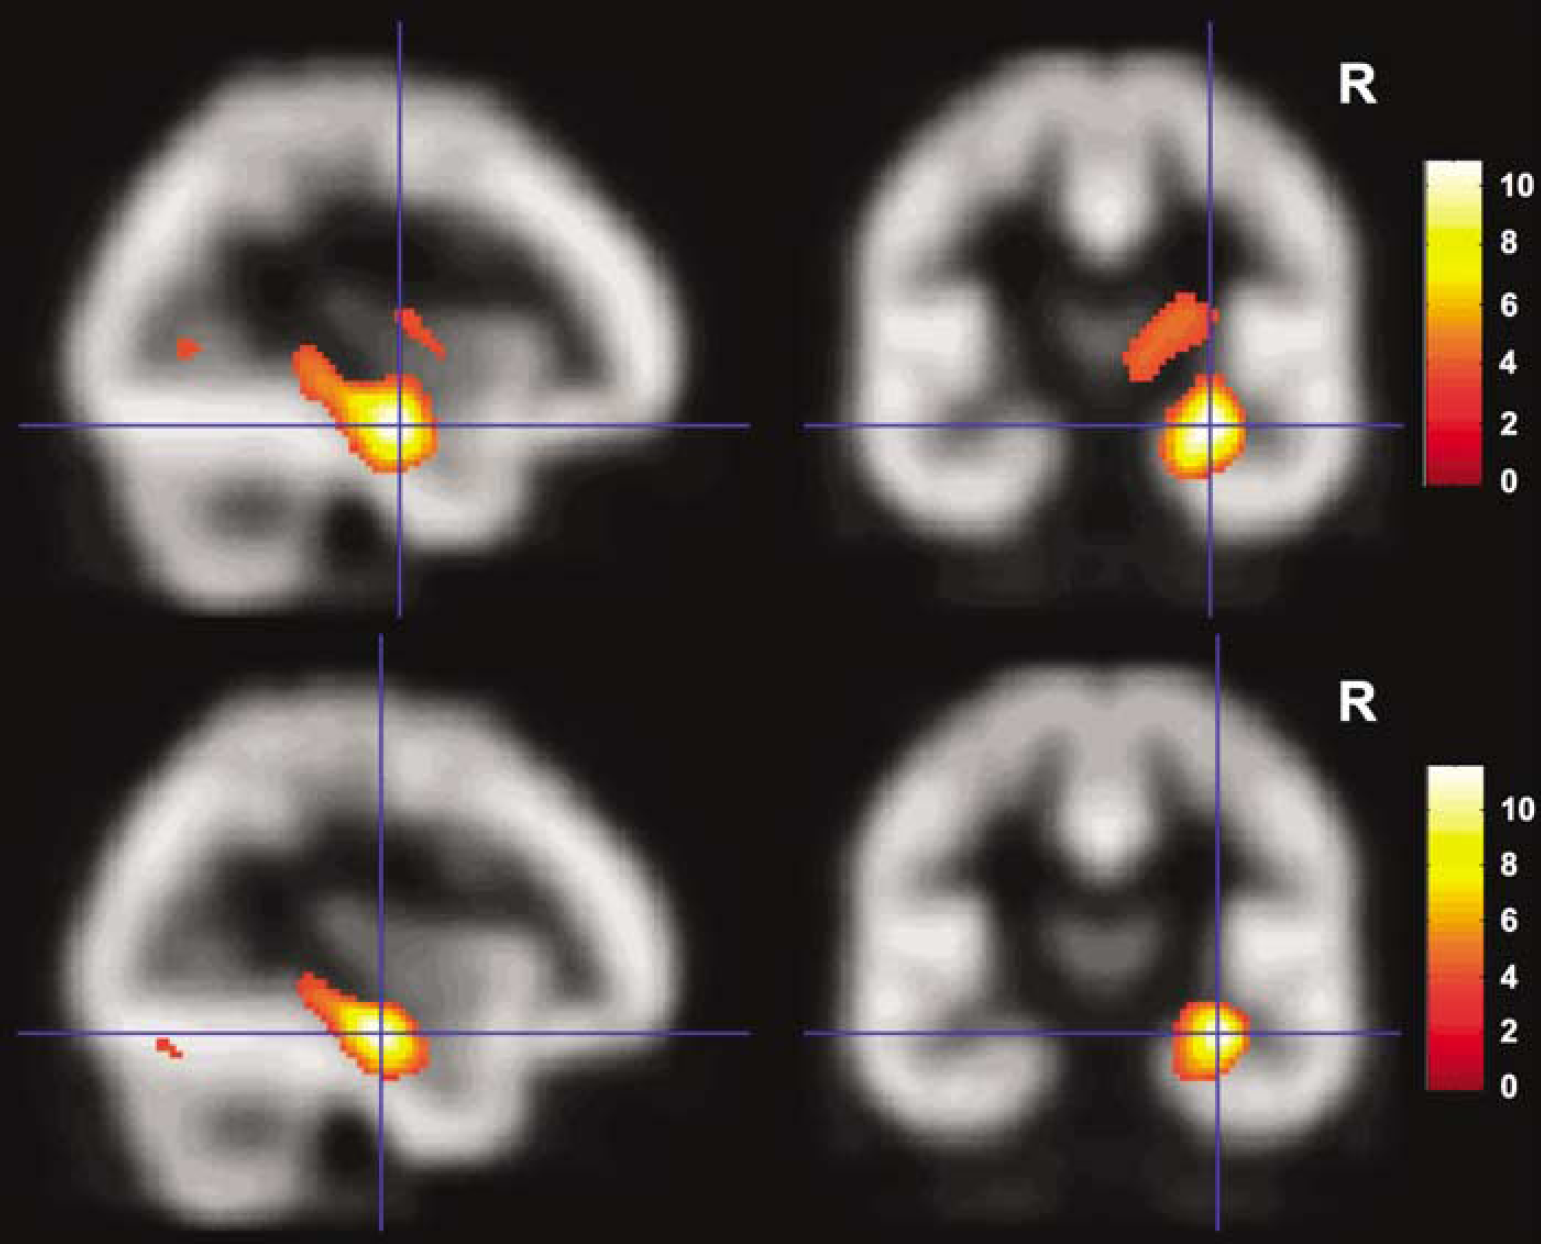
Comparison of group analysis of ADD2040 images (top row of the figure) and VD images (bottom row of the figure). Results of the statistical assessment of decreases in the 15 patients with HS compared with the 13 controls are overlaid onto the FMZ template used for spatial normalization. For these group analyses only, the images of the six patients with left hippocampal sclerosis were right—left reversed before spatial normalization so the hippocampal sclerosis appeared on the same, right, side in all patients (see Materials and methods for details). Compared with VD images, ADD2040 images yielded lower maximum effect sizes (Z = 6.53 versus Z = 6.73) and a larger spatial extent of abnormalities (k = 2531, 20248 mm3 versus k = 1182, 9456 mm3). Note the overall similarity of the group results, in contrast with the different sensitivity in individual analyses (Figure 2).
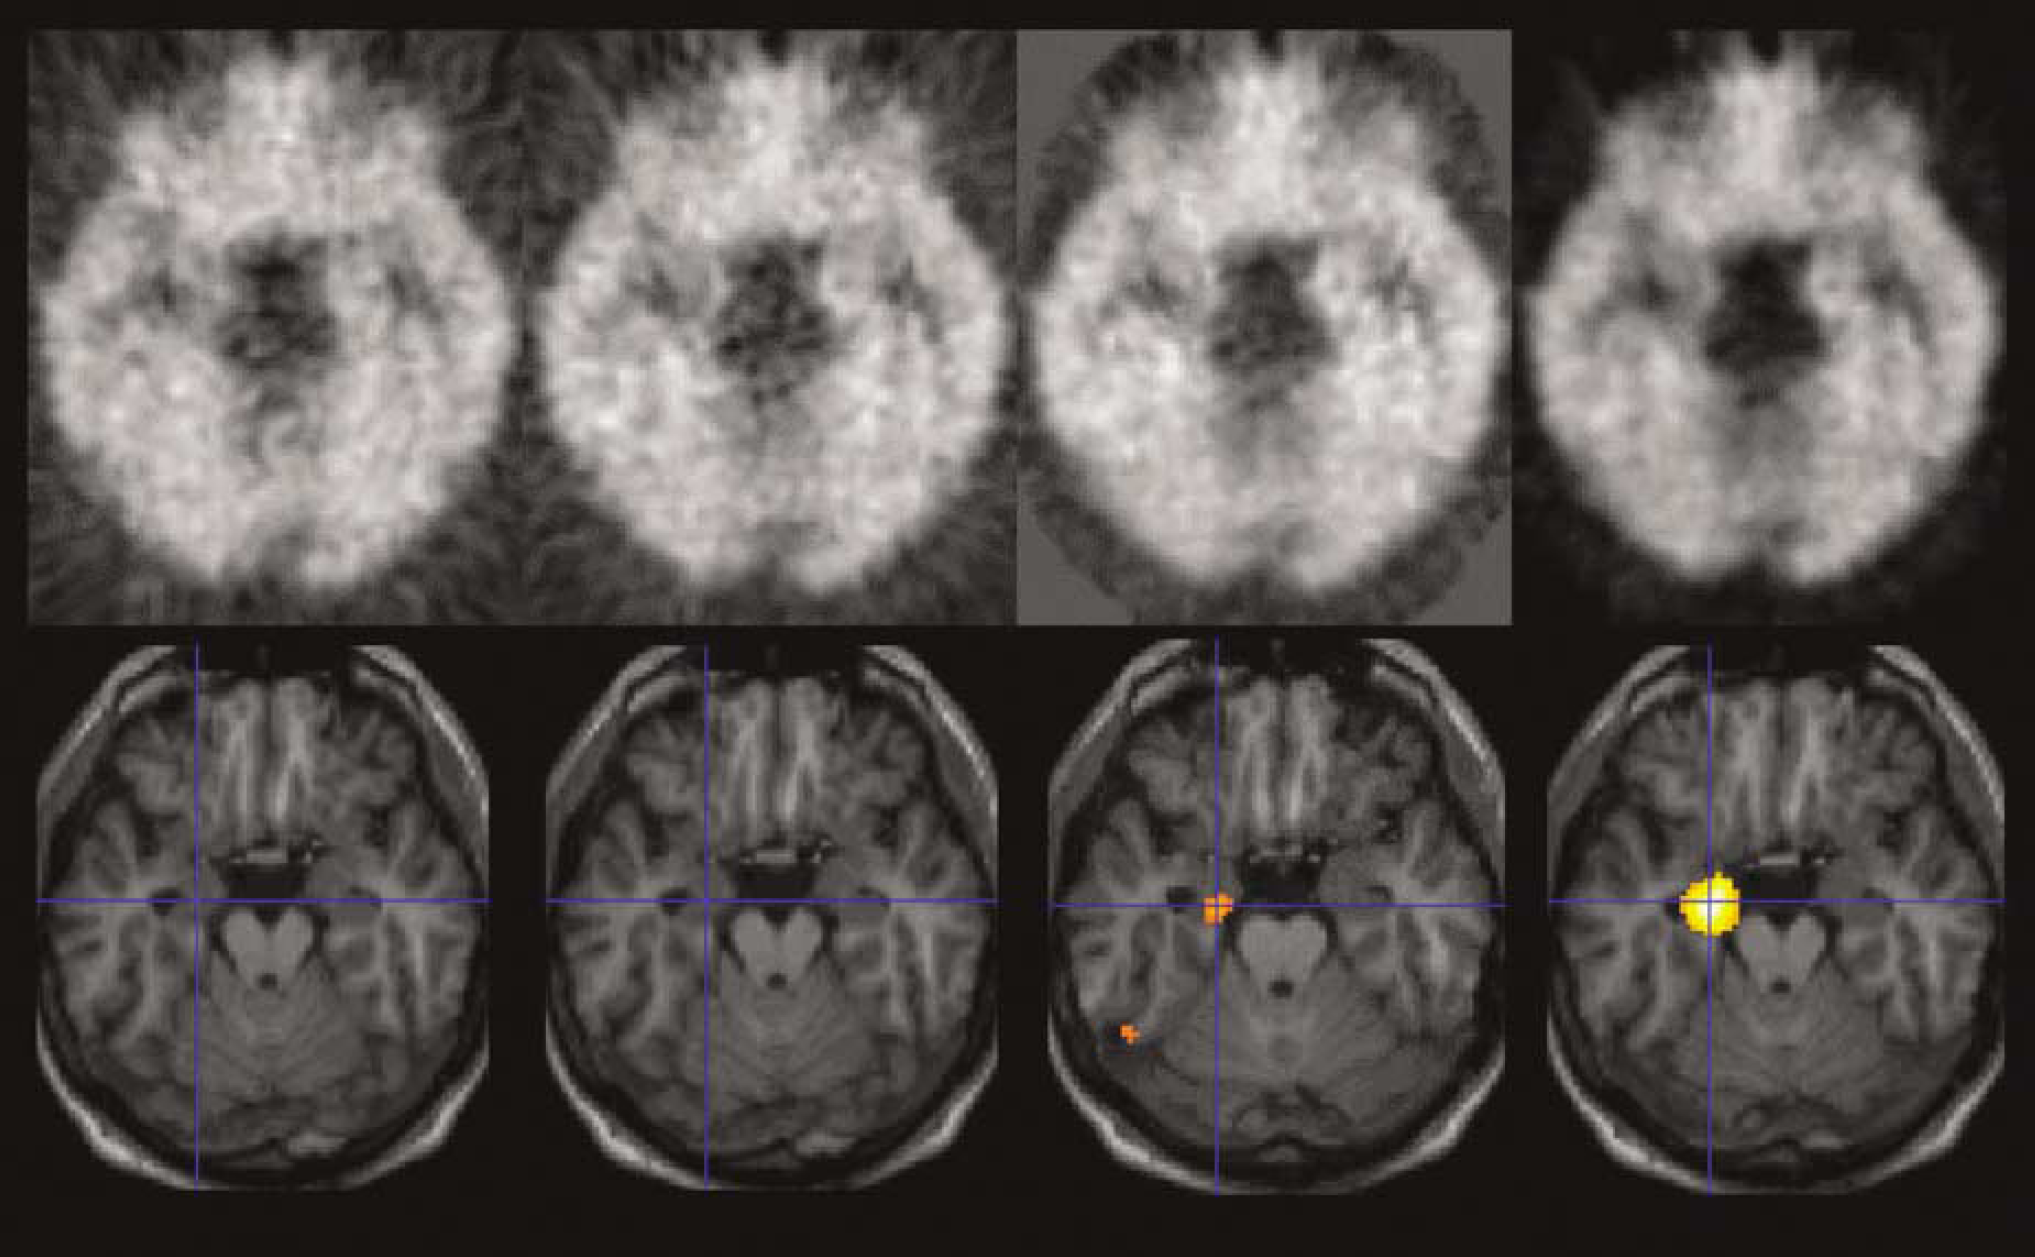
Patient no. 11. Comparison of results: ADD1020 images (first column), ADD2040 images (second column), BP-SRTM images (third column), VD images (last column). Top, PET images; bottom, results of the statistical comparison of patient no. 11's images with 13 controls overlaid onto his own normalized MRI. No statistical difference emerges for the ADD1020 image and ADD2040 image. BP-SRTM and VD correctly identify the ipsilateral hippocampus, but with lower effect size and extent of the abnormality in the BP-SRTM analysis (Z = 3.64, k = 192 versus Z = 4.46, k = 789). Note the higher noise levels of the ADD images. BP values can be negative, explaining the more intense background for the BP image.
Individual Analyses
Controls: In the ADD1020 group, one control (no. 2) had a significant decrease in FMZ uptake in the right amygdala that was just above threshold (Z = 2.52, k = 8). Outside the temporal lobe, two controls (nos. 1 and 3) showed foci of significantly increased FMZ uptake.
In the ADD2040 group, control no. 5 showed a hippocampal decrease of FMZ uptake that was just above threshold (Z = 2.52, k = 7). Outside the temporal lobe, the same two controls as in the ADD1020 group showed increases in similar locations.
In the BP-SRTM group, one control (no. 12) showed a bilateral hippocampal decrease of FMZ-BP (Z = 2.88 and 2.86, respectively); this was felt to be due to unusually large temporal horns. Outside the temporal lobe, three controls (nos. 3, 4, and 6) showed clusters of increased FMZ-BP, and one (no. 1) decreased FMZ-BP.
In the VD group, two controls (nos. 6 and 12) had medial temporal FMZ-VD decreases; in the left HC and the white matter of an unusually shaped parahippocampal gyrus in one (no. 6), and bilaterally just above thresholds (Z = 2.82 and 2.55) in control no. 12, as in the BP-SRTM analysis, and probably again due to this control's unusually large temporal horns. In addition, three controls (nos. 3, 4, and 9) showed significant clusters of increased FMZ-VD outside the temporal lobe, and one (no. 1) decreased FMZ-VD. Note that these extratemporal changes were seen in similar patients (and locations) as those in the BP-SRTM group.
Patients: Findings in the medial temporal lobe are summarized in Table 1. Note that no image datasets were right—left reversed for the individual analyses.
Thirteen of 15 patients showed medial temporal FMZ uptake decreases in the ADD1020 group; of these, six were bilateral (patients nos. 2, 5, 7, 8, 12, and 13). Of the six patients with bilateral FMZ uptake decreases, one (no. 5) had a smaller cluster, but with a higher Z score, on the side contralateral to electroclinical data and side of resection (Z = 3.42, k = 67 versus Z = 3.23, k = 286). Two patients had no medial temporal FMZ uptake decreases (nos. 10 and 11). Outside the medial temporal lobe, five patients showed FMZ uptake increases and six had decreases.
Clinical and imaging data in 15 patients with HS
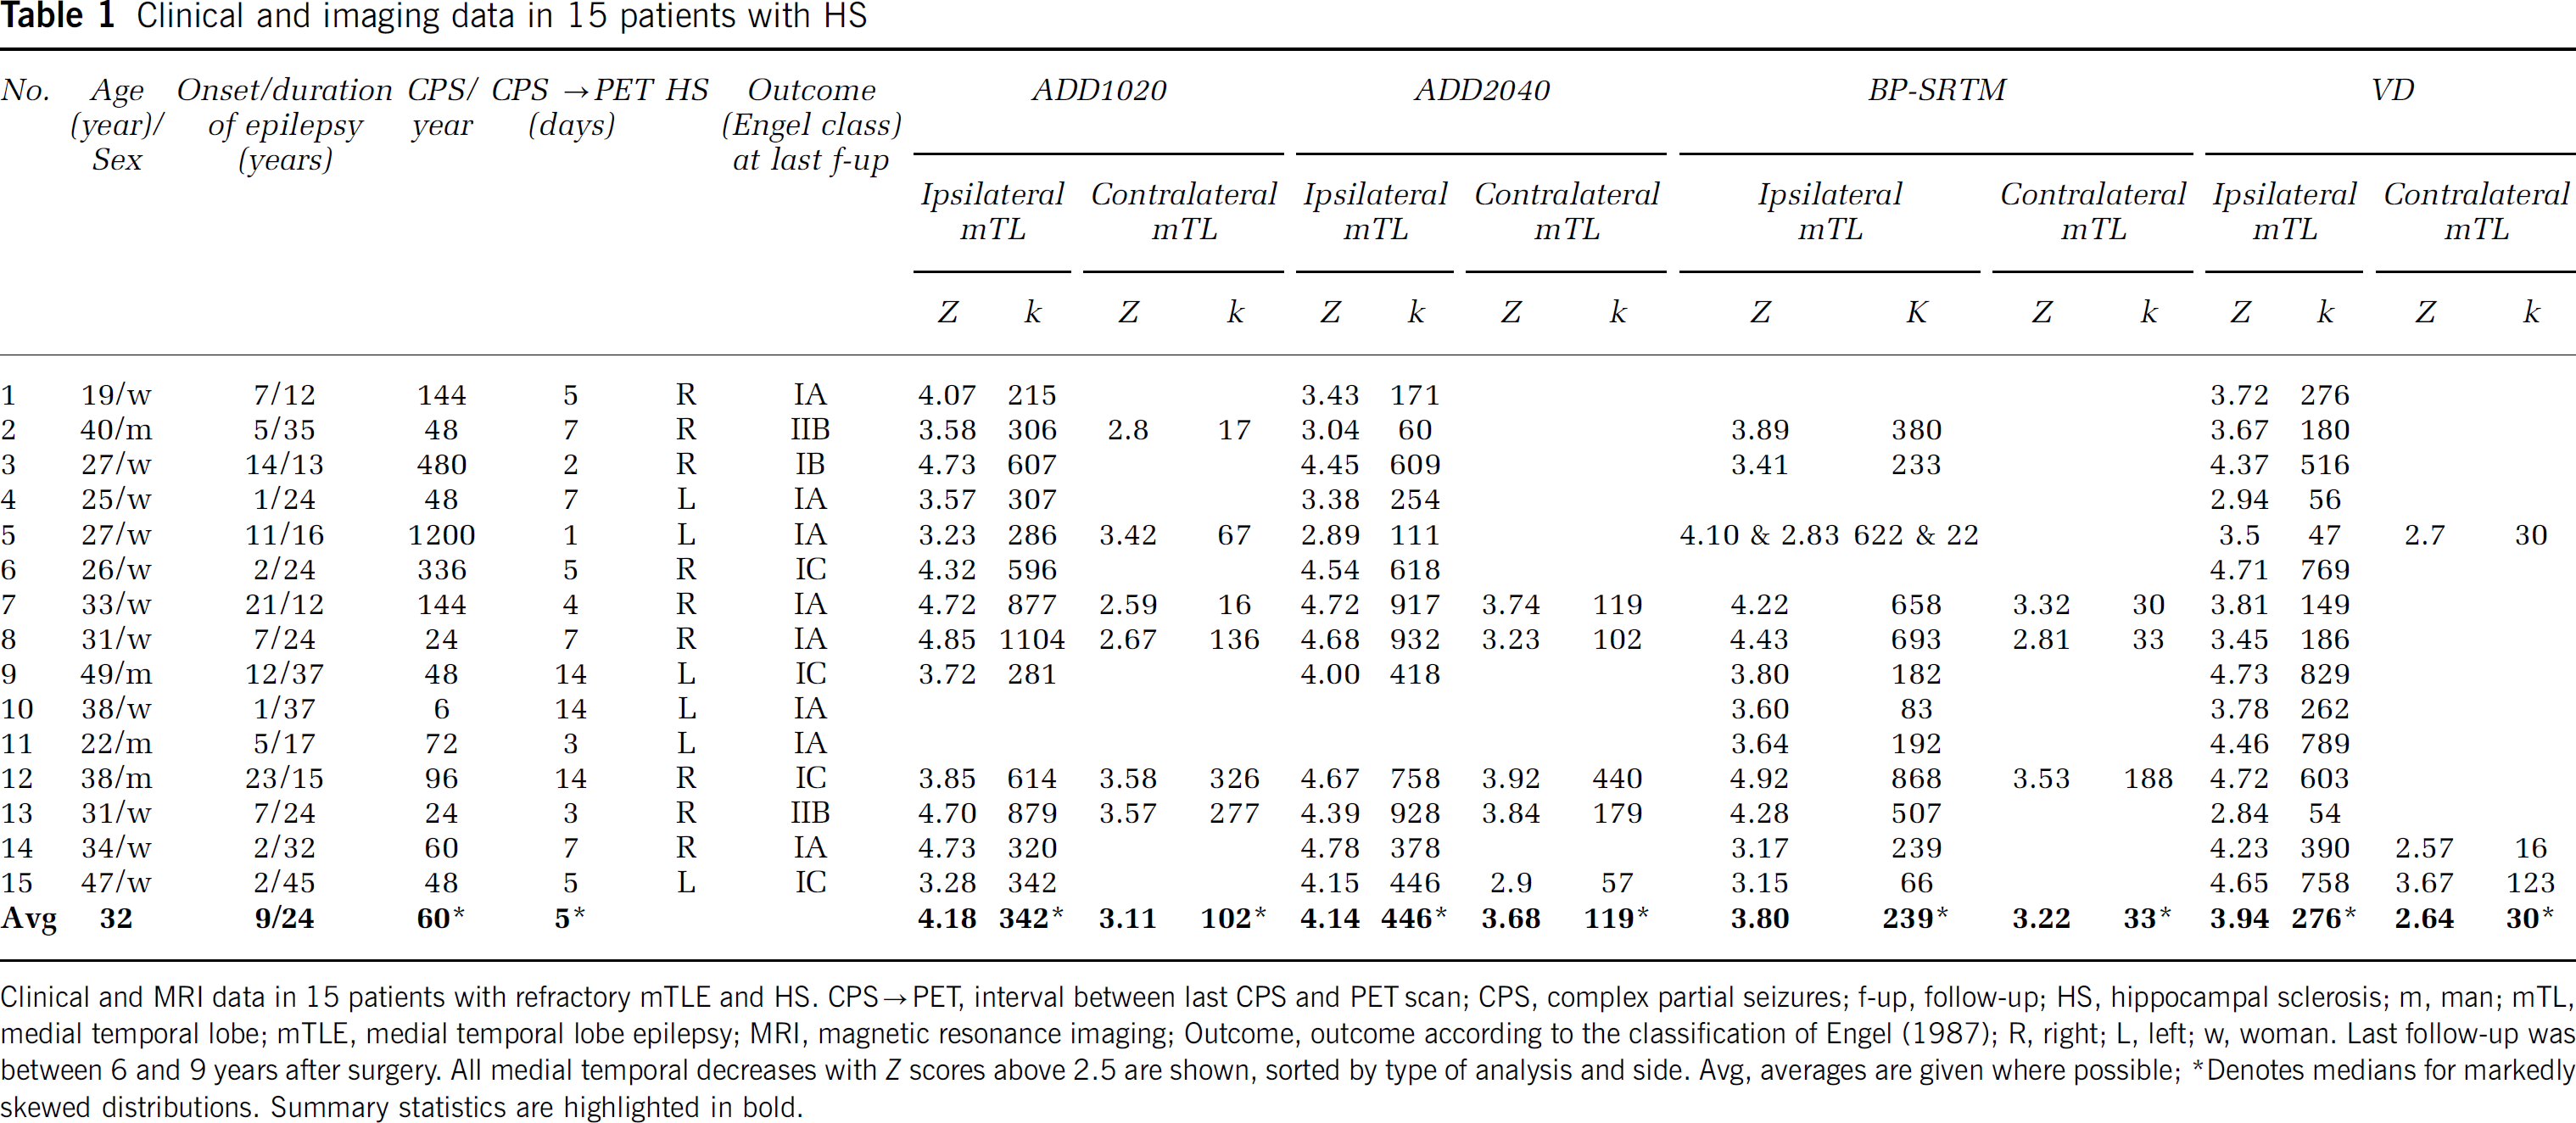
Clinical and MRI data in 15 patients with refractory mTLE and HS. CPS→PET, interval between last CPS and PET scan; CPS, complex partial seizures; f-up, follow-up; HS, hippocampal sclerosis; m, man; mTL, medial temporal lobe; mTLE, medial temporal lobe epilepsy; MRI, magnetic resonance imaging; Outcome, outcome according to the classification of Engel (1987); R, right; L, left; w, woman. Last follow-up was between 6 and 9 years after surgery. All medial temporal decreases with Z scores above 2.5 are shown, sorted by type of analysis and side. Avg, averages are given where possible
Denotes medians for markedly skewed distributions. Summary statistics are highlighted in bold.
The same 13/15 patients showed medial temporal FMZ uptake decreases in the ADD2040 group, that is patients nos. 10 and 11 did not show medial temporal decreases. Bilateral FMZ uptake decreases occurred in five patients (nos. 7, 8, 12, 13, and 15). Outside the medial temporal lobe, five patients showed FMZ uptake increases and seven had decreases.
In the BP-SRTM group, 12/15 showed medial temporal FMZ-BP decreases; of these, three were bilateral (nos. 7, 8, and 12). Outside the medial temporal lobe, three patients showed FMZ-BP increases and four had FMZ-BP decreases.
Only in the VD group did all 15 patients show medial temporal FMZ-VD decreases ipsilateral to the operated side. Three (nos. 5, 14, and 15) had bilateral decreases. Outside the medial temporal lobe, two patients showed FMZ-VD increases and three had FMZ-VD decreases.
The divergent findings in patient no. 11 are illustrated in Figure 2.
Discussion
The main finding of this comparison is an 80% to 87% sensitivity for ipsilateral decreases in [11C]FMZ uptake in patients with histologically confirmed HS when preoperative dynamic FMZ PET scans are analyzed as summed (static) images or with an internal reference (BP-SRTM images), compared with 100% when quantified as VDs with kinetic modeling and an arterial input function.
Methodological Considerations
Our study is the first to systematically examine diagnostic yields, and to allow a direct comparison of methods. Many factors affect reported detection rates, most notably statistical thresholds and ROI definition and number. For example, using ADD2040 images and ∼500 small ROIs per subject, asymmetries > 2 s.d. greater than those observed in controls were detected in 30/30 HS cases in an earlier study (Ryvlin et al, 1998) as well as in six of seven with normal MRI; however, of the latter, two were falsely lateralized. A study using BP-SRTM images (with the entire brainstem as the reference region) detected > 2 s.d. decreases of BP in all nine patients with hippocampal atrophy and/or sclerosis on MRI (bilateral in all but significantly asymmetrical in eight), and identified bilateral > 2 s.d. decreases of BP in four of seven cases with normal MRI (Lamusuo et al, 2000). We aimed for a direct methods comparison and did not systematically modify filter sizes or threshold definitions. Although it is conceivable that there exists a combination of filter and threshold that raises absolute sensitivity to 100% for all analysis methods for this particular dataset, this cannot explain the differential sensitivity of the four methods investigated here.
Global average values in all subjects for all methods
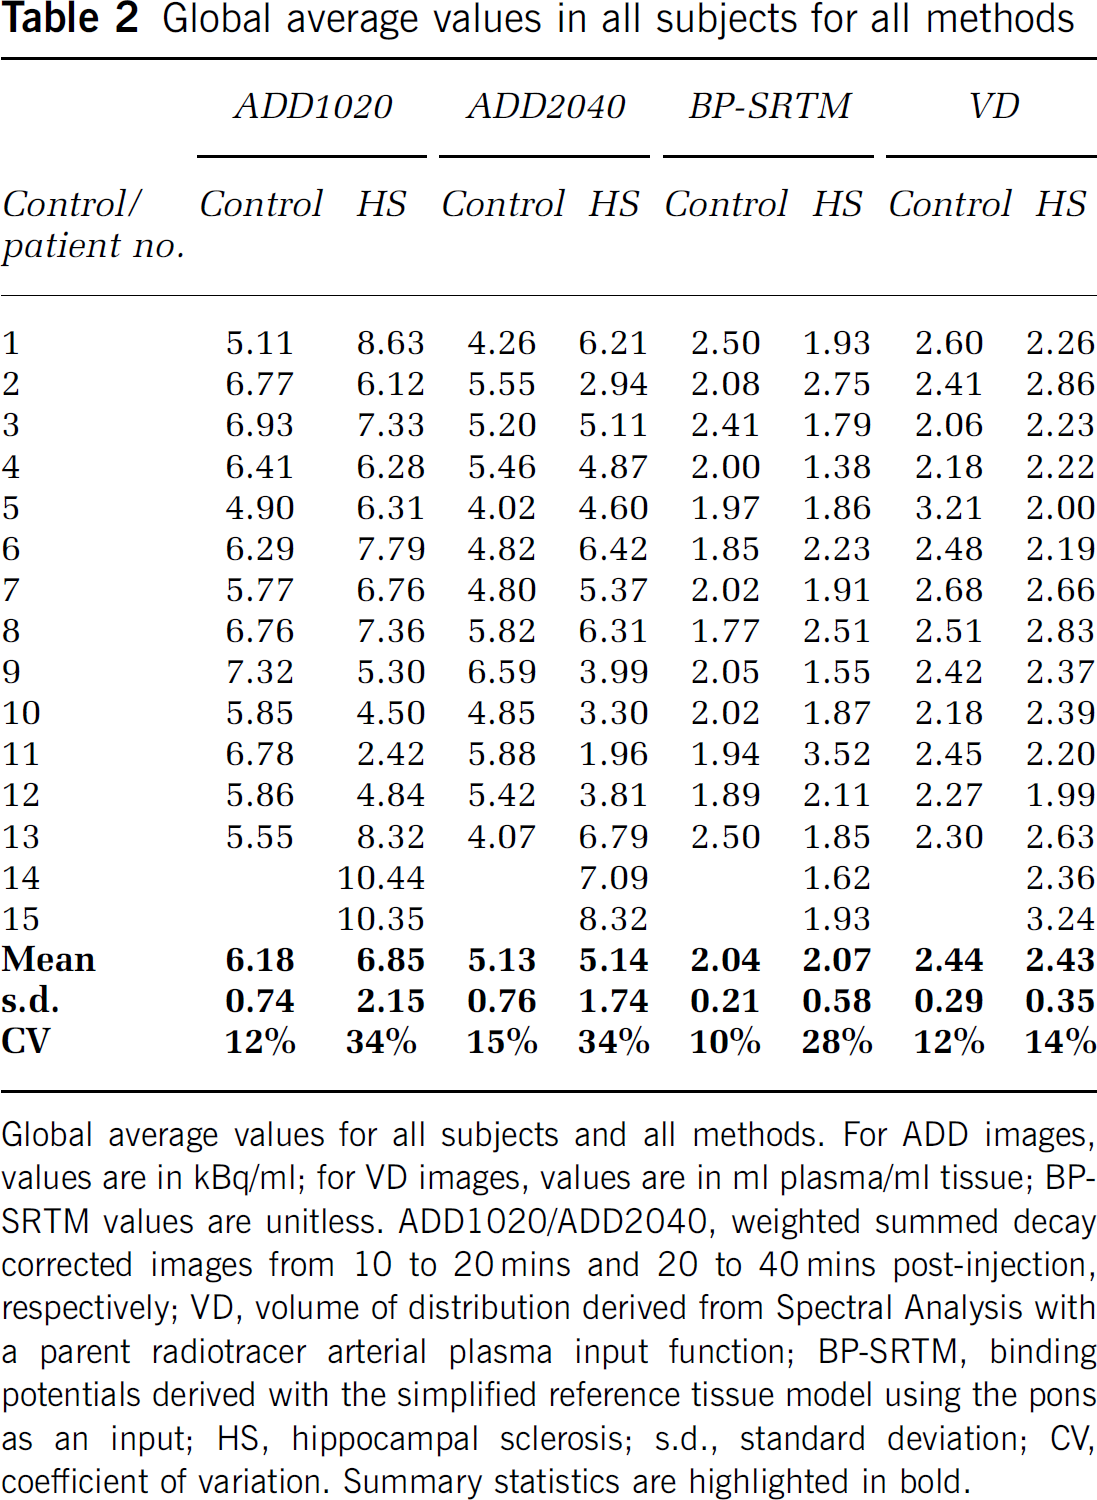
Global average values for all subjects and all methods. For ADD images, values are in kBq/ml; for VD images, values are in ml plasma/ml tissue; BP-SRTM values are unitless. ADD1020/ADD2040, weighted summed decay corrected images from 10 to 20 mins and 20 to 40 mins post-Injection, respectively; VD, volume of distribution derived from Spectral Analysis with a parent radiotracer arterial plasma Input function; BP-SRTM, binding potentials derived with the simplified reference tissue model using the pons as an input; HS, hippocampal sclerosis; s.d., standard deviation; CV, coefficient of variation. Summary statistics are highlighted In bold.
In contrast to us, some researchers have found correlations of measures of FMZ binding with clinical variables. We chose not to covary the data with clinical parameters, because our objective was to identify differential sensitivity of the VD, BP-STRM, ADD1020, and ADD2040 analysis approaches. Clinical covariates are constant for a given patient, and the application of such a linear filter should not affect relative sensitivity in the analysis of individual patients against controls.
ADD images are dependent on variables such as injected dose and weight and, to a lesser degree, peripheral clearance (e.g., metabolism) whereas this is not the case for VD estimations. These factors will have a global influence on tissue signal. This may explain the substantially higher variation in global values in HS patients compared with controls in both ADD image groups (which was also seen in the BP group), but not in the VD group. Global differences between the group means, however, were not found, and in this study we removed global effects with the use of an analysis of covariance correcting for global mean. Our ADD image analysis is, therefore, comparable to ‘standard uptake value’ analyses where the confounding effects of body weight and injected dose are globally removed.
Using an internal image reference (as for the BP-SRTM images) should remove much of the variance in variables of no interest such as dose, weight, and peripheral clearance. Somewhat surprisingly, however, the variation in global values in HS patients was again much higher than in controls. Possible explanations include the fact that the pons is demonstrably not free of receptors (Delforge et al, 1995) and therefore suboptimal for use as a reference region. Furthermore, central nervous system penetrating substances such as antiepileptic drugs could conceivably influence nonspecific binding which, in the case of FMZ, constitutes a small part of VD but could represent a large fraction of the signal in the pons.
Our results in healthy volunteers are congruent with the low interindividual variability in ligand transport (incorporated to a degree in the ADD1020 images) and parametric measures (represented here by BP and VD, and to an extent reflected in the ADD2040 images), which have been reported previously (e.g., (Frey et al, 1991)). The much larger between-subject variability (CV) in the patients is remarkable and was seen in both ADD image time windows, and to a slightly lesser degree in BP-SRTM images. Of note is that the variability (CV) in the VD images of the patients and controls was comparable. This suggests that factors which are removed from the parametric VD images account for much of the higher variability in ADD images, namely delivery, blood flow, and metabolism (van Rij et al, 2005), rather than receptor number or affinity. The comparison of parametric images of RI values (ratio of the delivery in the tissue ROI compared with that in the reference region, dominated by blood flow (Gunn et al, 1997)), further supports this view: As would be expected from the above, while the means of global average RI values were identical, their CV in patients was nearly four times higher than in controls (15% versus 4%), indicating much greater heterogeneity of blood flow and/or tracer delivery between subjects in patients.
Why are yield and accuracy greater for VD images, despite the linear correlations between parametric maps and BP or ADD images seen in previous studies? There are likely to be two main reasons: first, while linear correlations were seen, the intercepts were far from 0 and the slopes far from unity (Millet et al, 1995; Mishina et al, 2000; Okazawa et al, 2004). Second, while intrasubject correlations are strong, often above r = 0.95 (as would be expected), the intersubject slopes and intercepts are markedly different even in healthy volunteers of the same sex (Table 2 in (Millet et al, 1995)). Group studies, or the clinically more relevant studies of single patients versus groups of controls, may therefore lose sensitivity, again in agreement with our experimental results.
Two previous FMZ PET studies have investigated VD and ADD image correlations in patients. As would be predicted from the linear intrasubject correlations, the size and overlap of asymmetries in patients were similar for ADD1020 images and VD images in one study of seven children with extratemporal epilepsy after ad hoc adjusting the thresholds for abnormalities (Niimura et al, 1999). As the ADD1020 interval was chosen, the abnormalities found were more closely related to those seen on parametric K1 images than VD images (Figure 1 in Niimura et al, 1999). The diagnostic yield compared with electroclinical data was not reported. A study of patients with vascular disease showed strong correlations between two ratios, firstly a ratio between a circular ROI placed directly into the core of a focus of low intensity on a standard uptake value image and normalized by ROI values from high signal regions chosen on the same PET image, and secondly a ratio derived in the same way from parametric two-compartment DV images (Tsukamoto et al, 2004). Again, this can be traced back to the strong intrasubject correlations.
We could only compare quantification strategies that can be pursued with single-bolus tracer dose injections, which excludes methods that require different acquisition techniques, such as the partial saturation method (Delforge et al, 1997) or equilibrium methods (Szelies et al, 2000).
Binding potential images in our hands were less sensitive to detect HS than VD images. We did not systematically investigate the influence of the reference region ROI placement in the pons; other groups quantifying flumazenil using reference regions have used either much smaller circular ROIs within the pons (Bouvard et al, 2005) or much bigger ROIs encompassing the entire brainstem (Lamusuo et al, 2000). The low CV for BP-SRTM images in controls, comparable to VD images, however, suggests that the higher variance overall in patients and the lower clinical sensitivity of BP-SRTM images are real.
Neurobiological Considerations
Among the four methods examined here, there is progression in the time frame analyzed, from 10 mins soon after injection (ADD1020) over 20 mins in the next interval (ADD2040) to BP-SRTM and VD; the latter two taking the full 90 mins time course of the signal into account. Blood flow influences signal more in earlier time frames, and may be reduced in the medial temporal lobe in HS. Such a nonspecific abnormality might account for the finding of larger clusters with methods based on earlier time frames (see Table 1: median ipsilateral cluster sizes 342 voxels for ADD1020 and 446 for ADD2040, versus 239 for BP-SRTM and 276 for VD), as well as for the reduced prevalence of bilateral changes in the BP-SRTM and VD group.
Clinical Considerations
The group results show a major increase in effect sizes from ADD1020 over BP-SRTM and ADD2040 to VD. The individual analysis confirms a higher sensitivity of the VD images, with all 15 HS cases correctly identified.
Assuming that our patients really represent unilateral cases, the specificity is higher in the VD group and the BP-SRTM group, as fewer contralateral changes were seen. In addition, two of the three contralateral VD decreases and one of the two BP decreases were just above threshold, and all were clearly smaller than their ipsilateral counterparts. This is in contrast to the ADD image groups, where such contralateral decreases (Table 1) could be much more similar in terms of spatial extent (e.g., ADD2040, no. 12) or Z scores (e.g., ADD1020, no. 12, or ADD1020, no. 5, where the contralateral Z score actually exceeded the ipsilateral one). This might conceivably lead to false lateralizations or lack of detection of abnormalities if measures of asymmetry were used, as has indeed been found in three patients with unremarkable MRI analyzed using ADD2040 images (Ryvlin et al, 1999).
Volume-of-distribution images require an arterial input function. This entails a significant investment in sophisticated measurement equipment as well as quality assurance programs. In addition, cannulating a radial artery requires an average of approximately 20 mins of skilled operator time, and, even though complications in these nonvascular patients are excessively rare, the requirement for arterial lines reduces acceptability for routine procedures. This extra effort needs to be weighed against the diagnostic yield for ADD images that was already 13/15 or 87% in this study.
In some cases it may not be possible to obtain full quantification; an example would be difficulties in accessing arteries in small children. In such cases, a lower diagnostic yield may be acceptable if the alternative is not to benefit from FMZ PET. In addition, while intrasubject analyses with measures of asymmetry are sensitive to unexpected increases and will not allow to detect bilateral decreases, they too may represent a viable compromise in situations where full quantitation is unattainable.
Similar methodological studies are in hand to formally investigate yields in the clinically much more challenging group of TLE patients with normal high quality MRI studies. The rationale for performing [11C]FMZ PET studies in ‘MRI-negative’ patients is the loss of FMZ uptake over and above volume loss of the hippocampus (Hammers et al, 2002; Henry et al, 1993; Koepp et al, 1997a, 2000; Lamusuo et al, 2000; Ryvlin et al, 1998; Szelies et al, 2000). The failure of the non-VD image techniques to detect 100% of our MRI-positive HS cases, however, and in particular the danger of false lateralizations with the ADD images make it unlikely that these techniques will gain widespread acceptance in MRI-negative patients.
Footnotes
Acknowledgements
This work was performed during grant funding from the Medical Research Council to Drs Koepp and Hammers (G9901497; G108/585). We thank our colleagues at the MRC Cyclotron Building for help in the acquisition and analysis of PET data; our colleagues at the National Hospital for Neurology and Neurosurgery, Queen Square, for referring patients and for performing the surgical resections, and our colleagues at the National Society for Epilepsy for performing and transferring the MRI scans.