
Abstract
Dopamine receptor density is believed to decline in normal aging. To test this hypothesis, we measured the density of dopamine D2-like receptors in vivo in the neostriatum of normal living humans by using the graphical method. This method determines the D2-like dopamine receptor density in the human brain with an occupying ligand (unlabeled haloperidol) and a radioligand (labeled 3-N-methylspiperone). The method was examined critically, and the assumptions underlying the method were shown to be valid. The validation included comparison of the representation of tracer metabolism by high-pressure liquid chromatography and model assays, calculation of the lumped constant Dw from the value of its components, and comparable tracer partition coefficients in vitro and in vivo. In error analysis, the method consistently performed as well as the direct least-squares regression at statistical noise levels appropriate for the tomograph used in these studies. The method revealed that the density of the D2-like receptors that bind haloperidol in the caudate nucleus of normal humans declined 1% per year after the age of 18 years.
In 1986 we reported a twofold elevation of the haloperidol receptor density (Bmax) assumed to reflect D2-like dopamine receptors in the caudate nucleus of 10 patients with untreated schizophrenia compared with age-matched normal volunteers (Wong et al., 1986c). The method used to obtain this result was a determination of the accumulation of [11C]N-methylspiperone (NMSP) in the brain before and after the administration of a dose of haloperidol sufficient to block most of the NMSP binding to D2-like dopamine receptors (Wong et al., 1986a, b ; Gjedde et al., 1987). The binding constants were determined by graphical analysis of the NMSP binding (Gjedde, 1981, 1982; Gjedde et al., 1986; Patlak et al., 1983; Patlak and Blasberg, 1985). Since 1986 this technique has been extended to patients with neuropsychiatric disorders, including schizophrenia; late-onset schizophrenia; bipolar illness; and Rett, Lesch-Nyhan, and Gilles de la Tourette syndromes (Singer et al., 1992; Wong et al., 1986c; Pearlson et al., 1993; Tune et al., 1993).
Before its numerous applications, the method was not subjected to complete evaluation of its underlying assumptions, a concern raised by discrepancies in published reports of the density of dopamine D2-like receptors in schizophrenia (Farde et al., 1987, 1990; Andreasen et al., 1988). In this report, we briefly review the theory of the graphical method and the assumptions underlying it, introduce minor changes to the method, and test and validate its most important assumptions. Finally, we report the change in the density (Bmax) of D2-like dopamine receptors in the caudate nucleus with age, yielded by this graphical method. The method has three steps: (1) determination of the rate of binding of a radioligand in the absence and presence of a partially saturating concentration of an unlabeled ligand, (2) determination of the steady-state concentration of the unlabeled ligand, and (3) calculation of the density (Bmax) of the receptors of the tissue from the results of steps 1 and 2.
THEORY
The purpose of the theory section is to review the computational principles that permit us to determine the Bmax from the binding of a radioligand that does not reach equilibrium. There are four parts: first, the definition of the rate constants; second, the derivation of the Woolf–Hanes Plot and the binding equation on which the plot is based; third, the derivation of Bmax; and fourth, the methods for estimation of the binding constant k3 from this equation.
Definition of compartmental constants
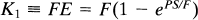
The compartmental model is detailed in Fig. 1. The primary binding parameters are defined as follows. The term KI is the rate of the clearance of the ligand from the circulation, equal to the product of the extraction fraction and the flow rate of the compartment in blood that contains the tracer (Crone, 1963):
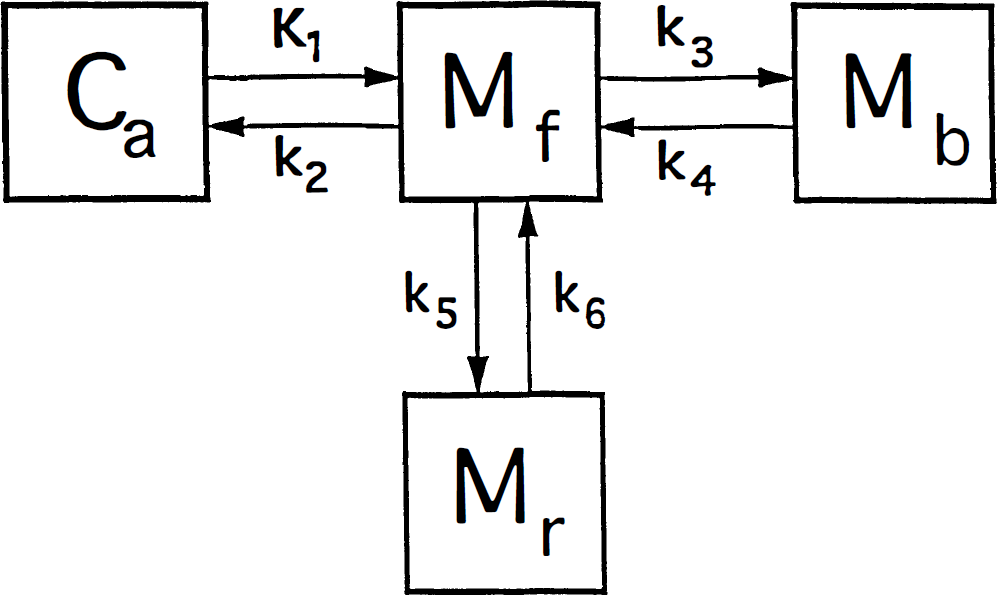
The brain uptake of [11C]NMSP occurs as follows: The ligand first crosses the blood–brain barrier (capillary endothelium) and later binds to the receptors of interest in the region (e.g., D2 dopamine), as well as to other possible sites. Ca is the concentration of the ligand in arterial plasma, Mf+r is the quantity of drug in the exchangeable pool of tissue, Mb is the quantity of drug bound to the receptors of interest (e.g., D2-like dopamine receptors), and Mr is the quantity of drug bound to other secondary or non-D2 dopamine receptors. There are four compartments, but the compartments of Mf+r and M r (by definition) equilibrate rapidly to form one effective compartment. [We chose the convention of “quantity” (denoted by M) to be distinguished from “concentration” (denoted by C) because true concentrations are unknown for the various cellular and extracellular compartments lumped by the method of external counting.]
where PS is the product of the blood–brain barrier permeability of the ligand and the endothelial diffusion area, E the extraction fraction of the unidirectional transfer, and F the tracer source fluid (blood plasma) flow rate per unit volume of the brain region of interest.
The term k2 is the fractional clearance of the ligand from the region of interest to the perfusing fluid:

where Ve is the partition volume of the ligand in the tissue, relative to the perfusing fluid (ml g–1).
The term k3 is the rate constant for the association of the ligand receptors of interest in the region, equal to the product of the bimolecular association constant and quantity of receptor sites:
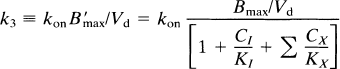
where kon is the bimolecular association constant, B′max the quantity of receptor sites available for binding, and Vd the physical distribution volume of the ligand. Also, CI and KI are the steady-state concentration and inhibition constants of a known inhibitor of the receptors (e.g., haloperidol), but Cx and Kx the concentration and inhibition constants of other, unknown or unmeasured, ligands of the receptor, including the endogenous neurotransmitter. The term B′max represents the number of unoccupied receptors; Bmax is the total number of receptors, some of which may be blocked by endogenous ligand or neuroleptic drugs or both. The constant k3 describes the turnover of a labeled tracer of negligible mass (e.g., NMSP) that binds to receptors already occupied by an unlabeled inhibitor at different known concentrations (including zero). The binding of the inhibitor must approach transient equilibrium (constant ratio between bound and free ligand) for the steady-state solution of the Woolf-Hanes plot to apply. A suitable unlabeled inhibitor is haloperidol, a reversibly binding ligand of the D2-like dopamine receptors.
The term k4 represents the rate of dissociation from the receptor, which takes into account both the molecular dissociation rate and the number of available receptors when the number of occupied receptors is significant:
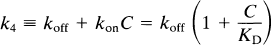
where koff is the molecular dissociation rate, C the concentration of unbound (“free”) ligand, and KD the dissociation constant, equal to the ratio between koff and kon. The equation is valid only when C is negligible relative to KD, as it is for a tracer, or when C is constant. In Fig. 1, k5 and k6 similarly represent the binding to and from secondary additional and reversible binding. The reader is referred to the glossary of terms in the Appendix for a summary and typical units.
Steady-state binding equation
To define k3, we made use of a steady-state solution to the binding Eq. 18. The Woolf–Hanes plot in Fig. 2 is a linearization of the ratio between the constants k3 and k4, as defined above. The Woolf–Hanes plot is a rearrangement of the Michaelis–Menten equation, applied to the steady-state binding of a ligand, attributed to Woolf by Cressie and Keightly (1981). With competition among several ligands, according to Dixon (1953), the Woolf–Hanes equation for steady-state binding is
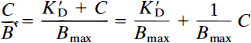
Woolf-Hanes plot, schematic representation. Modified from the relationship between the reciprocal of the binding potential (k4/k3) on the ordinate axis and the independent variable C, the concentration of the inhibiting substance (e.g., haloperidol). When rearranged for k4 = k′off, the operational plot consists of the ordinate as a reciprocal of k3 and the abscissa as the brain concentration of haloperidol CH. For multiple points on the plot, the slope is the reciprocal of k′offBmax, and the abscissa intercept is K′1Vd.
where K′D is the apparent Michaelis half-saturation concentration of the ligand in the presence of competing ligands at steady-state, C is the ligand concentration, Bmax is the receptor density, and B is the quantity of bound ligand. In the presence of other inhibitors, K′D is
where KD is the koff/kon ratio.
The left-hand of Eq. 5, C/B, is the steady-state ratio between free and bound ligand. According to Eqs. 3 and 4, this ratio is proportional in kinetic terms to the k4/k3 ratio in an in vivo binding experiment (Gjedde et al., 1986). The proportionality factor is the physical distribution volume Vd of the unbound ligand
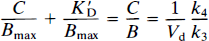
where Vd is equal to 1/f2, the reciprocal of the free “fraction” f2 of the tracer in brain tissue. The slope of the linear relationship between the free/bound ligand ratio and the independent variable C is 1/Bmax, the ordinate intercept is K′D/Bmax, and the abscissa intercept is –K′D. Thus, when divided by k4/Vd = koff/Vd, (for C ≪ KD, when the specific activity of the tracer is high) this equation yields
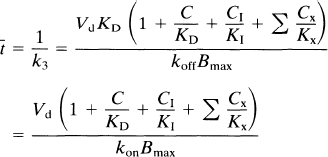
where the time constant of binding t̅ is defined as the reciprocal of k3. Equation 8 describes the magnitude of a constant t̅ and is valid only when the component terms are themselves constant. When this is the case, Eq. 8 is a valid expression of t̅ for all situations, including nonsteady states.
The inhibiting substance used in a PET study can either be the radioligand itself, such as one with a low specific activity (e.g., NMSP), or it can be a different inhibitor (e.g., haloperidol). When C/KD is negligible compared with CI/KI (typically when the tracer concentration C is less than the inhibitor concentration CI, as KI is often of the same order as KD); and when KI (1 + Σ CX/KX) is replaced by K′I, the IC50 of the inhibitor, t̅ reduces to
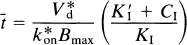
where CI is the inhibitor concentration of brain tissue water, KI is the inhibition constant of the unlabelled competitor, K′I is the IC50 of the inhibitor in the presence of the radioligand (see below), and k*on is the association constant of the radioligand (e.g., NMSP). The addition of the asterisks identifies NMSP as distinct from other ligands (e.g., haloperidol). The graphical representation of this equation is shown in Fig. 2, the Woolf–Hanes plot.
Derivation of Bmax expression
When saturation is negligible (CI ∼ 0), t̅. reduces to t̅0,
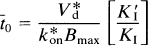
where V*d is the Vd of the radioligand, to distinguish it from the Vd of other ligands. The combination of Eqs. 9 and 10 yields,
The steady-state aqueous inhibitor concentration CI can be replaced by the blood plasma inhibitor (CH) such that CH c= CI/f1, where f1 is the plasma-free fraction of the inhibitor,
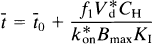
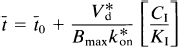
This equation describes the linear relationship between t̅ and CH by the slope, (V*df1)/(k*onKIBmax), and the y-intercept t̅o. The x-intercept is the y-intercept divided by the slope, or K′I/f1. The equation was solved for the D2-like dopamine receptor density Bmax by rearranging Eq. 12 (Wong et al., 1986c),
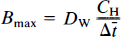
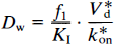
where Δt̅ is the difference t̅ − t̅o between the time constants of binding in the presence and absence of a partially saturating ligand; CH is the inhibitor plasma concentration; Dw is a coefficient equal to the ratio between V*df1, previously termed λ; and k*onKI, previously termed k′off in Wong et al. (1986b),
Equation 13 expresses the fundamental proportionality between the increase of the time constant of binding and the steady-state plasma concentration of a competitive inhibitor.
The product V*df1 has the unit of partition volume, ml g–1 or ml cm–3. In Wong et al. (1986a), this product was symbolized by λ on the assumption that Vd = V*d and f1 = f*1 for two closely related molecules (haloperidol and spiroperidol). The apparent partition volume may reflect additional nonspecific or low-affinity, rapidly reversible binding, described by the term ρ, which represents the k5/k6 ratio in the model shown in Fig. 1. Thus, the factor (1 + ρ) accounts for the regional variation of the distribution volume created by nonspecific or low-affinity binding sites. In the present study, we test the hypothesis that Vd = V*d and f1 = f*1 by measuring the partition coefficients and protein binding fractions of NMSP and haloperidol in vitro in tissue with no binding (p = 0) and, for haloperidol, in vivo in a region with reversible nonspecific binding (ρ > 0). If Vd ≠ V*d or f1 ≠ f*1 or both, justification for the use of the symbol A for the product V*df1 disappears. Instead, we will use the symbol Ve for the product Vdf1 (i.e., f*1V*d).
Non-steady-state binding equation
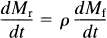
To measure k3 and t̅, we make use of non-steady-state solutions to the familiar binding equation, to which Eq. 5 is a steady-state solution. The binding equation describes the change of bound radioligand as a function of the number of receptor sites in the compartmental model (illustrated in Fig. 1). In this model, by definition, the compartments Mr and Mf are related by the equation for transient equilibrium,
1
By integration of Eq. 15, it is established that the two compartments form a single pool, represented by the term Mf+r,

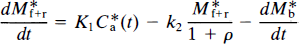
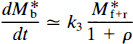
The change of bound tracer molecules over time is then (Gjedde et al., 1986; Wong et al., 1986a),
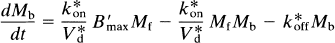
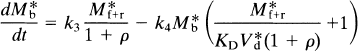
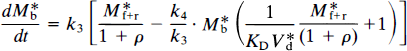
or, from Eq. 16,
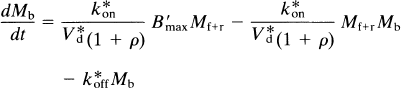
where Mb is the mass of tracer bound to the receptors, Mf+r is the mass of unbound tracer, k*on is the bimolecular association constant, Bmax is the density of receptor sites available for binding, V*d is the volume of distribution of the ligand relative to water, and k*off is the dissociation rate of the radioligand from the receptor sites. In the case of a radioactive tracer with the specific activity As, Eq. 18 is modified to
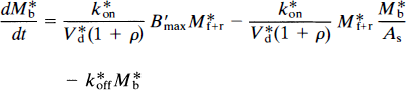
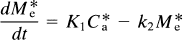
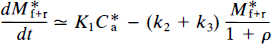
where the asterisk now also refers to the units of radioactivity per unit tissue volume or wet weight (e.g., M*b). The change in the concentration of unbound tracer with time is
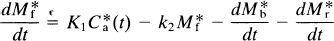
where K1 is the rate of clearance of the ligand from the circulation, k2 is the fractional clearance of the ligand from the region of interest to the perfusing fluid, and C*a(t) is the plasma radioactivity concentration of the radioligand as described above. At high specific activity, when C ≪ KD, Eq. 4 becomes

The number of receptor sites available for binding near saturation at steady state (B′max) depends on the concentration of the occupying ligands. If C, the concentration of the tracer, is negligible,
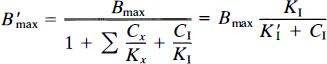
where Σ Cx/Kx is the sum of unknown competitors relative to their inhibitory constants, and K′I is the IC50 of the known saturating ligand, equal to KI(1 + Σ Cx/Kx).
The differential equations to be solved are derived from Eqs. 9 and 19 by substitution of Eqs. 21–23, yielding
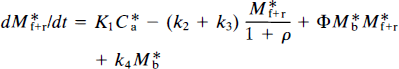
and
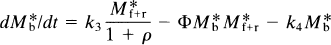
where
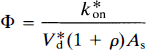
For a specific activity that is sufficiently high to reduce Φ to a negligible value, Eqs. 24 and 25 can be solved analytically. In a region of the brain where k3 and ρ both equal zero, the accumulation of radioligand can be derived from Eq. 24,
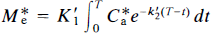
where M*e is the radioactive quantity of ligand in that region. In the subsequent analysis, the cerebellum was assumed to be a region in which k3 and ρ both equal zero because the region has no saturable binding of interest and because the nonspecific binding is at its lowest measurable level among the regions examined. Equation 25 can be rewritten
or, by rearrangement,
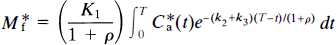
For a ligand of high specific activity where M*f+1 ≪ KDV*d and for which k4 ≪ k3 and at early times when M*b ≈ 0 (for NMSP apparently for at least 90 min following injection), the approximation for Eqs. 24 and 25 for such times is
and
The analytical solution to Eqs. 30 and 31 is
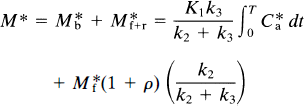
where M* is the total quantity of radioactivity in a region of brain, and where, as a solution to Eq. 30,
For k3 = 0 and ρ = 0, Eq. 33 changes to an expression valid for a region of no binding,
where K′1 and k′2 refer to the region of no binding, for example, the cerebellum.
Estimation of the combined forward rate constant k3
Equation 32 describes the accumulation of the radioligand in a region of binding. The magnitude of k3 was estimated from Eqs. 30 and 31 by two different methods: by graphical analysis, or for the purpose of validation, by direct fitting of Eqs. 30 and 31 to pairs of C*a(t) and simulated M*(t). Due to the exchange of radioligand with the binding sites and with the circulation, the free ligand ultimately reaches an approximately constant ratio between the unbound ligand in the brain and the unbound ligand in the blood. At this time, a transient equilibrium exists.
Multiple-times graphical analysis. The graphical method normalizes the radioactivity recorded in brain against the radioactivity recorded in plasma. Transient equilibrium (denoted by ∞) is the situation in which the decay of the compartment M*f is so rapid that M*f [Eq. (33)] assumes an approximately constant ratio to the plasma concentration of the tracer. When ρ is zero, this ratio is Vf, such that
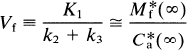
Likewise, transient equilibrium is the situation in which M*e (Eq. 34) assumes an approximately constant ratio to the plasma concentration of the radiotracer. When ρ and k3 are zero, this ratio is M*e, such that
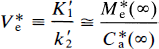
It is then assumed that V*e = K′1/K′2 = K1/K2 and used in the subsequent calculation of k3, which is estimated from Eq. 35. At transient equilibrium, the volume of distribution, V(∞), between the circulation (C*a) and the free ligand pool (M*f), that is, Eq. 32 divided by C*a, becomes
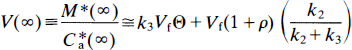
where Θ is a variable of time defined as,
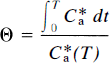
and is often referred to as the normalized integral of time. For the multiple-times graphical analysis to identify the asymptotes K1 and K = k3Vf, (referred to as α in Wong et al., 1986a), Eq. 37 was approximated by the multiple-times graphical analysis equation (Wong et al., 1986a), modified to be valid also for early times T,
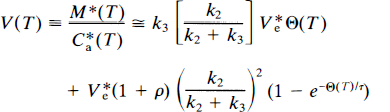
where τ = (1 + ρ)/(k2 + k3). When V*e is known, this equation has three parameters, k2, k3, and ρ. The value of V*e is obtained when k3 and ρ are zero (e.g., in cerebellum), for which the equation yields,

where τ' is 1/k′2. This equation was used to determine V*e in a nonbinding region (e.g., in the cerebellum). Unlike the conventional multiple-times graphical analysis equation, Eq. 39 was derived by Wong et al. (1986a) to accomplish constraint to a value of V*e determined in a nonbinding region and to yield an estimate of ρ to account for low specific binding.
The steps in the actual computation of k3 are given in detail in Wong et al. (1986a). Briefly, they include the following: First, nonlinear regression of the cerebellum time-activity and tracer plasma concentration curves is completed for purposes of correcting for radiolabeled metabolites in plasma. The regression yields tracer concentrations in plasma, corrected for radiolabeled metabolites. The tracer time-concentration curve in plasma forms the input function C*a. If the tracer has no radiolabeled metabolites in plasma during the positron emission tomography (PET) imaging period, or when the metabolites are corrected by high-pressure liquid chromatography (HPLC), the regression method is not used. Subsequently, regression of Eq. 40 to C*a and the cerebellar time-activity curve is used to obtain an estimate of V*e. This estimate is then applied to Eq. (39) to obtain estimates of k2, k3, and ρ from sets of V(T) and Θ(T).
Analytical analysis.
The analytical method of estimation of k3 was nonlinear regression of Eqs. 32, 33, and 34 to the data for Φ = 0.
Summary of key assumptions
The binding compartments consist of the primary specific binding site associated with k3 and k4, and a secondary compartment that possesses rapidly equilibrating nonspecific binding or low-affinity binding sites, associated with the rate constants k5 and k6 with the ratio ρ.
The specific activity (AS) of the radioligand (e.g., NMSP) is sufficiently high that the concentration of the radiotracer C ≪ KD (the dissociation constant of NMSP).
During the time of estimation of k3 (typically 90 min after injection of [11C]radioligands), the following conditions apply:
k3 ≫ k4; although k4 is not exactly zero, it is negligible for the purpose of computation of k3 (the measurement of k4 is not sufficiently accurate during the limited time of 90 min).
Mb, the bound quantity of the radiotracer, is negligible over the imaging period.
The free quantity of the radiotracer is negligible, that is, Mf ≪ KDV*d.
V*e = K′1/k2 (of cerebellum) = K1/k2 (of caudate).
Additional assumptions that relate directly to the procedure of calculating Bmax are described below. These are explicitly tested using the experimental design described in the Methods section to follow.
The radiolabelled metabolites of [11C]NMSP can be correctly identified using a model-dependent kinetic analysis. We show that they correlate well with the results of HPLC.
The lumped coefficient Dw can be calculated from experimental findings, using a procedure other than that described in Wong et al. (1986c). This calculation is based on the free fraction and partition coefficient of haloperidol such that the assumption that Vd = V*d and f1 = f*1 are tested.
The multiple-times graphical analysis for calculating k3 is an accurate substitute for the direct calculation of k3 for typical noise levels in the experimental data obtained in these studies.
METHODS
To determine Bmax, as described in Wong et al. (1986b), the following steps were taken. First, the concentration of the tracer in arterial blood was separated from the concentration of labeled metabolites. Second, estimates of k3 were obtained by nonlinear regression of the equation of the graphical plot to the time activity-curves of the regions of interest placed in the caudate nucleus and the cerebellum. Third, the estimation of k3 was repeated after a partially saturating dose of haloperidol, and Bmax was calculated according to Eq. 13, assuming a constant value of Dw. We tested the validity of all three steps.
Validation
Plasma metabolites.
To test the validity of the original method of plasma metabolite correction in humans (Wong et al., 1986a), we analyzed metabolites of [11C]NMSP by using HPLC. Blood samples were drawn from subjects at 5, 12, 20, 30, 45, and 60 min after tracer injection and centrifuged for 5 to 10 min. Intact [11C]NMSP and metabolites were then extracted from the plasma by a cyanopropylbond elution column (Analytichem International, Harbor City, CA, U.S.A.) and supported in a vac-elute 10-sample vacuum manifold. The column was activated with 1 vol of methanol and 1 vol of deionized water. The sample then was loaded into the column and washed with 1 vol of deionized water and 1 vol of 20% methanol. The sample was eluted with 1 ml of 100% methanol and collected in a tube. Filtered deionized water (1 ml) was added to the eluant, and this 50% methanol sample was then injected onto the HPLC system, consisting of a Waters pump and an Ortec radioactivity detector, connected to a radioactivity counter. The level of radioactivity was recorded every 6 s. A 4.6-mm × 15-cm LC-PCN 5 micro-column (Supelco, Inc.) and a guard column were used. The mobile phase consisted of 60% phosphate buffer (10 nM K2HPO4, pH 6.8), 30% acetonitrile, and 10% 1-propanol. The mobile phase flowed at a rate of 2 ml min–1.
Metabolite analyses were compared for eight normal volunteers, with as many as six blood samples per PET study, for a total of 64 samples from 12 studies. Each blood sample was analyzed by HPLC and compared with the result of the original model-based method of correction (Wong et al. 1986a). It included 22 samples that were obtained during post-haloperidol PET studies and 42 during pre-haloperidol PET studies.
Lumped coefficient Dw.
The binding coefficient Dw is a lumped coefficient consisting of the components given in Eq. 14. Wong et al. (1986c) estimated the value of Dw as the ratio between an assumed apparent haloperidol partition coefficient determined in vitro (λ) and the assumed apparent dissociation rate of haloperidol determined in vivo (k′off). In the present paper, we calculate the value of the lumped coefficient by determining the value of the individual components of Dw, including the free fraction of haloperidol in plasma not bound to protein.
Partition coefficients: measurements in vitro.
To determine the in vitro partition coefficients of haloperidol and NMSP, we examined the partition between rodent cerebellum tissue and phosphate-buffered saline, then between rodent cerebellum tissue and human plasma, and finally between human cerebellum tissue and human plasma.
The rodent tissue was incubated with different concentrations of the drug in both saline and plasma mediums. Different concentrations (12.5, 25, 50 mg ml–1) and incubation times (0–90 min) were evaluated to identify the optimal condition for the determination of partition coefficients in human brain tissue from autopsy.
Fresh rodent cerebellum was sectioned into 0.5-μm cubes and the sections were added to phosphate-buffered saline or human plasma to final concentrations of 12.5, 25, or 50 mg ml–1. Because haloperidol also labels sigma receptors, which are prevalent in the cerebellum, the contribution of these receptors to the binding could be considerable. To block sigma receptors, the samples were initially incubated for 40 min with 10 μM N-allylnormetazocine (SKF-10,047). Triplicate samples were agitated in a 37°C water bath for 0 to 90 min following the addition of 5 nM [3H]haloperidol or 5.2 nM [3H]NMSP. The specific activities were 0.09 μCi pmol–1. Tissue was separated from the buffer or the plasma by vacuum filtration.
Radioactivity was counted in the supernatant as well as in the filtered cerebellar tissue. The partition coefficient was calculated in two ways: either by counting the activity in the supernatant and calculating the cerebellum radioactivity by subtracting blank control filters from total radioactivity or by counting the radioactivity in both the supernatant and the filtered cerebellum. The ratio of the average of the triplicate brain (dpm g–1) to the medium radioactivity (dpm ml–1) determination was used to calculate the partition coefficient.
The result from calculating the partition coefficient by counting only the activity of the supernatant was compared with counting both the supernatant and the filtered plasma. The measurements using the former method had greater variability, and therefore, both supernatant and filtered cerebellar tissue were counted. Thus, the method of measuring the partition coefficient under the conditions of 25 mg ml–1 tissue concentration and 60-min incubation time was applied to human brain tissue at autopsy.
To allow future comparison of the brain-to-blood partition coefficient for haloperidol in patient and control groups in Wong et al. (1996), we determined the blood-to-brain partition coefficient in the cerebellum of control subjects. [18F]haloperidol with a specific activity of 1–2 μCi pmol–1 was produced by the method of Shiue et al. (1989). Cerebellum was obtained at autopsy [(from seven normal subjects (mean age 38 ± 21 years (SD), four males, three females), six schizophrenic subjects (37 ± 16 years, five males, one female, and six patients with bipolar disease (47 ± 20 years, one male, five females)] and stored at −80°C (interval from death to tissue freezing less than 24 h). The cerebellar tissue was thawed to waxy consistency and dissected into tissue prisms (0.5 mm). Tissue was suspended (25 mg ml–1) in the fresh human plasma containing a sigma-receptor blocker, d-pentazocine (50 nM). The tracer [18F]haloperidol (5 nM) was added to triplicate samples and incubated at 37°C for 60 min. Specimens were centrifuged for 5 min (Beckman microfuge), the pellet and supernatant were separated immediately, and the radioactivity was determined in the tissue and plasma.
Partition coefficients: measurements in vivo.
The partition coefficients of intact and reduced haloperidol were measured in vivo in male guinea pigs (350–399 g) anesthetized with ether. Unlabelled haloperidol was infused into the tail vein of two guinea pigs, and whole-brain and blood concentrations were determined by ultraviolet absorption. Haloperidol was infused intraperitoneally into each guinea pig using an ALZET miniosmotic pump at a rate of 1.5 mg day–1 for 2 to 3 days. Blood samples were collected by toe clip during the infusion to document that steady state had been achieved. The plasma was analyzed by HPLC electrochemical detection for intact and reduced haloperidol. The guinea pigs were sacrificed at steady state. The brain of each animal was immediately removed. The corpus striatum, cerebellum, and prefrontal cortex were separated and analyzed by HPLC electrochemical detection for intact and reduced haloperidol after solid phase extraction.
Protein binding.
The presence of plasma proteins may influence the brain-blood partitioning of haloperidol in vivo according to Eq. 14. The fractions of free [11C]NMSP and [18F]haloperidol in plasma, f*1, and f1, respectively, were measured by ultrafiltration (Amicon, Danvers, MA, U.S.A.) after spiking the patient plasma with the radioligands in concentrations similar to those reached in a PET study using [11C]NMSP (1 to 5 μCi ml–1).
Estimation of the combined forward rate constant
Simulation.
To compare how well the two methods yielded known Bmax values, we selected actual parameter estimates with which to generate time–activity curves for cerebellum and striatum by means of Eqs. 24 and 25. We analyzed the simulated time-activity curves both by the graphical method according to Eq. 39 and by direct regression of Eqs. 32 and 20. We used actual typical, metabolite-corrected plasma curves. Realistic values of Bmax and K1, k3, k3, and k4 from pre- and post-haloperidol scans were used. Twelve time points were simulated during the 0- to 90-min scans of [11C]NMSP studies, and specific levels of noise were added. Time-activity curves were subjected to nonlinear regression analysis yielding K1, k2, and k3 by (1) the graphical method, using the cerebellum to obtain the rate constants K1, k2 and using the striatum to estimate k2, k3, and ρ, with the ratio K1/k2 constrained to the value obtained in cerebellum; and (2) direct regression of Eqs. 32 and 20. The value of the rate constant k3 then was used to calculate Bmax by Eqs. 7 and 11. The SD for five different levels of noise (i.e., 5, 10, 15, 20, and 25%) indicated how the modeling error propagated into estimates of Bmax for both methods of analysis. In total, 300 simulations were completed at each noise level for the typical Bmax value of 15 pmols/g–1. Negative, or extremely high positive, Bmax values
2
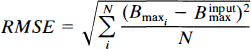
were not permitted by the analysis. The degree of error of the output Bmax was quantified by the root-mean square error (RMSE), calculated as:
Positron emission tomography.
An x-ray computed tomography (CT) scan was first performed, with scanning directed toward the area of the basal ganglia, to identify the plane that best passed through the center of the caudate nuclei and putamen. This plane was identified by a permanent ink line on the individualized thermoplastic mask of the subject in the CT scanner. The subject wore this same mask for the PET scan. It provided both slice location information and immobilization in combination with the PET scanner's head holder. The PET scans were performed using the CTI NeuroECAT PET scanner, which acquires three transaxial slices on 32-mm centers. The center slice was aligned with the mask line by use of the scanner's reference laser.
The PET imaging consisted of two i.v. injections of [11C]NMSP at high specific activity (Wong et al., 1986a, b ). Each PET scan began with the injection of 18 to 20 mCi of [11C]NMSP into an antecubital vein over 10 to 20 s. The injected mass of NMSP averaged 0.1 ± 0.01 μg of [11C]NMSP per kg of body weight as determined by HPLC. [11C]NMSP was produced with specific activities of 2–3 μCi/pmol (Dannals et al., 1986). There was no significant difference between the specific activities of [11C]NMSP in the normal or the patient groups either before or after haloperidol treatment.
The second PET scan was preceded 4 h by oral administration of unlabeled haloperidol (5–8 mg) to reduce the available number of D2 dopamine receptors. Plasma haloperidol concentrations were determined by National Psychopharmacology Laboratories (Nashville, TN, U.S.A.). The PET analysis was performed by investigators blind to the clinical diagnosis.
The emitted radioactivity was recorded with the PET scanner in the high-resolution mode. Radioactivity was simultaneously detected in the caudate nucleus and the cerebellum for 80 to 90 min after injection of the tracer. The temporal sequence and scan length were five scans of 2 min, five scans of 5 min, one scan of 15 min, and one scan of 30 min.
Blood samples were obtained from the dorsal vein of the hand contralateral to the injection site; the hand was heated to 44°C to “arterialize” the venous samples. In some cases, radial arterial samples were obtained simultaneously. The temporal sequence of blood sampling after the injection of [11C]NMSP was four to six samples the first minute, three to six the second minute, two the third minute, once every minute up to the 10th minute, and then at 25, 30, 45, 60, 75, and 90 min. Blood samples were centrifuged, and the plasma samples were counted in a gamma scintillation spectrometer. We previously showed that arterialized venous samples do not yield results significantly different from those obtained with arterial samples when using the slope-intercept method (Wong et al., 1986c).
Image analysis.
Images were reconstructed by using a standard filtered back-projection algorithm and a high-resolution Shepp-Logan filter. Attenuation correction was performed by fitting an ellipse to the outline of the head, including the skull, which was visible during the early time phase of the study, and then calculating attenuation factors. The same ellipse shape and size were used for all time points in a given subject. The translational and rotational positions of the ellipse were adjusted to account for any slight head movement during the scanning period. The resulting ellipse location information also was used to center and align all images in the study to the center of the computer matrix, such that regions of interest, as described below, could be defined at one time point and automatically propagated to all time points. For this analysis, time-activity curves for the left and right caudate and for the cerebellum were averaged to compute k3 and Bmax.
Left and right caudate head and putamen regions were placed on the center slice as determined by CT. Standardized size and shape regions (3 × 3 pixel ellipses) were used for all subjects. Because of the finite spatial resolution of the scanner, we chose to use the following regional positioning technique, which minimized underestimation of the true radioactivity concentration by partial volume effects. First, the regions were positioned manually in the center of each structure using the PET image itself as a guide. Then regions were moved one pixel in each of the eight compass directions, and the location that produced the maximum value of the average counts/pixel within the region was used for quantification.
Statistical analysis.
To examine the relationship between age and Bmax, simple linear regressions of Bmax versus age were fitted separately (normal controls). As a quadratic term for age was not significant, it was not included in these analyses.
We also examined the stability of the receptor measurements over time. Regression analysis was performed for the Bmax values of normal control subjects studied between 1985 and 1992 using all 24 subjects studied during this period. For this analysis, Bmax was the dependent measure, and the date of the study, age, and age by date interaction were the predictors.
RESULTS
Validation
Plasma metabolites.
The HPLC retention time was ∼ 4 min for [11C]NMSP and 2.6 min for metabolites (typically, the recovery was of the order of 90%). There was excellent correlation between modeled and HPLC-measured metabolites (Fig. 3).
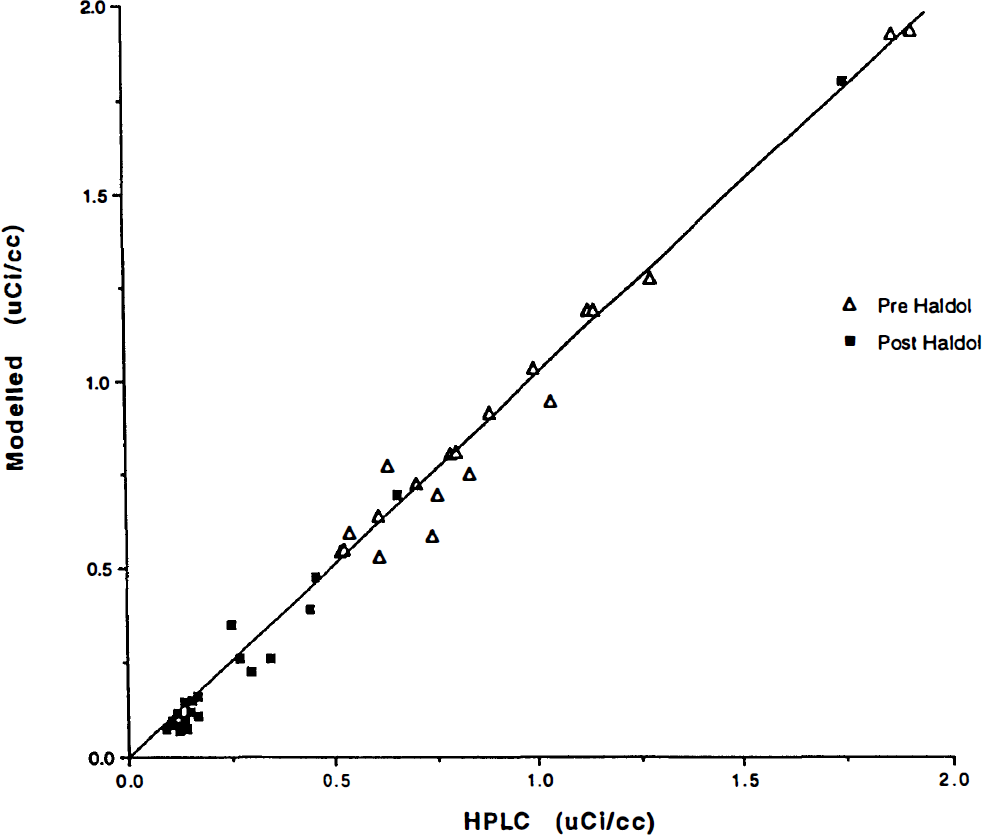
Plasma radioactivity concentrations corrected for metabolites by two methods. On the ordinate axis, radioactivity measures are corrected by the high-pressure liquid chromatography (HPLC) assay described in the methods section. On the abscissa axis, the radioactivity measures are corrected using the model-derived corrections applied to the measured total plasma radioactivity for the human subjects. Units are in μCi/ml. The subject population consisted of normal controls, and radioactivity measures were obtained throughout the 90-minute study period. (See text for regressions.)
All 64 comparisons for scans before and after haloperidol administration gave the regression line Y = 1.01 (HPLC) − 0.005, r2 = 0.99. The regression line for the separate pre- and post-haloperidol curves was not significantly different in slope or in intercept and had a similar correlation [pre-haloperidol model = 1.02 (HPLC) − 0.011, r2 = 0.97 and post-haloperidol model = 1.05 (HPLC) − 0.033, r2 = 0.99].
Partition coefficients.
The in vivo partition coefficient for [11C]NMSP averaged about 4 ml g–1 in the cerebellum. In the caudate nucleus, the partition coefficient for NMSP was calculated to be 7.5 ml g–1, judged from the product of Ve and (1 + ρ).
In vivo the partition coefficient of haloperidol was greater in the striatum than in the cerebellum of guinea pigs, as listed in Table 1. When this difference was quantified as ρ [(partition coefficient for striatum)/(partition coefficient for cerebellum) − 1], the mean value was 2.1. The two determinations of ρ differed by only 9%. The serum concentrations of haloperidol were similar to those found after administration of 14 nM (5.3 ng ml–1) oral haloperidol.
Partition coefficients
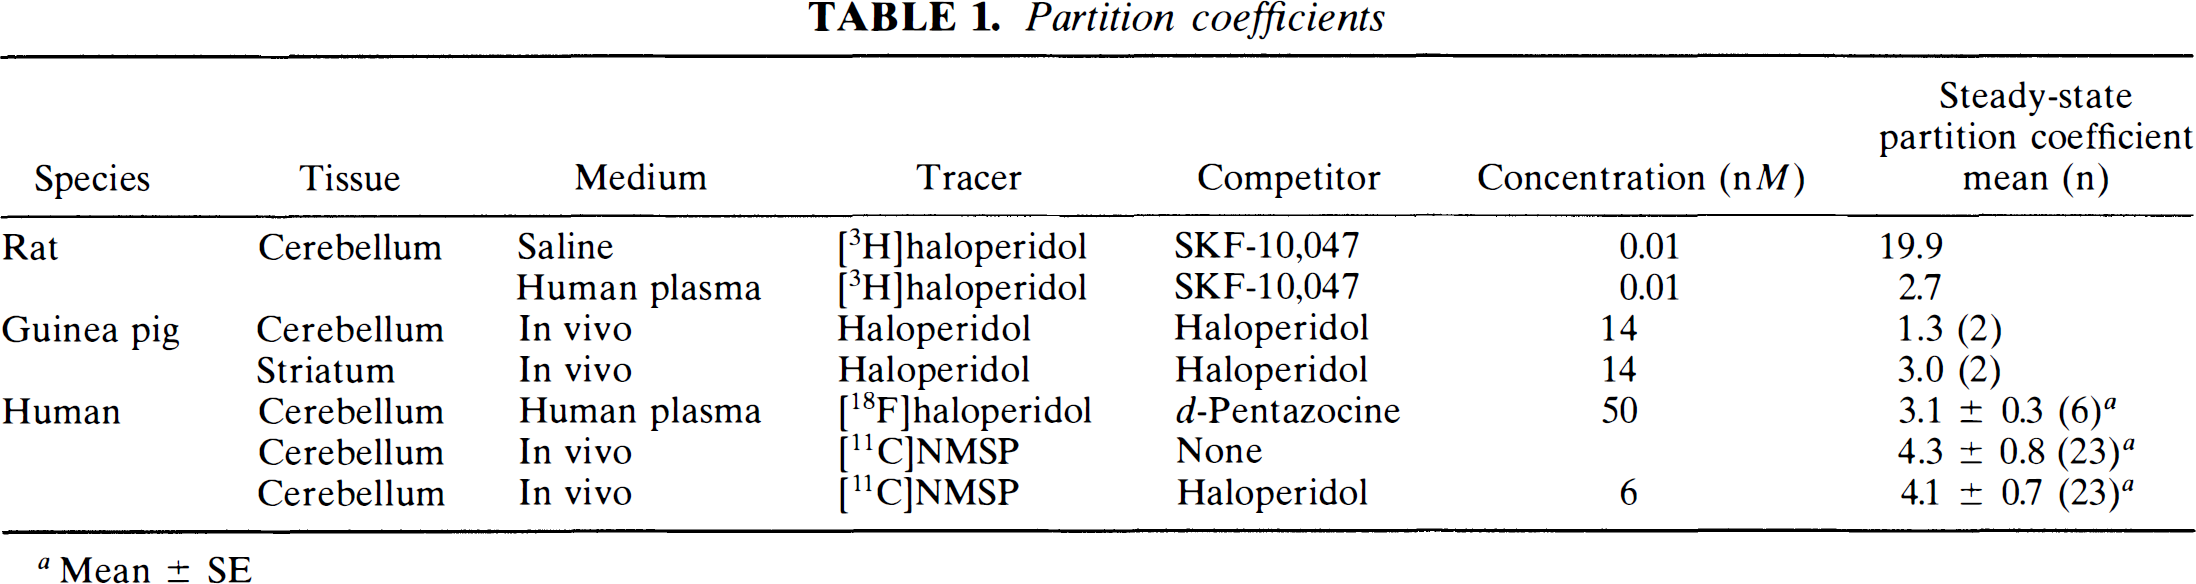
Mean ± SE
In vitro the effects of varying tissue concentration and incubation time on [3H]haloperidol partitioning between rodent cerebellar tissue and saline were analyzed. The tissue quantity of 25 mg ml–1 showed the greatest constancy of the partition coefficient. At higher tissue amounts (50 mg ml–1), lower partition coefficients reflected clumping.
In vitro, the mean partition coefficients for [18F]haloperidol in the cerebellum among post-mortem tissue from controls approximated 3 ml g–1 (Table 1). Partition coefficients obtained after substitution of human plasma for saline are shown in Table 1. These partition coefficients were determined by counting both the brain tissue pellet and plasma. The use of human plasma protein reduced the partitioning to the range of 2.5 to 2.8 ml g–1 for [18F]haloperidol and 3.6 to 7.5 ml g–1 for [3H]NMSP between 45 and 75 min of incubation. Peak partitioning of [3H]haloperidol occurred at 60 min of incubation, followed by a decline at 90 min, attributed to tissue breakdown. Therefore, 60 min was the length chosen as the optimum duration of incubation and revealed an [18F]haloperidol cerebellum-plasma partition coefficient of 2.7 ml g–1.
Protein binding.
The fractions of NMSP and haloperidol free in plasma (i.e., not bound to plasma proteins) were determined in control subjects. Values of the mean ± 1 SD are given in Table 2.
Radiotracer free fraction in plasma (% ± SD) (n)
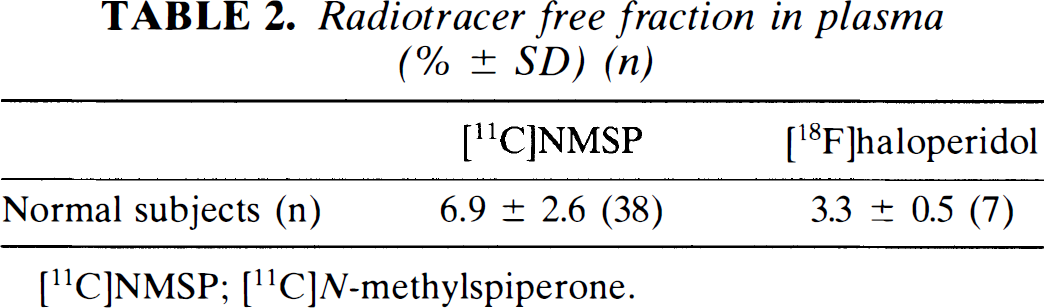
[11C]NMSP; [11C]N-methylspiperone.
Lumped coefficient Dw.
The value of Dw was calculated directly from the measured values of its components. The values of these components are listed in Table 3. They were obtained by separate determinations of partition coefficients and protein binding as listed below. The calculated value of Dw was 0.4 nmol (pmol ml min cm–3 ng–1).
Calculation of Dw
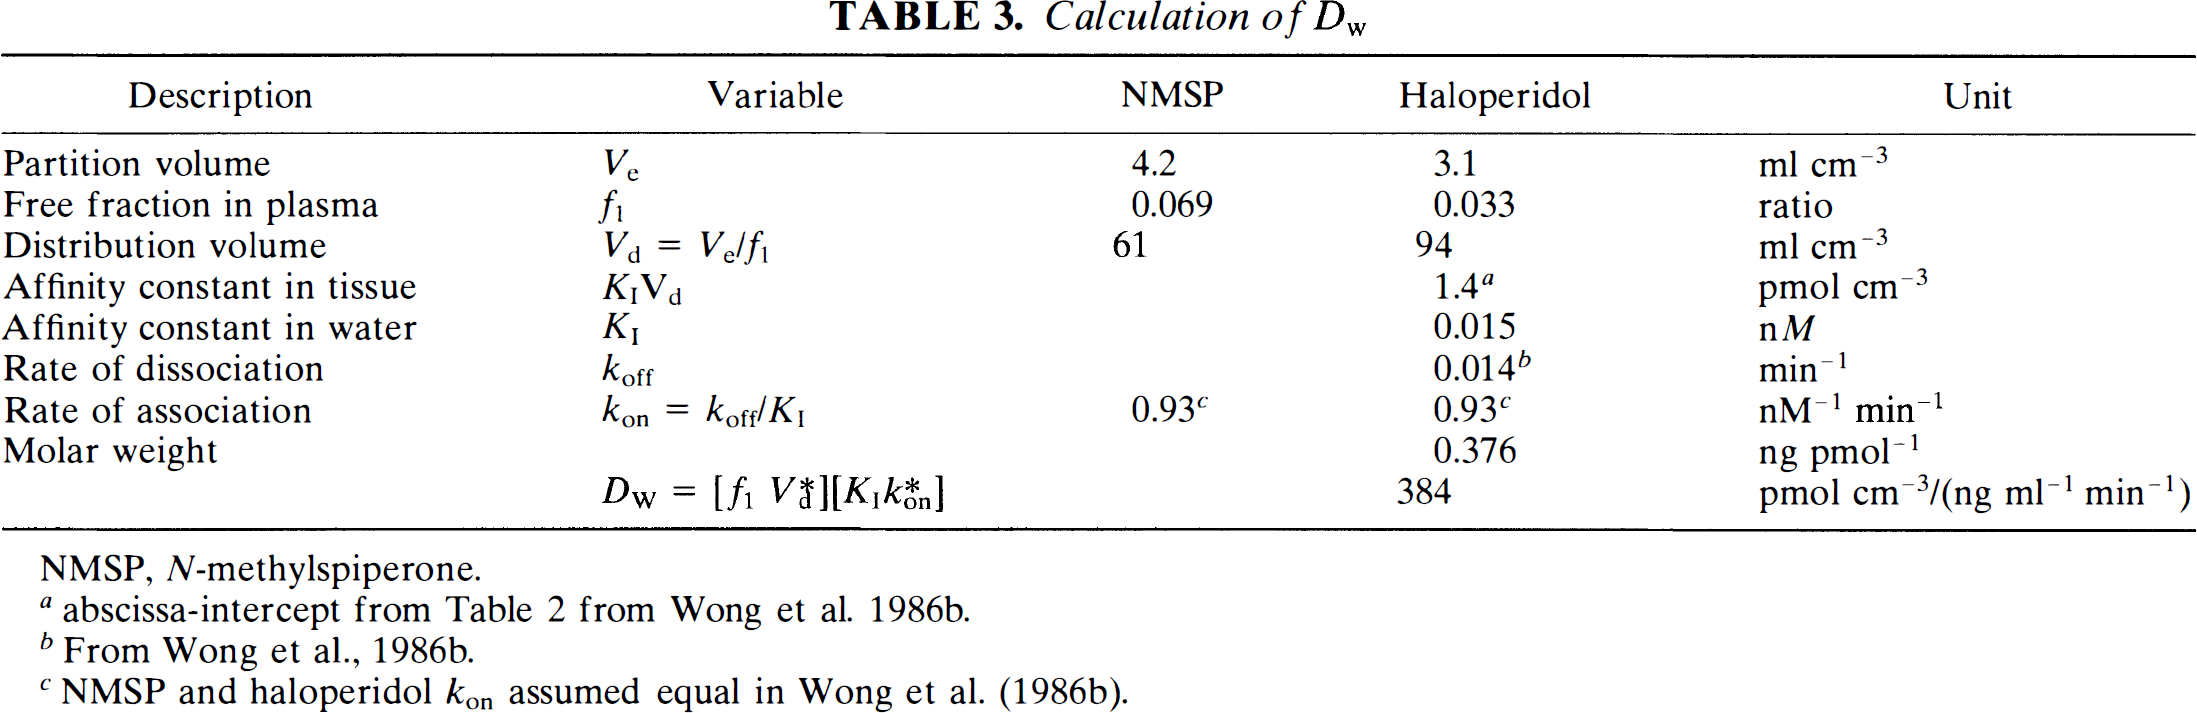
NMSP, N-methylspiperone.
abscissa-intercept from Table 2 from Wong et al. 1986b.
From Wong et al., 1986b.
NMSP and haloperidol kon assumed equal in Wong et al. (1986b).
B max measurements
Simulation.
The mean and SD of the values of Bmax estimated using direct regression and graphical analysis are given in Table 4. For 300 simulations, the two methods yielded similar accurate and precise estimates of the input Bmax of 15 pmol g–1. Increasing RMSE due to added noise was demonstrated for both analysis methods, with comparable error propagation.
Kinetic analysis of simulated noisy data a
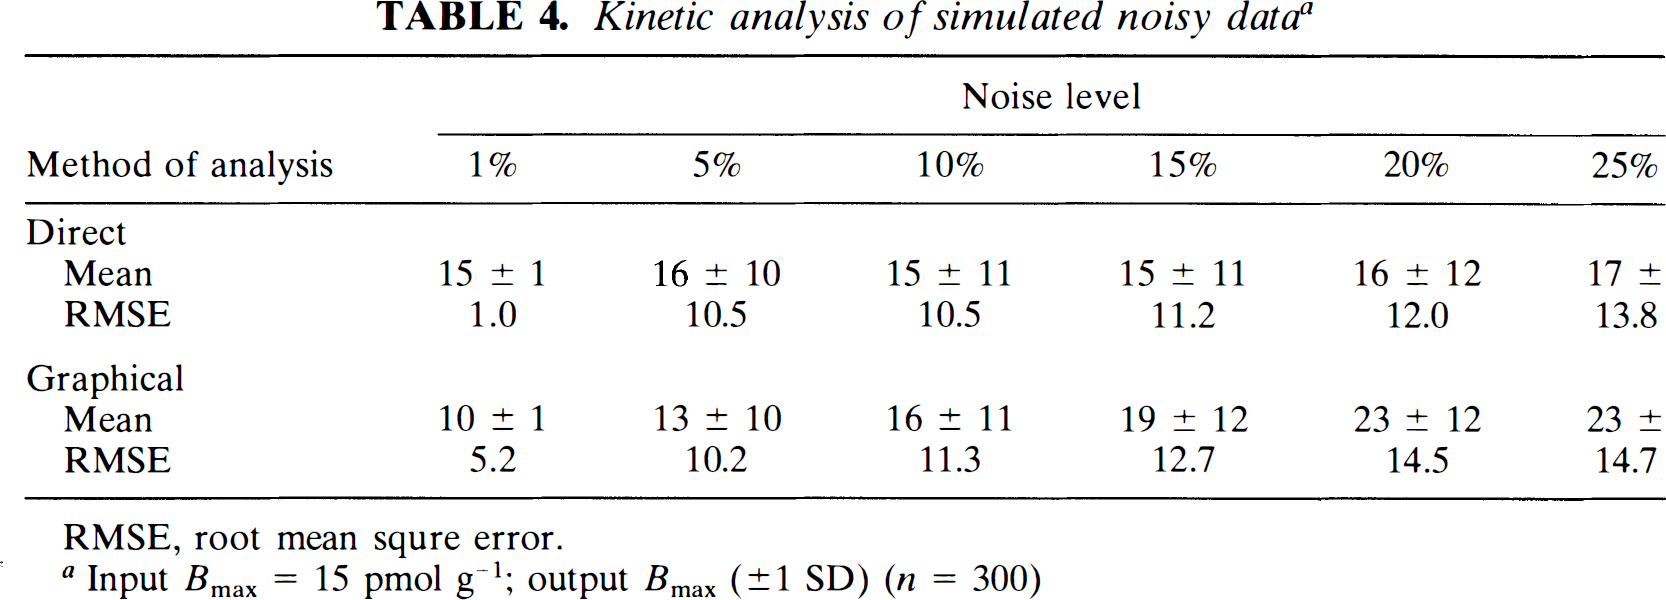
RMSE, root mean squre error.
Input Bmax = 15 pmol g–1; output Bmax (±1 SD) (n = 300)
Receptor binding as a function of age.
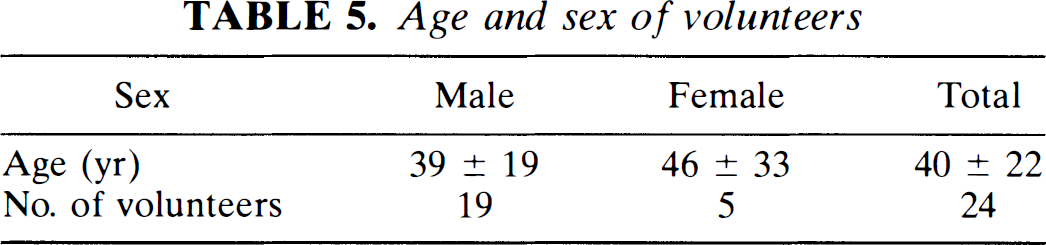
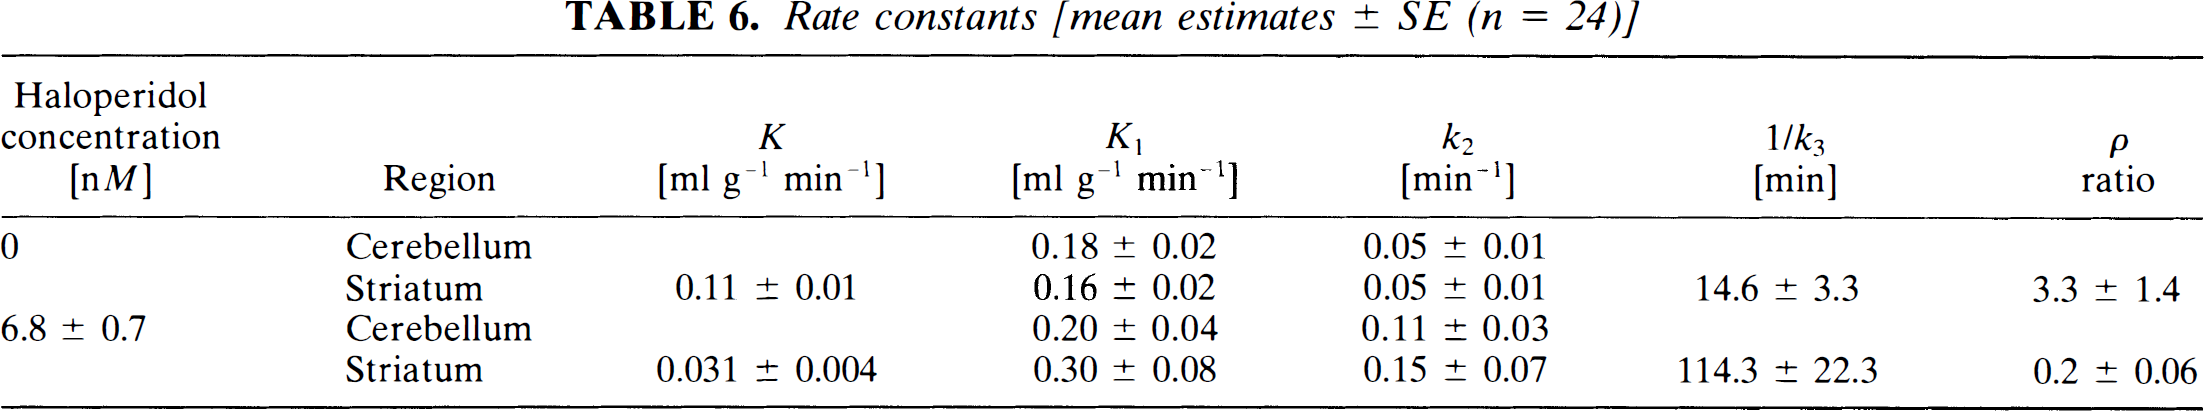
Blood pressure, pulse, weight, and nutritional status at time of scan were not significantly different among the normal volunteers. Mean age and sex of the subjects are listed in Table 5. Average rate constants estimated by the graphical analysis are given in Table 6. The time constant (1/k3) increased from 15 to 114 min after the blockade by haloperidol. Haloperidol also reduced the nonspecific and low-affinity binding potential (ρ) from 3.3 to almost zero.
Age and sex of volunteers
Rate constants [mean estimates ± SE (n = 24)]
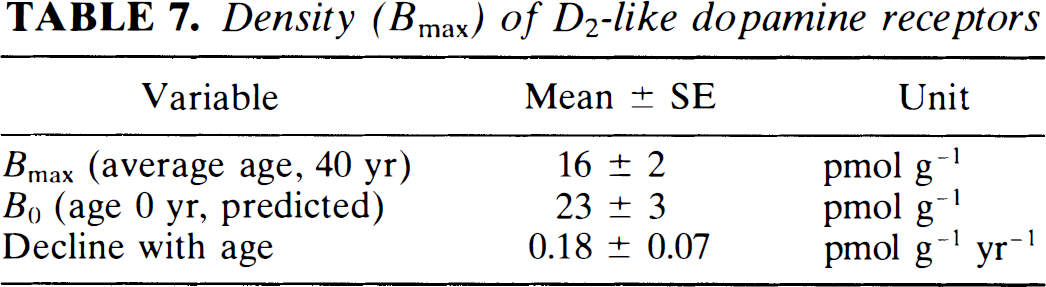
The Bmax values calculated from the difference between the time constants revealed striking declines with age in normal volunteers, as shown in Fig. 4. The results of the linear regression (Bmax = 23 − (0.18) age, r = 0.5) are listed in Table 7. These findings indicate that the number of D2-like receptors declines by about 1% of the original number every year. Varying ages strongly influenced the comparison among the different subjects.
Density (Bmax) of D2-like dopamine receptors
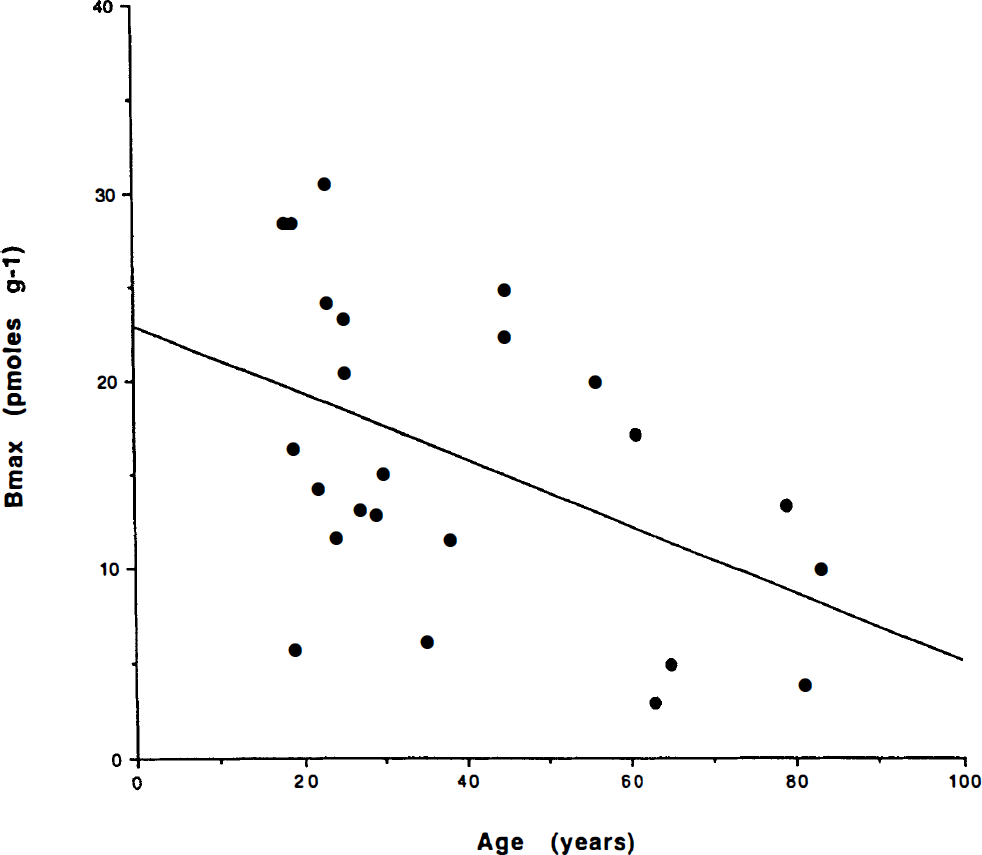
Bmax versus age of normal volunteers. The decline with age is clearly depicted (see text for details).
Regression analysis of Bmax values for all normals against the date of the study revealed no significant effect, or interaction between age and date (p > 0.32). This finding suggests that no temporal bias occurred in the normal volunteers.
DISCUSSION
This study addressed questions raised by the use of a particular solution to a quantitative model of receptor binding and demonstrated a decrease in dopamine D2-like receptors Bmax with age in normal subjects.
Graphical analysis of Bmax
In 1986 we published normal values for D2 dopamine receptors in human striatum. The method was designed to take the properties of NMSP and haloperidol into account. Haloperidol is a reversibly binding ligand, whereas NMSP shows little evidence of dissociation in the time normally available for PET. It was therefore impossible to obtain steady-state equilibrium binding values for NMSP. Instead, we used haloperidol to nearly saturate the receptors, knowing that unlabeled haloperidol would come to an apparent steady state within a reasonable time after oral administration of this unlabeled ligand. The results obtained with the method therefore reflect the kinetic properties of haloperidol as imaged with a related but not identical radioligand.
The method used in 1986 was also designed to meet other experimental concerns. The positron tomograph (a CTI NeuroEcat) yielded only 12 time points for the brain tissue time-activity curve and exhibited significant noise that rendered conventional least-squares and computerized optimization methods unstable. For these reasons, we chose to quantify the binding of NMSP by means of a constrained graphical analysis. In its present form, the method depends on three separate measurements: one measurement of the time constant of binding of NMSP in the absence of any occupying ligand, one measurement of the time constant in the presence of a near-saturating ligand, and one measurement of the concentration of the occupying unlabeled ligand in plasma at steady state. In addition to these measurements, a proportionality coefficient, Dw, must be known and must be constant. The method is further complicated by the fact that NMSP is subject to metabolism in the bloodstream; therefore, the estimation of the concentration of radiolabeled NMSP in blood plasma must take this fact into account.
In the present study, we extended the normal control population (Wong et al., 1986c) to include a sufficient number of healthy volunteers at different ages to test the observation of a significant decline with age in the density of dopamine D2-like receptors in striatum. By the term dopamine D2-like receptors in striatum, we refer to receptors in the striatum that bind both haloperidol and NMSP. We did not specifically identify these receptors in the present study. It is known from the literature that these receptors include dopamine D2, D3, and D4 receptors as well as serotonin 5-HT2 receptors.
Each of the three measurements entering into the calculation of the receptor density, as well as the assumptions underlying this calculation, have been tested in the present study. Thus, we show that nonlinear regression of the binding equation to the data yields values of the time constants of binding that are close to those estimated by the graphical method. We also show that the method of correction for the metabolism of [11C] NMSP in blood plasma is verified by HPLC. Finally, we show that the value of the proportionality coefficient Dw can be derived independently from known properties of NMSP and haloperidol, either reported in the literature or independently acquired in the present study. For these reasons, we now state unequivocally that the graphical method of estimating the number of haloperidol binding receptors in human striatum gives accurate and reproducible values.
It has been argued that the current method is redundant because it uses information to calculate the maximum binding capacity, which may be acquired in a simpler manner, by using the reported value of the rate of association (k*on) of NMSP to receptor sites to calculate Bmax from the ratio between k3 and k*on. This argument would have considerable merit; however, the binding of NMSP to its receptors at high specific activity is so intense that the rate-limiting step of binding may not be the tissue binding capacity but the rate at which NMSP crosses the blood-brain barrier. In this case, the estimate of the time-constant (1/k3) is often very small. Therefore, it is necessary to examine the binding at a different condition in which the receptors are closer to saturation by an occupying ligand with comparatively low binding potential, such as haloperidol.
Validation
Plasma metabolites.
The metabolism of [11C]NMSP in the circulation was measured by HPLC. The evaluation demonstrated excellent agreement with the kinetic assay used previously (Wong et al., 1989). Both assays were unbiased across pre- and post-haloperidol measures.
Swart and Korf (1989) suggested that the model correction for labeled metabolites of NMSP leads to a metabolism-dependent estimator and suggested that the partition coefficient λ, as we have described here, would be underestimated. Nevertheless, excellent correlations exist between the model metabolites and HPLC corrected values. In our expanded material, including pre- and post-haloperidol comparisons, this excellent correlation is maintained.
Lumped coefficient Dw.
To determine the value of Dw, we calculated the coefficient from measured values of the individual terms which make up Dw. These include the fraction of inhibitor not bound to protein in plasma and the rate of association of the radioligand to the receptors in question (Table 3). The calculated Dw correlated reasonably well with the value previously used and it compared favorably with that used in a prior study of 0.5 nmol pmol cm–3/(ng ml–1 min–1) (Wong et al., 1986c).
Partition coefficients.
The present in vivo study of rodents confirmed the estimate of the binding potential of rapidly reversible sites in the striatum, ρ. This binding potential was previously observed to fall in the presence of haloperidol (Wong et al., 1986b), undoubtedly as a result of inhibition of additional binding sites, some of which may be serotonin, α-adrenergic, δ receptors, or an additional binding of uncertain origin.
The partition of [3H]haloperidol and [18F]haloperidol between human blood plasma and brain tissue in vitro yielded estimates of the solubility of the radiotracers in brain tissue relative to blood plasma. The plasma protein binding caused these values to be much lower than the determined partition relative to phosphate-buffered saline. The partition, relative to blood plasma, was comparable to the in vivo partition determined with PET.
Bmax measurements
Simulation.
The error analysis of the direct and graphical methods suggested that they provide similar RMSE levels for different levels of noise added to the noise-free TACs. Although at low noise levels near zero (e.g., 1%) the exact method may be preferable, with more realistic noise levels as seen experimentally (e.g., 10–20%), the graphical method may be at least as robust. Especially with the limited number of points per time activity curve (12) in this study, the graphical method may have a slight advantage at the highest noise levels and demonstrated a more time-efficient approach, as it was observed to be less subject to poor convergence.
The RMSE rose only about 40% for both methods of analysis (30% direct and 44% for graphical) when the noise level rose fivefold, from 5 to 25%. In linear systems and in some nonlinear systems, it may be expected that the error rises as much as, if not more than, the noise level; however, one likely factor that this did not happen in either the direct or the graphical method in these simulations is because negative and extremely large positive Bmax values were not allowed 3 in the calculations of the mean and RMSE4; therefore, as the noise level increased, a greater percentage of the simulation results were deleted.
Effects of age.
A fall in D2-like dopamine receptors with age has been demonstrated by several groups, using different ligands and techniques of quantification (Wong et al., 1984; Baron et al., 1986; Iyo et al., 1989). Most studies reported simple tissue ratios, except for a recent study of the binding of [11C]raclopride (Rinne et al., 1993). The in vivo finding of a fall of the D2-like dopamine receptor density with age is important because of a renewed discussion of in vitro findings. Although most studies in vitro confirmed the fall with age observed in vivo (Seeman et al., 1987; Morgan et al., 1987; Rinne, 1987), one did not (DeKeyser et al., 1990). In a postmortem study, Seeman et al. (1987) demonstrated a maximum density of D2 receptors in striatum at 2 years of age, with a rapid fall between the ages of 5 and 10 years, and a subsequent linear fall until age 100. The decline was approximately 0.29% per year compared with 0.84% per year in the present study. Rinne (1987) reported a decrease of 0.42% per year in the caudate nucleus. Because of the decline, the value of the y-intercept (B0) is a convenient index for comparing differences in receptor density at different ages among patient groups. This index does not imply actual extrapolation to age 0 because the data is unavailable and because early changes may be nonlinear. Because of the strong evidence for a decline of Bmax with normal aging, age correction of Bmax values is necessary for the comparison of neuropsychiatric patients with control subjects. The difference in the rate of decline of raclopride and NMSP binding may be a function of the binding characteristics of the two ligands. According to Seeman et al. (1992), raclopride may bind to D2-like as a dimer, whereas NMSP may bind as a monomer. In this case, the number of binding sites for raclopride would decay at half the rate of the number of NMSP binding sites.
GLOSSARY OF TERMS
The term transient equilibrium replaces the term secular equilibrium in Wong et al. (1986a) to be consistent with its usage in nuclear physics literature.
Defined as Bmax > 100 pmol g–1. These values were not allowed by the analysis. Such values have never been observed in human studies, in ours or other published studies with [11C]NMSP or [11C]raclopride.
Only a small number (<1%) had Bmax values <100, a value never exceeded in any human studies to date.
This did not bias the reported comparison of the two methods because the incidence of negative Bmax values was approximately equal in the two groups.
Footnotes
Acknowledgment:
This work was supported in part by Public Health Service grants NIMH RO1 MH42821 (D.F.W.), NARSAD (D.F.W.) ROl MH40362 (LT) KO1 MN00723 (LT), NICHD 23042 (D.F.W.), MH40391, and MH43775; MRC (Canada) grants SP-5, PG-41, and SP-30 (A.G.), the Fred Low-Beer and EJLB Foundations, Montreal (A.G.); and MRC (Denmark) grant 12-1633-1 (A.G.). We acknowledge the physics and image analysis assistance of Jon Links, Ph.D., and the substantial discussions and suggestions of Susan Resnick, Ph.D. Special thanks for technical assistance to H. Soni, C. Chen, D. Burckhardt, B. Muddiman, T. Folio, E. Minkin, C. Alexandrescu, and the editorial assistance of T. Wei.
We gratefully acknowledge the donation of the human tissue by Manuel F. Casanova and Joel E. Kleinman, Neuropathology Section, Clinical Brain Disorders Branch, National Institute of Mental Health, Washington, D.C.