
Abstract
Vascular responses to changes in Paco2 are used widely to estimate cerebral perfusion reserve, and they can also be used to assess the degree of arteriosclerosis. In the present study, the effect of aging on cerebral vascular responses to both hypercapnia and hypocapnia was investigated. Cerebral blood flow was measured with positron emission tomography at rest, during hypercapnia, and during hypocapnia in 11 young men and 12 older men. The vascular response to change in Paco2 was calculated as the percent change in cerebral blood flow per absolute change in Paco2 in response to hypercapnia and hypocapnia. The total vascular response to change in Paco2 from hypocapnia to hypercapnia was also calculated. To evaluate age-related changes in regional cerebral vascular responses on a pixel-by-pixel basis, an anatomic standardization technique was also used. Although no significant differences between young and old subjects was observed for vascular responses to both hypercapnia and hypocapnia, a significant decrease in total vascular response was observed with aging, indicating progression of sclerotic changes in the cerebral perforating and medullary arteries with normal aging. According to anatomic standardization analysis, relative capacities for vasodilatation in the cerebellum and insular cortex, and relative capacity for vasoconstriction in the frontal cortex were greater in the younger subjects. Such aging effects should be considered when estimating cerebral perfusion reserve.
Hypercapnia causes cerebral vasodilation, and hypocapnia causes cerebral vasoconstriction (Kety and Schmidt, 1948; Raper et al., 1971). Because vascular responsiveness to vasodilator substances in the brain with insufficient cerebral perfusion pressure is reduced by autoregulatory vasodilation (Kanno et al., 1988; Nishimura et al., 1999), hypercapnia is widely used to estimate cerebral perfusion reserve in occlusive cerebrovascular disease (Herold et al., 1988; Kuwabara et al., 1997; Levine et al., 1991). Because sclerotic changes in cerebral perforating and medullary arteries cause dysfunction of cerebral autoregulation (Strandgaard et al., 1973), vascular responsiveness to vasodilator substances can also be used to assess arteriosclerotic changes. Decreased vascular response to hypercapnia in hypertensive patients with leukoariosis, a condition associated with sclerotic changes in the medullary artery, has been reported (Kuwabara et al., 1992, 1996).
Arteriosclerosis occurs during the normal aging process (Furuta et al., 1991; Masawa et al., 1994), and therefore, vascular responsiveness to changes in Paco2 should decrease with normal aging. Decreased vascular responses to hypercapnia during aging have been observed in Wistar and Fischer 344 rats (Lartaud et al., 1993) and spontaneously hypertensive rats (Tamaki et al., 1995), whereas no aging effects have been observed in humans (Levine et al., 1994). However, a decreased vascular response to hypocapnia with age has been reported in humans (Yamaguchi et al., 1979). There have been no reports regarding the effect of aging on human cerebral vascular responses to both hypercapnia and hypocapnia in the same subject.
In the present study, the effect of aging on vascular responses to changes in Paco2 was investigated. Cerebral blood flow (CBF) was measured at rest and during hypercapnia and hypocapnia with 15O-labeled water (H215O) and positron emission tomography (PET) in both young and elderly subjects. We previously reported regional differences in cerebral vascular responses to changes in Paco2 on a pixel-by-pixel basis with an anatomic standardization technique (Ito et al., 2000). In the present study, age-related changes in the regional distribution of cerebral vascular responses were also evaluated on a pixel-by-pixel basis.
MATERIALS AND METHODS
Subjects
The Ethics Committee of the Akita Research Institute of Brain and Blood Vessels approved this study. Twenty-three healthy men were recruited, and gave written informed consent to participate. Eleven of the 23 subjects were in the young age group (20–28 years; mean ± SD, 21.7 ± 2.4 years), and 12 of 23 subjects were in the old age group (51–64 years; mean ± SD, 58.4 ± 4.4 years). Young subjects were judged healthy on the basis of medical history, physical examination, blood screening analysis, and magnetic resonance (MR) imaging of the brain. Older subjects were judged healthy on the basis of medical history, physical examination, blood screening analysis, electrocardiogram, echocardiography, MR imaging of the brain, and MR angiography of the brain and the neck. No subject used any medication.
Positron emission tomography procedures
The Headtome-V PET System (Shimadzu Corp., Kyoto, Japan) was used for all studies and yielded 47 sections with center-to-center distances of 3.125 mm (Iida et al., 1996). The intrinsic spatial resolution was 4.0 mm in-plane and 4.3 mm full-width at half maximum (FWHM) axially. Reconstruction with a Butterworth filter resulted in a final in-plane resolution of approximately 8 mm FWHM.
After transmission scanning, H215O PET studies were performed at rest and during hypercapnia and hypocapnia. The intervals between H215O PET studies were at least 15 minutes. The protocol consisted of 180 seconds of static scanning following continuous intravenous infusion of H215O over a 2-minute period. The dose of radioactivity was 1.1 to 1.5 GBq at the start of scanning. The arterial input function was obtained by continuous β probe measurement of radioactivity in arterial whole blood taken from the radial artery. Dispersion and delay in the β detector system and in the internal arterial line were corrected as reported previously (Iida et al., 1986, 1988). The CBF images were calculated by the autoradiographic method (Iida et al., 1998; Kanno et al., 1987; Raichle et al., 1983). A head-fixation system with individualized molds for each subject was used to minimize head movement during PET.
Hypercapnia was induced by inhalation of 7% CO2 gas starting 1 minute before scanning and continuing until the end of scanning. Hypocapnia was induced in the same way by hyperventilation (Kanno et al., 1988). Two arterial blood samples were taken, one at the beginning and one at the end of scanning, to measure arterial CO2 gaseous pressure. The H215O PET studies were performed at rest, during hypercapnia, and during hypocapnia in 13 subjects (6 young subjects and 7 old subjects) and at rest, during hypocapnia, and during hypercapnia conditions in the other 10 subjects (5 young subjects and 5 old subjects).
Regions of interest
Regions of interest (ROIs) were drawn on the CBF images. Circular ROIs (16 mm in diameter) were defined for the pons, thalamus, and putamen, and elliptical ROIs (16 × 32 mm) were defined for the cerebellar cortex, centrum semiovale, and four neocortical regions representing the frontal, temporal, parietal, and occipital lobes. Each ROI was drawn in three adjacent sections, and data were pooled to obtain the average concentration of radioactivity for the whole volume of interest.
For each whole volume of interest, the vascular response to change in Paco2 was calculated as the percent change in CBF per absolute change in Paco2 (mm Hg) in response to hypercapnia and hypocapnia as follows (Kanno et al., 1988):
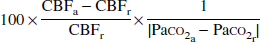
where the subscripts “r” and “a” denote rest and activation (hypercapnia and hypocapnia), respectively. The total vascular response to change in Paco2 from hypocapnia to hypercapnia was calculated as follows:
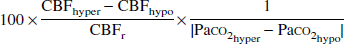
where the subscripts “hyper” and “hypo” denote hypercapnia and hypocapnia, respectively.
Anatomic standardization
To evaluate age-related changes in the regional distribution of cerebral vascular responses on a pixel-by-pixel basis, an anatomic standardization technique was used. For such analyses, images of the CBF ratio during hypercapnia or hypocapnia to CBF at rest were calculated as follows:

where the subscripts “r” and “a” denote rest and activation (hypercapnia or hypocapnia), respectively. All CBF ratio images were transformed into standard brain size and shape by linear and nonlinear parameters with a system for anatomic standardization, SPM99 (Friston et al., 1990). After anatomic standardization, the brain images of all subjects had the same anatomic format. All anatomically standardized images were smoothed with an isotropic Gaussian kernel at a FWHM of 8 mm, and were globally normalized for pixel values. From these standardized images, descriptive three-dimensional t-maps of the young age group minus the old age group for hypercapnia and the old age group minus the young age group for hypocapnia were created on a pixel-by-pixel basis (two sample t-test). Areas with a P < 0.01 were considered to show a statistically significant difference. The extent threshold was set to be 64 voxels (1 voxel = 2 × 2 × 2 mm).
RESULTS
The Paco2, Pao2, pH, blood pressure, and heart rate during each H215O PET scanning are given in Table 1. Paco2 values were increased significantly during hypercapnia (P < 0.001) and decreased significantly during hypocapnia (P < 0.001) in both young and old subjects. Blood pressures were measured at the ankle in these studies and thus tended to be higher than those measured at the brachium. Hemoglobin concentrations and hematocrit values of arterial blood were 14.9 ± 1.1 g/dL (mean ± SD) and 44.5 ± 3.5%, respectively, for the young age group, and 14.7 ± 0.9 g/dL and 44.0 ± 3.4%, respectively, for the old age group.
Arterial carbon dioxide tension, arterial oxygen tension, pH, blood pressure, and heart rate during positron emission tomography study
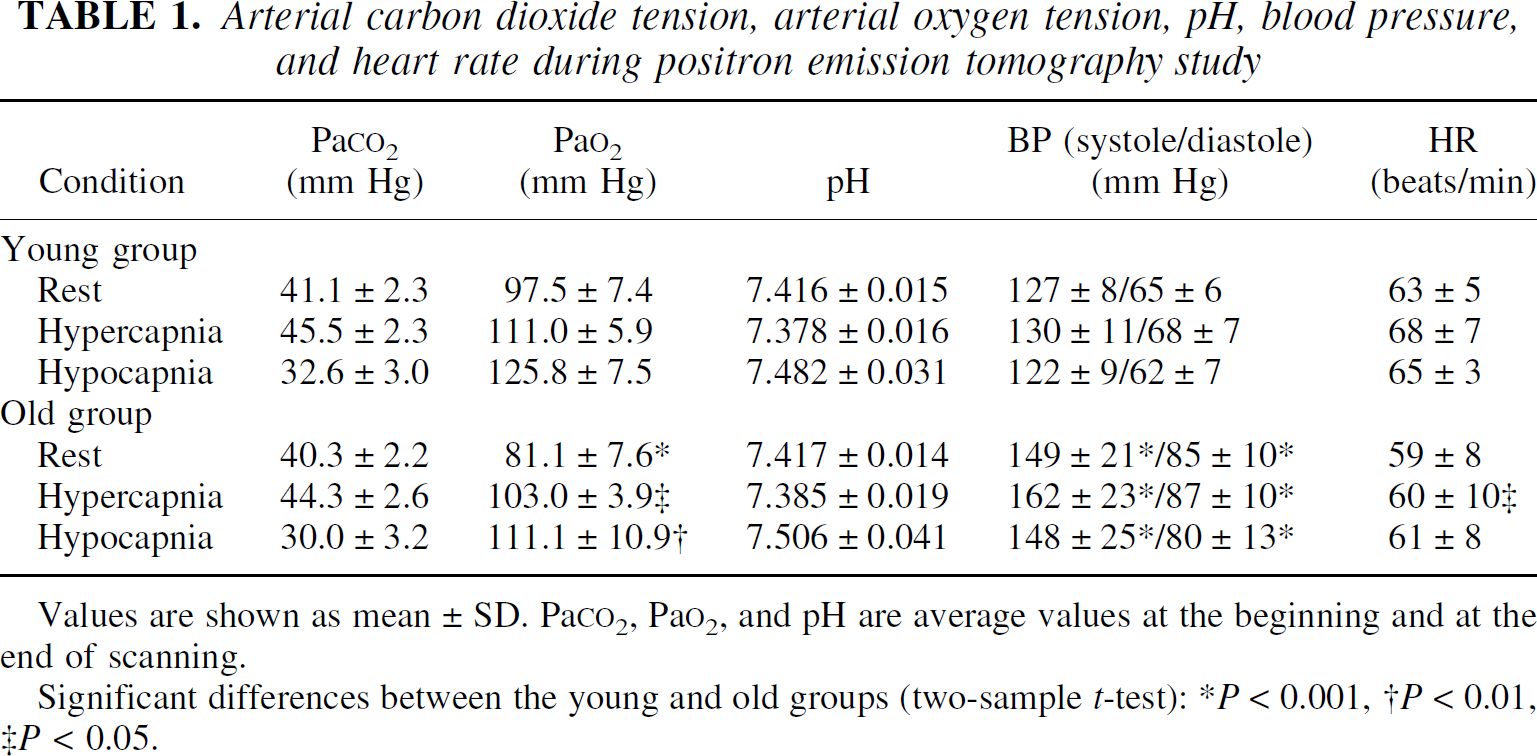
Values are shown as mean ± SD. Pa
Significant differences between the young and old groups (two-sample t-test):
P < 0.001,
P < 0.01,
P < 0.05.
The CBF values during rest, hypercapnia, and hypocapnia are given in Table 2. The CBF values in all regions were increased significantly during hypercapnia (P < 0.001–0.02) and decreased significantly during hypocapnia (P < 0.001) in both young and old subjects.
Cerebral blood flow values during rest, hypercapnia, and hypocapnia
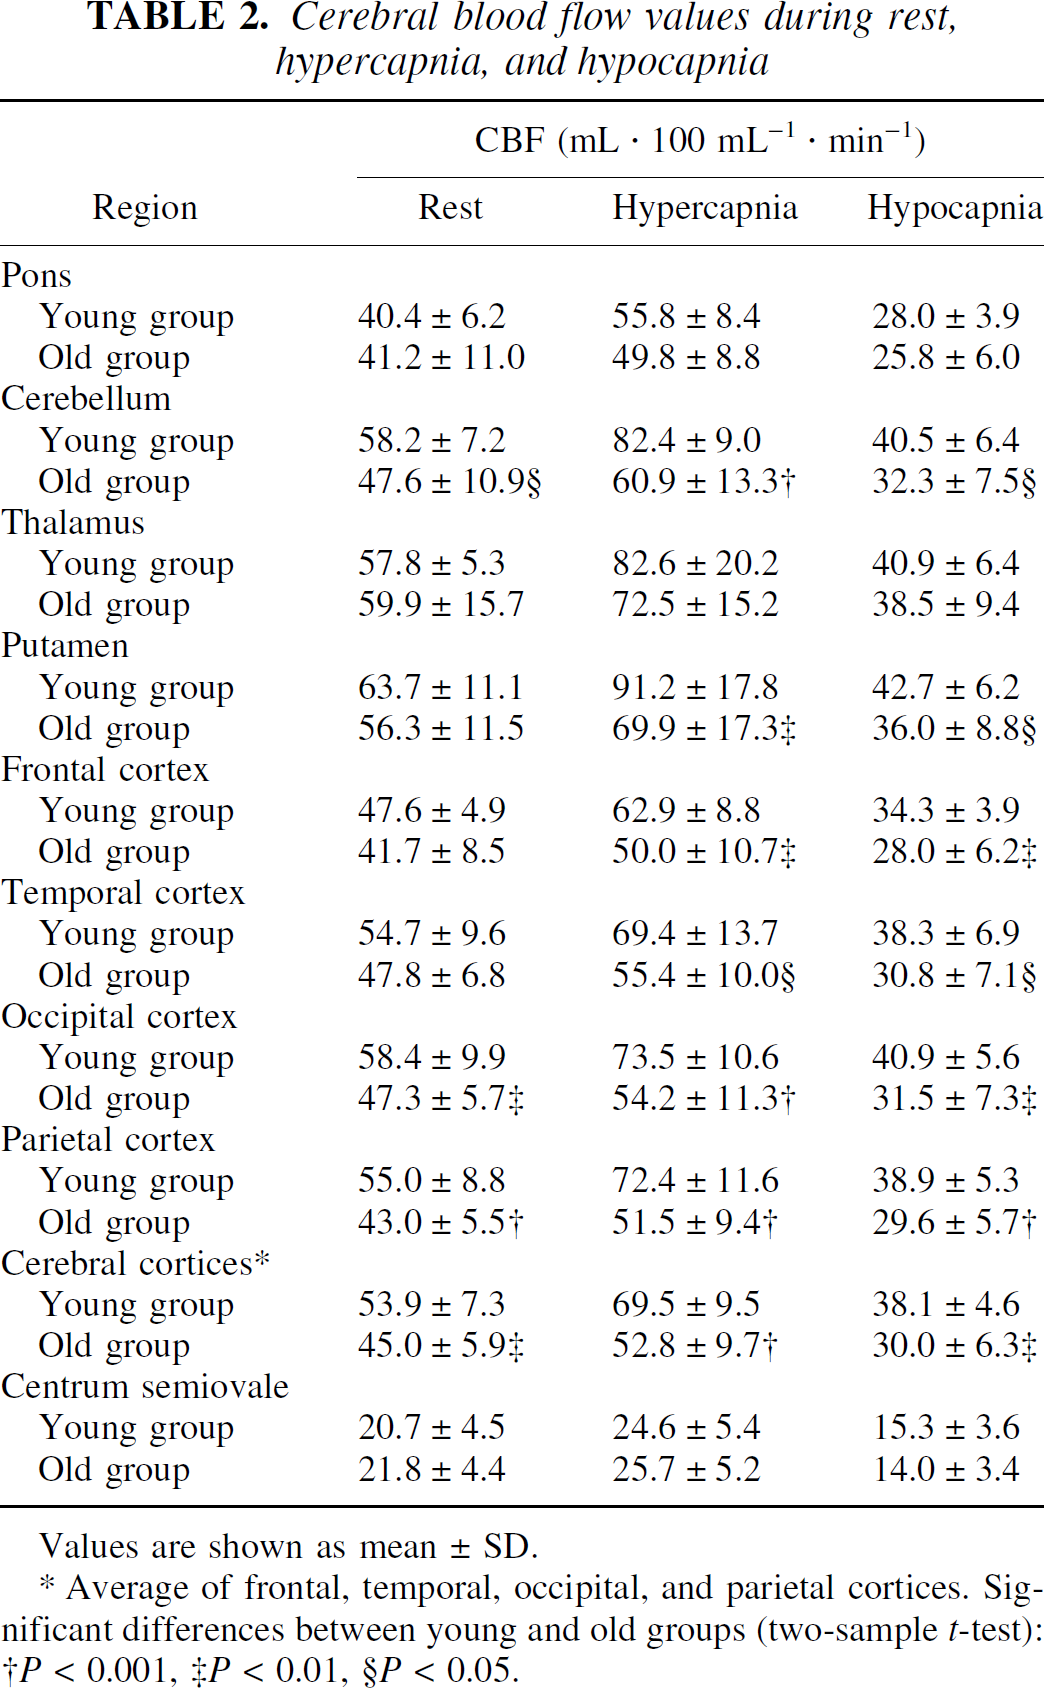
Values are shown as mean ± SD.
Average of frontal, temporal, occipital, and parietal cortices. Significant differences between young and old groups (two-sample t-test):
P < 0.001,
P < 0.01,
P < 0.05.
Vascular responses to changes in Paco2 due to hypercapnia are shown in Fig. 1A. The average vascular response to hypercapnia in the cerebral cortices was 7.4 ± 3.9%/mm Hg in the young age group and 5.0 ± 4.8%/mm Hg in the old age group. No significant differences between the young and old age groups were observed in any of the studied regions.
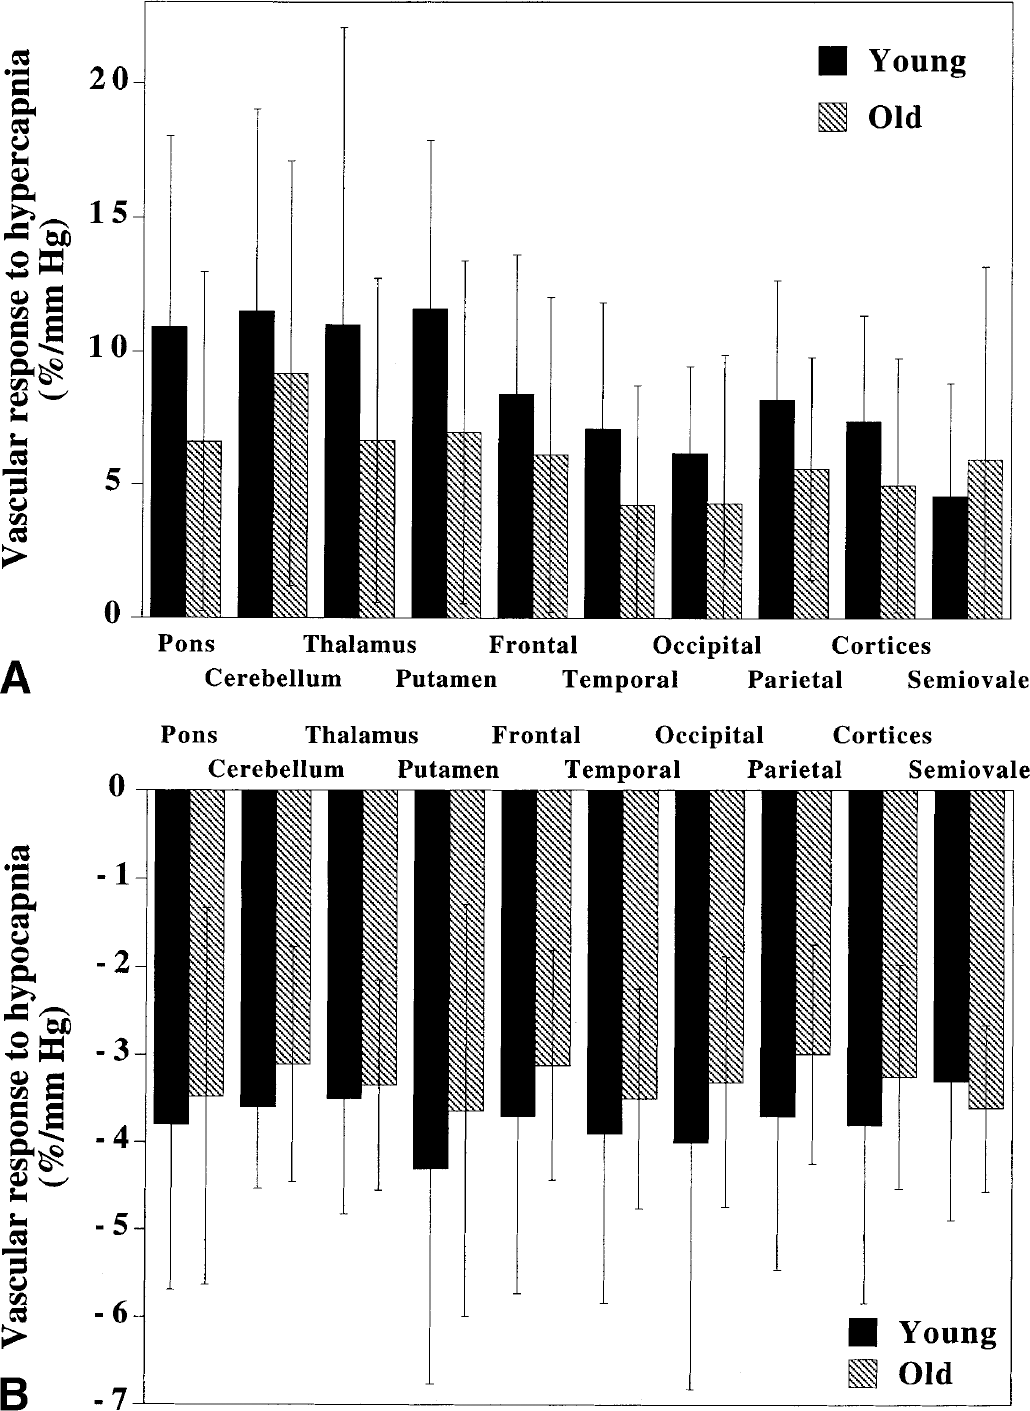
Vascular responses to changes in Paco2 due to hypocapnia are shown in Fig. 1B. The average vascular response to hypocapnia in the cerebral cortices was −3.8 ± 2.0%/mm Hg in the young age group and −3.2 ± 1.3%/mm Hg in the old age group. No significant differences between the young and old age groups were observed in any of the studied regions.
Total vascular responses to changes in Paco2 from a state of hypocapnia to one of hypercapnia are shown in Fig. 2. The average total vascular response in the cerebral cortices was 4.7 ± 1.3%/mm Hg in the young age group and 3.7 ± 0.9%/mm Hg in the old age group. Total vascular responses in the old age group were significantly lower than those in the young age group in the pons, cerebellum, putamen, occipital cortex, parietal cortex, and cerebral cortices (P < 0.05, two sample t-test). Nonparametric statistics (Mann-Whitney test) for each brain region also revealed these significant differences between the two age groups (P < 0.05).
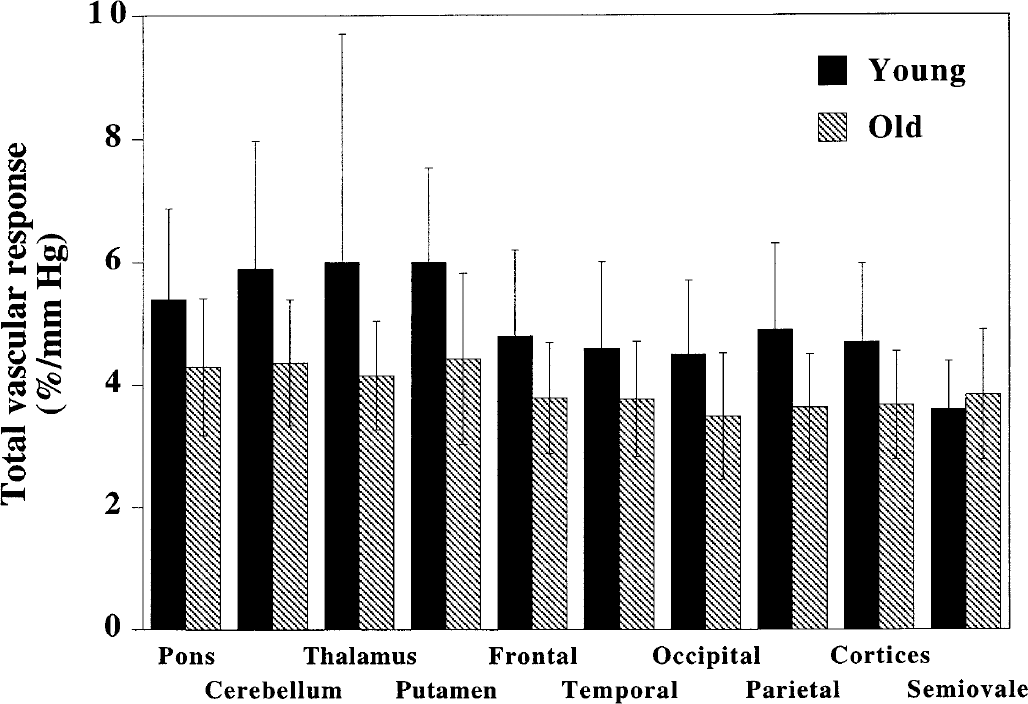
Total vascular responses to changes in Paco2 from hypocapnia to hypercapnia in young and old subjects for all brain regions. Values for cerebral cortices are the average of the frontal, temporal, occipital, and parietal cortices. Significant differences between young and old subjects were observed in the pons, cerebellum, putamen, occipital cortex, parietal cortex, and cerebral cortices (P < 0.05, two sample t-test). All values are mean ± SD.
Average images of the CBF ratio during hypercapnia to rest, which have been normalized globally for pixel values, are shown in Fig. 3A. The t-maps for the young minus old age groups for CBF ratio during hypercapnia to rest are also shown in Fig. 3A. In the cerebellum and insular cortex, CBF ratios were significantly relatively larger in the young age group than in the old age group (P < 0.01), indicating a large change in CBF during hypercapnia in the young group.
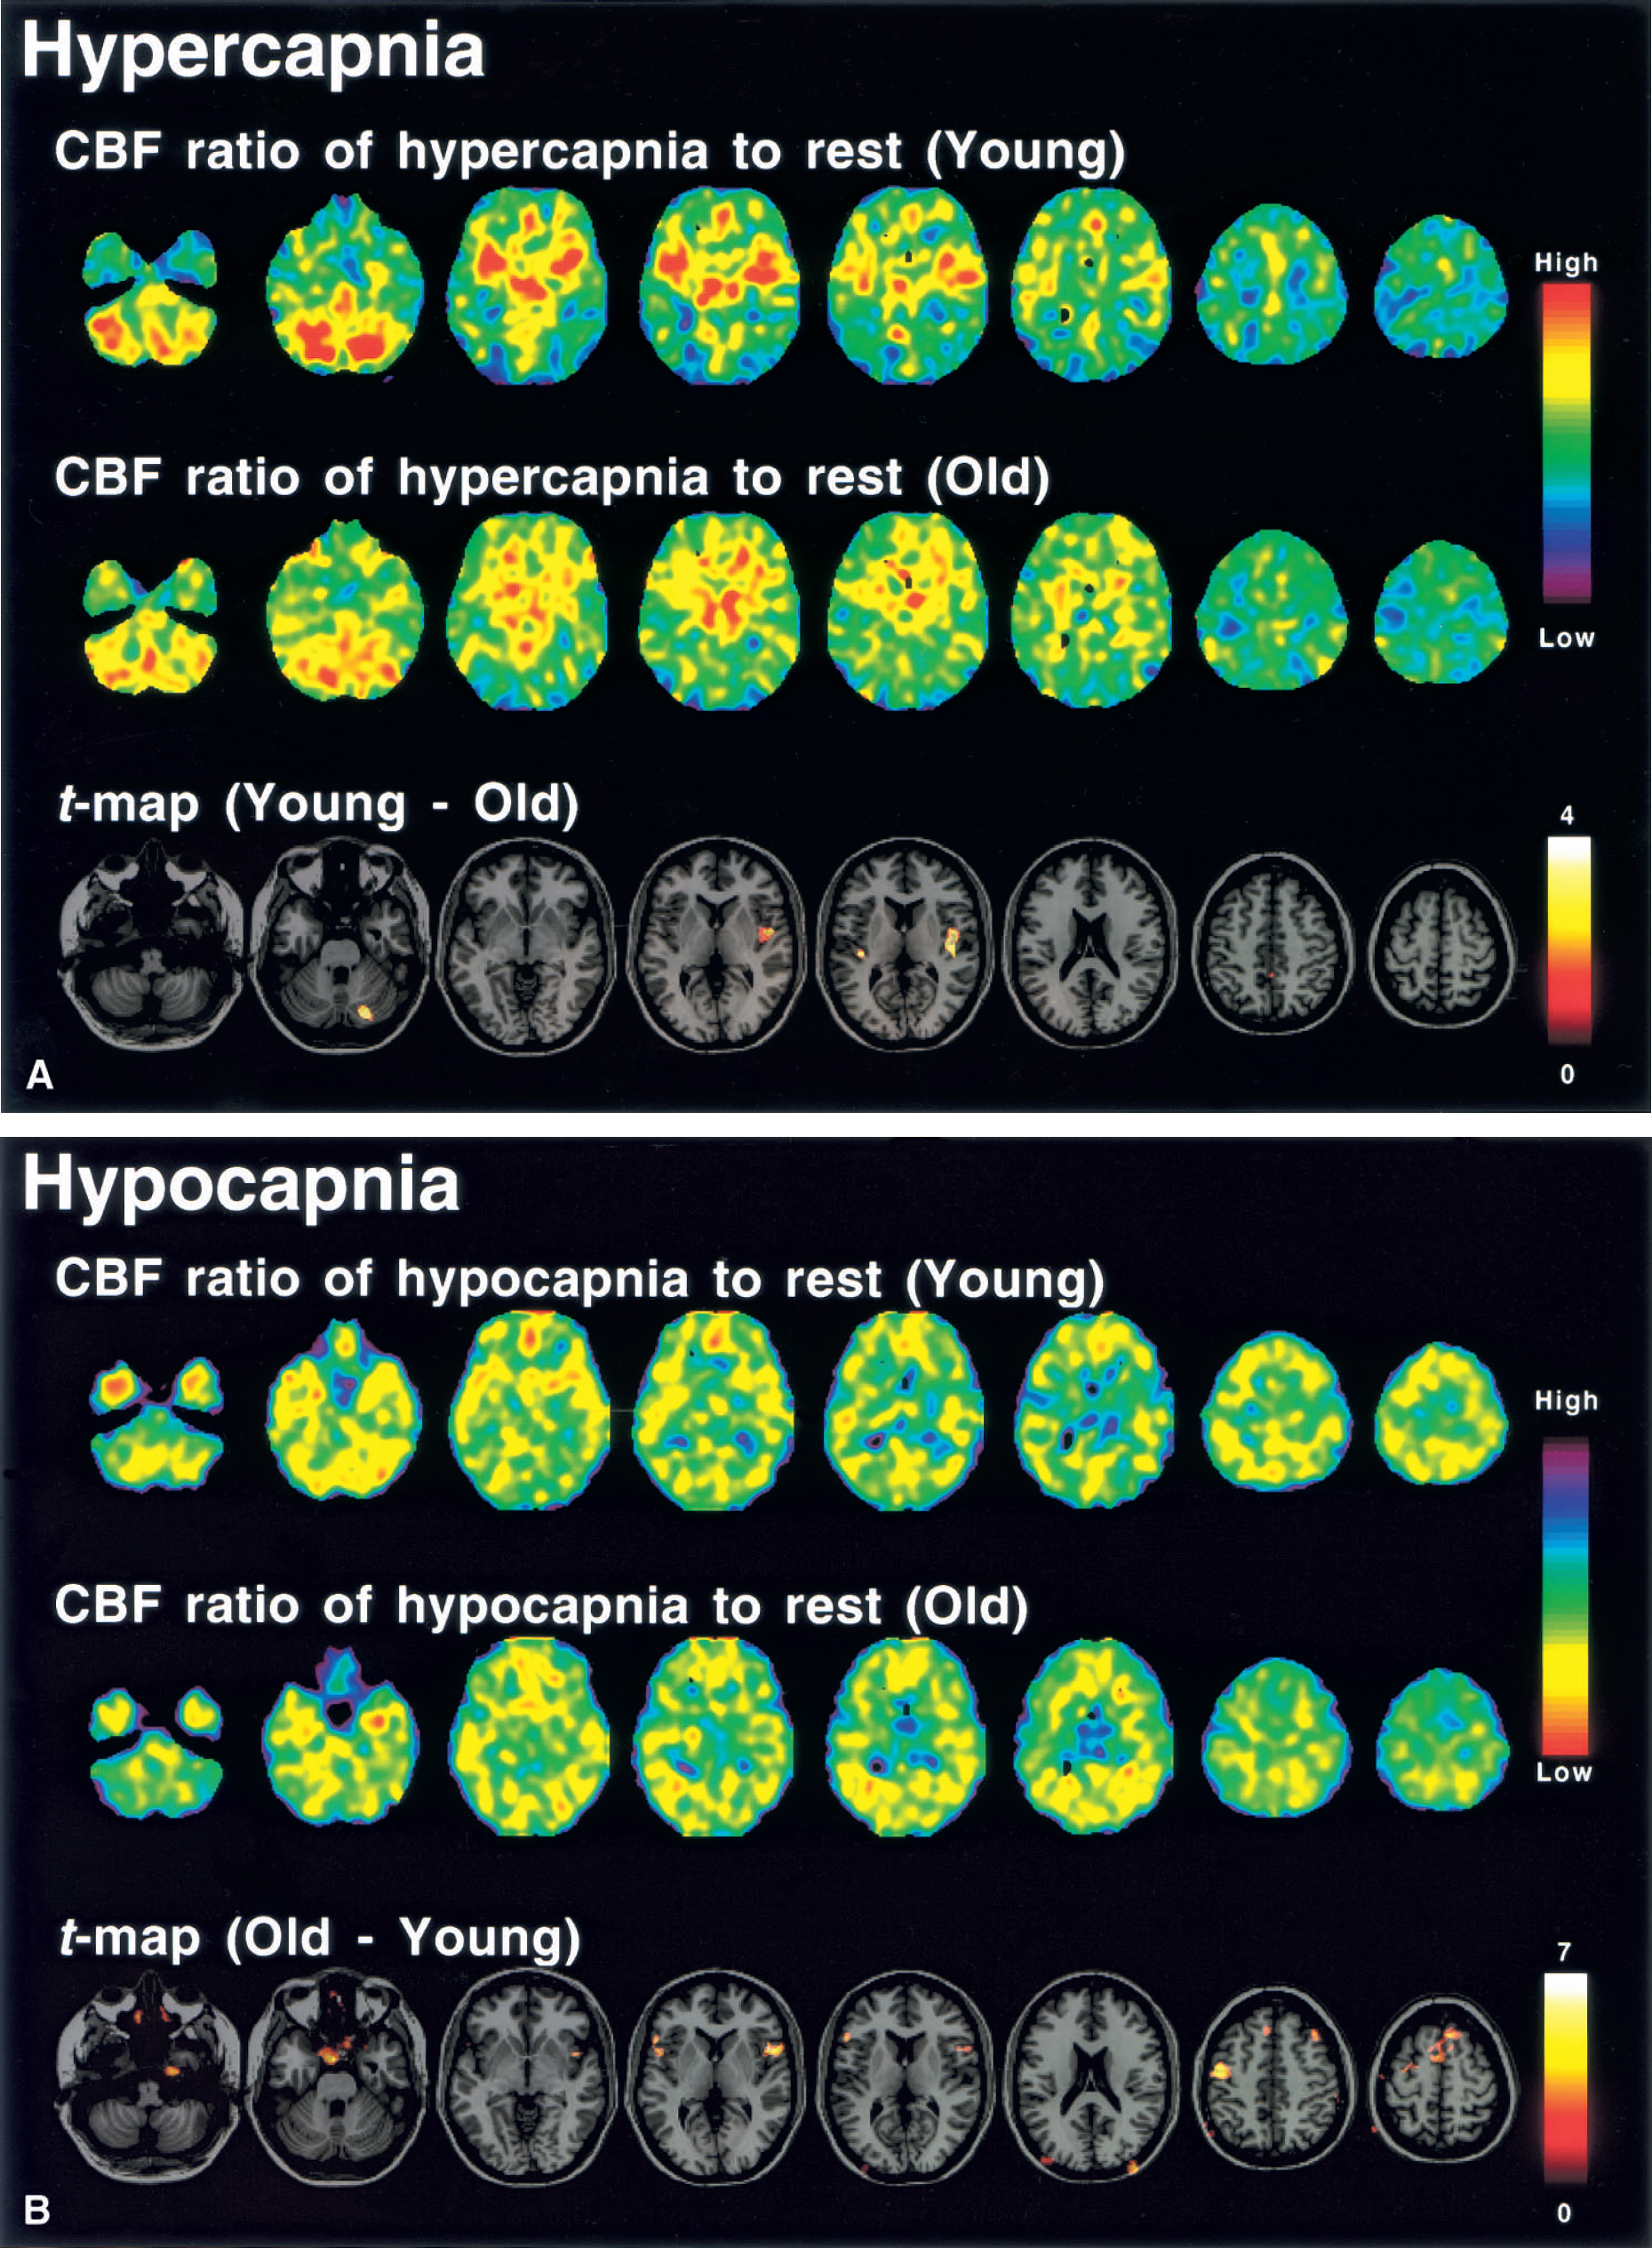
Average images of the CBF ratio during hypocapnia to rest, that have been normalized globally for pixel values, are shown in Fig. 3B. The t-maps of the old minus young age groups for CBF ratio during hypocapnia to rest are also shown in Fig. 3B. In the frontal cortex (superior, middle, and inferior frontal gyrus), the CBF ratio was significantly relatively smaller in the younger age group (P < 0.01), indicating a large absolute change in CBF during hypocapnia in this group.
DISCUSSION
In humans, aging has not been shown to have an effect on the vascular response to hypercapnia (Levine et al., 1994), whereas a significant decrease in the vascular response to hypocapnia with aging has been observed (Yamaguchi et al., 1979). In the present study, no significant differences between young and old subjects were observed in vascular responses to hypercapnia and hypocapnia. This finding may be due to the large interindividual variations in vascular responses. However, a significant decrease in total vascular response with aging was observed. This decrease must be due to sclerotic changes in the cerebral perforating and medullary arteries that occur during the normal aging process. Hypertension, as well as age, is a significant risk factor for arteriosclerosis (Masawa et al., 1994). Sclerotic changes in the cerebral perforating and medullary arteries cause lacunar infarctions and white matter ischemic disease (Fisher, 1969; Furuta et al., 1991). Measurement of vascular responses to changes in Paco2 or vasodilators, such as acetazolamide, in patients with such risk factors can be useful to assess the degree of arteriosclerosis (Kuwabara et al., 1992, 1996).
In our present subjects, blood pressure was significantly higher in the old age group than in the young age group, and therefore, both the upper and lower limits of cerebral autoregulation must be shifted toward a higher pressure in the older subjects (Strandgaard et al., 1975; Strandgaard, 1976). Cerebral vascular responsiveness to changes in Paco2 reflects the range of cerebral autoregulation (Kanno et al., 1988; Nishimura et al., 1999). Decreased total vascular response with aging may indicate that the range over which cerebral autoregulation narrows due to progression of arteriosclerosis. In cerebral autoregulation in older subjects, the upper and lower limits may shift toward a higher pressure with a narrowed range. In addition, sclerotic changes in the cerebral perforating and medullary arteries are reported to causes dysfunction of cerebral autoregulation (Strandgaard et al., 1973).
Previously, we investigated regional differences in cerebral vascular responses to changes in Paco2 on a pixel-by-pixel basis with an anatomic standardization technique (Ito et al., 2000). A significant relative hyperperfusion during hypercapnia was observed in the pons, cerebellum, thalamus, and putamen, indicating a large capacity for vasodilatation in these regions. During hypocapnia, significant relative hypoperfusion was observed in the pons, putamen, temporal cortex, temporooccipital cortex, and occipital cortex, indicating a large capacity for vasoconstriction in these regions. In the present study, ROI analyses revealed large vascular responses during hypercapnia in the pons, cerebellum, thalamus, and putamen in both young and old subjects (Fig. 1A), and large absolute vascular responses during hypocapnia were observed in the pons, putamen, temporal cortex, and occipital cortex in both groups (Fig. 1B). However, age-related changes in the regional distributions of the cerebral vascular responses were observed when pixel-by-pixel analysis with an anatomic standardization technique was used. In the cerebellum and insular cortex, relative changes in CBF during hypercapnia were significantly greater in the young subjects than in the older subjects (Fig. 3A). In the frontal cortex (superior, middle, and inferior frontal gyrus), relative absolute changes in CBF during hypocapnia were significantly greater in the younger subjects (Fig. 3B). Although no significant differences between young and old subjects were observed for vascular responses to hypercapnia and hypocapnia (Fig. 1), the relative capacities for vasodilatation in the cerebellum and insular cortex were larger in the younger subjects, and relative capacity for vasoconstriction in the frontal cortex was also larger in the young age group than in the old age group. Such aging effects should be considered when estimating cerebral perfusion reserve.
In conclusion, total vascular response from hypocapnia to hypercapnia was decreased significantly with normal aging, indicating progression of sclerotic changes in the cerebral perforating and medullary arteries with aging. Measurement of vascular responses can be used to assess the degree of arteriosclerosis in patients with specific risk factors. Because cerebral vascular responsiveness to changes in Paco2 reflects the range of cerebral autoregulation, this range may narrow with aging. According to our anatomic standardization analysis, age-related changes in the regional distribution of cerebral vascular responses were observed. Such aging effects should be considered in the estimation of cerebral perfusion reserve.
Footnotes
Acknowledgments
The assistance of members of the Akita Research Institute of Brain and Blood Vessels in performing the PET experiments is gratefully acknowledged.