
Abstract
The reactions of cerebral metabolism to imposed changes of cerebral blood flow (CBF) are poorly understood. A common explanation of the mismatched CBF and oxygen consumption (CMRO2) during neuronal excitation holds that blood flow rises more than oxygen consumption to compensate for an absent oxygen reserve in brain mitochondria. The claim conversely implies that oxygen consumption must decline when blood flow declines. As the prevailing rate of reaction of oxygen with cytochrome c oxidase is linked to the tension of oxygen, the claim fails to explain how oxygen consumption is maintained during moderate reductions of CBF imposed by hyperventilation (hypocapnia) or cyclooxygenase (COX) inhibition. To resolve this contradiction, we extended the previously published oxygen delivery model with a term allowing for the adjustment of the affinity of cytochrome c oxidase to a prevailing oxygen tension. The extended model predicted constant oxygen consumption at moderately reduced blood flow. We determined the change of affinity of cytochrome c oxidase in the extended model by measuring CBF in seven, and CMRO2 in five, young healthy volunteers before and during COX inhbition with indomethacin. The average CBF declined 35%, while neither regional nor average CMRO2 changed significantly. The adjustment of cytochrome c oxidase affinity to the declining oxygen delivery could be ascribed to a hypothetical factor with several properties in common with nitric oxide.
Keywords
Introduction
Recent explanations of nonlinear flow–metabolism coupling (Buxton and Frank, 1997; Gjedde, 1997, 2002; Gjedde et al, 1999; Vafaee and Gjedde, 2000) claim that the excessively increased cerebral blood flow (CBF) serves to prevent depletion of mitochondrial oxygen when oxygen consumption (CMRO2) rises. Conversely, the explanations imply that it would be impossible for cytochrome oxidase to maintain normal rates of oxygen consumption when blood flow declines, except if increased diffusion capacity for oxygen were to accompany the decline. In contrast, a recent study from this group revealed no effect of moderately lowered blood flow on oxygen consumption in pigs (Rasmussen et al, 2003).
The current models of nonlinear blood flow regulation rest on the premise that oxygen delivery is regulated to maintain a minimum oxygen tension in mitochondria. The authors' version of the model (Gjedde, 1997; Gjedde et al, 1999; Vafaee and Gjedde, 2000) accurately predicted blood flow changes observed in states of increased oxygen consumption (Gjedde and Marrett, 2001; Vafaee and Gjedde, 2000, 2004) and hypothermia (Sakoh and Gjedde, 2003). However, the models fail to predict the constant oxygen consumption observed in states of moderately reduced CBF. The general prediction of the model is an obligatory decrease of oxygen consumption with any decrease of blood flow, but the experimental evidence accumulated over many years clearly indicates that oxygen consumption remains approximately normal in conditions of moderately lowered blood flow (Purves, 1972; Grote et al, 1981; Kanno et al, 1988; Hirano et al, 1994; Moller et al, 2002; Rasmussen et al, 2003).
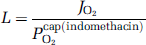
For the model to predict constant oxygen consumption at low CBF, it must account for the tension of oxygen at or near the oxygen binding site of cytochrome oxidase. We linked the mitochondrial oxygen tension to the cytochrome oxidase reaction with a simple Michaelis–Menten expression of the relationship between oxygen flux and enzyme activity. We then tested the properties of the extended model equation by calculating the magnitude of the equation parameters, which would accurately predict the values of oxygen consumption measured in the course of drug-induced lowering of CBF. We used indomethacin, which lowers blood flow, probably by nonselectively inhibiting cyclooxygenase-1 (COX-1) and −2 (Jensen et al, 1991, 1993; Dahl et al, 1996; Imberti et al, 1997; Zonta et al, 2003), although other mechanisms have also been proposed (Wang et al, 1993; Parfenova et al, 1995).
The COX inhibition with indomethacin established the values of key variables of a mechanism formulated to explain the maintenance of constant oxidative brain metabolism in a range of CBF rates by means of adjustment of the affinity of mitochondrial cytochrome c oxidase towards oxygen. The values were shown to be consistent with the known ranges of these variables.
Hypothesis
The experiment tested the hypothesis that constant cerebral oxygen consumption at varying blood flow rates can be maintained by adjustment of cytochrome c oxidase affinity to oxygen.
Theory
A common approach underlies recent predictions of oxygen tension profiles in brain tissue (Buxton and Frank, 1997; Gjedde, 1997). As elaborated by Gjedde (1997) and Vafaee and Gjedde (2000), the key element in the approach is the consideration of the low oxygen tension in mitochondria, ‘low’ meaning quantitatively unimportant as an oxygen reserve in relation to the oxygen tension in brain capillaries. The low tension was verified quantitatively in porcine brain by calculating the average oxygen diffusion distance in brain tissue in relation to the average surface area of capillary (Gjedde et al, 1999). In terms of the affinity constant of cytochrome oxidase, the tension must be consistent with the actual rate of cytochrome c oxidation and hence is not ‘low’ in relation to the properties of the enzyme that obeys Michaelis–Menten-type kinetics.
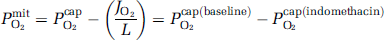
The oxygen supply to the tissue as a whole, integrated over all tissue elements, depends closely on the average capillary oxygen tension, which in turn relates reciprocally to the oxygen extraction fraction (Vafaee and Gjedde, 2000). The average saturation of hemoglobin in brain capillaries is a function of the saturation of arterial hemoglobin and the average extraction of oxygen from the entire length of brain capillaries, as expressed in the following relationship:
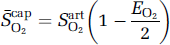
where S−capO2 is the average capillary hemoglobin saturation, SartO2 is the average arterial hemoglobin saturation, and EO2 is the oxygen extraction fraction, equal to the ratio JO2/(FCartO2) between the oxygen consumption (JO2) and the product of the CBF (F) and the arterial oxygen concentration (CartO2) at the arterial oxygen tension (PartO2).
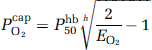
The average capillary oxygen pressure head or average oxygen tension in capillaries (PcapO2) is reflected in the average saturation of capillary hemoglobin, according to the Hill equation of oxygen binding (test):
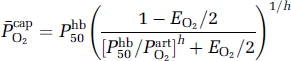
where Phb50 is oxygen's tension when hemoglobin is half-saturated, assumed to be a constant, h is Hill's coefficient. The omission of the ratio (Phb50/PartO2) h , which is very low at normal arterial oxygen tensions in healthy individuals (0.015), approximately compensates for the omission of the physically dissolved oxygen in the calculation of the average capillary oxygen tension. The omission of this term is valid only for values of EO2 that are not much below the physiologic range (R.B. Buxton, personal communication).
Assuming full saturation of arterial hemoglobin and quantitatively negligible oxygen in physical solution in arterial plasma, the minimum oxygen tension in mitochondria can now be calculated as the tension commensurate with the actual delivery of oxygen (test 2):
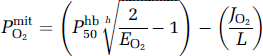
where PmitO2 is the average oxygen tension in mitochondria, and L is the oxygen diffusibility, assumed to be constant in the absence of recruitment. Equations (1) and (2) were combined and solved for the CBF (F),
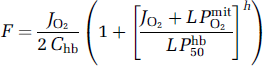
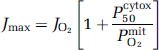
where Chb is the arterial hemoglobin concentration. The equation expresses blood flow as a function of the rate of oxygen consumption and the mitochondrial oxygen tension for a given arterial oxygen concentration. In this relationship, the mitochondrial oxygen tension reflects the balance between the delivery and consumption of oxygen. The tension is given by the simple Michaelis–Menten-type kinetic expression (Gnaiger 1993; Gnaiger et al, 1998):
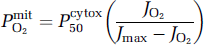
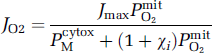
where Pcytox50 is the apparent half-saturation tension of the oxygen reaction with cytochrome oxidase and Jmax is the maximum reaction rate. Equation (4) eliminates PmitO2 from equation (3) and yields an expanded expression of the relations among the primary factors affecting oxidative metabolism:
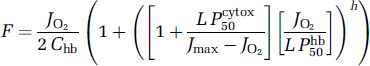
where the independent variables are F, Pcytox50, and Jmax, and the dependent variable is JO2, when Chb and L are constants and arterial blood remains fully saturated. The independent variables may be linked, of course. Equation (5) combines the Hill equation of oxygen saturation of hemoglobin (Hill, 1910, 1913) and the Michaelis–Menten equation of substrate occupancy of an enzyme (Michaelis and Menten, 1913).
A change of a single independent variable by necessity is reflected in the rate of oxygen consumption. If no change of the oxygen consumption accompanies a change of an independent variable, we infer a compensatory change of at least one other independent variable. Thus, invariant JO2 with variable F implies compensatory change of Pcytox50 or Jmax or both. Previous studies of oxygen supply and delivery suggest that the affinity of cytochrome c oxidase changes inversely with the metabolic activity of a tissue, to preserve the sensitivity of the reaction to changes of the maximum velocity (see Brown (2001) for a review of these findings). We hypothesize that a similar change can explain the invariant cerebral oxygen consumption measured during moderate changes of blood flow to the brain.
Predictions
Assuming JO2 to be constant in equations (3)–(5), the adjustment of cytochrome c oxidase's affinity to oxygen yields the following specific predictions of the enzyme's response to reduced blood flow:
Oxygen consumption remains constant during moderate oligemia when the reduction of capillary oxygen tension is matched by decline of the mitochondrial oxygen tension according to equation (3).
Decline of the Michaelis constant of cytochrome c oxidation according to equation (4) can maintain oxygen consumption constant when the mitochondrial oxygen tension is low.
Adjustment of the half-saturation constant of cytochrome oxidase in response to low blood flow implies direct or indirect regulation of oxygen's occupancy of cytochrome c oxidase in accordance with equation (5) when blood flow is low.
Any compensatory mechanism is limited by the maximum achievable oxygen affinity. Below this threshold of minimum blood flow, oxygen consumption must decline as dictated by equation (3) for PmitO2 effectively equal to 0.
Subjects and methods
The study adhered to the Helsinki Declaration V. The Research Ethics Committee of County Aarhus approved the study and the National Drug Administration approved the use of indomethacin in healthy volunteers. Healthy volunteers other than possibly pregnant women were recruited by newspaper advertisement and gave written informed consent to the study on the basis of a detailed description of radiation hazards. Some variables other than CMRO2 before and after the indomethacin administration were reported separately (Østergaard et al, 1998).
Indomethacin was administered intravenously as a bolus of 0.2 mg (kg body weight)−-1 over 3 mins and thereafter as a continuous infusion of 0.2 mg/kg h (Jensen et al, 1996). No subject experienced any adverse effect from the indomethacin administration.
Data Acquisition and Image Analysis
The ECAT Exact HR47 PET camera (Siemens/CTI, Knoxville, TN, USA) was operated in 3D mode. The CBF was measured by brief (in less than 4 s) intravenous bolus injection of 500 MBq [15O]water dissolved in 5 mL saline. CMRO2 measurements were performed after a single breath inhalation of 1 L of oxygen containing 500 MBq [15O]O2 as described by Ohta et al (1992).
Data acquisition began at the time of injection/inhalation and continued for 3 mins (6 frames of 10 secs, 4 frames of 15 secs, and 2 frames of 30 secs). A separate 15-min 68Ga transmission scan for attenuation correction was performed before each of the two sets (before and during indomethacin administration) of emission tomography, between which seven of the nine subjects underwent magnetic resonance (MR) and computed tomography (CT) imaging. For two subjects, all position emission tomography (PET) measurements were performed in one session, and only structural MR imaging was performed. The two PET measurements of CBF before and during indomethacin were placed 50 to 307 minutes apart (average 229 mins). The CMRO2 measurements were placed 31 to 295 mins apart (average 201 mins).
Subjects rested supine with the head fixed in a vacuum pillow. A venous catheter was inserted in the right cubital vein for injection of the tracer and an arterial catheter was inserted in the left radial artery for blood sampling. Twelve arterial blood samples (1 mL each) were taken the first minute and six and three samples during the second and third minutes of scanning, respectively. The blood samples were counted for 20 secs (Cobra II, Packard, Frankfurt, Germany) to provide an arterial input function for the calculation of the absolute flow maps. Arterial blood variables (pH, PartO2, Chb, and HCO−-3) were measured (ABL-300, Radiometer, Copenhagen, Denmark) before and after each emission scan.
The PET volumes (47 sections of 3.1 mm) were reconstructed by filtered backprojection using the measured attenuation and scatter correction and filtered to a resolution of 4.6 mm full-width at half-maximum (FWHM) (Hann filter cutoff 0.5 per pixel).
For anatomical localization and coregistration, a T1-weighted, 3D MR brain image was acquired in each subject, covering 124 slices of 1.5 mm using a 3D-FAST-SPGR-sequence with flow compensation, (TE = 4 ms; TR = 24 ms) on a 1.0 T GE Signa MR scanner (GE Medical Systems, Waukesha, WI, USA).
Estimates of CBF and CMRO2 were determined for every image volume element (voxel) by fitting the PET data to a two-compartment model using nonlinear, least-squared regression analysis as described by Ohta (Ohta et al, 1992, 1996). The parametric image volumes were then smoothed with a Gaussian filter to an isotropic resolution of 12 mm FWHM. The smoothed images were used to spatially normalize the image volume by automatic coregistration (Neelin et al, 1993; Collins et al, 1994) to each subject's MR brain image (Collins et al, 1994) and into the standard Talairach coordinate system (Talairach and Tournoux, 1988). The Automated Image Registration package (AIR; Woods et al, 1992, 1993) was used for spatial alignment between the PET volumes.
Calculations
Stepwise calculation of the equation parameters proceeded as follows:
(1) The oxygen extraction fractions (EO2) at baseline and during indomethacin administration were calculated from the measurements of oxygen consumption and blood flow:

(2) The mean capillary oxygen tensions at the control condition (baseline) and during indomethacin administration were calculated from equation (1):
(3) The oxygen diffusibility (L) was assumed not to change at any measured blood flow level, because of the absence of capillary recruitment in human brain (Gobel et al, 1989; Kuschinsky and Paulson 1992; Vogel et al, 2004). At the highest oxygen extraction fraction compatible with normal oxygen consumption (EO2 ≈ 0.55, see Discussion), PmitO2 ≈ 0. At this extraction fraction, the oxygen diffusibility (L) was calculated as the value associated with the measured oxygen consumption according to equation (3) for PmitO2 = 0:
(4) At the normal blood flow baseline, the mitochondrial oxygen tension was calculated according to equation (2), using the value of L calculated above:
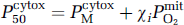
(5) Also at the normal blood flow baseline, the maximum reaction velocity (Jmax) was calculated as the velocity consistent with the known physiologic half-saturation tension of 0.5 mm Hg (Gnaiger et al, 1998), according to equation (4):
in which the Pcytox50/PmitO2 ratio effectively is constant when the value of Pcytox50 is adjusted to the value of PmitO2.
Statistical Analysis
Volume of interest analysis: For comparison of CBF, CMRO2, EO2, PcapO2, L, and PmitO2 in ten volumes of interest (VOI) with a preponderance of gray matter in each hemisphere were drawn manually on the average MR brain image of the nine subjects. In the standard reference space, the same 20 VOIs were applied to the high-resolution PET data (4.6 mm FWHM) of CBF, CMRO2, and EO2, acquired before and during indomethacin administration. The average values were calculated as an average of the values obtained in the 20 VOIs.
Voxel analysis: The volume images acquired before and during indomethacin administration were also compared statistically voxel-by-voxel after the spatial normalization described above. To compensate for interindividual variation, the low-resolution PET data (12 mm FWHM) were used for this direct statistical voxel-by-voxel analysis. Because the purpose of the voxel analysis was to detect deviations from the average overall decrease in CBF and CMRO2, maps were normalized to mean values of 100 for this analysis. An initial t-statistic analysis was applied to the difference CBF and CMRO2, maps (rest maps subtracted from the indomethacin administration maps) on a voxel-by-voxel basis initially assuming a Gaussian random field with zero mean and a unified standard deviation (Worsley et al, 1992). The analysis showed that the s.d. was not uniform across the brain and therefore required a subsequent analysis of the local voxel-s.d. Searching gray matter (500 mL), significance corrected for multiple comparisons (P<0.05) was reached at t>4.3 for the unified-s.d. and t>13 for the voxel-s.d. for 12 mm FWHM and n = 7 (Worsley et al, 1992, 1996).
Results
Subjects
Nine subjects were PET scanned before and during indomethacin administration. Two CBF scans were unusable because of technical problems. The CBF data analysis included the seven remaining subjects (three women, four men of mean age 27+4 (s.d.) years, range 21 to 32 years). For two subjects the first oxygen scan, and for another two subjects the last oxygen scan were similarly unusable because of technical problems. Values of CMRO2 before and during indomethacin administration were available in the remaining five subjects (two women, three men aged 27+4 years, range 22 to 32 years). Therefore, measurements of both variables were available in only four subjects. Comparisons were made both for the seven subjects with CBF measurements and the five subjects with CMRO2 measurements, as well as for the four subjects in whom both measurements were made, and the results of the comparisons did not differ.
The arterial blood gases did not change during or between scans or during the study as a whole, as shown in Table 1 (P>0.5 for all comparisons).
Arterial pH, blood gases, and HCO−3 before and during indomethacin administration (mean+s.d.)
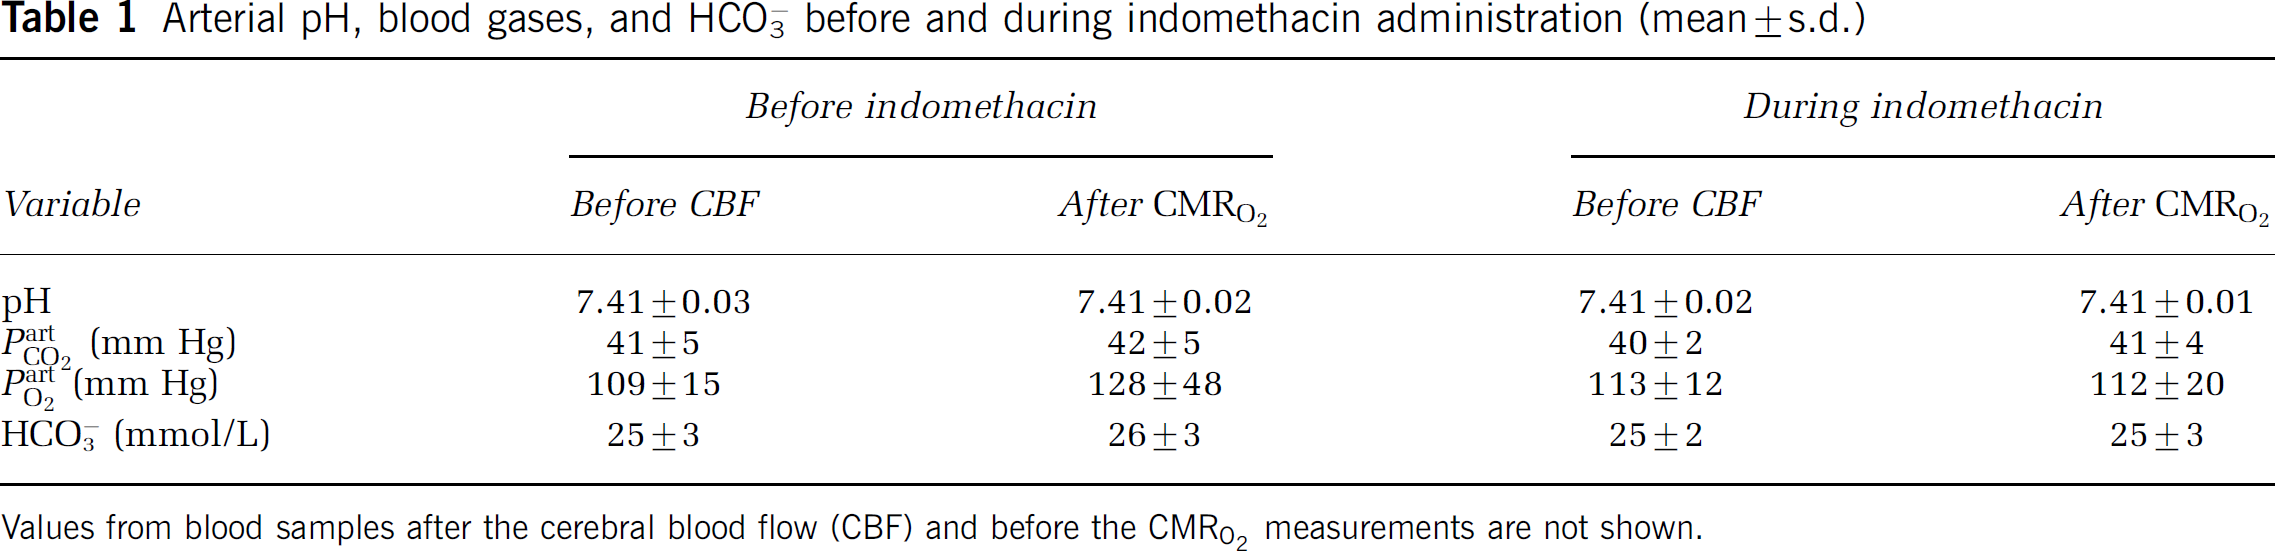
Values from blood samples after the cerebral blood flow (CBF) and before the CMRO2 measurements are not shown.
Blood Flow
Volume of interest analysis: The average CBF of 20 VOIs declined 35% from 62 to 40 mL/hg min (P<0.001), based on the VOI analysis (Table 2). Within subjects, the average reduction varied from 15% to 47%. In gray matter including the deep nuclei, the average CBF declined 35% from 64.8 to 42.1 mL/hg min. In white matter, CBF declined 36% from 47.5 to 30.6 mL/hg min. The average mean CBF values are listed in Table 2. Across subjects, the CBF reduction appeared uniform; no VOI sustained a CBF increase in any subject. The standard deviation of the percent CBF reductions among subjects in the VOIs of 20 different regions varied from 9.4 to 18.2. Across whole brain, the variation of the CBF reduction was randomly distributed, indicating no targeted indomethacin effect in any brain region. An extreme range of reductions were observed in the left thalamus, ranging from 4% to 54%. In no region did the CBF approach the conventionally accepted ischemic threshold of 20 mL/hg min (Purves, 1972; Furlan et al, 1996; Marchal et al, 1996).
Average means of arterial hemoglobin concentration (mmol/L), cerebral blood flow (CBF) (mL/hg min), and CMRO2 (μmol/hg min), based on values from 20 predominantly gray matter VOIs before and during indomethacin administration (mean+s.d.)
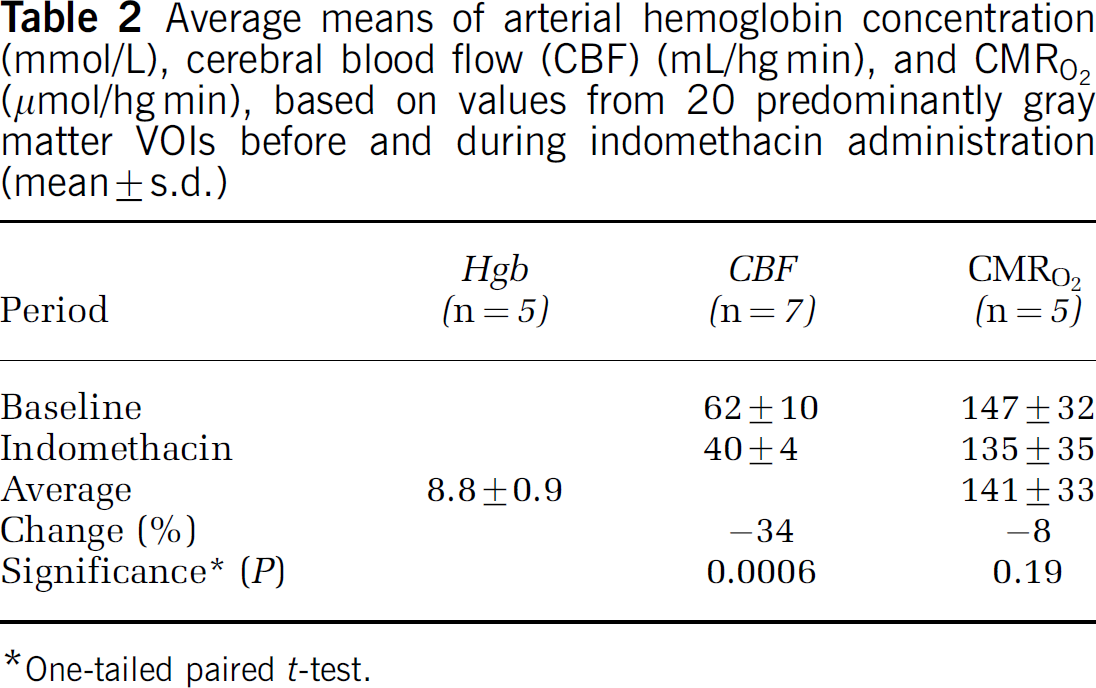
One-tailed paired t-test.
Voxel analysis: Maps of CBF before and during indomethacin administration are shown in Figure 1. Based on the pooled s.d. of all intracranial voxels, after global normalization, the statistical analysis of regional CBF change in each voxel revealed the sites of relatively increased CBF in the primary visual cortices as shown in Figure 2 (lingual gyri, BA 18), as well as the left hippocampus, both thalami, and the mid-portion of the cingulate gyri (Table 3). The changes in the latter regions are not seen in the section shown in Figure 2. Based on individual-voxel s.d., after correction for multiple comparisons, the analysis revealed significant relative CBF increases in the mid-portion of the right cingulate gyrus, right thalamus, and right lingual gyrus (Table 3). After normalization, sites of significantly decreased CBF were seen only bilaterally in extracerebral tissue, anteriorly and laterally to the temporal lobes.
Cerebral sites with locally increased normalized cerebral blood flow (CBF) with the t-statistic calculated with both the global unified s.d. and the local voxel s.d.
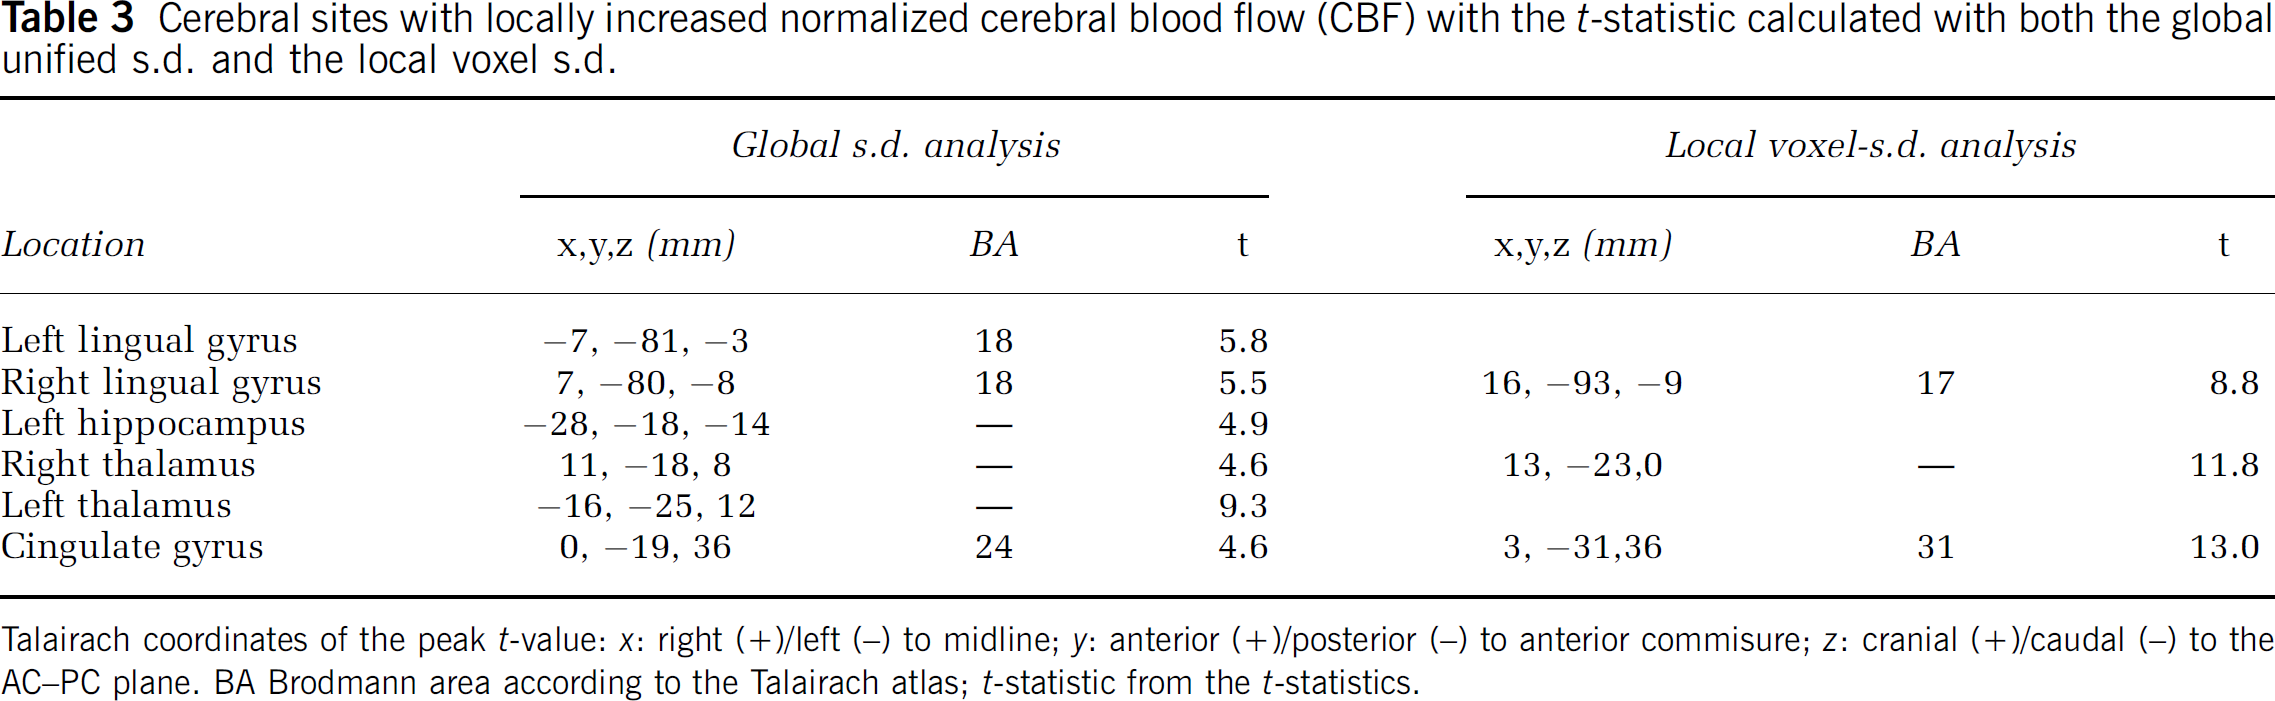
Talairach coordinates of the peak t-value: x: right (+)/left (−) to midline; y: anterior (+)/posterior (−) to anterior commisure; z: cranial (+)/caudal (−) to the AC−PC plane. BA Brodmann area according to the Talairach atlas; t-statistic from the t-statistics.
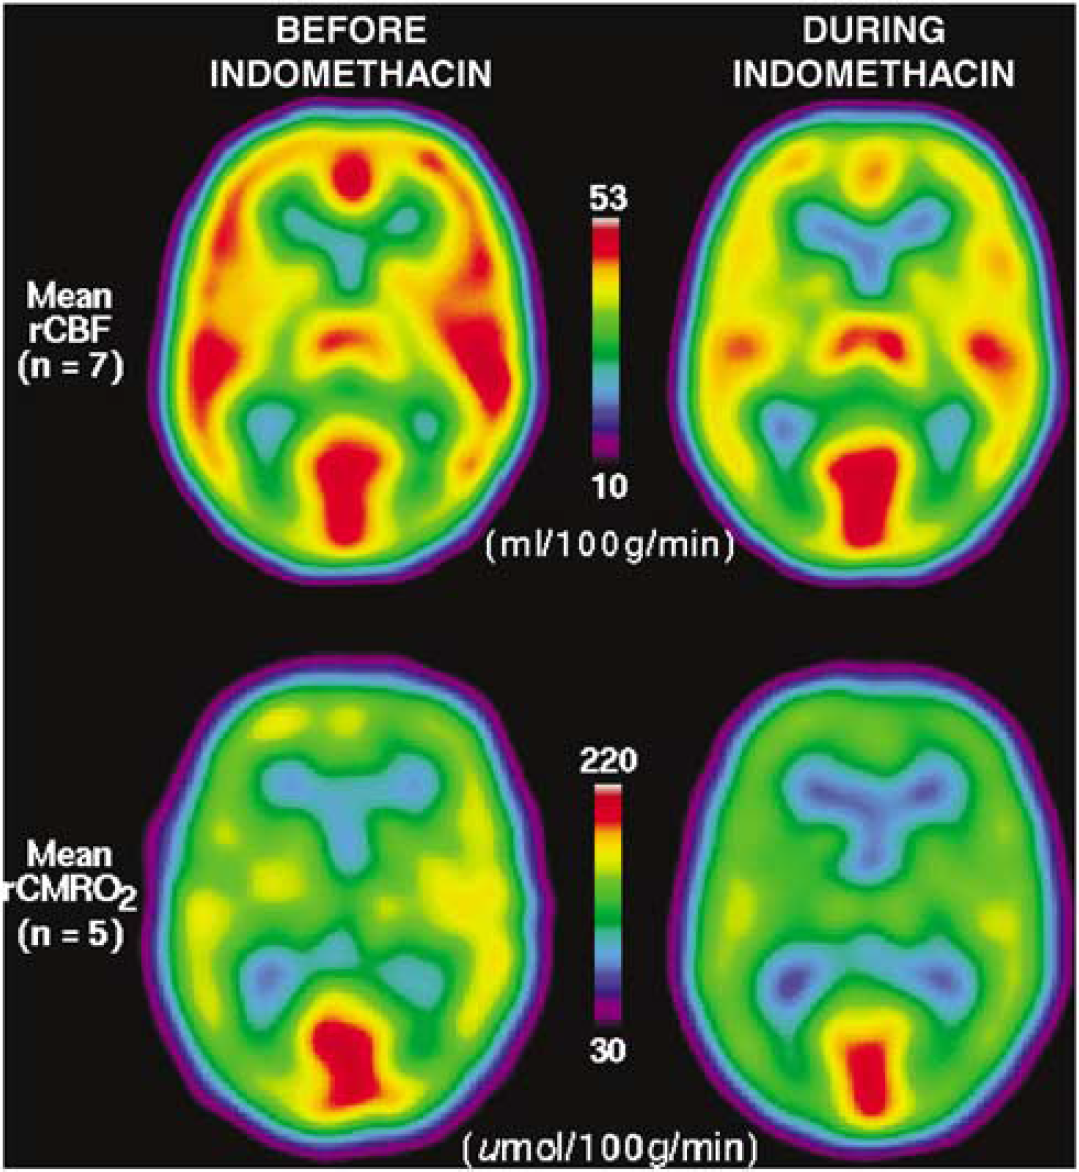
Transaxial sections of average cerebral blood flow (CBF) (top) and CMRO2 (bottom) maps, before (left) and after (right) indomethacin administration. Scaling of maps is the same before and during indomethacin. Sections are spatially synchronized at Talairach coordinates (x, y, z) −5, −35, 10 mm.
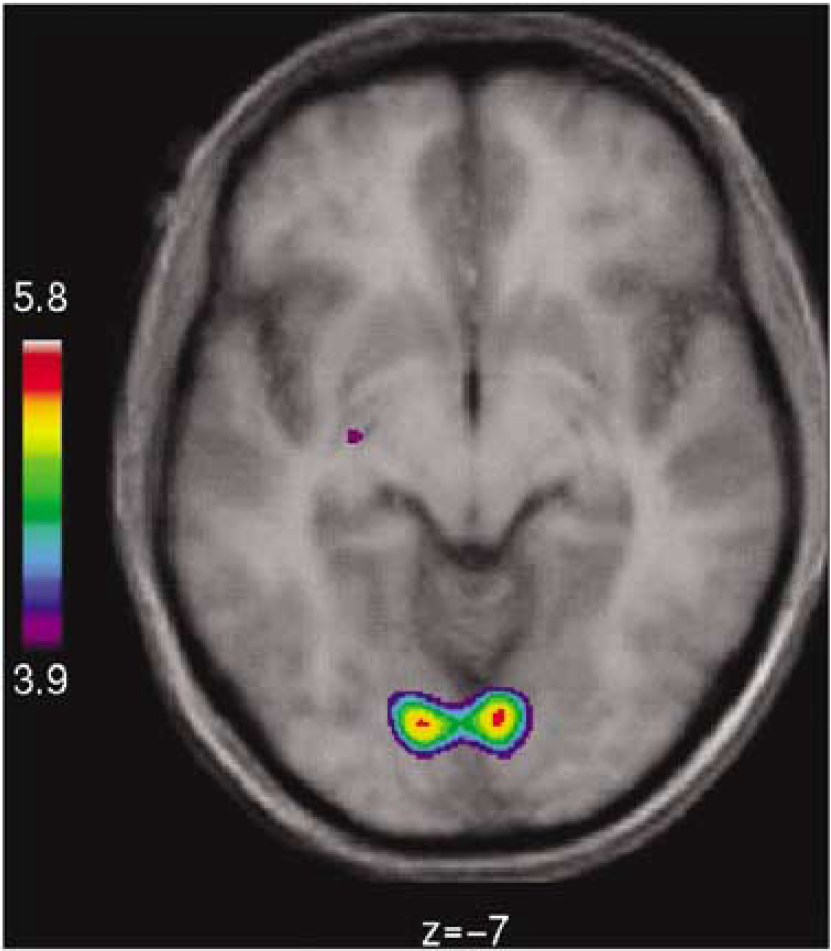
Section (z = −7 mm) of 3D matrix of change of cerebral blood flow (CBF) associated with indomethacin administration, based on pooled s.d. of all intracranial voxels after global normalization of CBF value of each voxel. Statistical analysis of CBF change in each voxel revealed significantly increased CBF shown for primary visual cortex (left and right lingual gyri, BA 18), as well as hippocampus, both thalami, and mid-portion of cingulate gyrus (Table 3).
Oxygen Consumption
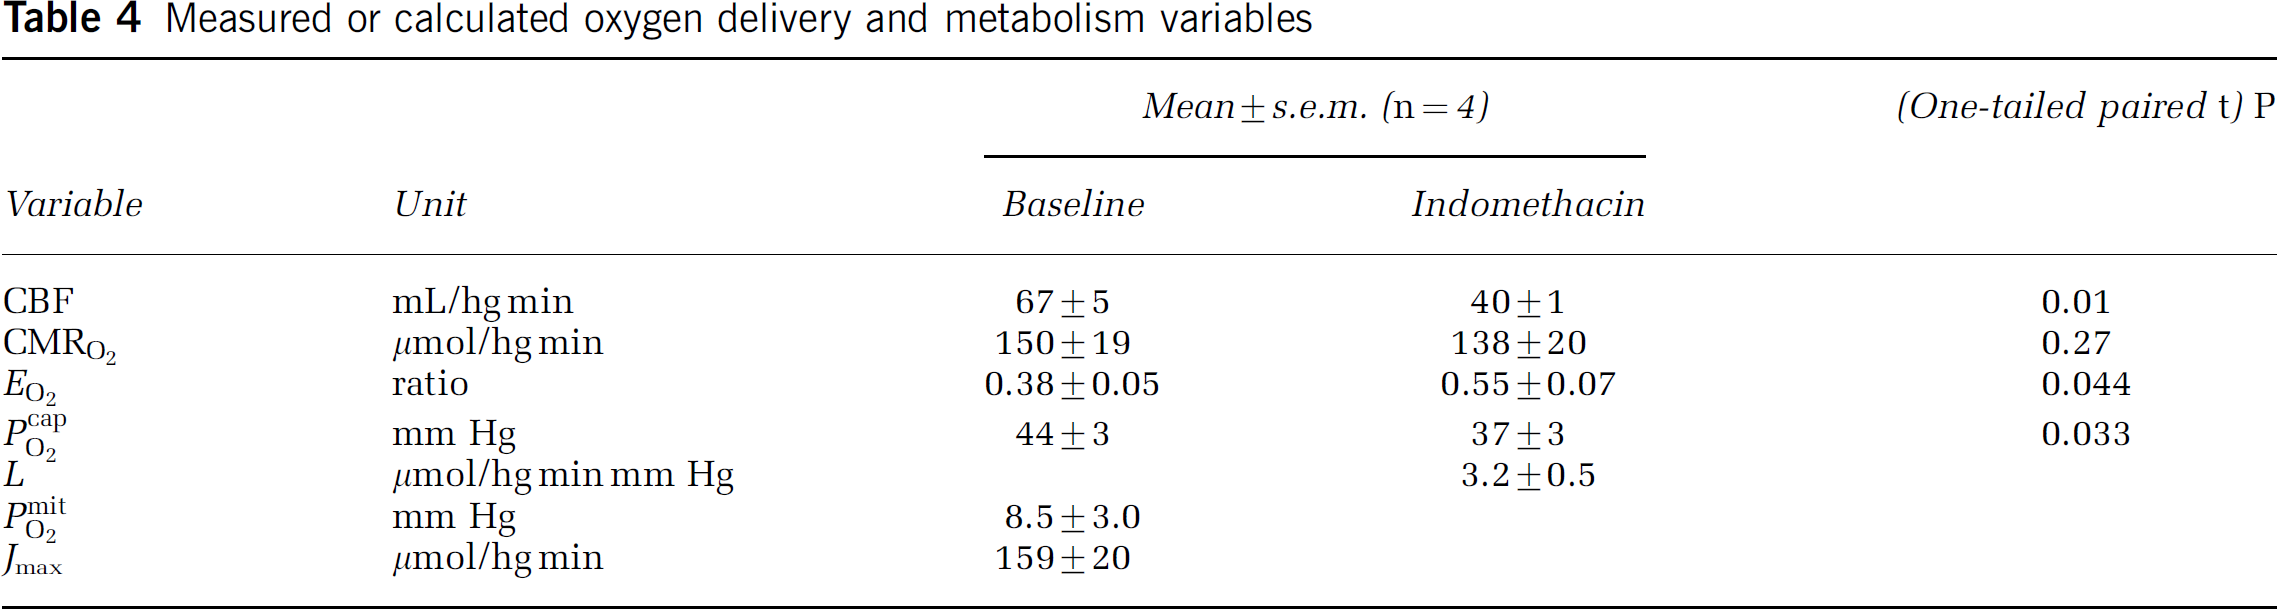
Volume of interest analysis: The average CMRO2, determined as the weighted average of the regional CMRO2 in VOI (Table 2), was unaltered during indomethacin administration with an insignificant (P = 0.4) average decrease from (mean+s.d.) 147+32 to 135+35 μmol/hg min among the subjects. The average CMRO2 change within subjects varied between −35% and +15%. There were no differences between gray and white matter. In the 20 different regions, the standard deviations of the percent CMRO2 reductions among subjects varied from 7.6 to 35.2. The average subject values of CBF, CMRO2, EO2, PcapO2, as well as the hemoglobin concentration, based on the VOI analysis, are listed in Table 2. The average EO2 increased 45% from 0.38 to 0.55 (Table 4). The increase in EO2 was significant (P<0.04; one-tailed paired t-test).
Measured or calculated oxygen delivery and metabolism variables
Voxel analysis: The average CMRO2 maps before and during indomethacin administration are shown in Figure 1. The voxel-based statistical analysis revealed no significant changes of CMRO2, irrespective of the use of absolute or normalized values, despite the apparent decline suggested by the color coding of the figure.
Flow-metabolism couple: The model-derived parameters were calculated according to equations (6)–(10) for the four subjects in whom both blood flow and oxygen consumption measurements were completed. The calculations yielded values for the average capillary oxygen tension PcapO2, the oxygen diffusibility L, the mitochondrial oxygen tension PmitO2 at the normal baseline, and the maximum reaction rate of cytochrome oxidase Jmax. The results are listed in Table 4. The oxygen extraction fraction of 0.55 was deemed to approximate the generally reported threshold of 0.56 to 0.59 (see Discussion). With a Michaelis constant of 0.5 mmHg, the PmitO2/Pcytox50 ratio at baseline was 17, signifying cytochrome oxidation very close to saturation.
Equation (5) predicts the blood flow rates that are sufficient to support a constant rate of oxygen consumption, given a constant ratio between Pcytox50 and PmitO2 when the values of the experimentally estimated parameters Jmax and L listed in Table 4 are inserted into the equation. The predicted relationship between blood flow and the variable Pcytox50 of Eq. (5) is shown in Figure 3 for the constant rate of oxygen consumption of 141 μmol/hg min measured in the 10 subjects. The lower limit of Pcytox50 was fixed at 0.05 mm Hg, as determined by Chance (1976) for cytochrome oxidase in vitro.
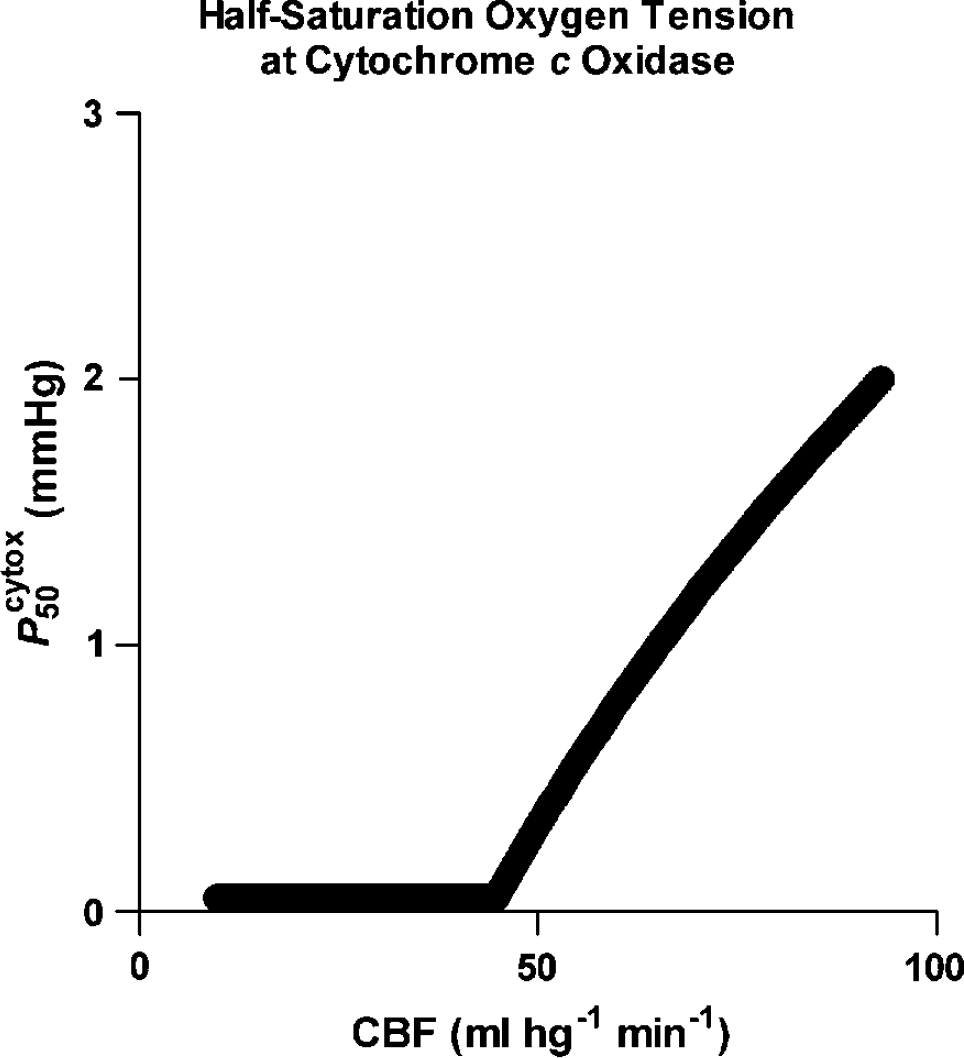
Relationship between Pcytox50 and CBF (mL/hg min) calculated from equation (5) and parameter estimates listed in Table 4 for a constant oxygen consumption rate of 141 μmol/hg min. Magnitude of Pcytox50 was assumed not to decline below 0.05 mm Hg. Abscissa: CBF (mL/hg min). Ordinate: Pcytox50 (mm Hg).
In the predominantly gray matter volumes, blood flow rates below 45 mL/hg min failed to sustain the normal rate of oxygen consumption and predicted a declining ratio of PmitO2 to Pcytox50, reaching 2 at 20 mL/hg min and 1 at 10 mL/hg min, at which the oxygen extraction fraction reached unity. Given the parameter values listed in Table 4, Figure 4 shows the regression of Eq. (5) to the measured average rate of oxygen consumption of 141 μmol/hg min, measured in the 10 subjects for blood flow rates ranging from 10 to 95 mL/hg min.
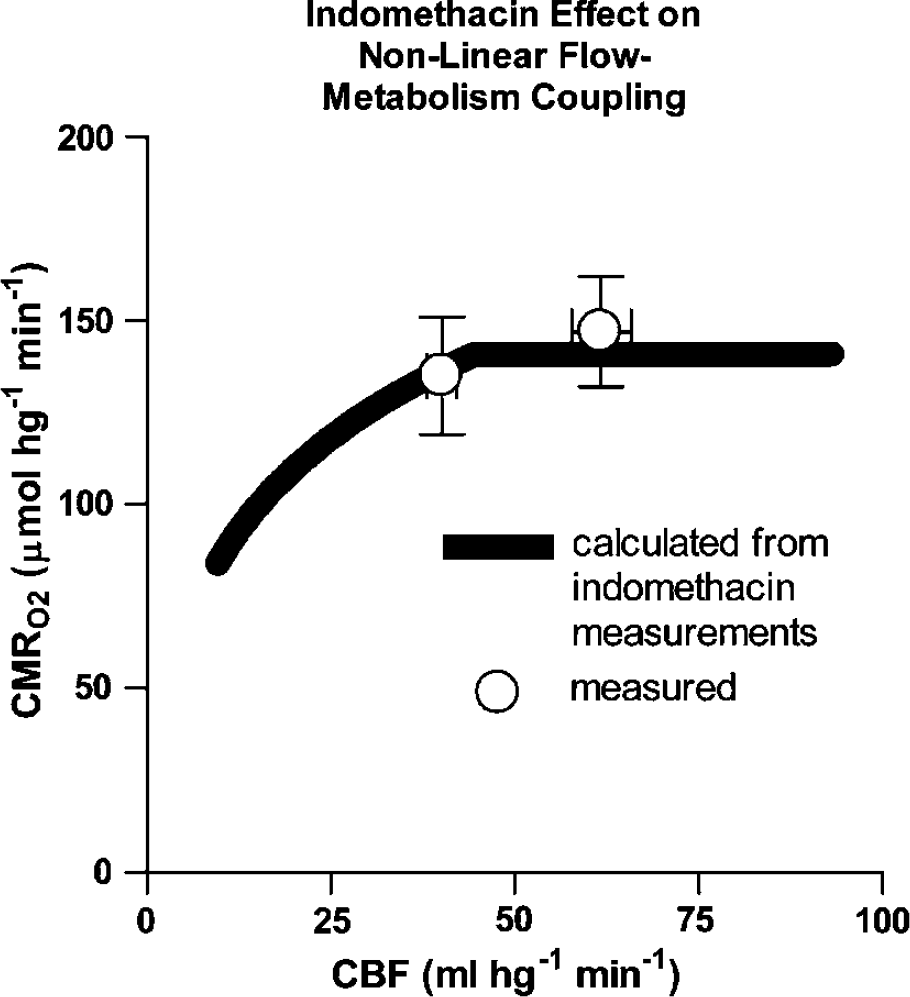
Extended nonlinear flow-metabolism couple according to equation (5) calculated from equation parameters listed in Table 4 and determined from experimentally observed means of CBF (mL/hg min) and CMRO2 (μmol/hg min) before and during indomethacin administration, using relation between CBF and Pcytox50 shown in Figure 3. Abscissa: CBF (mL/hg min). Ordinate: CMRO2 (μmol/hg min).
Figure 5 shows the effect of changing the value of Jmax listed in Table 4. Changes of Jmax had no effect on oxygen consumption at blood flow rates below the blood flow threshold of 45 mL/hg min. Above this threshold, the effect depended on the magnitudes of both blood flow and Jmax, that is, the higher the blood flow, the greater the effect of a change of Jmax. The graph made the important prediction that Jmax values below normal may reverse the relationship between blood flow and oxygen consumption, paradoxically causing oxygen consumption to rise at low blood flow rates.
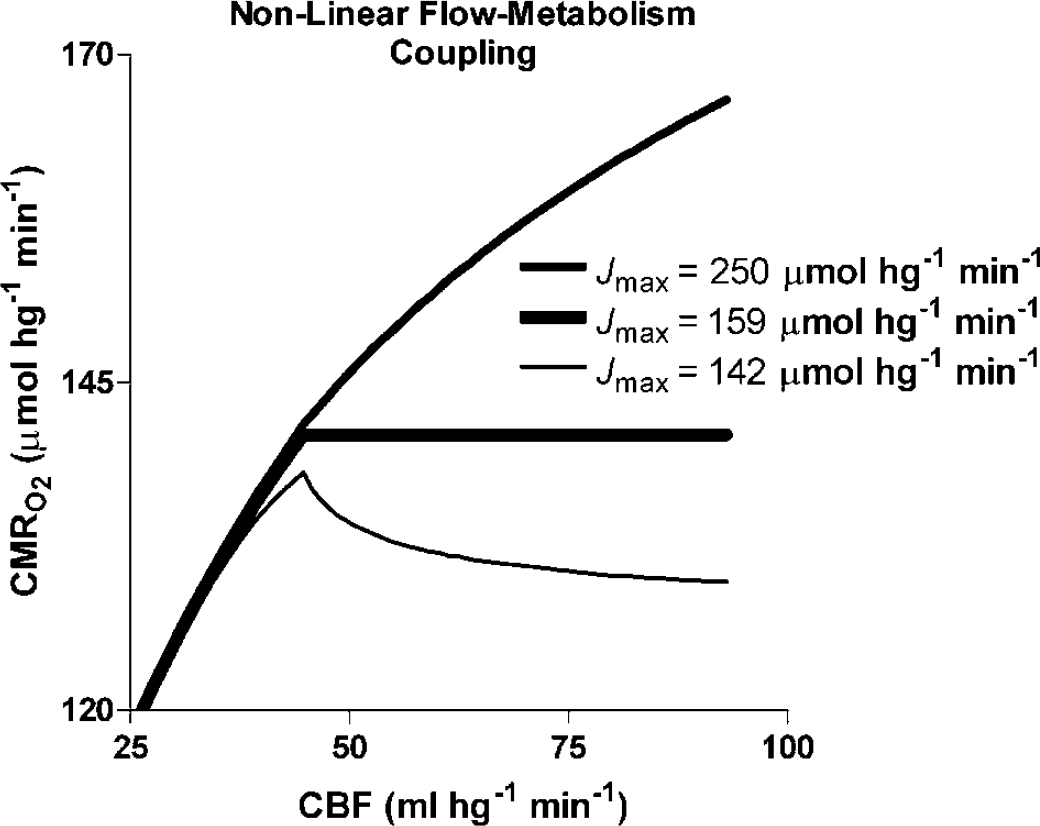
Extended nonlinear flow–metabolism couple according to equation (5) with parameters listed in Table 4 as function of F and Pcytox50 relationship shown in Figure 3, for each of three magnitudes of maximum cytochrome c oxidation rates (Jmax) listed in graph. Abscissa: CBF (mL/hg min). Ordinate: CMRO2 (μmol/hg min).
Discussion
The normal baseline values of CBF were higher than conventionally reported for whole brain. We ascribe the higher values to the voxel mapping and the predominance of gray matter in the selected cortical regions. In voxel mapping, average regional CBF and CMRO2 values are computed from values of individual voxels, for which the exponential regression may yield lower signal-to-noise ratios.
Effect of Indomethacin on cerebral blood flow
The study confirmed that the nonselective COX inhibitor indomethacin potently reduced CBF, probably by inhibiting prostaglandin synthesis and constricting precapillary resistance vessels (Castellano et al, 1998; Rasmussen et al, 2003). The average reduction of CBF was 35%. Similar reductions were found in previous human studies using indirect methods (Wennmalm et al, 1981; Hemler et al, 1990; Jensen et al, 1993, 1996). The findings are also similar to the result of the only previous tomographic study showing 28% to 40% reduction of CBF in baboons, depending on the region (Schumann et al, 1996).
The effect of indomethacin administration on CBF was measured by the 133xenon method in adults (Amano and Meyer, 1981; Jensen et al, 1996) and by the Doppler flow method in children (Austin et al, 1992; Hemler et al, 1990; Nitter et al, 1995) and animals (Nilsson et al, 1995). By itself, xenon causes CBF globally to increase, but significant changes are seen only at high concentrations such as those used to obtain Xe-CT-images.
Both the VOI and voxel-based analyses indicated that no single region was differentially vulnerable to CBF reduction during the indomethacin administration. When the standard deviation of CBF varies across the spatial extent of the brain, assumptions of the standard brain mapping methods are no longer fulfilled (Worsley et al, 1992), and the pooled s.d. cannot be used to assess significance. In these cases, the statistical analysis of the data must use the normalized CBF values and the s.d. of each voxel. The correction for multiple comparisons further increased the significance threshold of the t-statistic. Nevertheless, the analysis revealed a significant relative increase of the normalized CBF, and thus a smaller absolute decrease in the cingulate cortex and less significantly also in the visual cortex and the thalamus, suggesting that these regions were less affected by the indomethacin-induced CBF changes.
Effect of Indomethacin on CMRO2
The present study revealed no effect of the lowered CBF on CMRO2 in humans. Previous animal studies of the effects of indomethacin on CMRO2 gave conflicting results of no change (Dahlgren et al, 1981; Pickard and MacKenzie, 1973) or reduction (Nowicki et al, 1987). The only tomographic study on living animals (Schumann et al, 1996), found no change of the global CMRO2 but interestingly (see below) a small and significant increase of CMRO2 in thalamus and pons. In adult humans, the effect of indomethacin on CMRO2 was assessed only by the arterio-venous difference (Wennmalm et al, 1981; Jensen et al, 1991; Dahl et al, 1996; Bundgaard et al, 1996) and no significant change was observed in any of these studies. However, a study of preterm infants with near-infrared-spectroscopy of cytochrome oxidase indicated reduced oxygenation (Benders et al, 1995).
Neither the average nor the regional CMRO2 changed significantly as a result of indomethacin administration in this group of young healthy subjects. We found a nonsignificant average decline of CMRO2 in both gray and white matter of approximately 10%, but with very large variability among subjects and VOIs. The present study did not confirm any significant local changes, regardless of whether absolute or normalized CMRO2 values were compared. Although the CMRO2 analysis could be completed in only five of the eight subjects studied in the present study, significant average change of CMRO2 can be ruled out with a high degree of certainty.
It is well known that the average oxygen consumption of brain tissue is maintained at the normal level during moderate declines of blood flow (e.g., Purves, 1972; Grote et al, 1981; Kanno et al, 1988; Hirano et al, 1994; Moller et al, 2002; Rasmussen et al, 2003). The threshold of this homeostatic mechanism is reached when EO2 exceeds 0.56 to 0.59 (Nemoto et al, 2002). The current models of constantly maintained mitochondrial oxygen reserves do not explain this ability of cytochrome oxidase to maintain normal oxygen consumption when the oxygen tension is reduced by diminished delivery. To explain this ability, the authors incorporated a simple Michaelis–Menten expression into their model of flow–metabolism coupling and tested the response to low blood flow by means of indomethacin infusion. The analysis revealed a physiological mitochondrial tension of 8.5 mm Hg, on assumption of constant oxygen diffusion conditions, including absent recruitment of capillaries. The absence is well supported for physiologic conditions, but it is unclear whether it extends to nonphysiologic states below the threshold of flow-limitation of oxygen consumption (Gobel et al, 1989, Kuschinsky and Paulson, 1992; Vogel et al, 2004).
Nonlinear Flow–Metabolism Coupling
A key factor in the present extension of the nonlinear flow–metabolism coupling is the cytochrome oxidase affinity. At low blood flow rates, this factor controls the sensitivity of oxygen consumption to depletion of mitochondrial oxygen at the prevailing cytochrome oxidase activity, as noted in previous reports of variable cytochrome oxidase affinity (Brown and Cooper 1994; Brown 1995; Gnaiger et al, 1995, 1998; Brown, 2001).
The theory of nonlinear flow–metabolism coupling predicts that incommensurate changes of blood flow must accompany changes of oxygen consumption, but it fails to predict the changes of metabolism when blood flow changes are imposed by external factors. The present extension of the authors' model shows that oxygen consumption remains normal only if the affinity of cytochrome oxidase is adjusted to the prevailing oxygen tension when the maximum rate of cytochrome c oxidation (Jmax) is constant. The model also shows how and when the changes of oxygen consumption are limited by the magnitude of blood flow. In the extended model, increase of blood flow appears to be a necessary but not sufficient condition for increase of metabolism (Vafaee and Gjedde, 2004). The model makes two important predictions that are the results of the primary but separate role of flow adjustment:
First, provided the flow is maintained above the threshold identified in the present study, oxidative metabolism may, in principle, vary independently, within the limits set by the reaction rate of cytochrome oxidase. This means that transient changes of oxygen consumption may exceed the immediate changes of blood flow that follow prior flow adjustment, as recently observed in studies by PET (Vafaee and Gjedde, 2004) and near-infrared spectroscopy (Chance and Nioka, 2004).
Second, the model makes the unexpected prediction that the relationship between oxygen consumption and blood flow may be inverted at blood flow rates above the threshold if the maximum rate of cytochrome c oxidation is low. The reason for this paradox is cytochrome oxidase's affinity towards oxygen, which rises more than the oxygen falls when blood flow approaches the limit of sufficient delivery. This prediction has been verified independently in reports of elevated CMRO2 in brain tissue under ischemic stress in patients with an oxygen extraction at or slightly below the limit of sufficient delivery (Nariai et al, 2001, Nemoto et al, 2002, 2004).
Single Common Factor?
The question of the agent responsible for the adjustment of cytochrome oxidase affinity in response to a change of blood flow cannot be answered with certainty because many factors play a potential role. These factors were discussed in details by Gnaiger et al (1998), who predicted several of the properties of nonlinear flow–metabolism coupling evaluated in the present study. Among the factors that may contribute to the decline of affinity in response to elevated mitochondrial oxygen tension, cited by Gnaiger et al (1998), is the access of oxygen to the cytochrome oxidase binding site. Jointly, these factors must possess at least two properties to account for the measured effect.
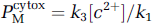
First, the factor(s) competively or noncompetitively must modulate the cytochrome oxidase reaction. The simplest such property would be the ability to slow the rate-controlling reaction of ferrocytochrome c (‘c2+') with oxidized cytochrome c oxidase, according to the equation presented by Chance (1996):
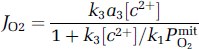
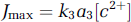
where k3 and a3 are the association constant (turnover number) and quantity of cytochrome aa3 or cytochrome c oxidase, [c2+] is the concentration of ferrocytochrome c, and k1 is the association constant of the reaction between oxygen and ferricytochrome c. The apparent Michaelis–Menten kinetic constants of the steady-state reaction between oxygen and reduced cytochrome c oxidase include the half-saturation oxygen tension:
and the maximum flux
where the turnover rate, equal to the product of k3 and [c2+], controls the reaction rate when the oxygen level remains constant. In the simplest case, a common inhibitory factor, relative to its inhibitory constant (ratio χ i ), would reduce the flux by reducing the turnover according to the expansion of equations (4) and (10) for cooperative (or uncompetitive rather than noncompetitive) inhibition (Pearce et al, 2003),
where χ i is the weighted average sum of potential factors relative to their inhibitory constants, C i /K i . Equation (14) and Figures 4 and 5 show that it is possible to proceed from magnitudes of common factors to blood flow rates on the one hand and rates of oxygen consumption on the other. This equation predicts the necessary concentration of an NO-like substance from the following relationship:
which yields a predicted NO concentration of
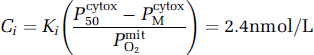
when the inhibitory constant is 46 nmol/L at the mitochondrial oxygen tension calculated in this study (Moncada and Erusalimsky, 2002).
Second, the common factor must be sensitive to the rate of CBF in a manner which maintains the relationship of negligible presence at low blood flow and significant presence at higher blood flow rates. To satisfy this mechanism, the common factor must be released continuously in relation to the magnitude of CBF. Thus, physiological blood flow changes can be said to prepare the cytochrome oxidase affinity for changes of oxidative metabolism, while the common factor maintains the oxygen consumption at its normal level, until or unless a change of metabolism is enabled by increase or decrease of the maximum enzyme reaction rate (Jmax).
Nitric Oxide
As a substance known to cause vasodilatation, raise CBF, and competitively inhibit oxygen binding to cytochrome oxidase in vitro and tentatively also in vivo, nitric oxide (NO) is an attractive candidate for a role as common factor. Goadsby et al (1992) first demonstrated that NO links changes in CBF and metabolism, at least for spreading depressionelicited increases in metabolic activity, and the results implied that NO may have a more general role in flow–metabolism coupling (Moncada and Erusalimsky, 2002). Brown and Cooper (1994), Cleeter et al (1994), and Schweizer and Richter (1994) first reported that cytochrome c oxidation can be inhibited by NO. Brown (1995) proposed that NO may be the physiologic regulator of the affinity of mitochondrial respiration for oxygen, enabling mitochondria to act as sensors of oxygen over the entire physiologic range. Torres et al (1995) found that cytochrome c oxidase rapidly binds NO when the enzyme enters the turnover phase. The rapid onset of inhibition suggested that nanomolar concentrations of NO are effective under physiologic conditions of low oxygen tension: The concentrations of NO measured in many biological systems appear to be similar to those sufficient to inhibit cytochrome oxidase and mitochondrial respiration. Conversely, inhibition of NO synthesis stimulated respiration in a number of systems.
Thus, nanomolar concentrations of NO immediately, specifically and reversibly inhibit cytochrome oxidase in cooperative competition with oxygen in vivo. Animal models display respiratory inhibition by NO endogenously produced by constitutive isoforms of NO synthase (NOS), which may be largely mediated by NO inhibition of cytochrome oxidase, suggesting that the inhibition of cytochrome oxidase by NO may be involved in the physiologic and/or pathologic regulation of respiration, and the affinity of cytochrome oxidase for oxygen in vivo (Brown, 2001).
Neurons release NO in response to activation of receptors of the excitatory amino acid N-methyl-
Another body of evidence in the literature is consistent with tonic NO release by capillary endothelium and by nNOS within neurons (Reutens et al, 1997; White et al, 1999). Tonic release would match the baseline level of blood flow to the inhibition of cytochrome oxidase to the degree necessary to maintain constant cerebral oxidative metabolism, unless the effect of the inhibition is overcome by increase of Jmax. Buerk et al (2003) showed that NO acutely is elevated when CBF rises in vivo. Thus, when appropriately stimulated, the constitutive forms of NOS present in endothelium (eNOS), neurons (nNOS), and inducible NOS (iNOS) in glial cells, appear to produce additional NO, resulting in transient inhibition of cytochrome oxidase in surrounding cells.
It has been suggested that changes of tissue pH affect the reduction of nitrite to NO in the absence of oxygen (Zweier et al, 1999), potentially influencing both the rate of blood flow and the inhibition of cytochrome oxidase. This phenomenon in turn may explain the effects of hypo- and hypercapnia on blood flow and the absent effect on oxygen metabolism observed in most studies. Thus, findings by Puscas et al (2000) indicate that NO- as well as prostaglandin-induced carbonic anhydrase inhibition is involved in the vasodilation produced by hypercapnia. However, findings by Heinert et al (1999) suggest that the NO- and indomethacin-sensitive pathways involved in the hypercapnic response are distinct, although they interact synergistically. The interaction is also suggested by Beasley et al (1998), who concluded that the eNOS response to global ischemia involves an indomethacin-sensitive mediation.
An additional finding supports the candidature of NO for at least a part role as common factor: NO generation appears to be saturable at higher oxygen levels. Although, the P50 of NO synthase for oxygen is at least an order of magnitude higher than that of cytochrome oxidase (in the absence of NO; Brown, 2001), saturation of NO synthase eventually renders the enzyme unable to produce more NO to further inhibit cytochrome oxidase at the highest oxygen levels.
Safety of Indomethacin
We studied only young healthy volunteers. In patients with compromised CBF, further reduction could affect the CMRO2. Abnormally low CBF is a common finding in patients with severe traumatic brain injury (Glasgow Coma Scale less than 8; Cold, 1989; Marion et al, 1991; Obrist et al, 1979; Overgaard et al, 1981) and hypoxia may be the single most important secondary factor affecting the outcome in these patients (Miller, 1985). Therefore, indomethacin should be used with care in the acute management of traumatic brain injury, especially in conditions of a high intracranial pressure. The use of indomethacin should be cautioned in older patients with reduced CBF because it may provoke further reductions of CBF. Specifically, the extraction of oxygen should not be allowed to rise above 0.56 to 0.59, or the venous hemoglobin saturation should not be allowed to decrease below 38% to 40%.
Conclusions
This study confirms an average decrease of CBF of 35% and no significant reduction of CMRO2 after indomethacin administration in young healthy awake humans. The study supports the extended model of diffusion-limited oxygen delivery to brain. The maintenance of normal oxygen consumption during the flow reduction was ascribed to adjustment of cytochrome oxidase affinity by a mechanism involving a hypothetical common factor, which has several properties in common with NO.