
Abstract
Hypercapnia and hypocapnia produce cerebral vasodilation and vasoconstriction, respectively. However, regional differences in the vascular response to changes in Pa
Hypercapnia produces cerebral vasodilation and increases CBF, whereas hypocapnia produces cerebral vasoconstriction and decreases CBF (Kety and Schmidt, 1948; Raper et al., 1971; Shimosegawa et al., 1995). Because the vascular responsiveness to vasodilator in the brain with insufficient cerebral perfusion pressure is reduced by autoregulatory vasodilation (Kanno et al., 1988), hypercapnia can be used to estimate cerebral perfusion reserve in occlusive cerebrovascular disease (Herold et al., 1988; Levine et al., 1991; Kuwabara et al., 1997). Although hypercapnia is widely used to estimate cerebral perfusion reserve, there are only a few reports concerning cerebral vascular response to change in Pa
Fox et al. (1988) reported that intersubject averaging of CBF images, a technique requiring transformation of brain images of individual subjects into a standard brain shape and size in three dimensions (anatomic standardization), provides enhanced detection of focal brain responses (Friston et al., 1990). To investigate regional differences in cerebral vascular response to changes in Pa
METHODS
Subjects
The current study was approved by the Ethics Committee of the Akita Research Institute of Brain and Blood Vessels. Eleven healthy men (51 to 71 years of age; mean ± SD, 59.8 ± 5.5 years) were recruited and provided written informed consent. The subjects were judged healthy based on medical history, physical examination, blood screening analysis, electrocardiogram, echocardiography, magnetic resonance (MR) imaging of the brain, and MR angiography of the brain and the neck.
PET procedures
The Headtome V dual PET system (Shimadzu, Kyoto, Japan) used for all studies provided 47 sections with center-to-center distances of 3.125 mm (Iida et al., 1996). The intrinsic spatial resolution was 4.0 mm in-plane and 4.3 mm full width at half maximum axially. Reconstruction with a Butterworth filter resulted in a final in-plane resolution of approximately 8 mm full width at half maximum.
The dual PET system allowed brain and heart studies to be performed simultaneously (Iida et al., 1998). After 1-minute continuous inhalation of C15O gas (approximately 5 GBq total supplied to the mouth), 4-minute static scanning was performed and three arterial blood samples were taken. The C15O PET data of the brain were used to calculate cerebral blood volume (Martin et al., 1987). The C15O PET data of the heart were used to derive the arterial input function for the brain study (Iida et al., 1992). After transmission scanning, H215O PET studies were performed at rest and during hypercapnia and hypocapnia. The intervals between H215O PET studies were at least 15 minutes. The scanning protocol consisted of 180-second static scanning of the brain and 360-second dynamic scanning of the heart after continuous intravenous infusion of H215O over 2 minutes. The dose of radioactivity was 1.1 to 1.4 GBq at the start of the scanning. Cerebral blood flow was estimated using the dual PET system as previously described (Iida et al., 1998). Using the arterial input function derived from the left ventricular time-activity curve measured by the PET camera ring positioned over the heart (Iida et al., 1992), CBF images were calculated from the brain PET camera data by the autoradiographic method (Raichle et al., 1983; Kanno et al., 1987; Iida et al., 1998).
Hypercapnia was induced by inhalation of 7% CO2 gas, starting 1 minute before scanning and continuing until the end of scanning of the heart (360 seconds). Hypocapnia was induced in the same way by hyperventilation (Kanno et al., 1988). Three arterial blood samples were taken during each H215O PET scanning of the heart (360 seconds) to measure arterial gaseous pressure. A head-fixation system with individual molds for each subject was used to minimize head movement during the PET measurements. H215O PET studies were performed at rest, during hypercapnia, and during hypocapnia in six subjects; and they were performed at rest, during hypocapnia, and during hypercapnia conditions in the other five subjects.
Regions of interest
Regions of interest (ROIs) were drawn on the original PET images. Circular ROIs were defined for the pons, thalamus, and putamen (16 mm in diameter), and elliptical ROIs were defined for the cerebellar cortex, centrum semiovale, and four neocortical regions representing the frontal, temporal, parietal, and occipital lobes (16 mm × 32 mm). Each ROI was drawn in three adjacent sections, and data were pooled to obtain the average concentration of radioactivity for the whole volume of interest.
The vascular response to change in Pa
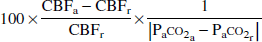
where the subscripts r and a denote rest and activation conditions (hypercapnia or hypocapnia), respectively.
Anatomic standardization
All CBF images were globally normalized to 1000 counts/pixel for CBF, and transformed into the standard brain size and shape by linear and nonlinear parameters with the system for anatomic standardization developed by Minoshima et al. (1994) (Senda et al., 1998). After anatomic standardization, the brain images of all subjects had the same anatomic format. Average images for each condition—that is, rest, hypercapnia and hypocapnia conditions—were calculated and compared on a pixel-by-pixel basis.
From the standardized CBF images, descriptive three-dimensional t-maps (paired t-test) of hypercapnia minus rest, rest minus hypercapnia, hypocapnia minus rest, and rest minus hypocapnia were calculated. In the t-maps, the areas with a significance level of P < 0.05 adjusted for multiple comparison on a pixel-by-pixel basis were considered statistically significant. These comparisons were performed to determine whether there were brain regions that have a larger or smaller CBF response to a change in Pa
RESULTS
Table 1 shows Pa
Pa
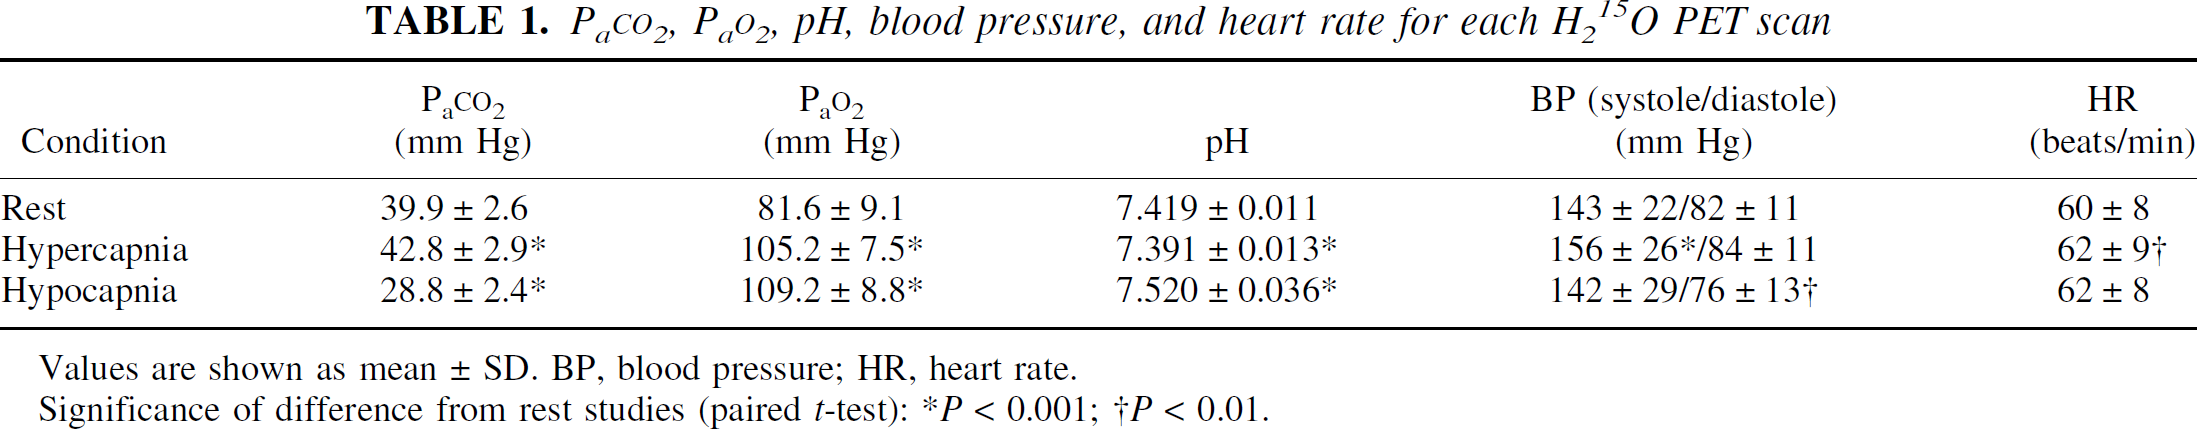
Values are shown as mean ± SD. BP, blood pressure; HR, heart rate.
Significance of difference from rest studies (paired t-test): *P < 0.001; †P < 0.01.
Cerebral blood flow values during rest, hypercapnia, and hypocapnia, and vascular responses to Pa
CBF values under rest, hypercapnia, and hypocapnia conditions and the vascular response to changes in Pa
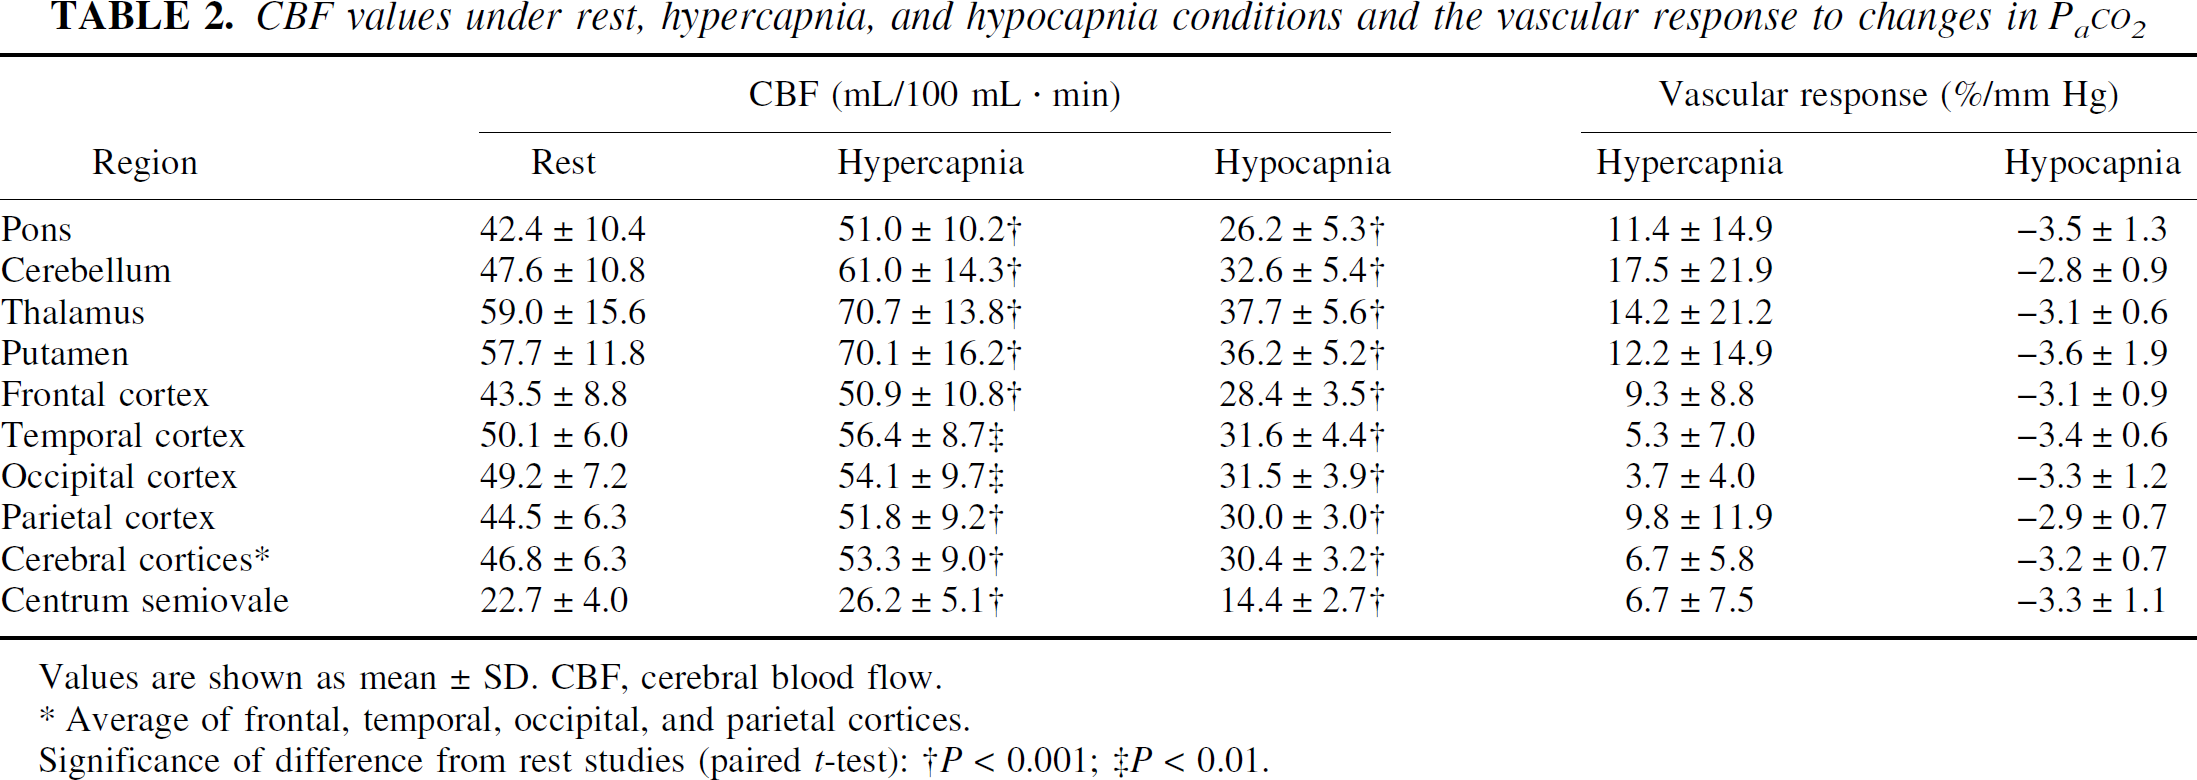
Values are shown as mean ± SD. CBF, cerebral blood flow.
Average of frontal, temporal, occipital, and parietal cortices.
Significance of difference from rest studies (paired t-test): †P < 0.001; ‡P < 0.01.
Average PET images of rest, hypercapnia, and hypocapnia conditions are shown in Fig. 1. The t-maps of hypercapnia minus rest, rest minus hypercapnia, hypocapnia minus rest, and rest minus hypocapnia are shown in Fig. 2. The t values of the pixels, in which significant relative CBF changes were identified, are shown in Table 3. During hypercapnia, significant relative hyperperfusion was observed in the pons, cerebellum, thalamus, and putamen (Fig. 2A, Table 3). Significant relative hypoperfusion during hypercapnia was observed in the temporal, temporo-occipital, and occipital cortices (Fig. 2B, Table 3) that still show hyperperfusion with less magnitude (Table 2). During hypocapnia, significant relative hyperperfusion was observed in the precentral gyrus, the prefrontal cortex, and a part of the cerebellum (Fig. 2C, Table 3) that still show hypoperfusion with less magnitude (Table 2). Significant relative hypoperfusion during hypocapnia was observed in the pons, hippocampal region, putamen, cingulate gyrus, temporal cortex, temporo-occipital cortex, and occipital cortex (Fig. 2D, Table 3).
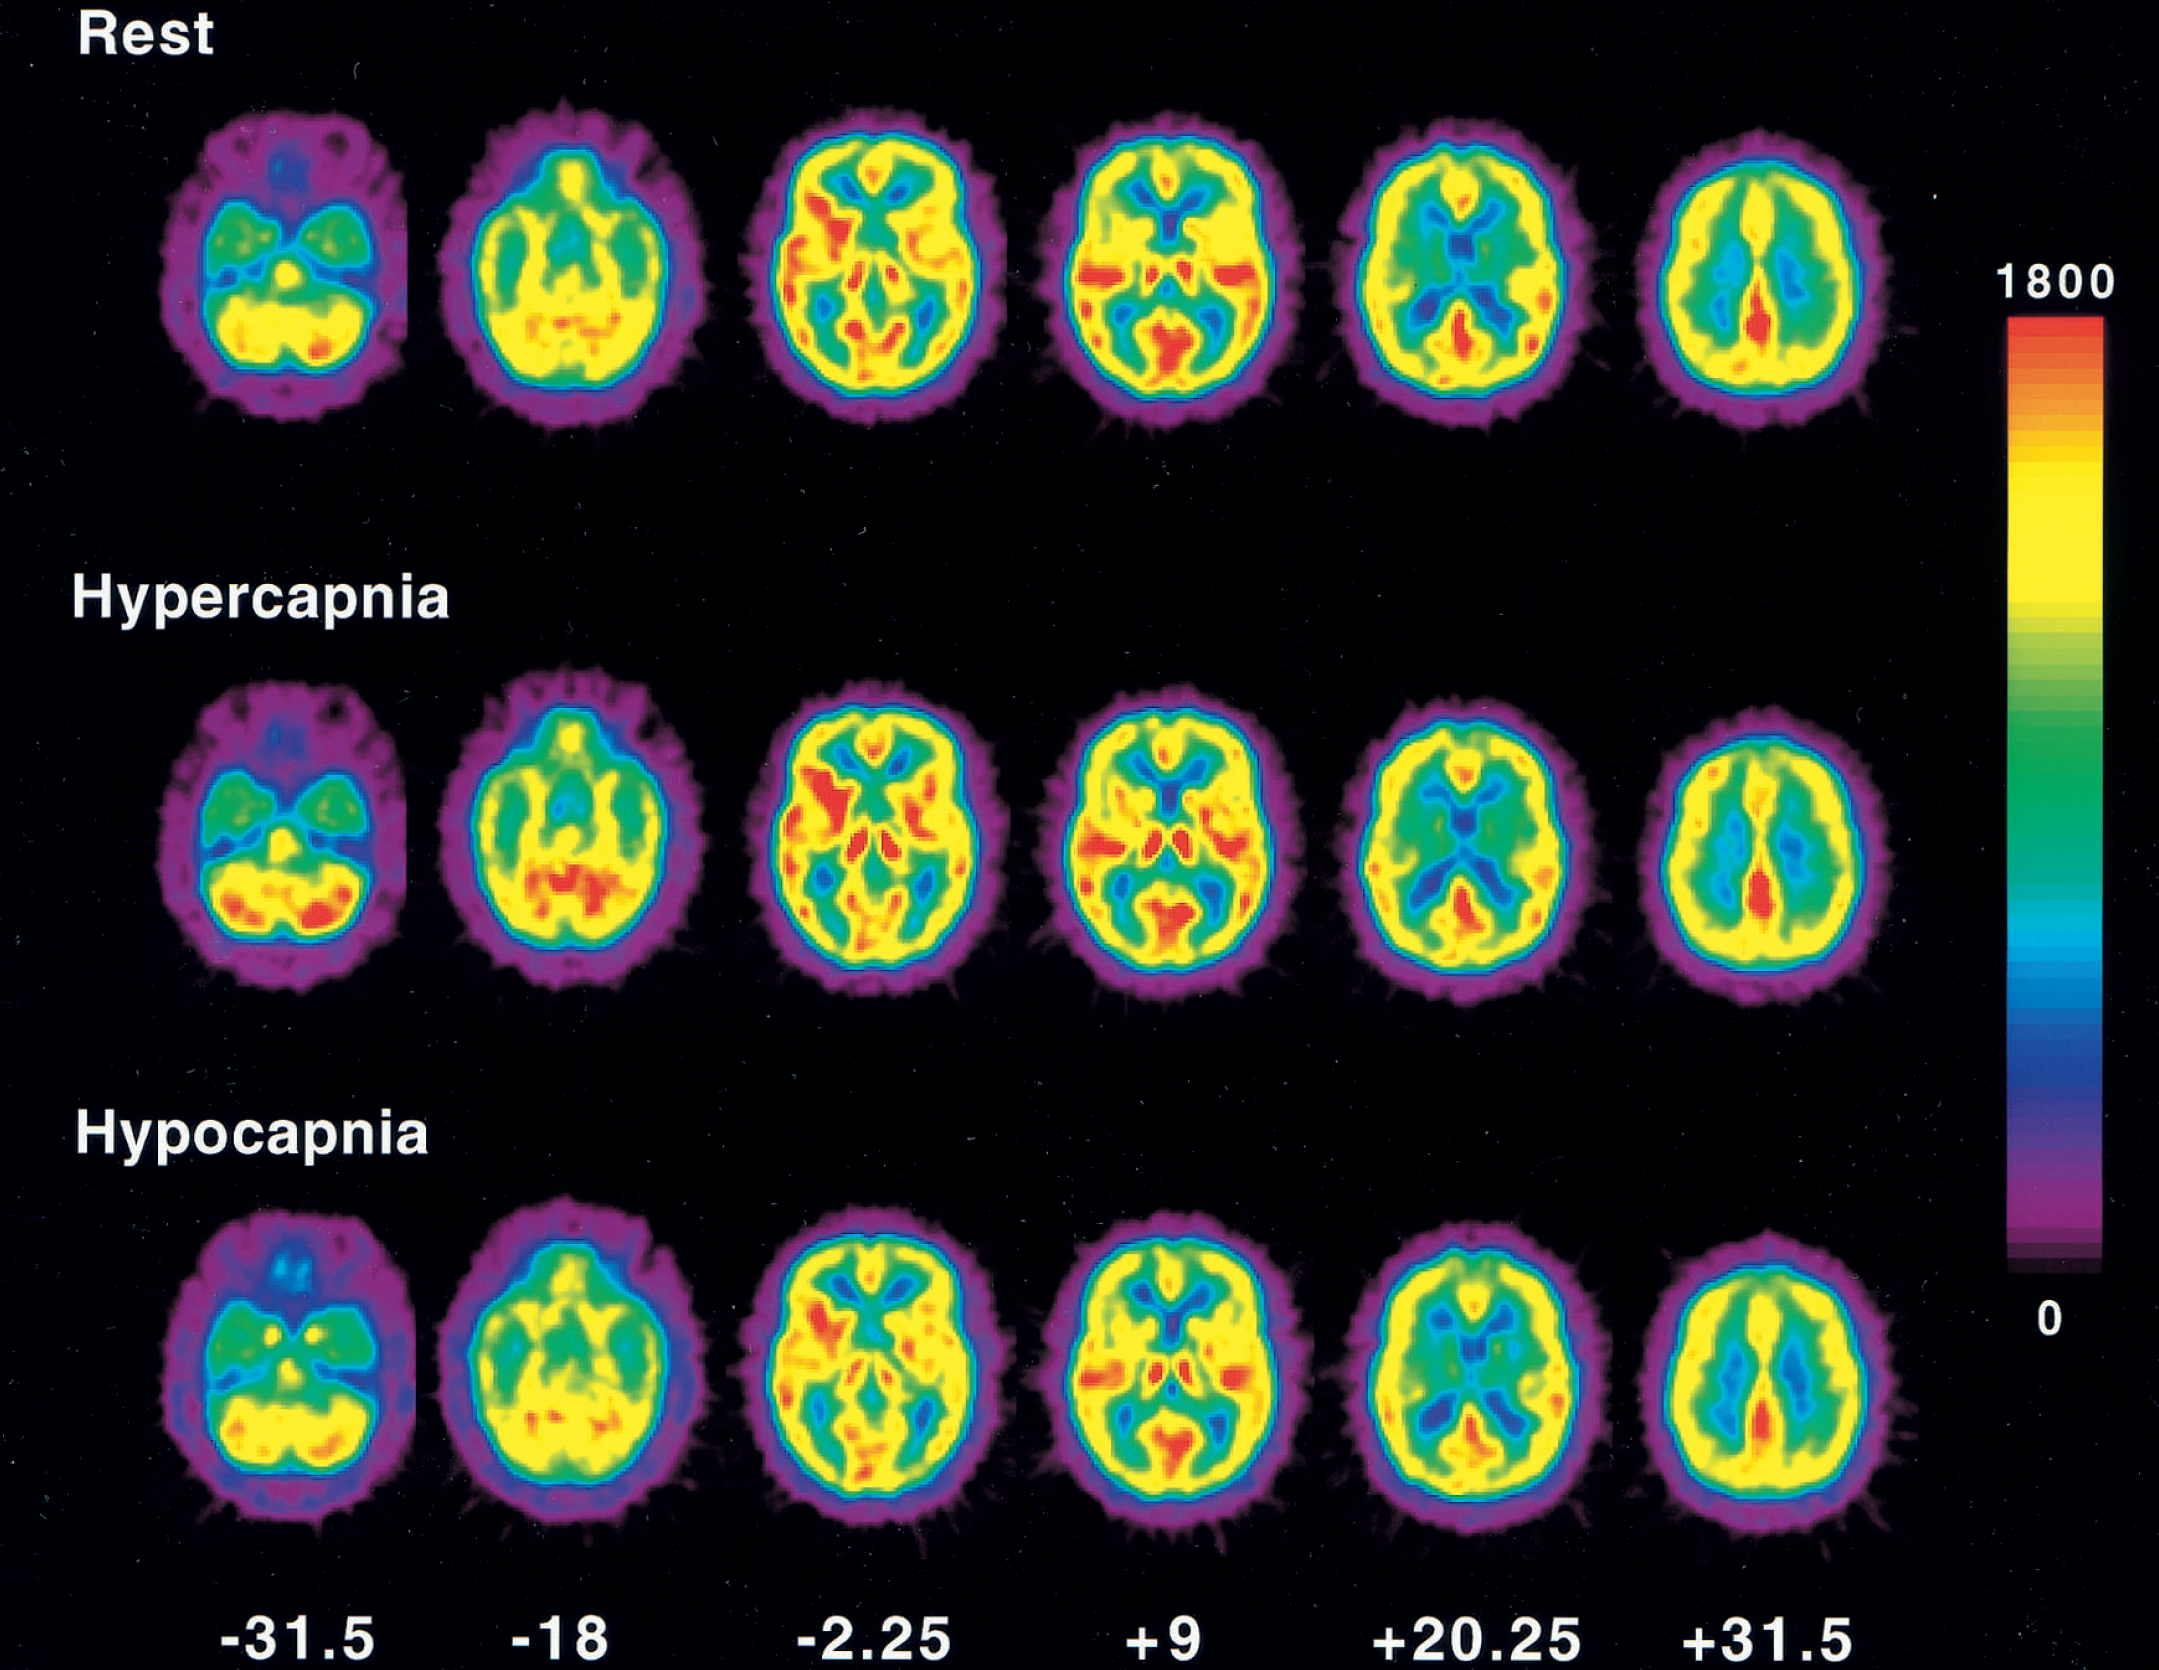
Average positron emission tomography images of under rest, hypercapnia, and hypocapnia conditions. Slice positions are expressed in millimeters from the anterior—posterior commissure line in the standard brain. Pixel values are globally normalized to 1000 counts/pixel. Scale maximum and minimum values are 1800 and 0, respectively.
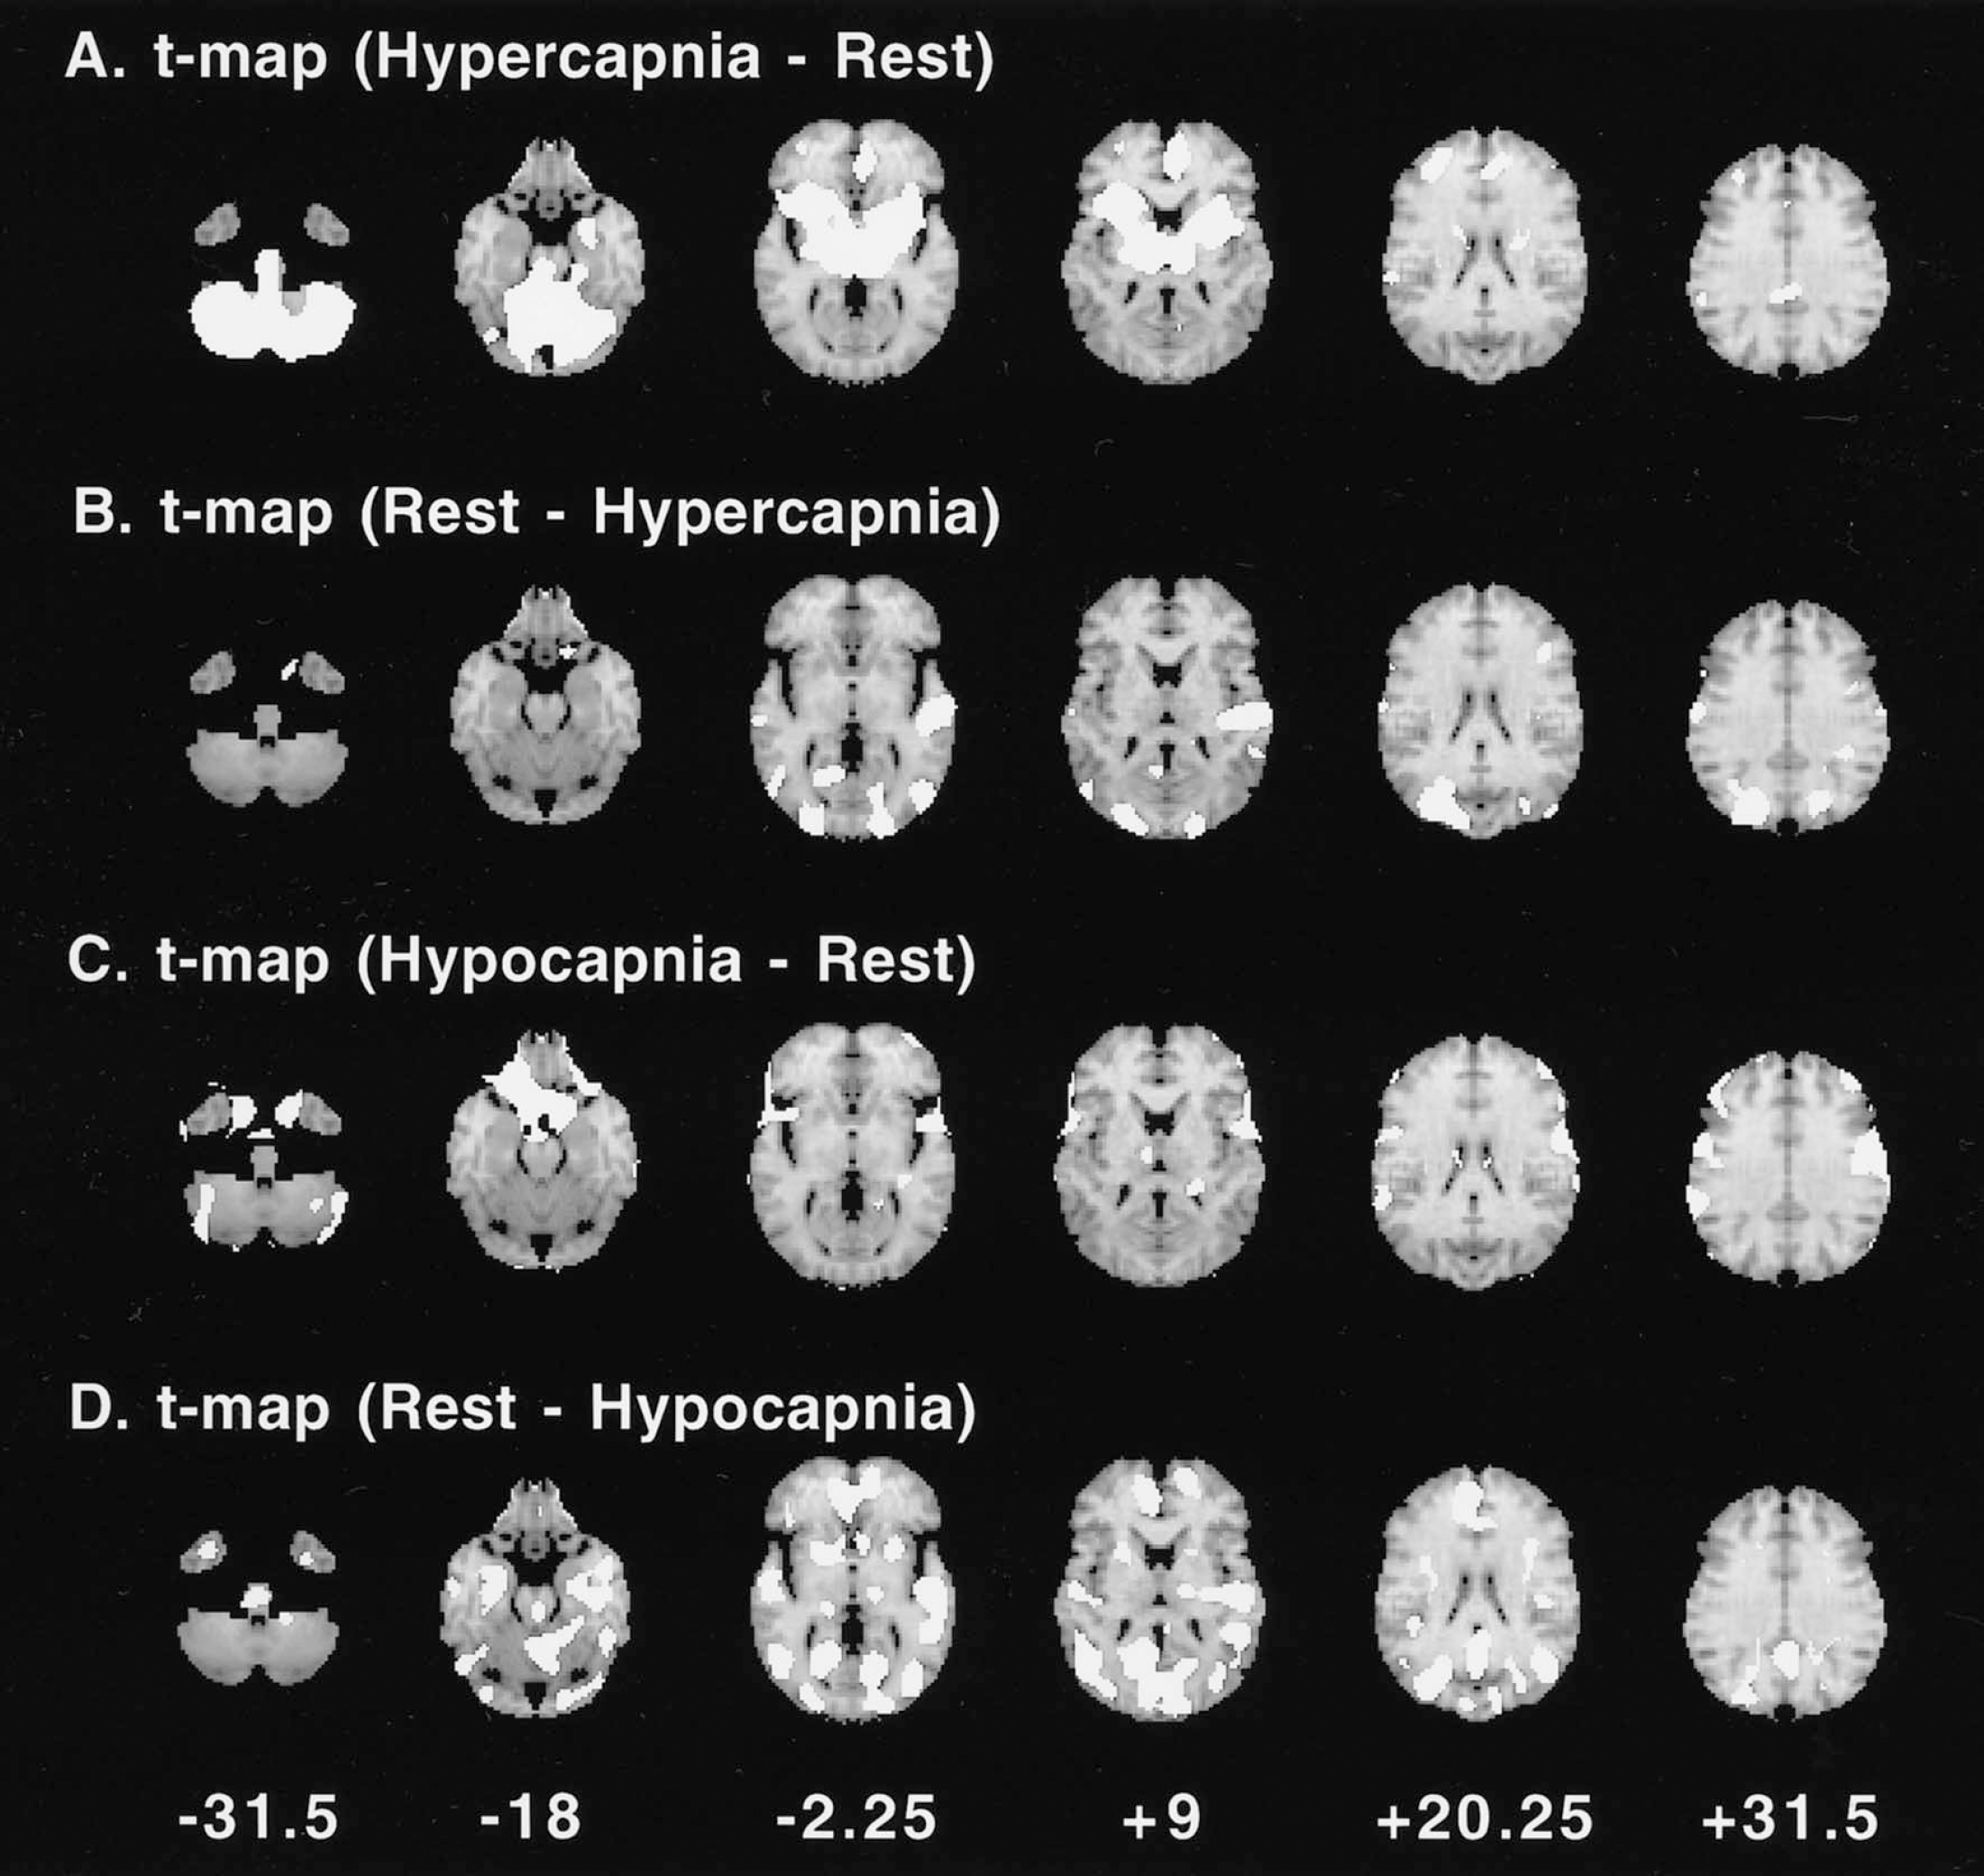
The t-maps of hypercapnia minus rest
Coordinates of the pixels in which significant relative CBF changes were identified
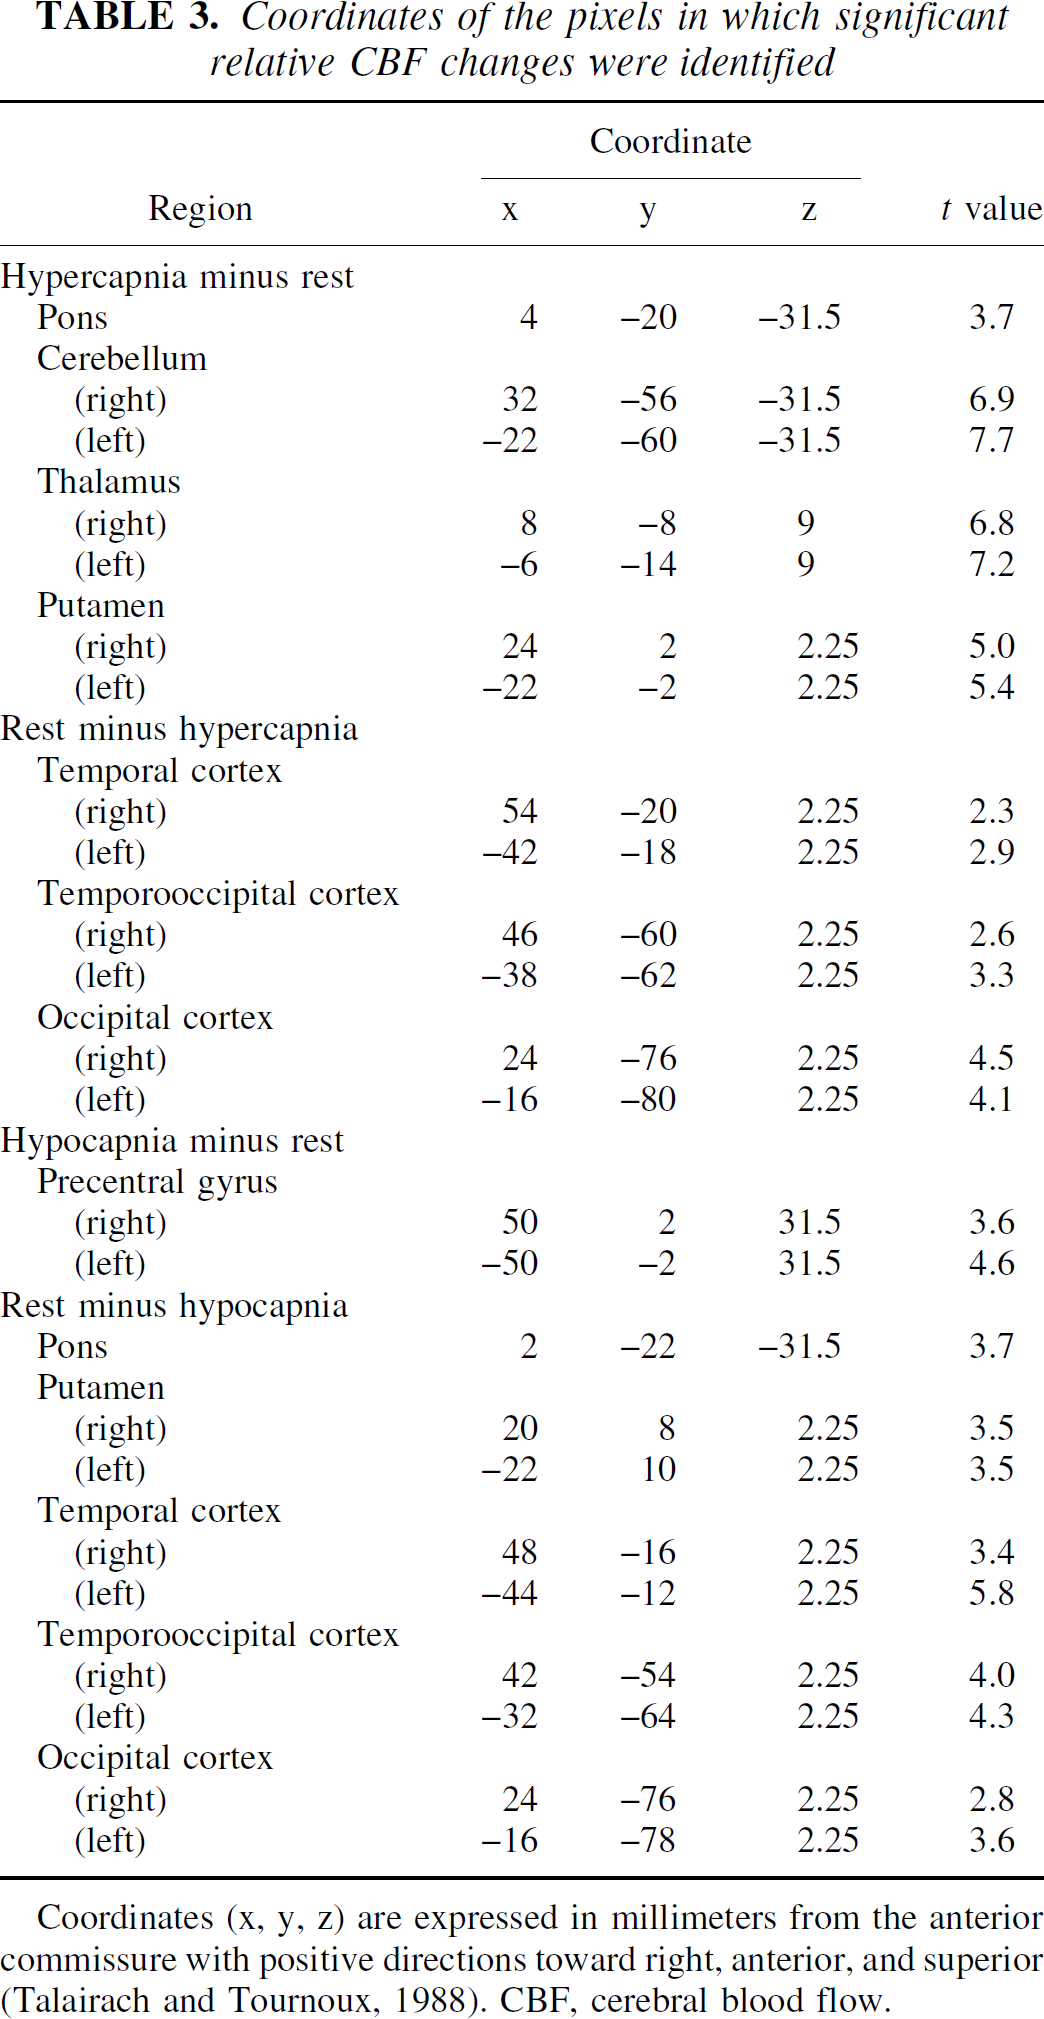
Coordinates (x, y, z) are expressed in millimeters from the anterior commissure with positive directions toward right, anterior, and superior (Talairach and Tournoux, 1988). CBF, cerebral blood flow.
DISCUSSION
Hypercapnia
The average vascular response to the change in Pa
The vascular responses that we observed during hypercapnia were almost identical between the cerebral cortices and the deep cerebral white matter (Table 2), as previously reported (Ramsay et al., 1993b). However, in an animal study, vascular response during hypercapnia was greater in the cerebral cortex than in white matter (Heistad et al., 1976; McPherson et al., 1995). One reason for this may be the mixing of gray and white matter and cerebrospinal fluid in the cerebral cortex ROI caused by the limited spatial resolution of PET.
During hypercapnia, significant relative hyperperfusion in the anterior part of the left cingulate gyrus was also observed (Fig. 2A). Neural activation in the thalamus and limbic system including cingulate gyrus during CO2-stimulated breathing has been reported in humans (Corfield et al., 1995). Significant relative hyperperfusion in the thalamus and anterior cingulate cortex during hypercapnia may be related to CO2-stimulated breathing.
In the current study, the subjects were in an older age group. The decrease in vascular response to hypercapnia during aging has been observed in rats (Lartaud et al., 1993), whereas no aging effects have been observed in humans (Levine et al., 1994). The aging effects in vascular responses to changes in Pa
Hypocapnia
The average vascular response to the change in Pa
During hypocapnia, a significant relative hyperperfusion was observed in the precentral gyrus, the prefrontal cortex, and a part of the cerebellum (Fig. 2C, Table 3). A significant relative hyperperfusion during voluntary hyperventilation has been reported in humans in the bilateral primary motor, premotor cortices, and cerebellum, indicating neural activation induced by hyperventilation (Ramsay et al., 1993a; Ishii et al., 1998). In the current study, approximately the same regions were activated by hyperventilation.
During hypocapnia, a significant relative hypoperfusion was observed in the pons, hippocampal region, putamen, cingulate gyrus, temporal cortex, temporo-occipital cortex, and occipital cortex (Fig. 2D, Table 3), and large absolute values of vascular response were observed in the pons and putamen (Table 2). These regions, including the limbic system, might have a large capacity for vasoconstriction. In the pons and putamen, a large capacity for vasodilatation was also observed (Fig. 2A, Table 2), indicating that these regions might have marked vascular responsiveness. It has been reported that no regional difference in vascular response during hypocapnia was observed in elder normals (Tsuda and Hartmann, 1989), however, CBF was measured by 133Xe with multidetector, which could measure for only cerebral cortical regions.
Because the cerebral vascular response to a change in Pa
Cerebral vascular tone
In the temporal, temporo-occipital, and occipital cortices, a low capacity for vasodilatation (Fig. 2B) and a large capacity for vasoconstriction (Fig. 2D) were observed, possibly indicating that the cerebral vascular tone at rest inclines toward vasodilatation in the temporal, temporo-occipital, and occipital cortices.
The regional heterogeneity of sympathetic innervation of the intracranial arterioles has been reported, that is, the occipital lobe is less by the sympathetic innervation than the other brain regions (Edvinsson et al., 1976). Less sympathetic innervation in the occipital lobe may be related to the tendency of the cerebral vascular tone at rest to incline toward vasodilatation. Other determinants of cerebral vascular tone have been proposed, including nitric oxide (Faraci and Brian, 1994) and potassium (K+) channels (Faraci and Sobey, 1998). The regional differences in cerebral vascular tone measured by PET in the current study might also be related to the regional differences in nitric oxide synthase and K+ channel activity in the brain. However, such regional differences are currently unknown.
In conclusion, the regional differences in cerebral vascular response to a Pa
Footnotes
Acknowledgments
The authors gratefully acknowledge the assistance of the members of the Akita Research Institute of Brain and Blood Vessels in performing the PET experiments.