
Abstract
White matter hyperintensities are frequently detected on cranial magnetic resonance imaging (MRI) scans of older adults. Given the presumed ischemic contribution to the etiology of these lesions and the posited import of resting brain activity on cognitive function, we hypothesized that longitudinal changes in MRI-detected white matter disease, and its severity at a given time point, would be associated with changes in regional cerebral blood flow (rCBF) over time. We evaluated MRI scans and resting H215O positron emission tomographic rCBF at baseline and after an average of 7.7-year follow-up in Baltimore Longitudinal Study of Aging participants without dementia. Differences in patterns of rCBF were evident at baseline and at follow-up between the group of subjects showing increased white matter disease over the 8-year interval compared with the group with stable white matter ratings. Furthermore, longitudinal changes over time in rCBF also differed between the two groups. Specifically, the group with progressive white matter abnormalities showed greater increase in the right inferior temporal gyrus/fusiform gyrus, right anterior cingulate, and the rostral aspect of the left superior temporal gyrus. Regions of greater longitudinal decrease in this group were evident in the right inferior parietal lobule and at the right occipital pole. Changes in white matter disease over time and its severity at any given time are associated significantly with both cross-sectional and longitudinal patterns of rCBF. The longitudinal increases may reflect cortical compensation mechanisms for reduced efficacy of interregional neural communications that result from white matter deterioration.
Introduction
White matter (WM) abnormalities depicted on cranial magnetic resonance imaging (MRIs) are evident in many older adults, with prevalence ranging from 70% to almost 100% in studies of community-dwelling populations (Piguet et al, 2003; Soderlund et al, 2003; Wen and Sachdev 2004; Yue et al, 1997). These WM changes have been hypothesized to reflect chronic ischemic changes that are mediated by factors such as hypertension (Longstreth et al, 1996; Manolio et al, 2003; Soderlund et al, 2003; van Dijk et al, 2004a), serum homocysteine (Vermeer et al, 2002), and amyloid β-peptide levels in individuals who carry the apolipoprotein E e 4 allele (van Dijk et al, 2004b). The neurocognitive consequences of these abnormalities vary widely ranging from declines in task accuracy reported in multiple cognitive domains to decrements in task performance speed with relative preservation of accuracy (Artero et al, 2004; Cabeza et al, 2002, Charlton et al, 2006; van den Heuvel et al, 2006; Cook et al., 2002; Harrington et al, 2000; Petkov et al, 2004).
Given the presumed ischemic contribution to the etiology of the WM changes, we hypothesized that the magnitude of MRI-detected WM abnormalities and their changes over time would affect longitudinal regional cerebral blood flow (rCBF) patterns in older adults. Intra- and interregional neural communications are evident in ‘resting’ neural systems and may be even more critical in the functions of these regions when activated (Biswal et al, 1995; Fiser et al, 2004; Fox et al, 2005, 2006; Kenet et al, 2003; Llinas 1988; MacLean et al, 2005; Raichle and Mintun 2006). As the axons that comprise the WM mediate interactions between brain regions, and because regions with increasingly impaired communications might be expected to change their activity levels to compensate, we further predicted that subjects with stable WM disease would exhibit a different pattern of rCBF both cross-sectionally and over time than would subjects with deteriorating WM. To test our hypotheses, we evaluated data gathered in the neuroimaging substudy of the Baltimore Longitudinal Study of Aging (Resnick et al, 2000), which includes annual brain MRI and positron emission tomographic (PET) estimates of resting rCBF in nondemented aging subjects over the course of 8 years.
Materials and methods
Subjects
We evaluated the cranial MRIs and resting rCBF PET data gathered between 1994 and 2002 in 85 participants in year 1 and, for the majority of the subjects, from year 9 of the Baltimore Longitudinal Study of Aging neuroimaging study. These 85 participants comprised all individuals with technically adequate MRI and PET data from year 1 baseline evaluation and year 6 or later, providing a minimum follow-up interval of 5 years. Data from 11 of these participants were excluded from the analysis due to the onset of dementia or other serious medical conditions during the study. The remaining subjects remained free of dementia by consensus diagnosis and free of other major medical conditions including central nervous system disorders, severe cardiovascular disease, and psychiatric disease, such as major depression. These 74 subjects were divided into two groups: those whose WM score did not significantly change over time (stable group; n = 38, 19 men and 19 women, mean age year 1 = 67.1 ± 7.0 standard deviation (s.d.)) and those whose WM score worsened over time (progressive group; n = 36, 22 men and 14 women, mean age year 1 = 70.0 ± 6.9 s.d.). There was no statistically significant difference in age between the two groups (Table 1). For some participants, the final year evaluations were obtained at times either earlier or later than year 9. In the group with stable-appearing WM, 11 participants underwent their follow-up imaging evaluations at a year other than year 9: four at year 6, one at year 7, five at year 8, and one at year 10. In the group with changing WM, four participants underwent the second evaluation at a year other than year 9: one at year 6, one at year 7, and two at year 8. The mean (s.d.) between the first and follow-up imaging exams for the group with stable-appearing WM was 7.6 (0.9) years. For the group with changing WM, the mean (s.d.) was 7.7 (0.6) years. These were not significantly different (P∼0.44). For ease of discussion of the results, however, we refer to the final evaluation time point as year 9, and the follow-up interval as 8 years.
Sample characteristics
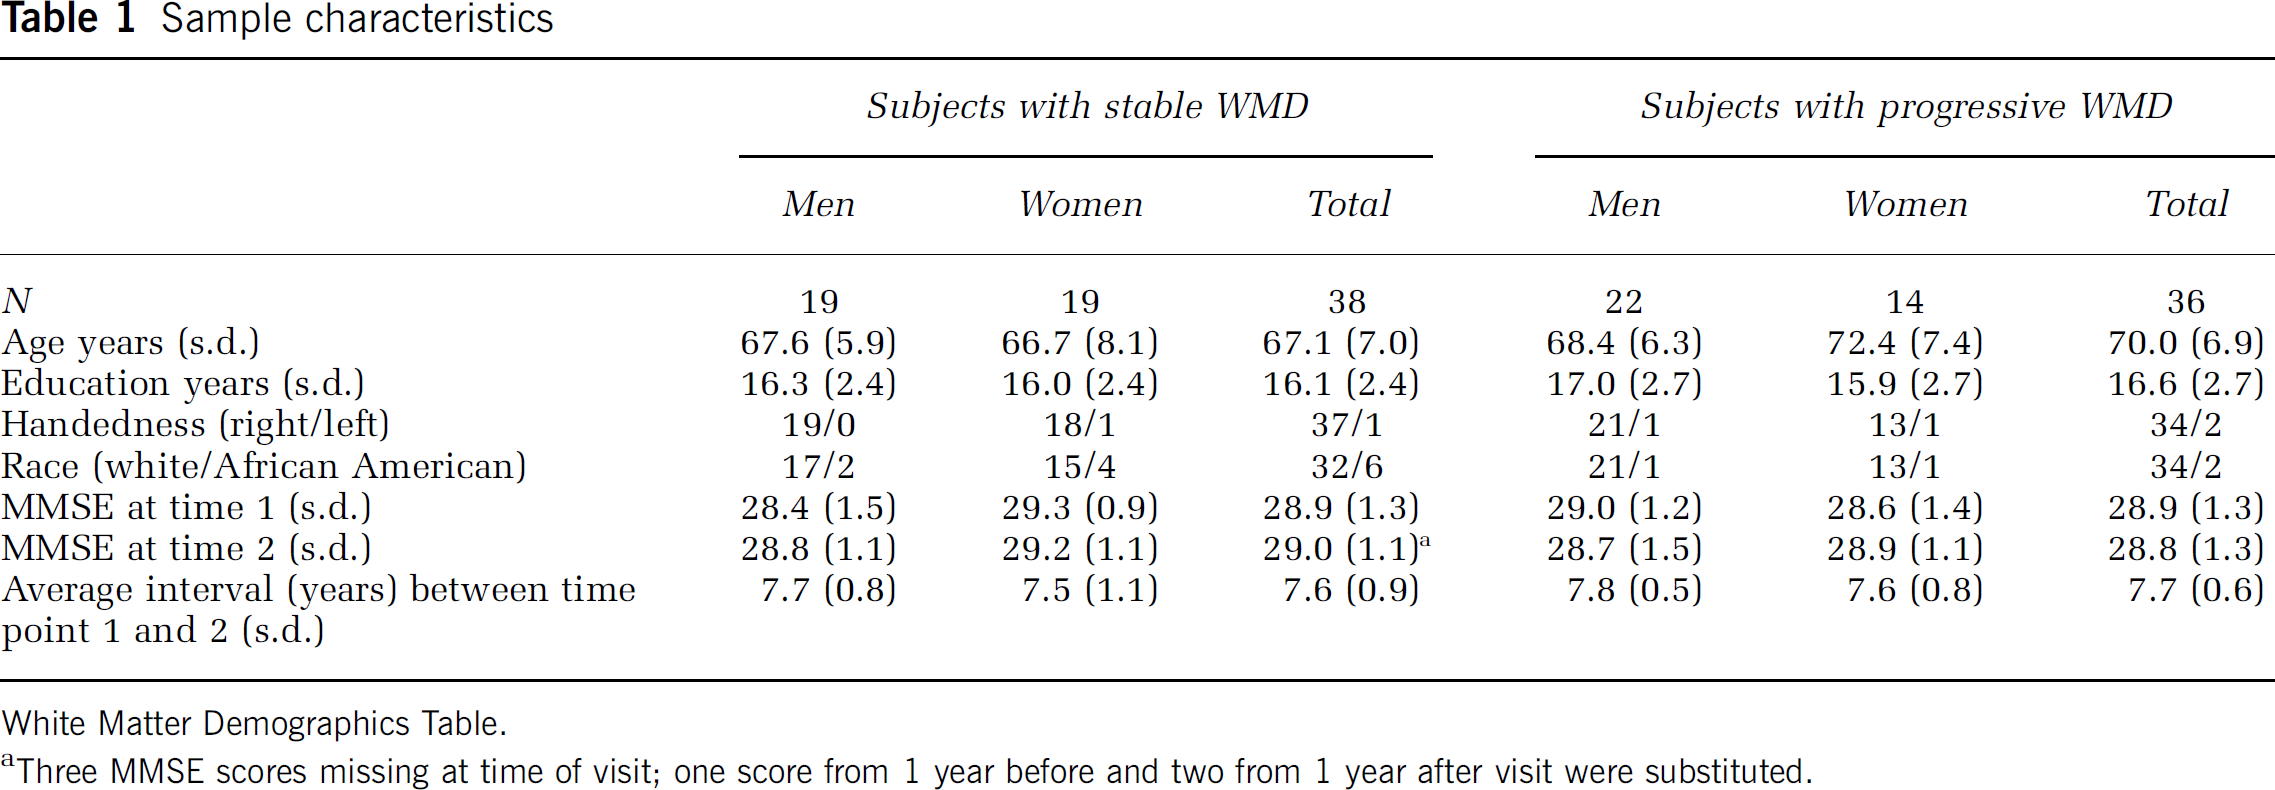
White Matter Demographics Table.
Three MMSE scores missing at time of visit; one score from 1 year before and two from 1 year after visit were substituted.
Some participants had medical conditions either at entry into the neuroimaging study, or developed conditions over the course of the study, which could potentially have put them at increased risk for cerebrovascular disease or for cognitive compromise. These conditions and the number of subjects who either had a diagnosis at study entry or developed each condition are enumerated in Table 2.
Cerebrovascular risk factors
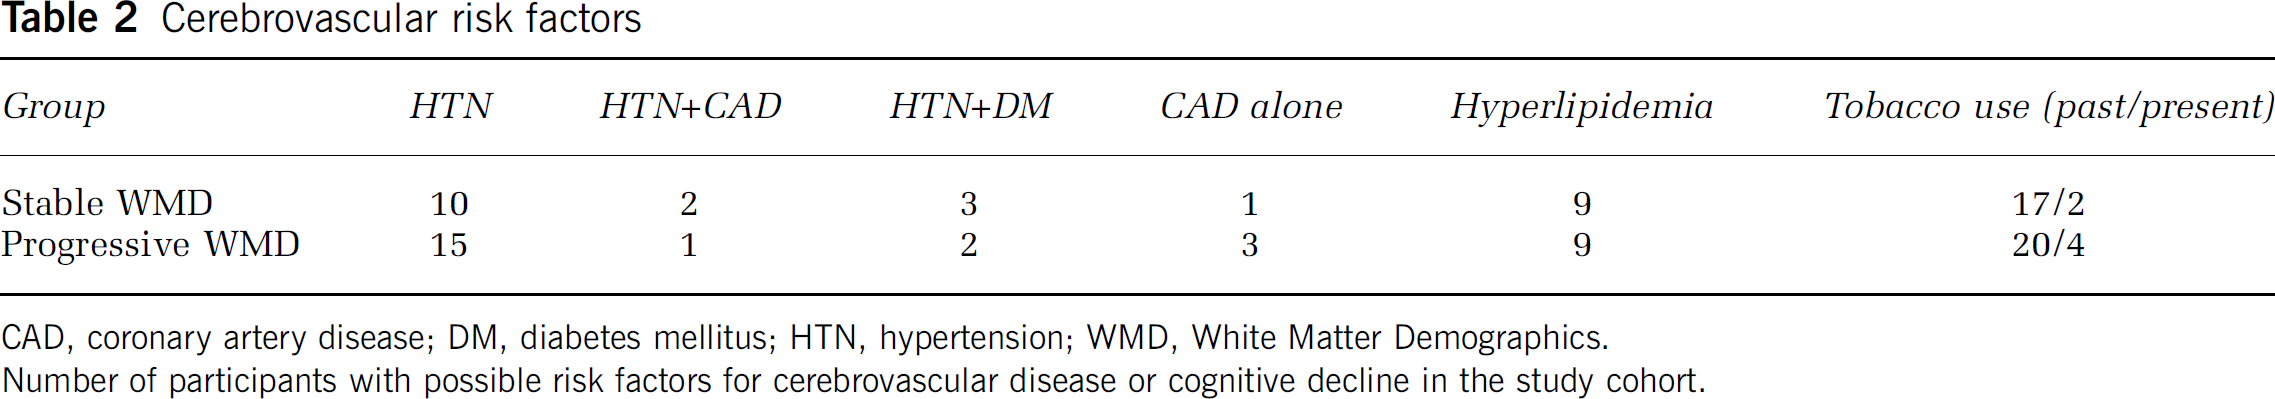
CAD, coronary artery disease; DM, diabetes mellitus; HTN, hypertension; WMD, White Matter Demographics.
Number of participants with possible risk factors for cerebrovascular disease or cognitive decline in the study cohort.
Magnetic Resonance Imaging Scans and White Matter Disease Evaluations
Year 1 and year 9 MRI scans included sagittal T1-weighted images, oblique axial (oriented parallel to the anterior-posterior intercommissural line) spin echo proton density, and T2-weighted images (repetition time (TR) = 3000, echo time (TE) = 34/100, field of view (FOV) = 24 cm, matrix = 256 × 192, number of excitations (NEX) = 0.5, 5-mm slice thickness), and axial and coronal three-dimensional spoiled gradient refocused images. We used the proton density and T2-weighted images to evaluate the burden of WM disease, using the previously validated and published protocol and WM disease scale adapted from the Cardiovascular Health Study (CHS) (Manolio et al, 1994; Yue et al, 1997). This scale is easy to apply for measuring WM disease and has been validated extensively through the CHS study. Furthermore, one of the authors of this study (MAK) had substantial earlier experience with this scale, having applied it to the analysis of between 1000 and 2000 scans evaluated under the auspices of the CHS. Using this scale, ‘0’ represents virtually normal WM and ‘9’ reflects a very thick rind of confluent periventricular WM disease, along with marked subcortical disease. Figure 1 shows examples of Baltimore Longitudinal Study of Aging images, corresponding to the proton density templates for grades 1, 2, 4, and 6. Proton density and T2-weighted sequences were initially chosen because, in contrast to current practice, fluid attenuated inversion recovery data acquisition sequences were not widely available when the study protocol was initiated (1994). For longitudinal consistency of data acquisition, we continued with our original MRI protocol throughout the duration of this study. The signal abnormalities in the proton density and in the T2-weighted images were always concordant, but were typically more conspicuous on the proton density images. Therefore, we used the proton density images as the final arbiter of the WM grade to be assigned to any given dataset.
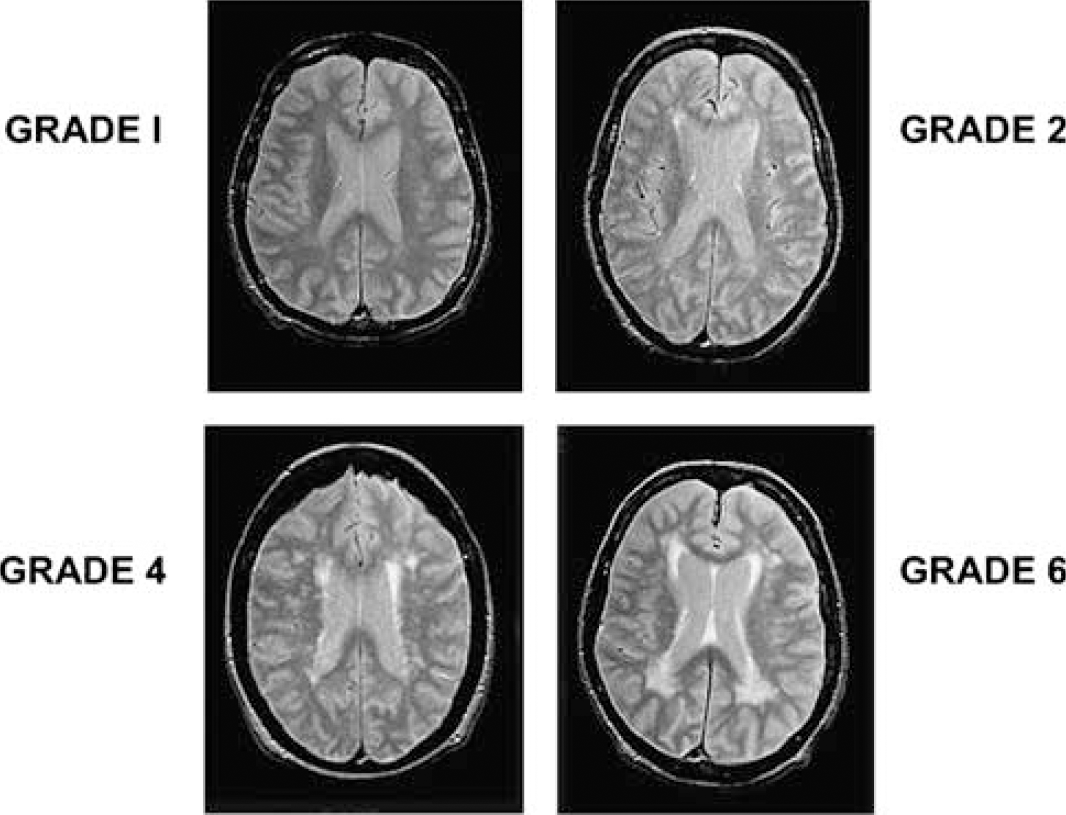
Examples of proton density-weighted images from white matter grades 1, 2, 4, and 6 templates, from the level of the bodies of the lateral ventricles.
For each participant, scans from years 1 to 9 were rated together by an experienced board certified neuroradiologist, who was masked to participant identity, demographic characteristics, and year of scan. A CHS WM score was then assigned to each scan. Participants were divided into two groups based on their WM score: individuals who did not change WM score over time (stable group) and these who showed a change in score over time (progressive group).
Positron Emission Tomographic Data Acquisition and Analysis
Each year, participants underwent a resting PET scan while instructed to keep their eyes open and focused on a computer screen that was covered by a black cloth. The data were gathered on a GE 4096 + PET instrument, and the images were acquired for 60 secs from the time the radioactivity detected in the brain surpassed a threshold level. This scan was performed in the context of three CBF measurements, one at rest and two during memory activation procedures. Scan order for the three conditions was counter-balanced across individuals but remained constant across years. Similar to our MRI acquisition scheme, for the sake of longitudinal consistency, we used the same PET data acquisition protocol, and the same PET instrument for the entire duration of the study reported here.
For each participant, PET scans were realigned and spatially normalized into standard stereotactic space and smoothed to a full width at half maximum of 12, 12, and 12 mm in the x, y, and z planes. To control for variability in global flow, rCBF values at each voxel were ratio adjusted to the mean global flow of 50 mL/100 g per min for each image. The image data were analyzed using Statistical Parametric Mapping (SPM2; Wellcome Department of Cognitive Neurology, London, England), where voxel-by-voxel comparisons were performed. Significant effects for each contrast were based on the magnitude (t = 3.09; P < 0.001) and spatial extent (>200mm3) of activation.
Two types of analyses were performed. First, WM score was correlated with patterns of CBF in each group at years 1 and 9. The results from this step were used in a second-level conjunction analysis to determine differences between the groups (masking threshold P≤0.05, magnitude P≤0.001, and spatial extent > 200mm3). These results were covaried by age at year 1 baseline assessment. Second, differences between groups in longitudinal changes in resting rCBF were examined by contrasting rCBF patterns at year 9 (8-year follow-up) to the year 1 baseline (magnitude P < 0.001 and spatial extent > 200mm3). These results were also covaried by age of the subjects at year 1 and WM score.
Results
White Matter Score
In both groups, the WM changes were distributed roughly symmetrically about the midline and were mostly focused in the periventricular as opposed to the subcortical WM. For the stable group, the initial mean WM grade was 1.26 (0.6 s.d.), whereas the baseline mean WM grade of the progressive group was 1.92 (1.0 s.d.). This difference was statistically significant (|t| =3.39, df = 57; P <0.001). In the group with WM disease that progressed, the mean change in WM grade over 8 years was 1.27 (0.45 s.d.), with the mean final WM grade advancing to 3.19 (1.12 s.d.). Consistent with our group definitions, the WM grade of the stable group at 8-year follow-up was again 1.26 (0.6 s.d.). To control for cross-sectional differences in WM grade between groups, WM grade was used as a covariate when examining longitudinal changes in patterns of cerebral blood flow.
Cross-Sectional Correlations between White Matter Score and Regional Cerebral Blood Flow at Years 1 and 9
In the stable group, subjects with higher-grade WM changes show significant positive associations between higher WM grade and rCBF at year 1 in the left inferior frontal gyrus/gyrus rectus junction region, the left posterior hippocampus, and the left amygdala. At year 9, a similar regional pattern is seen with the exception of the amygdala. In both years 1 and 9, the right inferior parietal lobule and the right middle temporal gyrus show negative associations between rCBF and more advanced (but stable) WM disease (Table 3 and Figure 2).
Primary regions showing positive and negative correlations between rCBF and higher white matter disease at years 1 and 9 in subjects with stable white matter disease
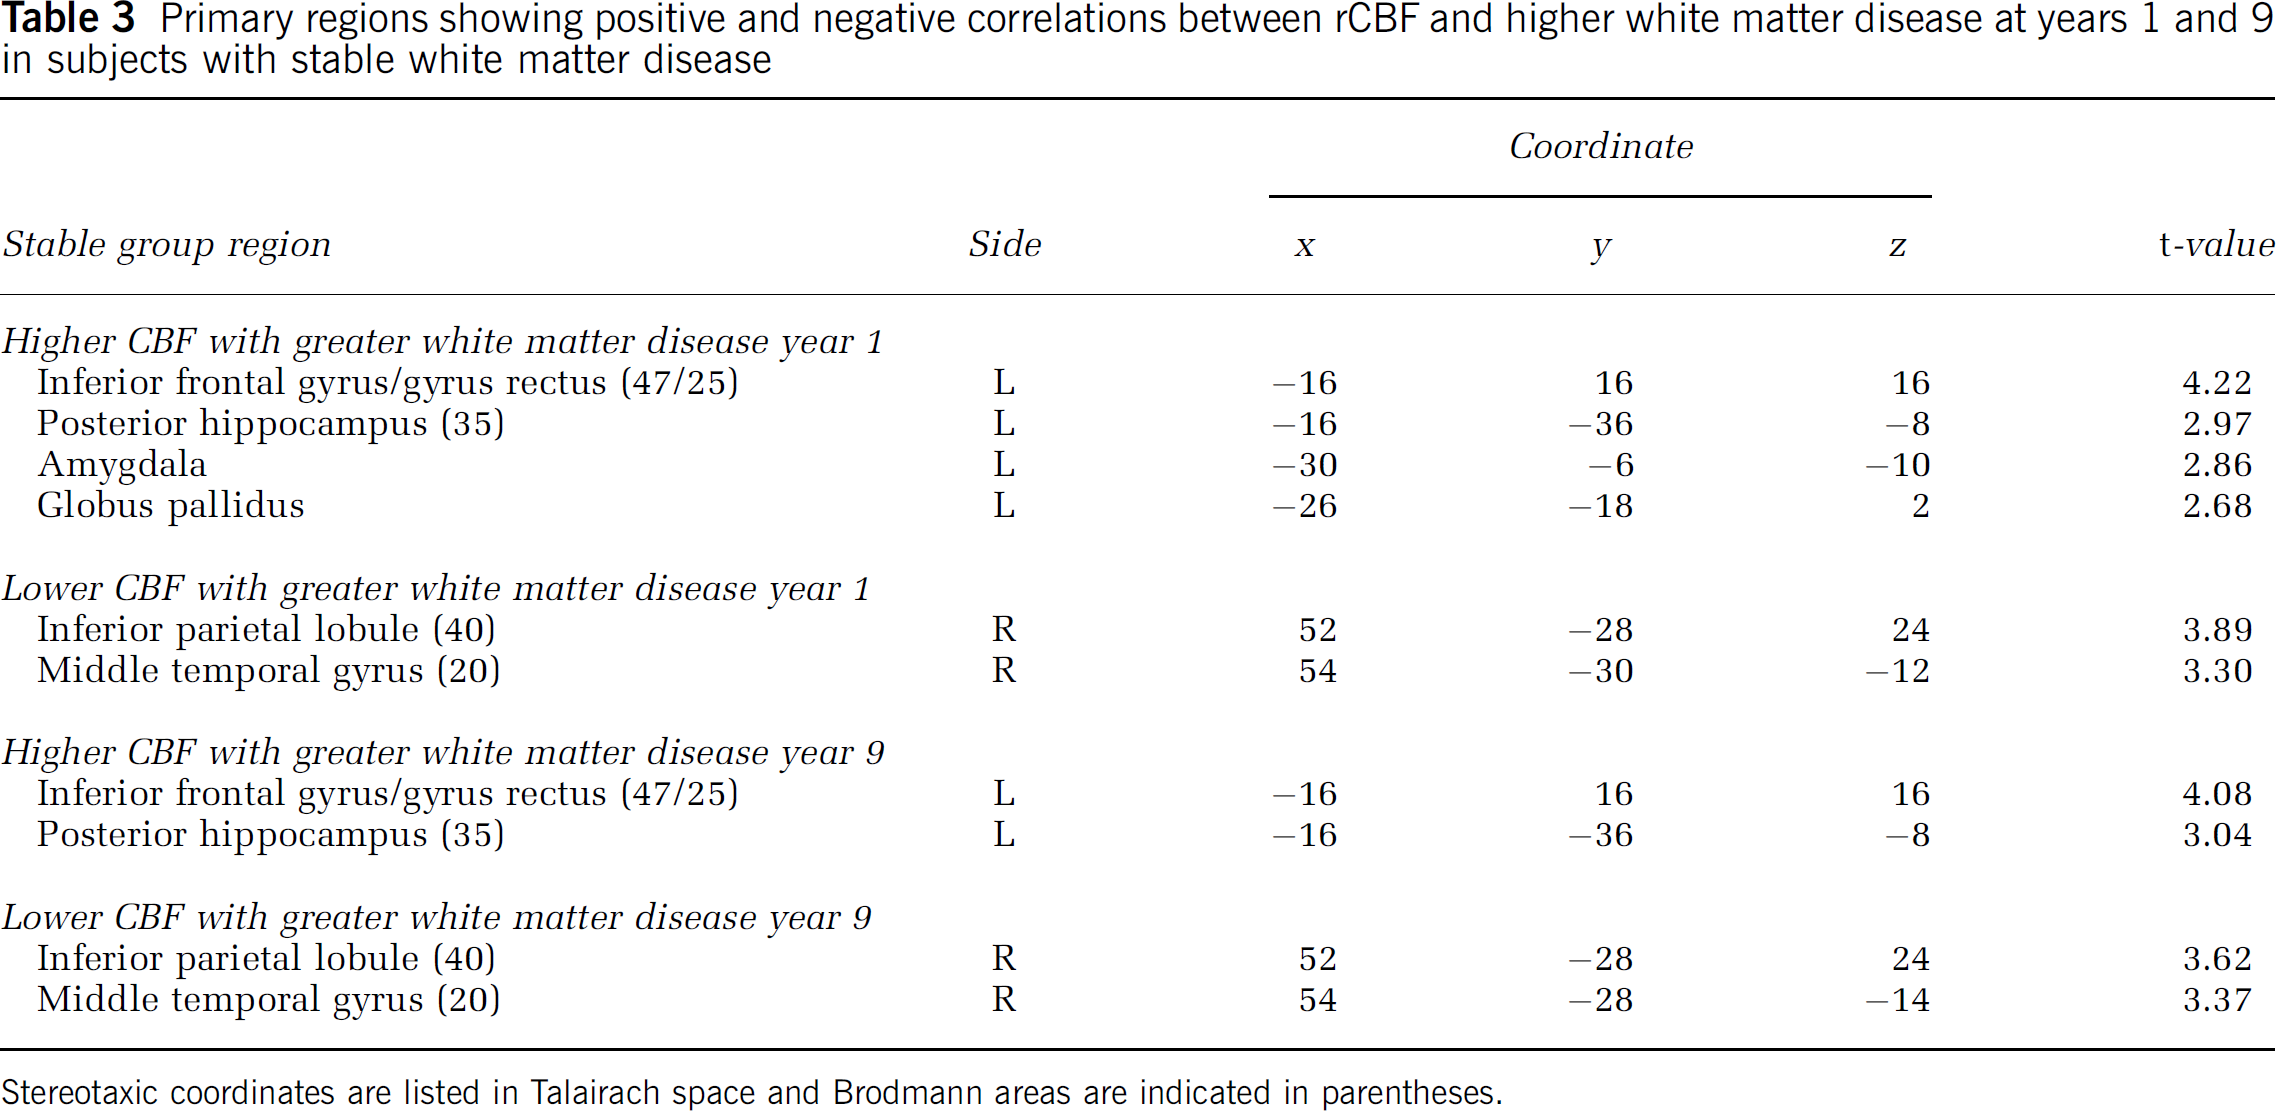
Stereotaxic coordinates are listed in Talairach space and Brodmann areas are indicated in parentheses.
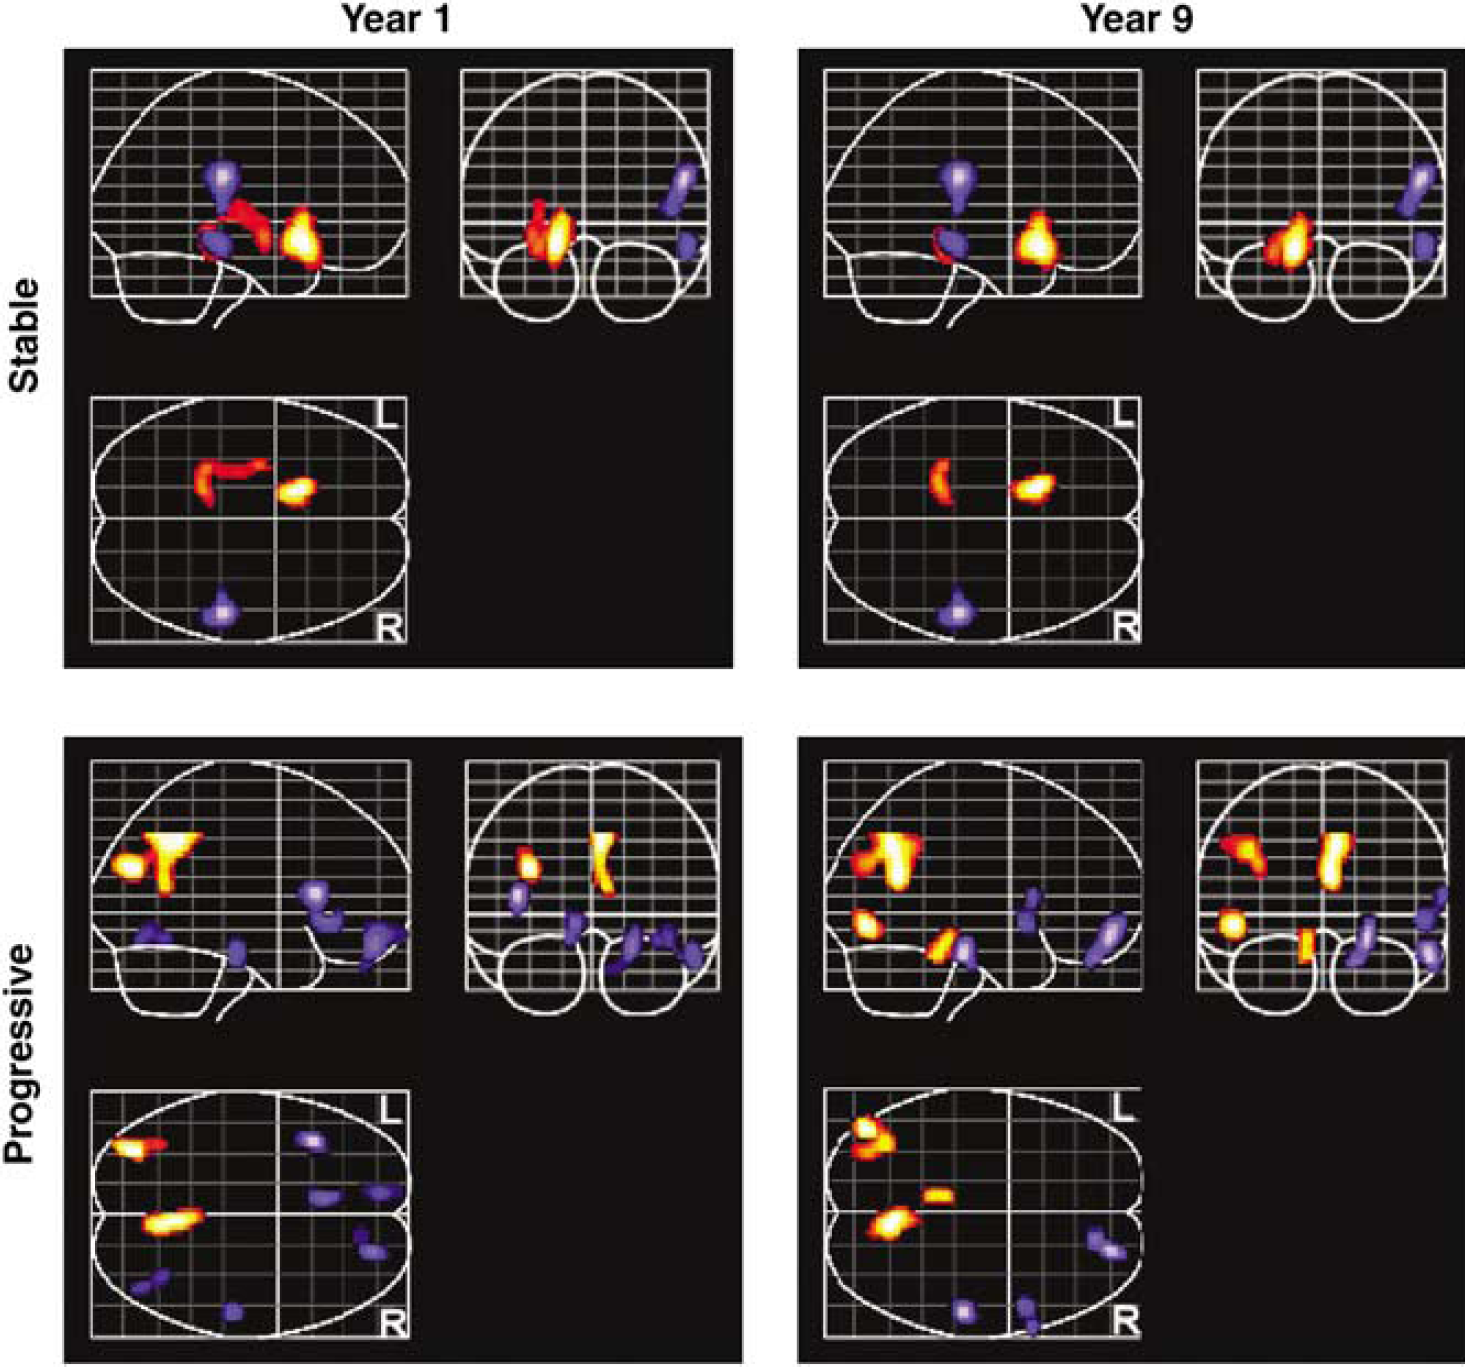
Regions of positive (orange) and negative (blue) correlations between CBF and higher grade of white matter disease at years 1 and 9 in the two groups of subjects.
In the progressive group at year 1, the left angular gyrus, posterior left middle temporal gyrus, and right precuneus show positive associations between rCBF and greater WM disease burden. At year 9, the regions showing positive associations are more extensive, and include the right precuneus, the left angular gyrus/posterior middle temporal gyrus, and the left side of the midbrain and pontine tegmentum. Reductions in rCBF in association with greater WM burden are observed in the left anterior insula, left rostral cingulate, left medial frontal gyrus, the polar aspect of the right superior frontal gyrus extending into the right gyrus rectus, right inferior temporal gyrus, and right fusiform gyrus at year 1. At year 9, the rCBF reductions as a function of WM disease burden are less widespread, focused in the rostral and orbital parts of the right frontal lobe, right inferior frontal gyrus, right rostral fusiform, and the rostral aspect of the right middle temporal gyrus (Table 4 and Figure 2). The results of the conjunction analyses confirm that the relationship between WM score and rCBF in the progressive group at both years is different from that observed in the stable group.
Primary regions showing positive and negative correlations between rCBF and higher white matter disease at years 1 and 9 in subjects with progressive white matter disease
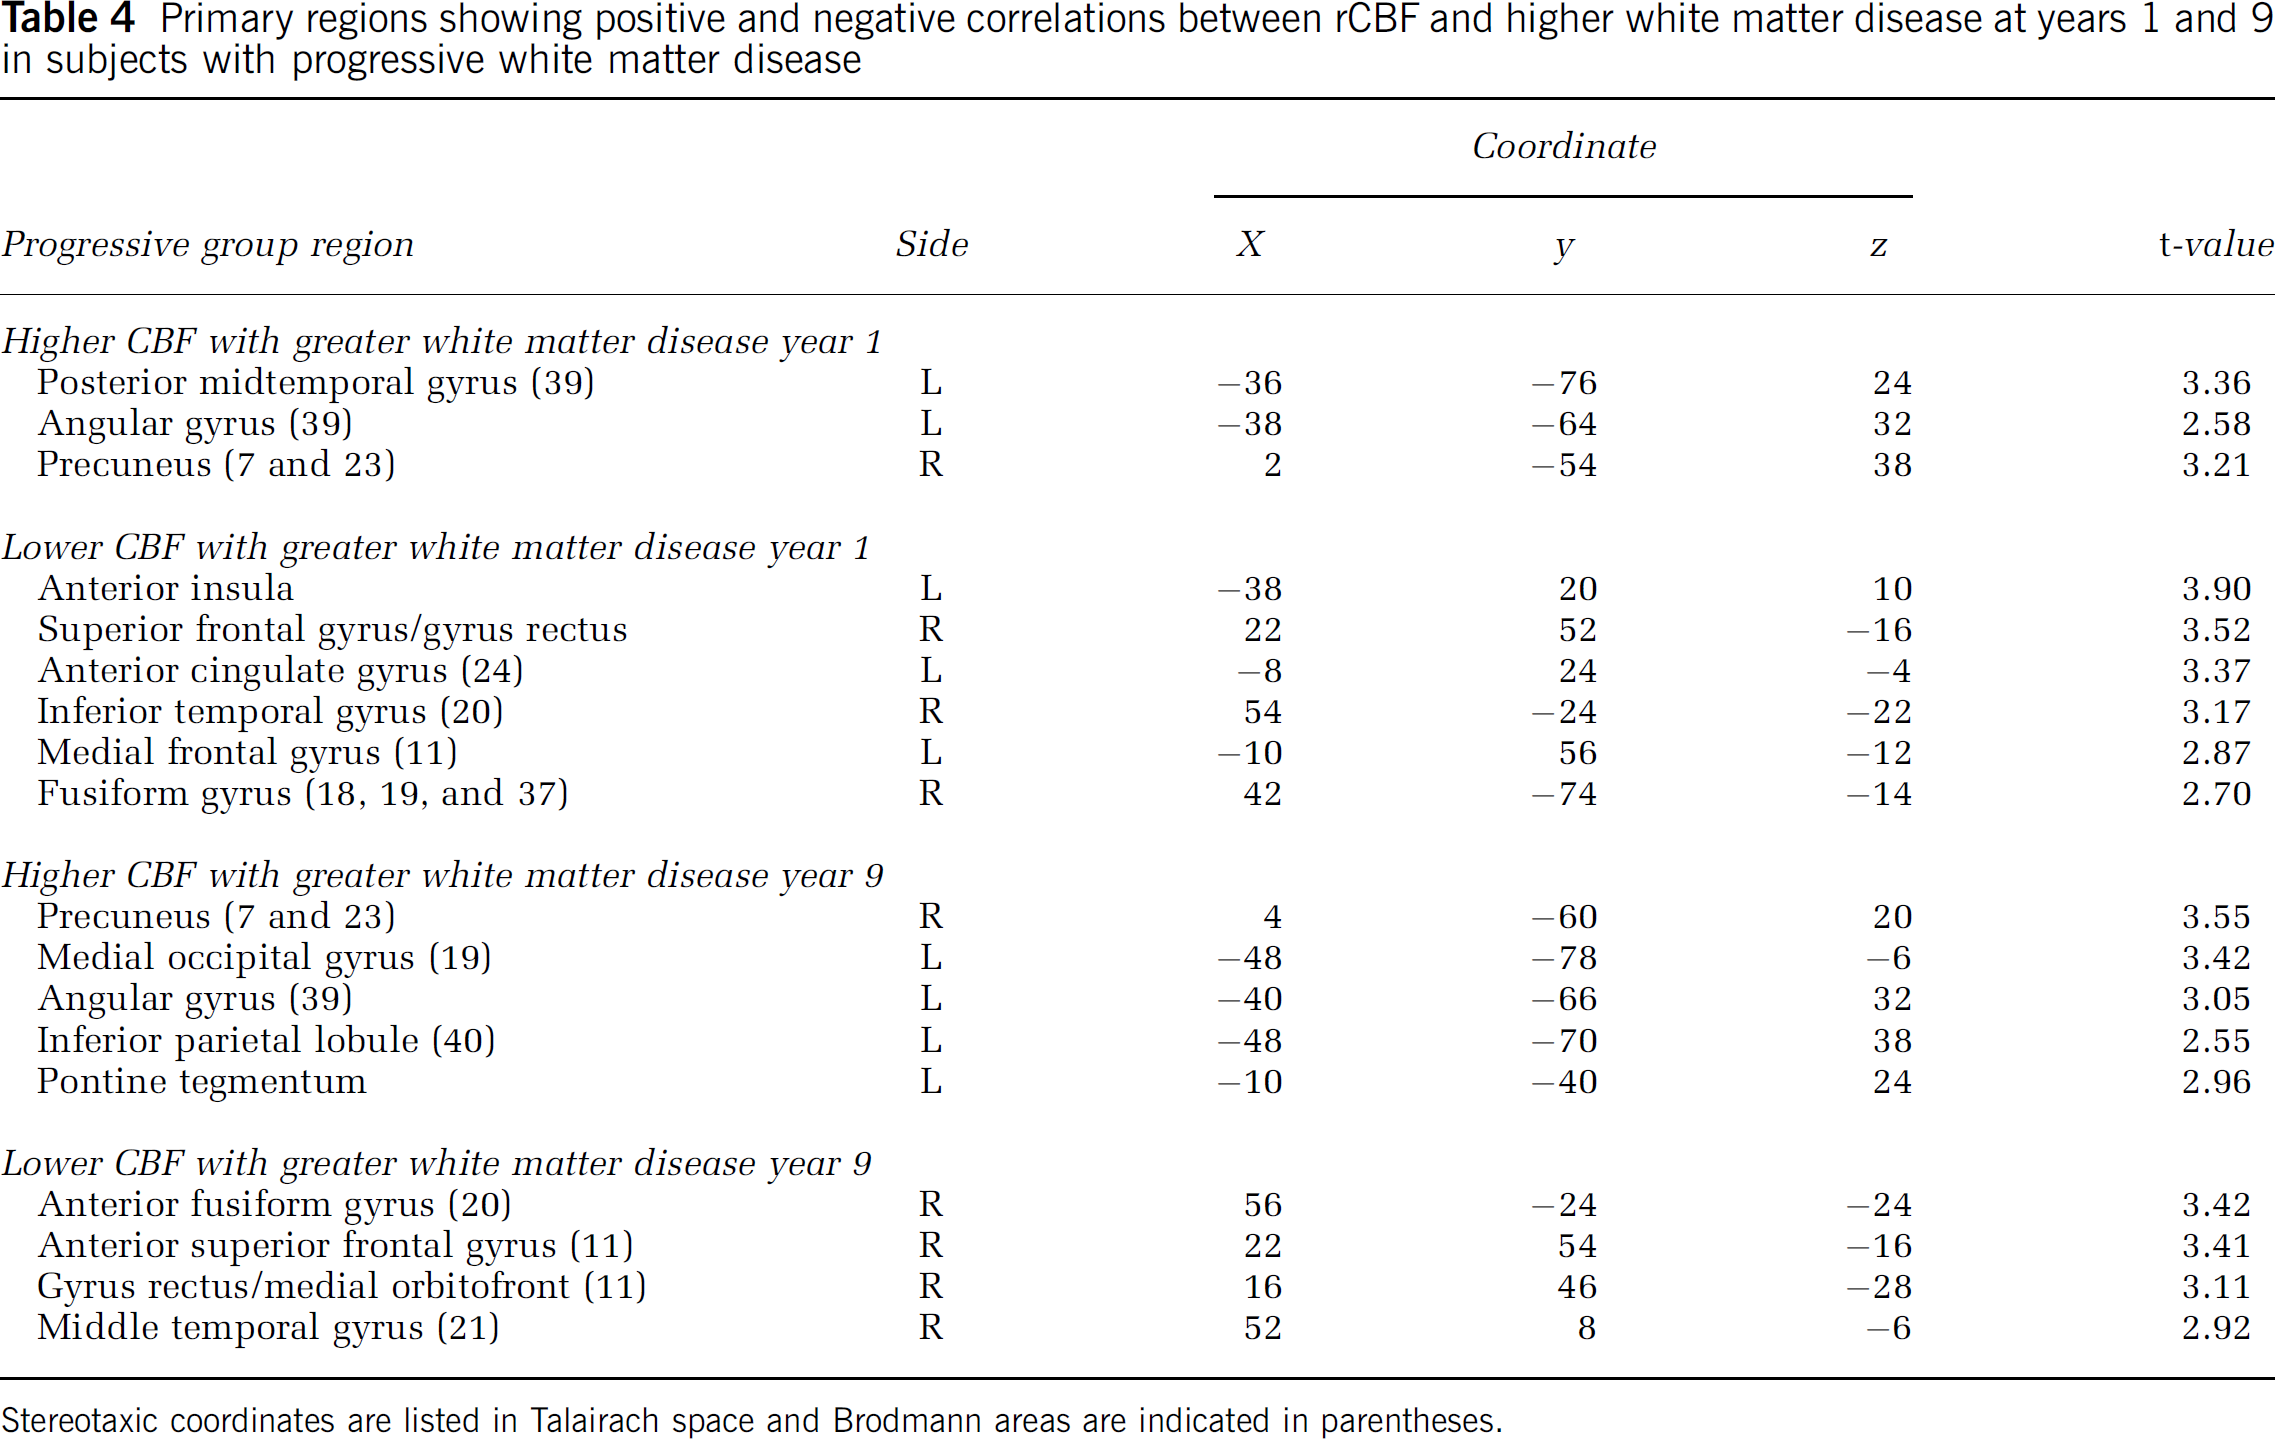
Stereotaxic coordinates are listed in Talairach space and Brodmann areas are indicated in parentheses.
Longitudinal Changes in Regional Cerebral Blood Flow
Changes in resting rCBF were observed over time in both groups when adjusting for WM score, with the progressive group showing a significantly different pattern of longitudinal rCBF change relative to the stable group in several brain regions. The progressive group shows greater increase over time compared with the stable group in the right inferior temporal gyrus/fusiform gyrus, the right anterior cingulate, and the rostral aspect of the left superior temporal gyrus. Regions of greater longitudinal decrease in the progressive group are observed in the right inferior parietal lobule and at the right occipital pole. These data are shown in Table 5 and Figure 3.
Main areas where the progressive group shows greater increases or decreases in CBF over the 8-year period compared with the stable group
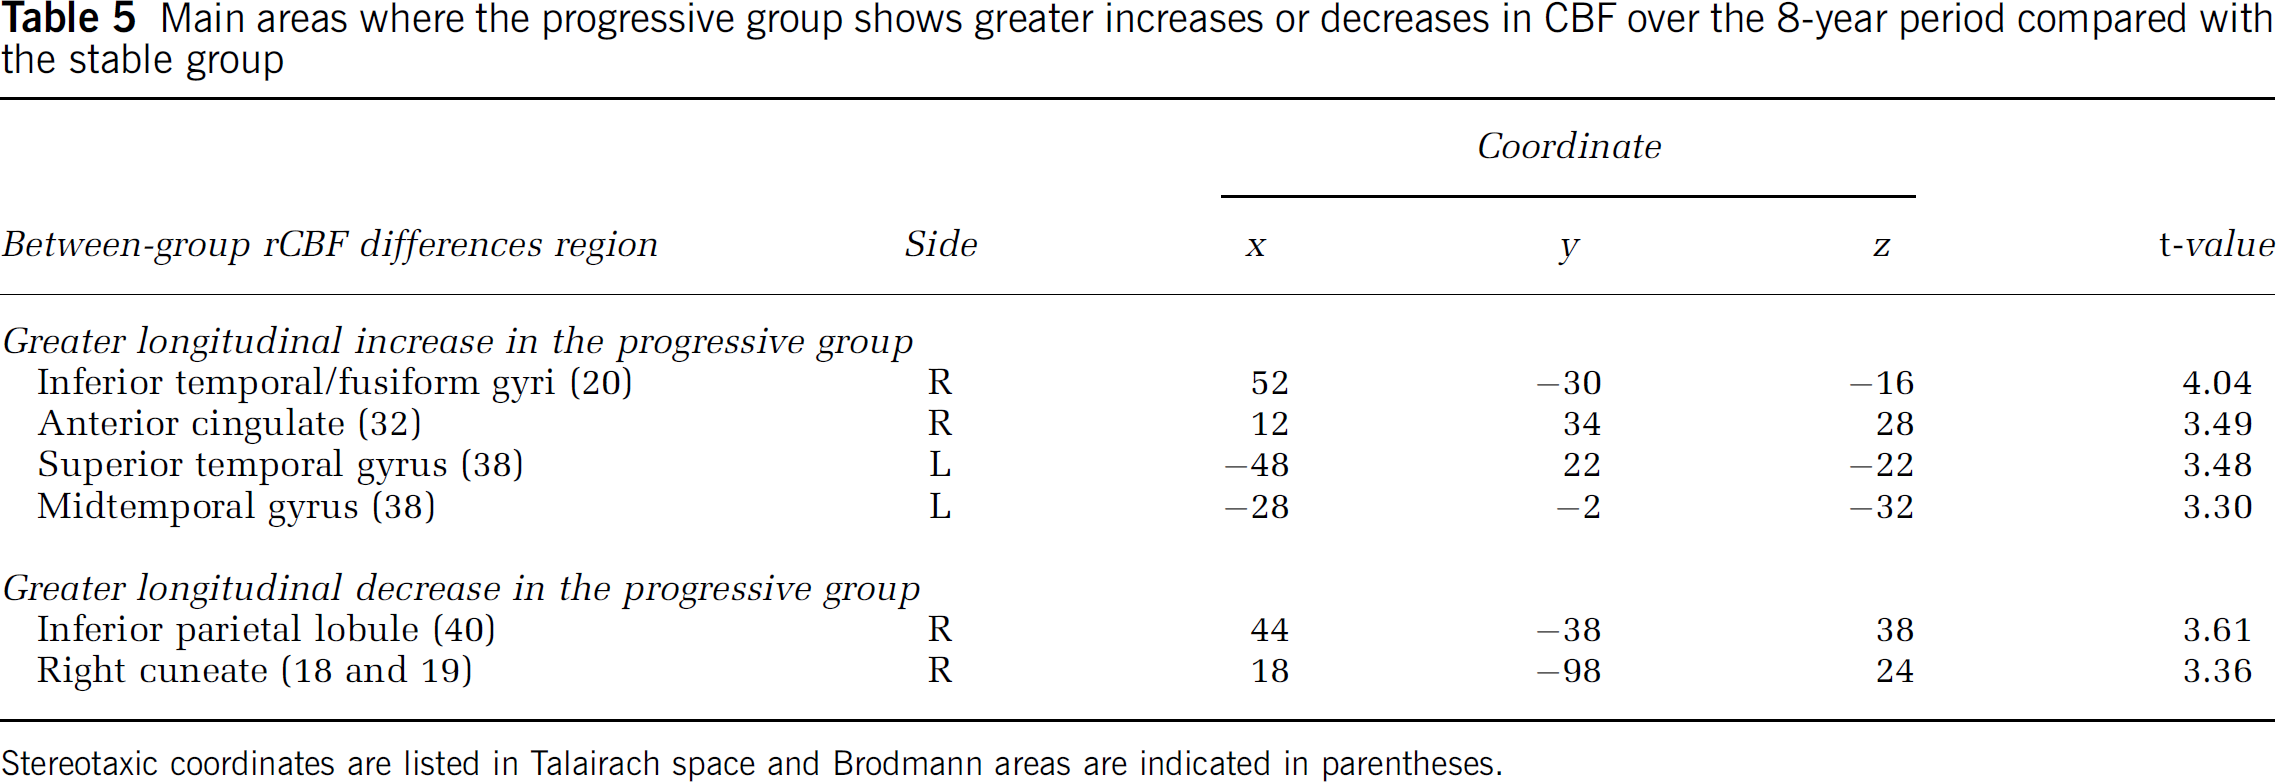
Stereotaxic coordinates are listed in Talairach space and Brodmann areas are indicated in parentheses.
Stereotaxic coordinates are listed in Talairach space and Brodmann areas are indicated in parentheses.
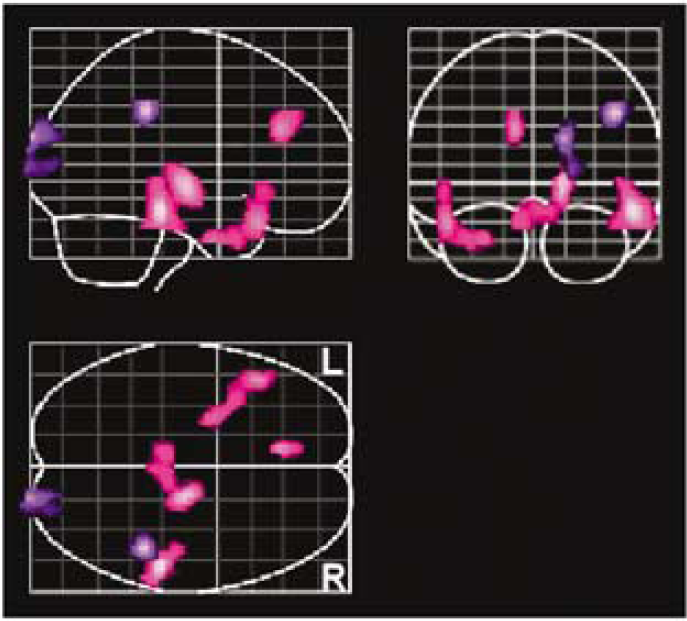
Regions where the progressive group had greater longitudinal increases in CBF (magenta) and decreases (purple) in CBF than the stable group.
Discussion
Our data show that WM signal abnormalities are associated significantly with resting cerebral blood flow patterns. Furthermore, individuals whose WM abnormalities are destined to worsen exhibit a different relationship between patterns of rCBF and WM severity early in the development of WM abnormalities compared with those whose WM scores remain stable.
The potential risk factors for cerebrovascular disease showed by the subjects in this study are typical for older people and were relatively evenly manifested across both groups. White matter abnormalities in our sample are comparable to those reported by Yue et al (1997) in the CHS cohort of community-living older individuals, where approximately 75% of both men and women in the 80 + year age group had WM grades of 3 or below. Thus, even modest WM disease and relatively mild changes in the WM over time are associated with statistically significant changes in the regional patterns of cerebral blood flow.
Individuals with stable WM abnormalities show higher rCBF as a function of WM grade in ventral frontal and mesial temporal cortices to the left of midline, and lower flow in relation to WM grade in the right inferior parietal lobe and right temporal lobe. Subjects with WM abnormalities that worsen over 8 years exhibited higher rCBF in association with higher WM grade in the left posterior parietal and posterior temporal regions. Lower rCBF in relation to WM grade in the progressive group was most evident in both rostral frontal lobes, in the rostral left cingulate, the right inferior temporal gyrus, and in the right fusiform gyrus. In this group, the regions that exhibited higher rCBF related to WM grade were more extensive at year 9 than they were at year 1, whereas the regions that showed reduced rCBF as a function of increasing WM grade were smaller and fewer in number over time. Conversely, in the group with stable-appearing WM, the regions with higher rCBF with higher grade WM were less extensive at year 9 compared with year 1. The regions with reduced rCBF as a function of increased WM grade were very similar at the two time points.
Even on controlling for the degree of WM pathology, our maps of the longitudinal changes in rCBF illustrate further alterations in blood flow over time in the progressive group relative to the stable group. There are extensive bilateral regions that show greater relative increases in rCBF in the group with progressive WM abnormalities compared with the stable WM group over time, whereas there are only a few small regions that show greater longitudinal decrease in the progressive WM group compared with the stable WM group. Together with the results illustrating regional cross-sectional associations between WM grade and CBF, these findings show that increasing WM pathology is related to longitudinal changes in rCBF patterns in the elderly brain.
The dynamics of WM disease progression and rCBF is complex and regionally specific. The observed increases in rCBF associated with WM pathology might relate to changes in resting cerebral cortical activity (and thus metabolic requirements), as accommodations are made for less efficient interregional WM connections. That is, regions of brain that are interconnected by deficient WM would have to maintain activity for longer periods or at a higher level to communicate with one another even in the resting state, either through the deteriorating pathways that had been used before WM degeneration had begun, or through less efficient indirect pathways. This prolonged cortical neural activity would require increased blood flow to meet the increased metabolic demands. This idea runs counter to several studies of the relationship between cerebral glucose metabolism and WM abnormalities, where in general it has been found that increased severity of WM disease correlates with reduced regional rates of cerebral glucose metabolism (DeCarli et al, 1995; Sultzer et al, 2002, 1995). None of these studies was longitudinal in design, however, and thus could not account for any intraindividual neural compensatory mechanism to changes in WM disease burden with time. Also, whereas those studies used glucose metabolism as a measure of brain metabolism, we used blood flow, and it may be that slow, prolonged changes in neural activity affect glucose metabolism and blood flow differently. For regions where rCBF decreases in association with WM pathology, the changes in blood flow patterns probably relate to aging or small vessel disease-related changes intrinsic to cerebral cortex for which the MRI-observable WM changes are simply an indirect proxy. Since blood supply to the subcortical as well as to the periventricular WM derives principally from small arteries penetrating the immediately overlying cortex (Nonaka et al, 2003), reduced cortical and subcortical blood flow with increasing WM disease may reflect a long-term, low-level ischemia that ultimately results in the MRI-observable WM signal abnormality.
At both individual and group levels, the WM abnormalities were relatively mild, symmetric about the midline, and more focused in the periventricular than in the subcortical WM. One might expect, therefore, to see more widespread and symmetric reductions in rCBF than we observed. Also, given that homologous cortical regions in the right and left hemispheres of the brain have similar cyto- and myelotectonics and thus similar metabolic profiles, one would expect that either regional hemodynamically mediated changes due to end-vessel compromise, or global changes mediated by more proximal vascular disease, would be distributed in a roughly symmetric pattern about the midline. The fact that focal, hemispherically asymmetric as opposed to widespread, symmetric reductions in blood flow were detected could be related to regional variations in cortical vulnerability to small vessel disease, or to differences in the degree to which tonic or resting cortical activity, and thus metabolic/blood flow requirements, depends on afferent inputs transmitted through underlying WM. Another possibility is the relative insensitivity of standard MRI techniques for finding early pathologic changes in WM.
The etiology of the differences in the patterns of rCBF changes between the two groups remains unclear. Perhaps in the group with stable WM abnormalities, the lesions are established and largely fixed, whereas in the group with progressive WM disease, regions of associations between rCBF and WM burden reflect areas that are at risk. In the second group, the number and extent of regions that show rCBF increases over time are greater than those in the group with stable WM. Thus, the processes of compensatory cortical activity may be evolving along with the WM disease. In contrast, the brain tissue in the group with stable disease has already largely incurred the damage that it is going to sustain, with little further deterioration and thus little impetus for ongoing compensatory change in neuronal activity.
Although the mechanisms underlying our observations have yet to be clarified, it is clear that severity of WM disease and changes in these abnormalities over time should be considered when evaluating patterns of age-related changes in rCBF. The ultrastructural changes that contribute to the MRI-observable signal abnormalities, and the relationship between regional cortical blood flow changes and the subjacent or more extended WM pathology, await further study. Areas of future investigation in our sample and elsewhere may include absolute as opposed to relative measures of blood flow using PET or arterial spin-labeling MRI, in conjunction with MRI diffusion tensor imaging-based metrics of WM integrity. Associations between changes in longitudinal measures using such techniques and longitudinal cognitive changes could also contribute to the understanding of the behavioral consequences of both the WM changes and related compensatory brain mechanisms.
Footnotes
Acknowledgements
We gratefully acknowledge the staffs of the Baltimore Longitudinal Study of Aging and the Johns Hopkins MRI and PET facilities for their assistance, and the BLSA participants for their continued dedication to this study.