
Abstract
Hypercapnia induces cerebral vasodilation and increases cerebral blood flow (CBF), and hypocapnia induces cerebral vasoconstriction and decreases CBF. The relation between changes in CBF and cerebral blood volume (CBV) during hypercapnia and hypocapnia in humans, however, is not clear. Both CBF and CBV were measured at rest and during hypercapnia and hypocapnia in nine healthy subjects by positron emission tomography. The vascular responses to hypercapnia in terms of CBF and CBV were 6.0 ± 2.6%/mm Hg and 1.8 ± 1.3%/mm Hg, respectively, and those to hypocapnia were −3.5 ± 0.6%/mm Hg and −1.3 ± 1.0%/mm Hg, respectively. The relation between CBF and CBV was CBV = 1.09 CBF0.29. The increase in CBF was greater than that in CBV during hypercapnia, indicating an increase in vascular blood velocity. The degree of decrease in CBF during hypocapnia was greater than that in CBV, indicating a decrease in vascular blood velocity. The relation between changes in CBF and CBV during hypercapnia was similar to that during neural activation; however, the relation during hypocapnia was different from that during neural deactivation observed in crossed cerebellar diaschisis. This suggests that augmentation of CBF and CBV might be governed by a similar microcirculatory mechanism between neural activation and hypercapnia, but diminution of CBF and CBV might be governed by a different mechanism between neural deactivation and hypocapnia.
Hypercapnia induces cerebral vasodilation and increases cerebral blood flow (CBF), and hypocapnia induces cerebral vasoconstriction and decreases CBF (Kety and Schmidt, 1948; Raper et al., 1971; Ito et al., 2000). Because the vascular responsiveness to vasodilator in the brain with insufficient cerebral perfusion pressure is reduced by autoregulatory vasodilation (Kanno et al., 1988), hypercapnia can be used to estimate cerebral perfusion reserve in occlusive cerebrovascular disease (Herold et al., 1988; Levine et al., 1991; Kuwabara et al., 1997).
An increase in CBF with no change in the density of perfused capillaries during hypercapnia has been observed in animals at the microvascular level (Gobel et al., 1989); change in capillary diameter during hypercapnia and hypocapnia has also been observed in animals (Duelli and Kuschinsky, 1993). The increase in cerebral blood volume (CBV), including arterial, capillary, and venous blood volume, during hypercapnia in animals has been shown to be less than the increase in CBF (Grubb et al., 1974; Bereczki et al., 1993; Keyeux et al., 1995; Lee et al., 2001). The degree of decrease in CBV during hypocapnia in animals has also been shown to be less than that in CBF (Grubb et al., 1974). To our knowledge, however, there has been no investigation into the relation between changes in CBF and changes in CBV during hypercapnia and hypocapnia in humans.
Previously, we investigated changes in both regional CBF and CBV in humans during visually evoked neural activation; investigation was by positron emission tomography (PET) with H215O and 11CO (Ito et al., 2001). Our results indicated that when the increase in CBF is great, it is caused primarily by an increase in vascular blood velocity rather than by an increase in CBV. We also investigated changes in both regional CBF and CBV in humans during neural deactivation observed under crossed cerebellar diaschisis; investigation was by PET with H215O and C15O (Ito et al., 2002). The degree of decrease in CBF and CBV during neural deactivation was almost identical, indicating no change in vascular blood velocity during neural deactivation.
In the present study, changes in CBF and CBV during hypercapnia and hypocapnia were measured in humans by PET with H215O and 11CO, respectively. H215O and 11CO PET studies were performed at rest and during hypercapnia and hypocapnia in each of nine normal subjects, and changes in CBF and CBV were determined.
METHODS
Subjects
The study was approved by the Ethics Committee of the Akita Research Institute of Brain and Blood Vessels. Nine healthy men (20 to 24 years of age) were recruited and gave written informed consent to participate. The subjects were judged healthy on the basis of their medical history, a physical examination, blood screening analysis, and magnetic resonance imaging (MRI) of the brain.
PET procedures
The Headtome-V PET system (Shimadzu Corp., Kyoto, Japan) used for all studies provides 47 slices with center-to-center distances of 3.125 mm (Iida et al., 1996). The intrinsic spatial resolution was 4.0 mm in plane and 4.3 mm full width at half maximum (FWHM) axially. Reconstruction with a Butterworth filter resulted in a final in-plane resolution of approximately 8 mm full width at half maximum (FWHM). Data were acquired in two-dimensional mode.
PET measurements with H215O and 11CO were performed in each subject under three conditions: at rest (baseline), during hypercapnia, and during hypocapnia with the eyes closed. Hypercapnia was induced by inhalation of 7% CO2 gas starting 1 minute before scanning and continuing until the end of scanning. Hypocapnia was induced by hyperventilation starting 1 minute before scanning and continuing until the end of scanning (Kanno et al., 1988). H215O and 11CO PET studies were performed at rest, during hypercapnia, and during hypocapnia in four subjects; studies were performed at rest, during hypocapnia, and then during hypercapnia in the other five subjects.
H215O PET study
H215O PET studies were performed at rest and during hypercapnia and hypocapnia, after transmission scanning. The interval between studies was at least 15 minutes. The protocol consisted of 180 seconds of static scanning after continuous intravenous infusion of H215O during 2 minutes. The dose of radioactivity was 1.1 to 1.8 GBq at the start of scanning. The arterial input function was obtained by continuous beta probe measurement of radioactivity in arterial whole blood taken from the radial artery. Dispersion and delay in the beta detector system and in the internal arterial line were corrected as reported previously (Iida et al., 1986, 1988). Cerebral blood flow images were calculated by the autoradiographic method (Raichle et al., 1983; Kanno et al., 1987; Iida et al., 1998). Two arterial blood samples were taken—one at the beginning and one at the end of scanning—for measurement of arterial CO2 gaseous pressure. A head fixation system with individualized molds for each subject was used to minimize head movement during PET.
11CO PET study
11CO PET studies were then performed to measure CBV (Phelps et al., 1979). After 5 minutes of continuous inhalation of 11CO gas (approximately 5 GBq by mouth), static PET scanning was started at 5, 19, and 33 minutes. Each scan was performed at rest and during hypercapnia and hypocapnia, with a scan time of 4 minutes. Three arterial blood samples were taken during each scanning for measurement of whole blood radioactivity concentration and arterial CO2 gaseous pressure.
Data analyses
All CBF and CBV images were transformed into the standard brain size and shape by linear and nonlinear parameters with the SPM99 system for anatomic standardization (Friston et al., 1990). Thus, the brain images of all subjects had the same anatomic format. Regions of interest were drawn on all standardized images. Elliptical regions of interest were defined for the cerebellar cortex and four cerebral cortices representing the frontal, temporal, parietal, and occipital lobes (16 mm × 32 mm). Average values of four cerebral cortices were calculated.
The vascular response to change in PaCO2 was calculated as the percentage changes in CBF and CBV per absolute change in PaCO2 (mm Hg) in response to hypercapnia and hypocapnia (Kanno et al., 1988):
Vascular response to PaCO2 change in CBF (%/mm Hg) =
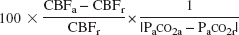
Vascular response to PaCO2 change in CBV (%/mm Hg) =
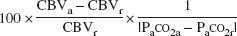
where the subscripts “r” and “a” denote rest and activation conditions (hypercapnia or hypocapnia), respectively.
The vascular mean transit time (MTT) was calculated as follows (Powers et al., 1984):

RESULTS
Average PaCO2, PaO2, pH, blood pressure, and heart rate during each PET scanning are given in Table 1. PaCO2 values increased significantly during hypercapnia (P < 0.001) and decreased significantly during hypocapnia (P < 0.001) in both H215O and 11CO PET studies. Arterial hemoglobin concentrations and hematocrit were 14.9 ± 1.3 g/dL and 44.4 ± 3.6%, respectively (mean ± SD). Significant differences between H215O and 11CO PET studies were observed in systolic and diastolic blood pressures obtained during baseline study and heart rate obtained during hypercapnia (P < 0.05). No significant differences between studies were observed in PaCO2, PaO2, or pH.
Pa
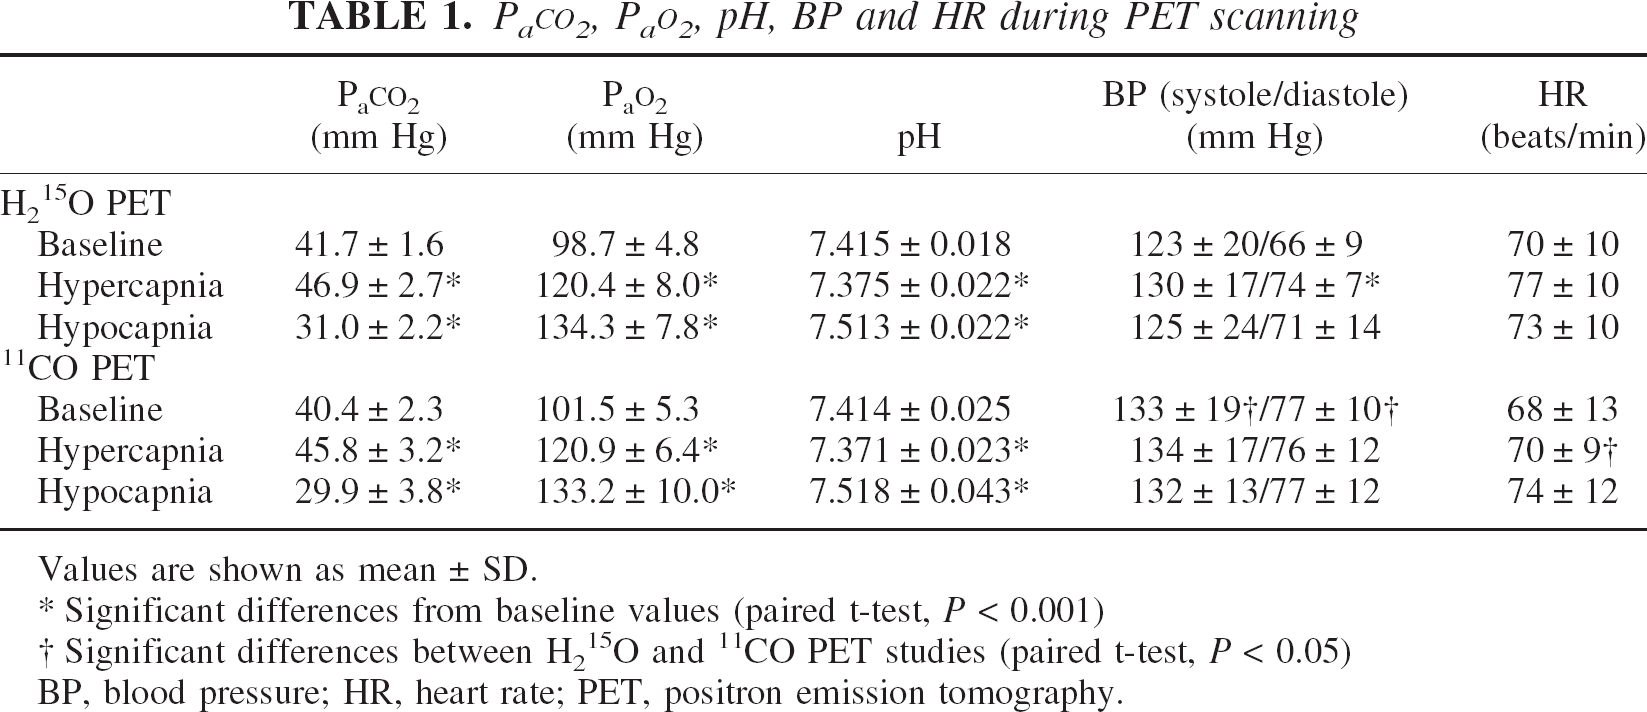
Values are shown as mean ± SD.
Significant differences from baseline values (paired t-test, P < 0.001)
Significant differences between H215O and 11CO PET studies (paired t-test, P < 0.05)
BP, blood pressure; HR, heart rate; PET, positron emission tomography.
Baseline CBF, CBV, MTT, and values during hypercapnia and hypocapnia in the cerebral cortex and cerebellum are given in Table 2. Both CBF and CBV increased significantly during hypercapnia (P < 0.001–0.05) and decreased significantly during hypocapnia (P < 0.001–0.05). Mean transit time decreased significantly during hypercapnia (P < 0.001–0.01), and increased significantly during hypocapnia (P < 0.001–0.01). Average CBF and CBV images for baseline, hypercapnia, and hypocapnia conditions are shown in Fig. 1. Both CBF and CBV increased globally during hypercapnia and decreased globally during hypocapnia.
CBF, CBV, and MTT during the three study conditions
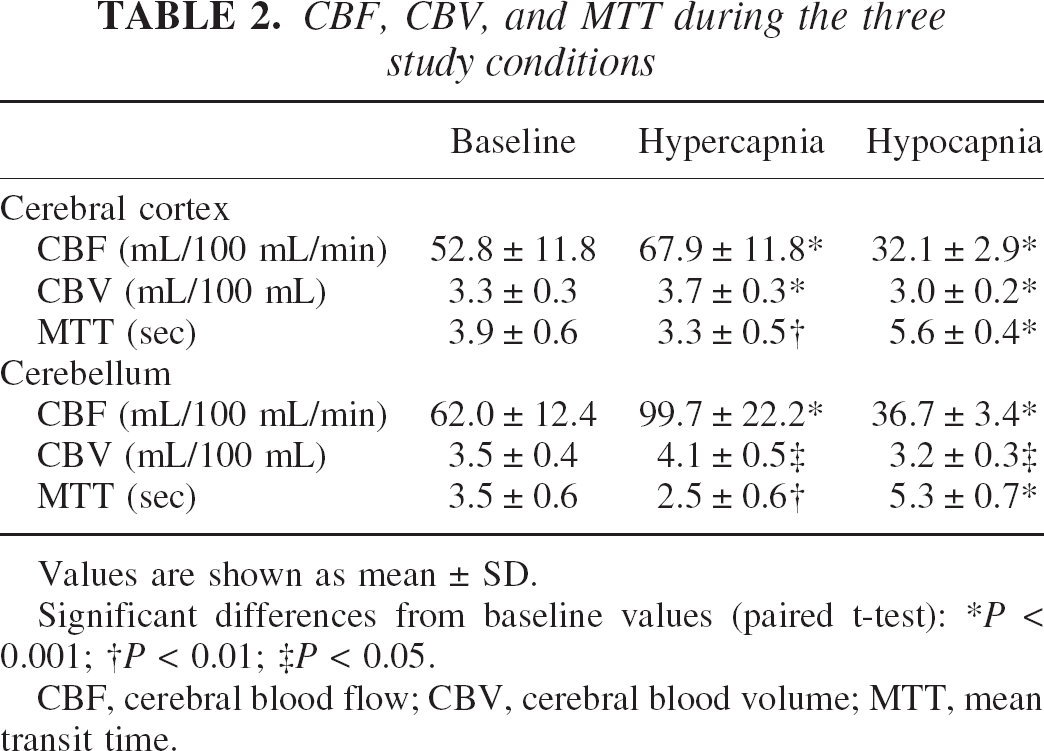
Values are shown as mean ± SD.
Significant differences from baseline values (paired t-test):
P < 0.001;
P < 0.01;
P < 0.05.
CBF, cerebral blood flow; CBV, cerebral blood volume; MTT, mean transit time.
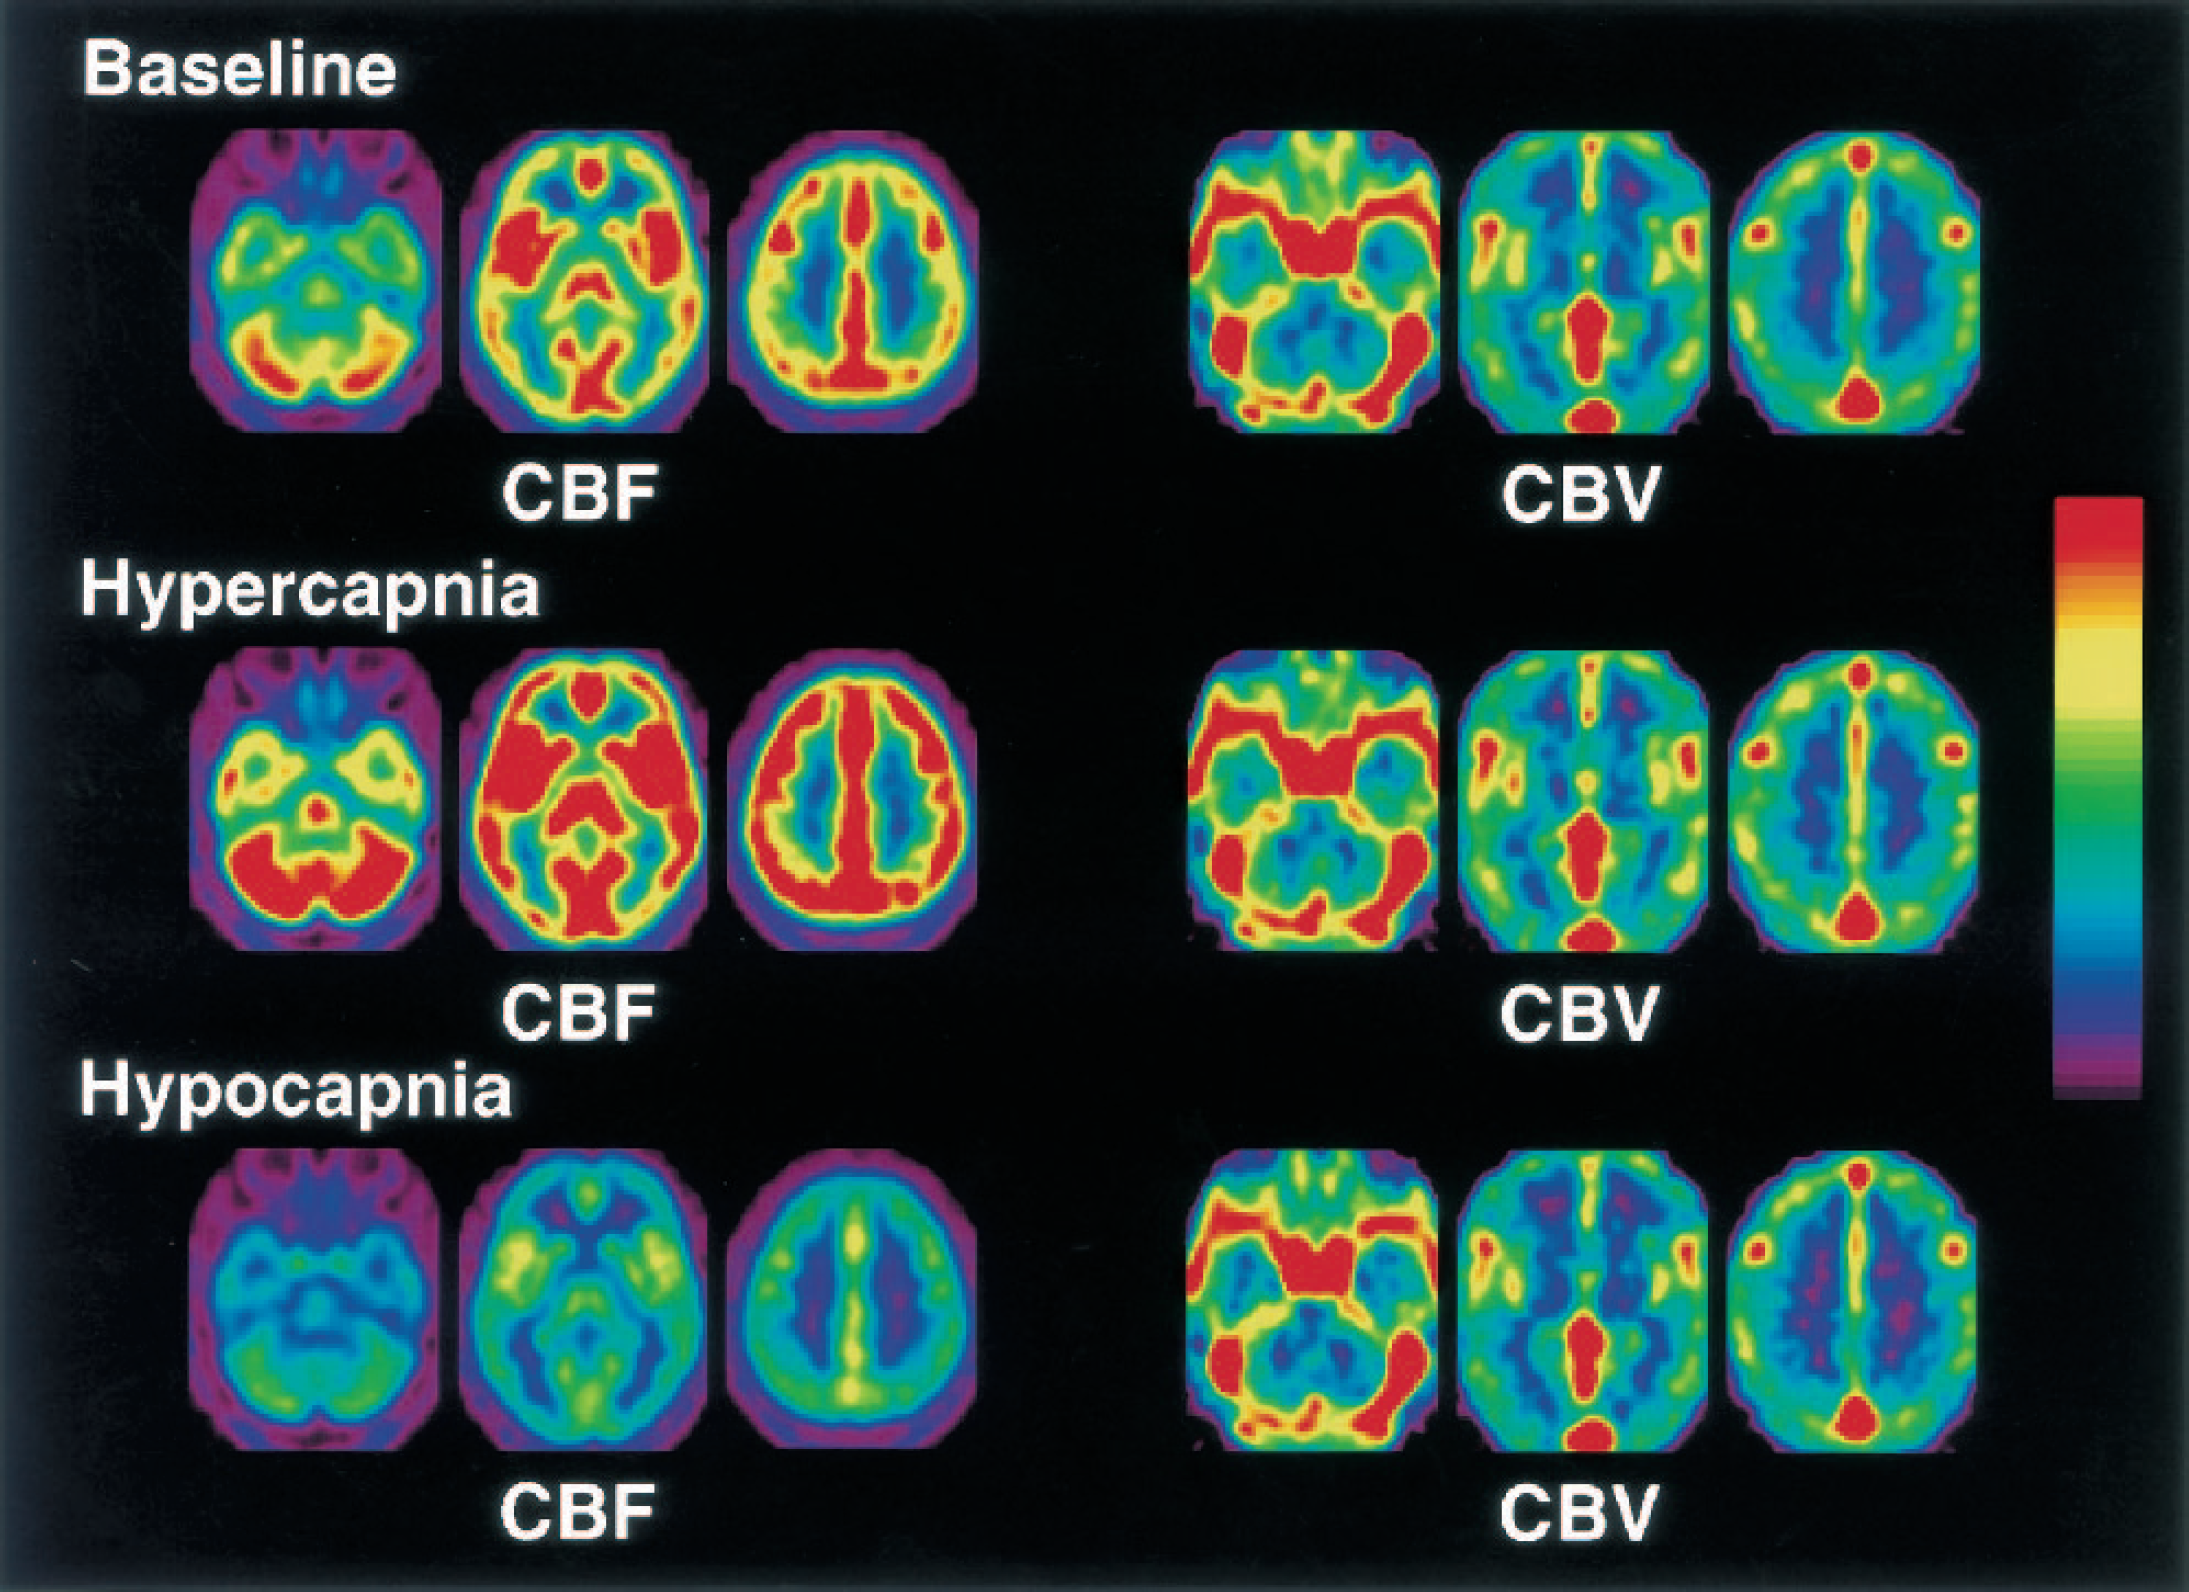
Average cerebral blood flow (CBF) and cerebral blood volume (CBV) images for baseline, hypercapnia, and hypocapnia conditions. All images are transaxial sections parallel to the anterior–posterior commissure (AC-PC) line. The slice positions are −36, 0, and 34 mm from the AC-PC line in the standard brain. Scale maximum and minimum values are 70 and 0 mL·100 mL−1min−1 for CBF, and 8 and 0 mL/100 mL for CBV, respectively.
Changes in both CBF and CBV during hypercapnia and hypocapnia are given in Table 3. Significant differences between changes in CBF and CBV were observed for both hypercapnia and hypocapnia in both the cerebral cortex and cerebellum (P < 0.001–0.01).
Percentage changes in both CBF and CBV in response to hypercapnia and hypocapnia for the cerebral cortex and cerebellum
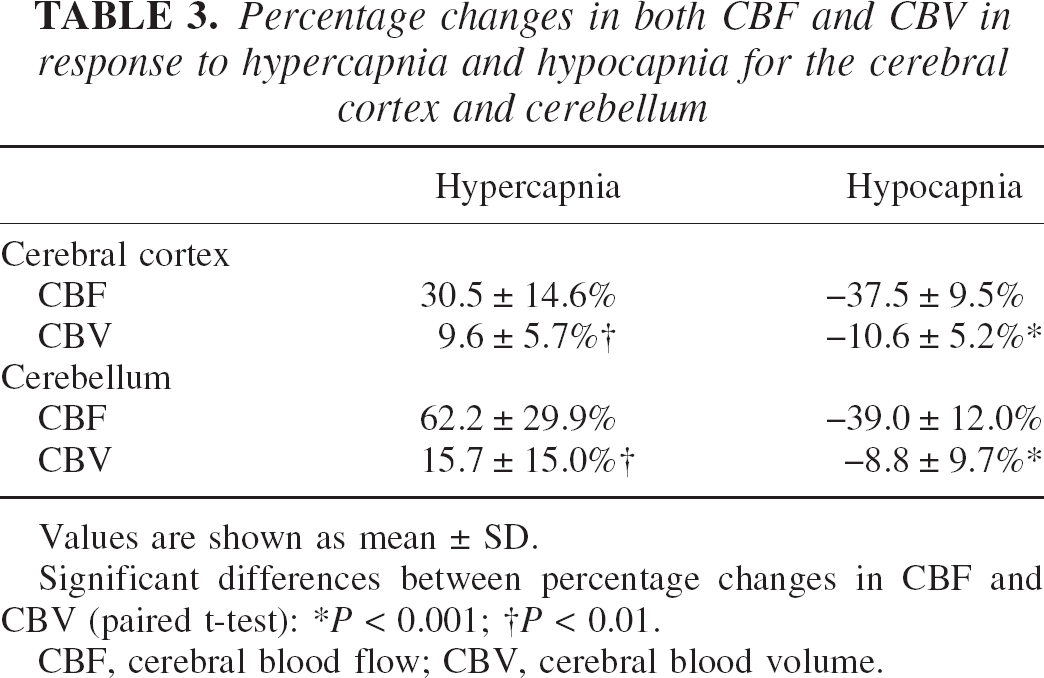
Values are shown as mean ± SD.
Significant differences between percentage changes in CBF and CBV (paired t-test):
P < 0.001;
P < 0.01.
CBF, cerebral blood flow; CBV, cerebral blood volume.
Vascular responses in terms of both CBF and CBV in response to changes in PaCO2 due to hypercapnia and hypocapnia are given in Table 4. Significant differences between vascular responses in terms of CBF and CBV were observed for both hypercapnia and hypocapnia in the cerebral cortex (P < 0.001–0.01) and for hypercapnia in the cerebellum (P < 0.05).
Vascular responses in both CBF and CBV in response to changes in Pa
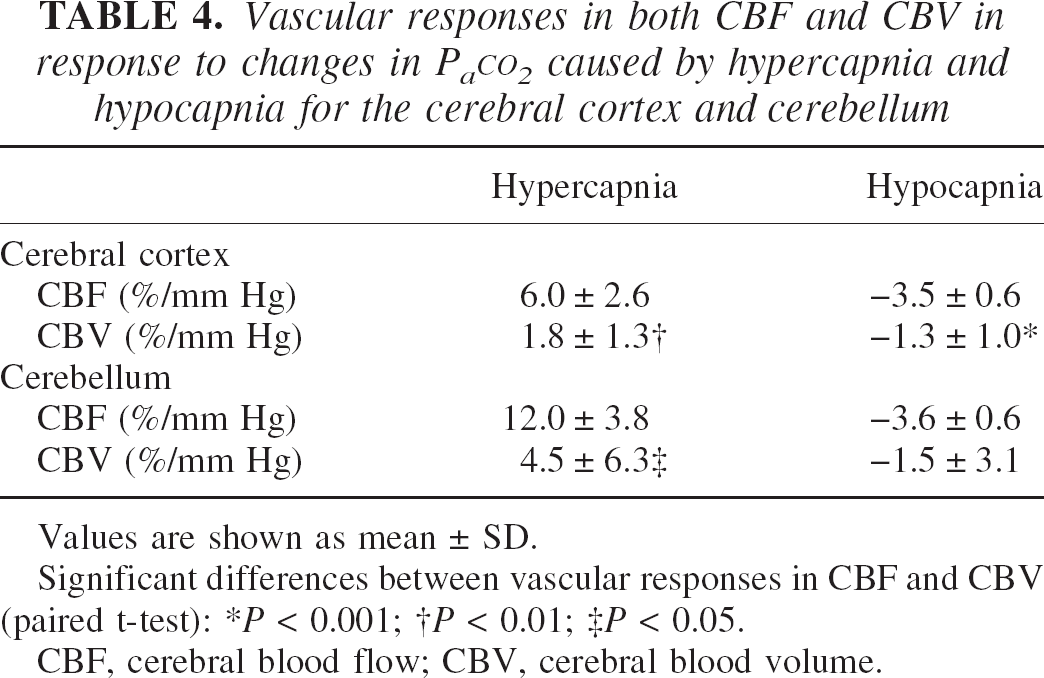
Values are shown as mean ± SD.
Significant differences between vascular responses in CBF and CBV (paired t-test):
P < 0.001;
P < 0.01;
P < 0.05.
CBF, cerebral blood flow; CBV, cerebral blood volume.
The relation between CBF and CBV values for baseline, hypercapnia, and hypocapnia conditions in the cerebral cortex is shown for all subjects in Fig. 2. The relation between CBF and CBV was determined by leastsquares analysis as previously reported (Grubb et al., 1974): CBV = 1.09CBF0.29.
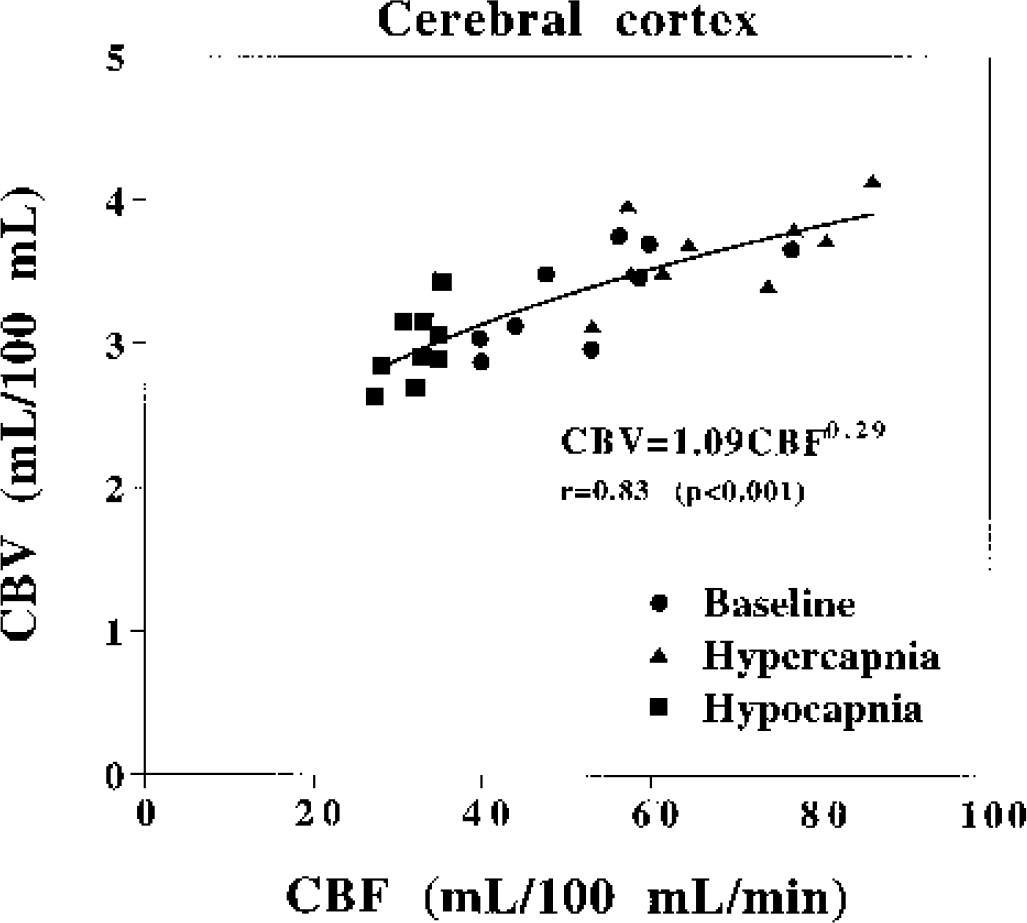
The relations between cerebral blood flow and cerebral blood volume values for baseline, hypercapnia, and hypocapnia conditions for all subjects.
DISCUSSION
In our study, the increase in CBF was greater than that in CBV during hypercapnia, resulting in a decrease in MTT. This indicates that the vascular blood velocity increases during hypercapnia if the vascular path length does not change. The degree of decrease in CBF during hypocapnia was also greater than that in CBV, resulting in an increase in MTT. This indicates that the vascular blood velocity decreases during hypocapnia if the vascular path length does not change. The present results are closely aligned with reported findings in animals studied during hypercapnia and hypocapnia (Grubb et al., 1974; Bereczki et al., 1993; Keyeux et al., 1995; Lee et al., 2001). The relation between CBF and CBV values during changes in PaCO2 in monkeys has been estimated as CBV = 0.80CBF0.38. (Grubb et al., 1974). The relation between CBF and CBV during changes in PaCO2 in humans was determined in the present study to be CBV = 1.09CBF0.29, which corresponded closely with that reported previously. According to Poiseuille's law, the flow of blood through a vessel is proportional to the fourth power of the vessel diameter; blood volume is proportional to the square of the diameter. Thus, CBV = cCBF0.5 (c: constant) (Ito et al., 2001; Ito et al., 2002), which corresponds to the relation between CBF and CBV we observed.
In animal studies at the microvascular level, an increase in CBF with no change in density of perfused capillaries during hypercapnia has been observed (Gobel et al., 1989); however, change in capillary diameter during hypercapnia and hypocapnia has also been observed (Duelli and Kuschinsky, 1993). The CBV measured by PET is made up of three components: artery, capillary, and vein CBV (Lammertsma and Jones, 1983; Mintun et al., 1984). Although the capillary fraction is only a small percentage of the CBV (Mintun et al., 1984), the present relation between changes in CBF and CBV during changes in PaCO2 might be similar to that at the microvessel level.
Previously, we investigated changes in both regional CBF and CBV in humans during visually evoked neural activation by PET (Ito et al., 2001). Our results indicated that when the increase in CBF is great, it is caused primarily by an increase in vascular blood velocity rather than by an increase in CBV. The relation between CBF and CBV during neural activation was CBV = 0.88CBF0.30 (Ito et al., 2001), which corresponds closely with the present results. This suggests that augmentation for CBF and CBV might be governed by a common microcirculatory mechanism during both neural activation and hypercapnia. We also used PET to investigate changes in both regional CBF and CBV in crossed cerebellar diaschisis (Ito et al., 2002), which can be considered neural deactivation (Gold and Lauritzen, 2002). The degree of decrease in CBF and CBV during neural deactivation was almost identical (approximately 20% decrease in both CBF and CBV), indicating no change in vascular blood velocity during neural deactivation (Yamauchi et al., 1992; Ito et al., 2002). However, the degree of decrease in CBF during hypocapnia was greater than that in CBV (approximately 40% decrease in CBF and 10% decrease in CBV), indicating a decrease in vascular blood velocity during hypocapnia. The relation between CBF and CBV during neural deactivation was CBV = 0.29CBF0.56 (Ito et al., 2002). This suggests that diminution for CBF and CBV might be governed by different microcirculatory mechanisms between neural deactivation and hypocapnia.
In determining CBV, we measured the radioactivity concentration of 11CO-labeled hemoglobin. Therefore, CBV was calculated assuming the small- to large-vessel hematocrit ratio to be 0.85 (Phelps et al., 1979). However, a decrease in hematocrit in cerebral vessels during hypercapnia has been reported (Bereczki et al., 1993; Keyeux et al., 1995), perhaps causing an underestimation of CBV during hypercapnia. Change in CBV during hypercapnia was recently measured by perfluorocarbon with 19F nuclear magnetic resonance (Lee et al., 2001). Because the MRI technique measures plasma blood volume, a decrease in cerebral hematocrit will cause overestimation of CBV. However, the relation between changes in CBF and CBV during hypercapnia measured by MRI was almost identical to the relation we observed (Lee et al., 2001).
In conclusion, changes in both CBF and CBV during hypercapnia and hypocapnia were measured in humans by PET. The increase in CBF was greater than that in CBV during hypercapnia, indicating an increase in vascular blood velocity. The degree of decrease in CBF during hypocapnia was also greater than that in CBV, indicating a decrease in vascular blood velocity. The relation between changes in CBF and CBV during hypercapnia was similar to that during neural activation; however, the relation during hypocapnia differed from that during neural deactivation observed under crossed cerebellar diaschisis. This suggests that augmentation for CBF and CBV might be governed by a common microcirculatory mechanism during both neural activation and hypercapnia, but diminution for CBF and CBV might be governed by different microcirculatory mechanisms between neural deactivation and hypocapnia.
Footnotes
Acknowledgments:
Assistance of members of the Akita Research Institute of Brain and Blood Vessels in performing the PET experiments is gratefully acknowledged.