
Abstract
Intracranial hemorrhage is a critical factor when considering efficacy and safety of thrombolytic intervention after thromboembolic stroke. This study tested whether magnetic resonance imaging could identify tissue for hemorrhagic transformation after the onset of embolic stroke. Rats subjected to embolic stroke with and without recombinant tissue-type plasmogen activator (rt-PA) treatment were followed-up with magnetic resonance imaging using the inverse of the apparent forward transfer rate for magnetization transfer (kinv), gadolinium-chelate contrast-enhanced magnetic resonance imaging, and diffusion-, perfusion-, and T2-weighted imaging. Rats with embolic stroke either were treated with rt-PA 1 (n = 16) or 4 hours (n = 13) after stroke onset or were not treated (n = 15). From these groups, at total of 17 rats had intracerebral hemorrhage. Tissue progressing to hemorrhage and adjacent to the site of hemorrhage was analyzed to identify magnetic resonance imaging markers that characterize hemorrhagic transformation. The parameter maps of kinv and contrast-enhanced magnetic resonance imaging showed greater sensitivity in the detection of tissue destined for hemorrhagic transformation compared with the apparent diffusion coefficient of water (ADCw) and CBF. In tissue not destined to undergo hemorrhagic transformation, kinv maps and contrast-enhanced magnetic resonance imaging exhibited small increases in kinv and contrast-enhanced magnetic resonance imaging signal intensity in the area encompassing the territory supplied by the middle cerebral artery. In contrast, large increases in kinv and in signal intensity in the contrast-enhanced magnetic resonance images were detected in the region where gross hemorrhage was confirmed histologically. The values of kinv, T2, and signal intensity in the contrast-enhanced magnetic resonance images were significantly higher in the region destined for hemorrhagic transformation (kinv, P ⩽ 0.033 3–24 hours after embolization; T2, P ⩽ 0.037 24–48 hours; contrast-enhanced magnetic resonance imaging, P < 0.05 4–7 hours) compared with the nonhemorrhagic transformation ischemic region or in the contralateral homologous regions after onset of ischemia. Of these methods, kinv shows the most sensitivity in the detection of hemorrhagic transformation soon after embolization. The authors' data suggest that kinv and contrast-enhanced magnetic resonance imaging are potentially important methodologies for detecting tissue destined for hemorrhagic transformation.
Keywords
Hemorrhagic transformation (HT) is the conversion of ischemic tissue (white infarct) to hemorrhagic tissue in which blood cells are seen outside of the vessels and in the tissue (red infarct), and is the most likely adverse effect of thrombolytic therapy (Del Zoppo, 1997; Hamann et al., 1996; NINDS, 1997). The risk of symptomatic hemorrhage during the first 36 hours after stroke onset is significantly higher in patients receiving recombinant tissue-type plasminogen activator (rt-PA) than in placebo-treated patients (6.4% vs. 0.6%), and 61% of patients with symptomatic hemorrhage die within 3 months (NINDS, 1995). Although the factors that contribute to thrombolysis-related hemorrhage in acute ischemic stroke are not well defined, etiology (i.e., thrombotic versus embolic) (Fisher and Adams, 1951; Hornig et al., 1986; Weisberg, 1985), collateral circulation (Faris et al., 1963; Lyden and Zivin, 1993), reperfusion (Hain et al., 1952), hypertension (Faris, et al., 1963; Fisher and Adams, 1951; Globus and Epstein, 1953; Hardin et al., 1963; Saku et al., 1990), size of the ischemic lesion (CESG, 1984; Hornig, et al., 1986; Laureno et al., 1987; Lodder, 1984; Lodder et al., 1986; Lodder and Van der Lugt, 1983; Okada et al., 1989; Schulte-Altedorneburg et al., 1996), time from symptom onset to plasminogen activator exposure (Del Zoppo et al., 1992), the presence of diastolic hypertension, low body mass or increased rt-PA dose (Levy et al., 1994), and advanced age have all been implicated. In a single photon emission computed tomography study, Ueda et al. (1994) showed that a threshold of regional CBF reduction may be associated with symptomatic intracerebral hemorrhage in acute stroke. Although no precise predictors of hemorrhage have been determined, these correlative findings suggest caution when thrombolysis is considered in patients with early radiograph computed tomographic signs of major stroke, such as sulcal effacement, mass effect, edema, or possible hemorrhage (Tomsick et al., 1996). Diagnosis of symptomatic hemorrhage using computed tomography is only 57% efficient (NINDS, 1997). Although computed tomography can readily diagnose hemorrhage once it has occurred, this method cannot predict hemorrhage unless high-dose contrast-enhanced computed tomography (possibly in conjunction with delayed scanning) is used (Hayman et al., 1981; Schulte-Altedorneburg, et al., 1996). Magnetic resonance imaging (MRI) using contrast agents detects HT in the suture model of ischemic stroke in rats (Knight et al., 1998). However, characteristics of HT using multiparameter magnetic resonance images need to be further investigated, especially in the clinically relevant model of embolic stroke with and without rt-PA thrombolytic intervention. In this study, we used quantitative magnetization transfer (MT), gadolinium-chelate (Gd-DTPA) contrast-enhanced magnetic resonance imaging (CEMRI), and diffusion-, perfusion-and T2-weighted MRI to characterize HT after embolic stroke in rats.
MATERIALS AND METHODS
The Institutional Animal Care and Use Committee of Henry Ford Hospital approved all experimental procedures.
Animal model and experimental groups
Three groups of male Wistar rats (N = 44, 300 to 450 g) subjected to embolic stroke were investigated using a 7-T MRI system. Group 1 (n = 15) comprised animals that received embolization but no rt-PA treatment; group 2 (n = 16) comprised animals that received embolization, followed by rt-PA treatment 1 hour later; and group 3 (n = 13) comprised animals that received embolization, followed by rt-PA treatment 4 hours later.
Magnetic resonance imaging measurements using a 3-T system were also performed on two additional rats to determine whether the MRI pattern of hemorrhage differs at a lower magnetic field. In these two animals, rt-PA was administered 6 hours after embolization. The methods of embolic stroke induction and rt-PA treatment have been previously described (Jiang et al., 1998; Zhang et al., 1997). Briefly, an aged white clot (prepared 24 hours before ischemia) was slowly injected into the internal carotid artery to block the middle cerebral artery (MCA) (Zhang, et al., 1997). This model of embolic stroke provides a relatively reproducible infarct volume localized to the territory supplied by the MCA (Jiang, et al., 1998; Zhang, et al., 1997).
Magnetic resonance imaging measurements in 7-T system
Magnetic resonance imaging measurements were performed using a 7-T, 20-cm bore superconducting magnet (Magnex Scientific, Abingdon, U.K.) interfaced to an SMIS console (Surrey, U.K.). A 12-cm bore actively shielded gradient coil set capable of producing magnetic field gradients up to 20 G/cm and a birdcage radio-frequency (rf) coil were used. Stereotaxic ear bars were used to minimize movement during the imaging procedure. During MRI measurements, the anesthesia was maintained using a gas mixture of nitrous oxide (69%), oxygen (30%), and halothane (0.75–1.00%). Rectal temperature was kept at 37°C ± 0.5°C using a feedback-controlled water bath. A modified fast low-angle shot (Frahm et al., 1986) imaging sequence was used for reproducible positioning of the animal in the magnet at each MRI session (Jiang et al., 1993). Magnetization transfer, diffusion-, perfusion-, and T2-weighted MRI measurements were performed before ischemia, repeatedly for 4 to 5 hours (groups 1 and 2) or 7 hours (group 3) after the onset of embolization, and at 24, 48, and 168 hours (10 animals treated for 4 hours were killed at 48 hours) after onset of embolization for all groups. Because of time constraints between the onset of embolization and rt-PA treatment, no MT and CEMRI measurements were performed in the 1-hour rt-PA–treated group (group 2) and no CEMRI data were acquired in the 4-hour rt-PA–treated group (group 3). Contrast-enhanced magnetic resonance imaging was performed once at an acute time (4 hours after ischemia for groups 1 and 2 and 7 hours after ischemia for group 3) and once 24 hours after stroke onset.
Measurement of magnetization transfer-related parameters kfa and kinv
A calculation of apparent forward transfer rate of magnetization (kfa) requires an estimate of T1sat (i.e., T1 in the presence of an off-resonance irradiation of the macromolecules of the brain). For efficient T1 measurements, we use a variant of the TOMROP (T one by multiple read-out pulses; Brix et al., 1990) sequence with an increment of the initial phase step throughout each image acquisition. We have named this (single-slice) method PIPS (phase-incremented progressive saturation) (Ewing et al., 1999). Sixty-four images (2-mm slice thickness, 128×64 matrix, 32-mm field of view) were taken using a radio-frequency–spoiled gradient-echo sequence with an echo time/repetition time of 7/40 milliseconds, tip angle Θ, approximately 18°. The interval between each of the 64 images was 4.5 seconds, and total imaging time was approximately 9.6 minutes.
The PIPS was run in sets of two, with and without off-resonance continuous wave power, to yield estimates of Msat, T1sat, M0, and T1 (Ewing, et al., 1999). The kfa, was calculated from the following equation (Ewing, et al., 1999):
Measurement of gadolinium-chelate contrast-enhanced magnetic resonance imaging
Multislice T1-weighted images were obtained using both multislice (nine slices) gradient-echo (500-millisecond repetition time, 10-millisecond echo time, four averages) and spin-echo (500-millisecond repetition time, 20-millisecond echo time, four averages) sequences with a 1-mm slice thickness, 32-mm field of view, and a 128 × 128 matrix. Imaging time for the T1-weighted image sequences was approximately 5 minutes for each sequence. The Gd-DTPA CEMRI measurement included four sets of T1-weighted gradient-echo and spin-echo images; one set was acquired before an intravenous bolus injection of 0.1-mmol/kg Gd-DTPA contrast agent (Omniscan gadoliamide; NyComed Inc., Princeton, NJ, U.S.A.), and three sets were acquired after Gd-DTPA injection. The total time for the Gd-DTPA contrast MRI measurements (four sets of T1-weighted gradient-echo and spin-echo images) was approximately 34 minutes.
Measurement of apparent diffusion coefficient of water
The ADCw was measured using the method described by LeBihan et al. (1986). A two-dimensional Fourier transform multislice spin-echo sequence (seven slices, 32-mm field of view, 128 × 64 matrix, 1.5-second repetition time, 40-millisecond echo time, two-signal average) was modified to include two 10.5-millisecond diffusion-weighting gradient pulses, one on either side of the refocusing 180-degree radio-frequency pulse. The diffusion-weighting gradient was increased in a nonlinear manner from 0 to approximately 8.36 G/cm to obtain a series of five images with gradient b-values of 0, 200, 400, 600, 800 s/mm2. Each image required a scan time of 3.2 minutes for completion, and the total time needed for the entire sequence was approximately 16 minutes.
Measurement of T2
T2 was measured using standard two-dimensional Fourier transform multislice (seven-slice) multiecho (four-echo) MRI. A series of four sets of images (seven slices for each set) were obtained using echo times of 30, 60, 90, and 120 milliseconds and a repetition time of 3 seconds. Images were produced using a 32-mm field of view, 2-mm slice thickness, 128 × 64 image matrix. The total time for the entire sequence was approximately 3.2 min.
Measurement of cerebral blood flow
Perfusion measurements were performed before each diffusion measurement using a technique described by Williams et al. (1992). This method of CBF measurement is based on the selective inversion of blood water protons at the level of the carotid arteries before 1H MRI measurement in the brain. Two images were obtained for perfusion measurement with a 1-second repetition time, 30-millisecond echo time, 64 × 64 image matrix, 3-mm slice thickness, and a 32-mm field of view. In each animal, perfusion-weighted MRI was measured within a coronal section. The duration of the inversion pulse was 1 second at a B1 amplitude of 0.3 KHz.
Magnetic resonance imaging measurements in 3-T system
The MRI measurements on two additional rats were performed using a 3-T whole-body magnet (Magnex Scientific, Abingdon, U.K.) equipped with actively shielded gradients and an SMIS console. The MRI images were recorded using a birdcage coil. Magnetization transfer, diffusion-, perfusion-, and T2-weighted MRI measurements were performed before ischemia, repeatedly for 8 hours, and at 24 hours after the onset of embolization. Multiple CEMRI measurements were also taken in these two animals (3, 5, 7, and 24 hours after ischemia). The method used to set up and perform MT, CEMRI, and diffusion-, perfusion-, and T2-weighted MRI measurements in the 3-T system were the same as those used in the 7-T system, and the image parameters used were as close as possible to the 7-T parameters.
Tissue preparation
After the final MRI measurement, animals were anesthetized with ketamine (44 mg/kg) and xylazine (13 mg/kg), and were transcardially perfused with heparinized saline and 10% neutral buffered formalin. The head was immersed in formalin solution for 1 hour, after which a total of seven 2-mm-thick blocks of brain tissue were processed and embedded in paraffin. Coronal sections (6 μ) were cut from each block and stained with hematoxylin and eosin for the evaluation of ischemic cell damage and hemorrhage. The lesion volume was measured using Global Lab Image analysis software (Data Translation, Marlboro, MA, U.S.A.). Each hematoxylin and eosin section was evaluated at 2.5x magnification. The area of infarction and the area of the ipsilateral hemisphere (mm2) were measured by tracing the areas for each section on the computer monitor screen, and the volume (mm3) was determined by multiplying the appropriate area by the block thickness (Zhang et al., 1994). To reduce errors associated with processing of tissue for histologic analysis, an indirect method for calculating lesion area was used in which the intact area of the ipsilateral hemisphere was subtracted from the area of the contralateral hemisphere (Swanson et al., 1990). The percentage of lesion to the area of the contralateral hemisphere and the percentage of lesion to the volume of the contralateral hemisphere were calculated.
Hemorrhage evaluation
Gross hemorrhage (macroscopic), defined as blood evident to the unaided eye on the hematoxylin and eosin-stained coronal sections and confirmed by microscopy, was evaluated on seven equally spaced (2-mm interval) hematoxylin and eosin-stained coronal sections for each animal. Gross hemorrhagic rate is presented as the percentage of animals with gross hemorrhage to the total number of animals in each experimental group.
Data analysis
For quantitative analysis to identify MRI indices that characterize tissue progressing to hemorrhage, only animals with hemorrhage were used. In these animals, MRI measurements were also performed in cerebral ischemic tissue adjacent to the tissue progressing to hemorrhage and in homologous tissue in the contralateral hemisphere. All animals exhibiting hemorrhage surviving 24 hours or longer after embolic stroke were included in these analyses. Two different regions of interest (ROIs) were selected for measurement of MRI parameters. The first ROI was localized to the HT area determined from histologic sections. The ROIs that anatomically matched areas where hemorrhage was detected on the histologic sections were outlined on ADCw-weighted images. The second ROI (5×5 pixels) was obtained from pixels adjacent to HT tissue in the center of the diffusion-weighted MRI abnormality during acute ischemia. A careful check was performed to avoid overlap between the ischemic and HT ROIs. The distance between the ischemic and HT ROIs was at least three pixels. Homologous ROIs to the HT tissue and tissue adjacent to HT tissue were also measured in the contralateral hemisphere.
Statistics
Observations are summarized as mean ± standard errors. The MRI characteristics between ischemic and HT ROI with measurements of kinv, T2, ADCw, CBF, and signal intensity in CEMRI were measured. The relative change in ischemic ROI (ischemia/preischemia) or HT ROI (HT/preischemia) was calculated for all the MRI measurements except CEMRI, which was normalized to the value measured before injection of a Gd-DTPA contrast agent. The differences of each MRI measurement were compared between ischemic and HT ROIs and between ischemic or HT and homologous contralateral tissue. A paired t-test was used for all regional comparisons with a significance level of 0.05.
RESULTS
Histologic studies
Gross hemorrhages were detected in 6 of 15 nontreated animals (group 1), 3 of 16 in 1-hour rt-PA–treated animals (group 2), and 8 of 13 animals treated for 4 hours (group 3). Of the three 1-hour rt-PA–treated HT animals, two showed a reduced lesion size. One 4-hour rt-PA–treated animal exhibited severe hemorrhage as early as 7 hours after embolization and died after acute measurements. This animal was not included in the MRI quantitative analysis. By comparing the occurrence of HT in the rt-PA–treated groups with nontreated groups, the 1-hour rt-PA–treated animals exhibited less gross HT (19%) than nontreated (40%) and 4-hour rt-PA–treated (62%) groups.
Quantitative characterization of magnetic resonance imaging parameters of hemorrhagic transformation
The effect of rt-PA on MRI measurements after treatment was tested using a two-sample t-test. There was no rt-PA effect on MRI measurements between ischemic and HT regions observed at all time points after treatment, except for a difference on ADCw at 24 hours (P = 0.011), which might be due to chance given the large number of comparisons. Therefore, the data was combined between the rt-PA–treated and nontreated groups to perform the statistical analysis.
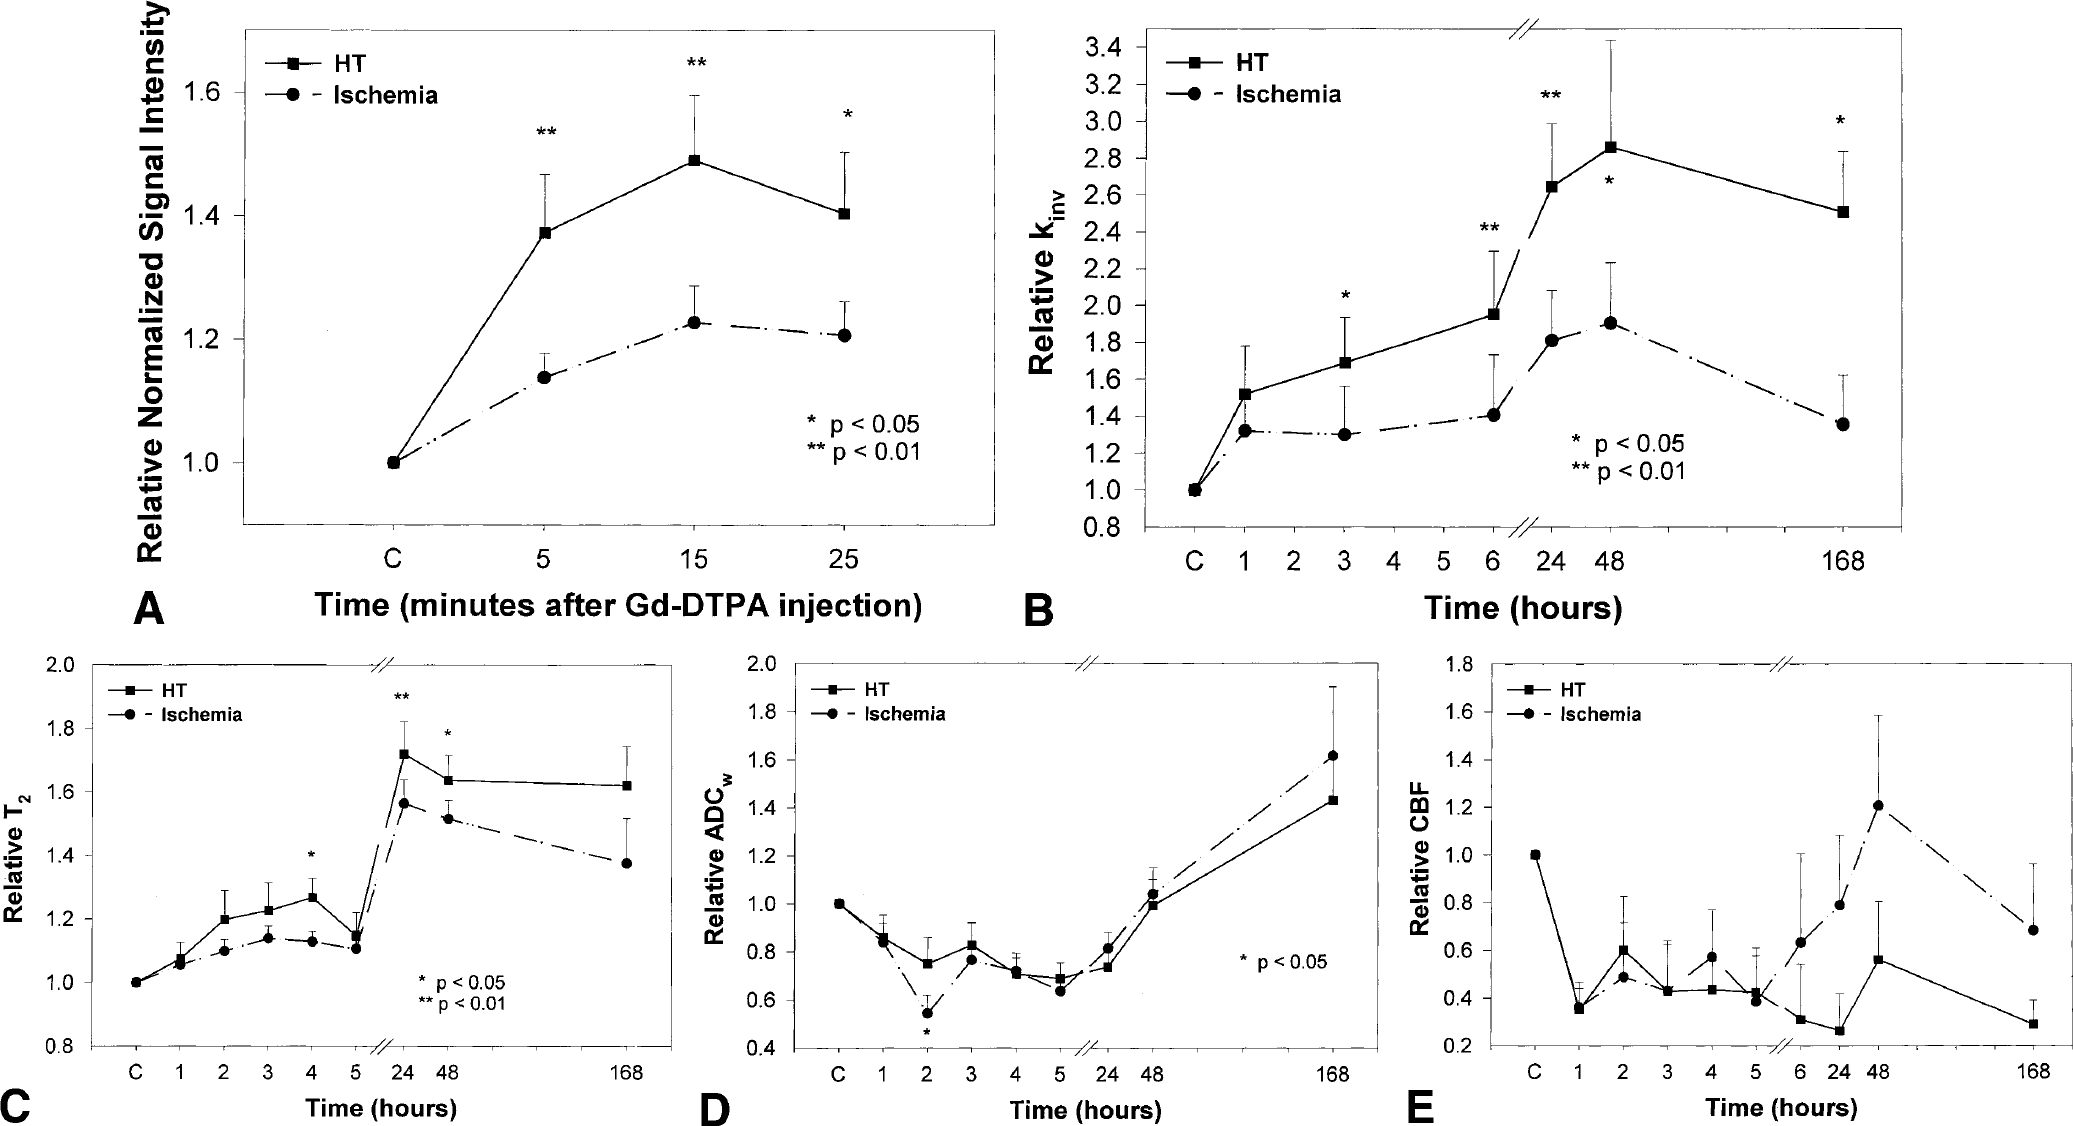
Figures 1A to 1E show temporal profiles of signal intensity of CEMRI (Fig. 1A), kinv (Fig. 1B), T2 (Fig. 1C), ADCw (Fig. 1D), and CBF (Fig. 1E) from the ROIs of ischemic tissue with HT and adjacent ischemic tissue (no HT) before and after embolization. The mean normalized values of signal intensity (signal intensity after Gd-DTPA injection normalized that observed before injection) in CEMRI (Fig. 1A) revealed an increase in both the HT and ischemic ROIs after Gd-DTPA injection. However, the increase in normalized signal intensity in the HT ROI was significantly higher (P < 0.05) than that in ischemic ROI after Gd-DTPA injection. A statistically significant difference was also detected between the HT ROI and its contralateral ROI (P < 0.01), and the ischemic ROI and its contralateral ROI (P < 0.01). Contrast-enhanced MRI was also performed 24 hours after embolization. However, there was no significant difference detected between the HT and ischemic ROIs, though the HT ROI had higher mean normalized values (1.25 to 1.35) than those in the ischemic ROI (1.02 to 1.08).
Quantitative characterization of MRI parameters on hemorrhagic transformation (HT).
Figure 1B shows the temporal profiles of normalized kinv (kinv values for ischemic-damaged tissue normalized to preischemic control tissue) for the HT and adjacent non-HT ROIs (i.e., the same ROI as that used in CEMRI measurements). After embolization, the kinv values increased from preischemic values in both HT and ischemic ROIs and were highest 24 to 48 hours after embolization. Higher mean kinv values were present 1 to 168 hours after embolization in the HT ROI compared with the ischemic ROI. Statistically significant differences were detected in normalized kinv values between the ROIs at 3 (P = 0.033), 6 (P = 0.007), 24 (P = 0.001), 48 (P = 0.021), and 168 (P = 0.031) hours. Furthermore, the difference between HT and ischemic ROIs continuously increased after the onset of ischemia.
Figure 1C shows the temporal profiles of normalized T2 for the HT and ischemic ROIs. After embolization, the T2 values slowly increased from preischemic values in both HT and ischemic ROIs and were highest 24 hours after embolization. Higher mean T2 values were present 1 to 168 hours after embolization in the HT ROI compared with the ischemic ROI. Statistically significant differences were detected in normalized T2 values between the HT and ischemic ROIs at 24 (P = 0.010) and 48 (P = 0.037) hours. A transient significant increase in T2 (P = 0.027) was also detected in the HT ROI compared with the ischemic ROI 4 hours after embolization. Compared with T2 measurements, kinv showed larger and earlier appearance differences between HT and ischemic regions.
Figure 1D shows the temporal profiles of normalized ADCw for the HT and ischemic ROIs. After embolization, the ADCw values decreased from preischemic values in both HT and ischemic ROIs for up to 24 hours and returned to preischemic values 48 hours after embolization. There were no significant differences detected between the HT and ischemic ROIs, except for a significant difference detected 2 hours after embolization (P = 0.035).
Figure 1E shows the temporal profiles of normalized CBF for the HT and ischemic ROIs. The CBF values decreased from preischemic values in both HT and ischemic ROIs for up to 24 after embolization. There were no significant differences detected between the HT and ischemic ROIs after embolization.
Magnetic resonance imaging patterns of hemorrhagic transformation
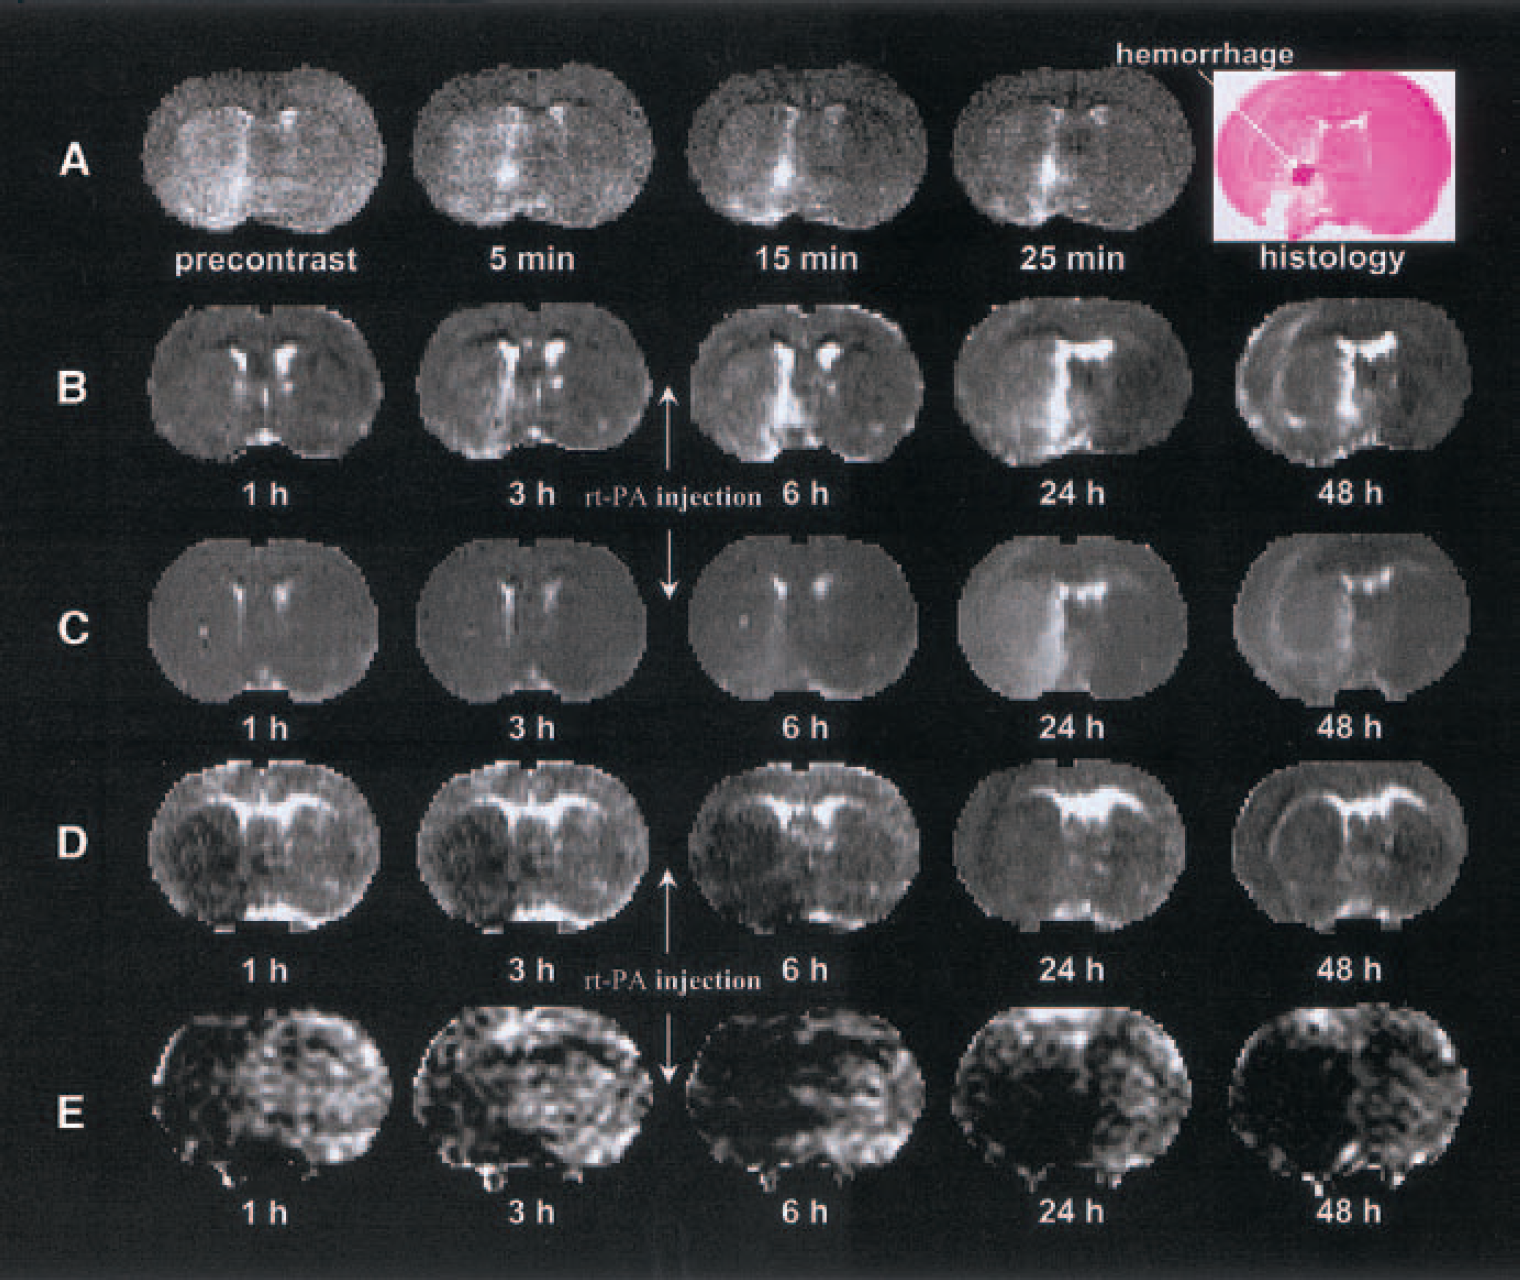
The MRI patterns of HT in the nontreated animals (group 1) were similar to the 4-hour rt-PA–treated animals (group 3). Figures 2A to 2E present CEMRI (Fig. 2A), kinv (Fig. 2B), T2 (Fig. 2C), ADCw (Fig. 2D), and CBF (Fig. 2E) maps, respectively, and the corresponding histologic section (last image in Fig. 2A) from a representative 4-hour rt-PA–treated (group 3) animal obtained 48 hours after embolization. The contrast-enhanced spin-echo T1-weighted images (Fig. 2A) were obtained before and after injection of a Gd-DTPA contrast agent 3 hours after rt-PA administration (7 hours after the onset of embolization). Postcontrast images showed increasing contrast in a hyperintense area in the preoptic region, and the corresponding histologic section obtained 48 hours after embolization showed gross hemorrhage in the left preoptic region. Light microscopy confirmed the HT and microvascular plugging in the left preoptic region. The hyperintense area in the postcontrast images was larger than the hemorrhagic area in the histologic section. The contrast-enhanced gradient-echo T1-weighted images revealed patterns similar to those shown in the spin-echo images (data not shown), but with less contrast between HT-related and surrounding ischemic areas. In this study, only spin-echo data were used in the analysis.
A typical MRI set from a 4-hour rt-PA–treated (group-3) animal showing hemorrhagic transformation.
Figure 2B presents the temporal evolution of kinv maps obtained at various times (1–48 hours) after injection of the embolus from the same rat shown in Fig. 2A. Magnetic resonance imaging MT measurements revealed a small increase in kinv in the area encompassing the territory supplied by the MCA adjacent to tissue with hemorrhage. A much larger increase in kinv was detected in the preoptic region where gross hemorrhage was confirmed histologically. The increase in kinv in the preoptic region was detectable in the ischemic damaged region before rt-PA treatment (3 hours after embolization or 1 hour before rt-PA injection) up to 2 days after embolization. The early detection (before rt-PA treatment) implies that kinv may be a sensitive way to detect HT after rt-PA intervention and, before rt-PA treatment, identify the tissue destined to undergo HT after rt-PA treatment.
Figure 2C presents the temporal evolution of T2 maps obtained at various times 1 to 48 hours after injection of the embolus from the rat shown in Fig. 2A. Magnetic resonance imaging T2 measurements revealed a slow increase in T2 after embolization in the area encompassing the territory supplied by the MCA. The preoptic region appeared to have a larger increase in T2 than in the rest of the ischemic region, and was highest 24 hours after embolization. Compared with the kinv maps, the contrast in T2 maps between the preoptic region and the rest of the ischemic region was lower, and the contrast increased in the T2 maps at a rate slower than in the kinv maps. Although the hyperintense region in the preoptic area in kinv maps appears to be larger than the true hemorrhagic region in the histologic section, the corresponding T2 maps showed an even larger hyperintense region in which it was difficult to identify the true hemorrhagic region.
Figures 2D and 2E present temporal evolution changes of ADCw and CBF maps obtained at various times 1 to 48 hours after injection of the embolus from the same rat shown in Fig. 2A. The ADCw and CBF measurements revealed an early decrease both in ADCw and CBF in the territory supplied by the MCA. However, both measurements do not distinguish the area with HT from the rest of the ischemic region.
Magnetic resonance imaging patterns of hemorrhagic transformation in animal subjected to 1-hour rt-PA treatment
Figures 3A to 3E present CEMRI (Fig. 3A), kinv (Fig. 3B), T2 (Fig. 3C), ADCw (Fig. 3D), and CBF (Fig. 3E) maps, and the corresponding histologic section (last image in Fig. 3A) from a 1-hour rt-PA–treated animal (group 2) obtained 168 hours after embolization. Magnetic resonance imaging of two rats treated with rt-PA at 1 hour, which subsequently showed a large reduction in lesion size, was highly sensitive to HT. The ADCw maps in these two animals along with CEMRI, kinv, and T2 identify the HT area, which had lower ADCw compared with the surrounding ischemic region. After rt-PA treatment at 1 hour after embolization, most of the MCA-supplied area in the ipsilateral hemisphere exhibited a decrease in contrast between ischemic and contralateral areas, but not in the HT area. kinv, T2, and ADCw were restored in most ischemic areas except for tissue with HT.
A typical MRI set from a 1-hour rt-PA–treated (group-2) animal showing hemorrhagic transformation.
Field effects of magnetic resonance imaging on hemorrhagic transformation
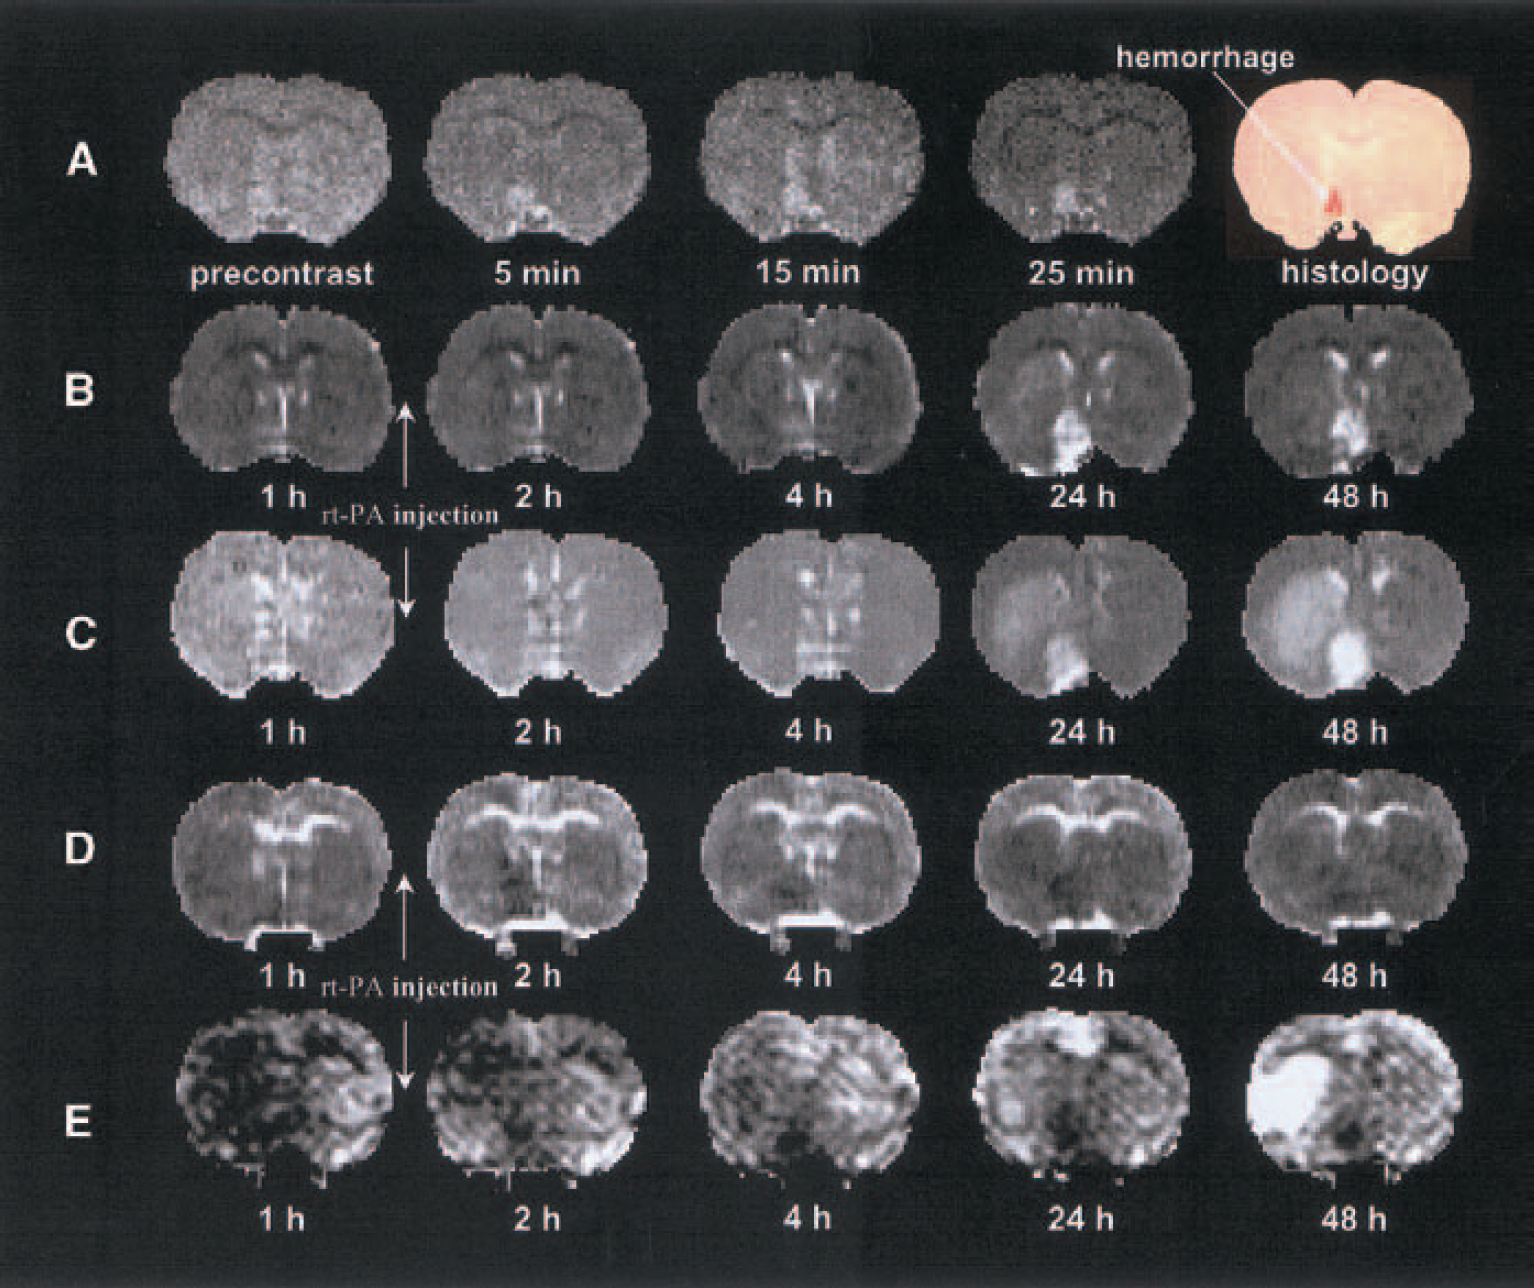
Figure 4 presents evolution changes of CEMRI (Fig. 4A), kinv (Fig. 4B), T2 (Fig. 4C), ADCw (Fig. 4D), and CBF (Fig. 4E) maps from a 3-T MRI system, and the corresponding histologic section (the last two images in Fig. 4A) from a representative 6-hour rt-PA–treated animal. Postcontrast Gd-DTPA contrast-enhanced spin-echo T1 weighted images obtained 3 hours (3 hours after embolization) and 1 hour (5 hours after embolization) before and 18 hours (24 hours after embolization) after injection of rt-PA show a hyperintense area in the preoptic region even before rt-PA treatment (3 and 5 hours after embolization) and the contrast in the hyperintense area in the preoptic region increased with time after embolization. The corresponding histologic section obtained at 24 hours after embolization showed gross hemorrhage in the left preoptic region. The evolution changes of kinv (Fig. 4B), T2 (Fig. 4C), ADCw (Fig. 4D), and CBF (Fig. 4E) maps in this animal are similar to that shown in Fig. 2 measured with the 7-T system. kinv showed better contrast than T2 between the region destined for HT and the surrounding damaged tissue. The ADCw and CBF maps in the 3-T system did not distinguish HT from the surrounding ischemic tissue. Although MRI parameters in the 3-T system showed a similar ability to distinguish HT, the contrast between HT and the surrounding ischemic tissue in the 3-T system appears smaller than that in the 7-T system.
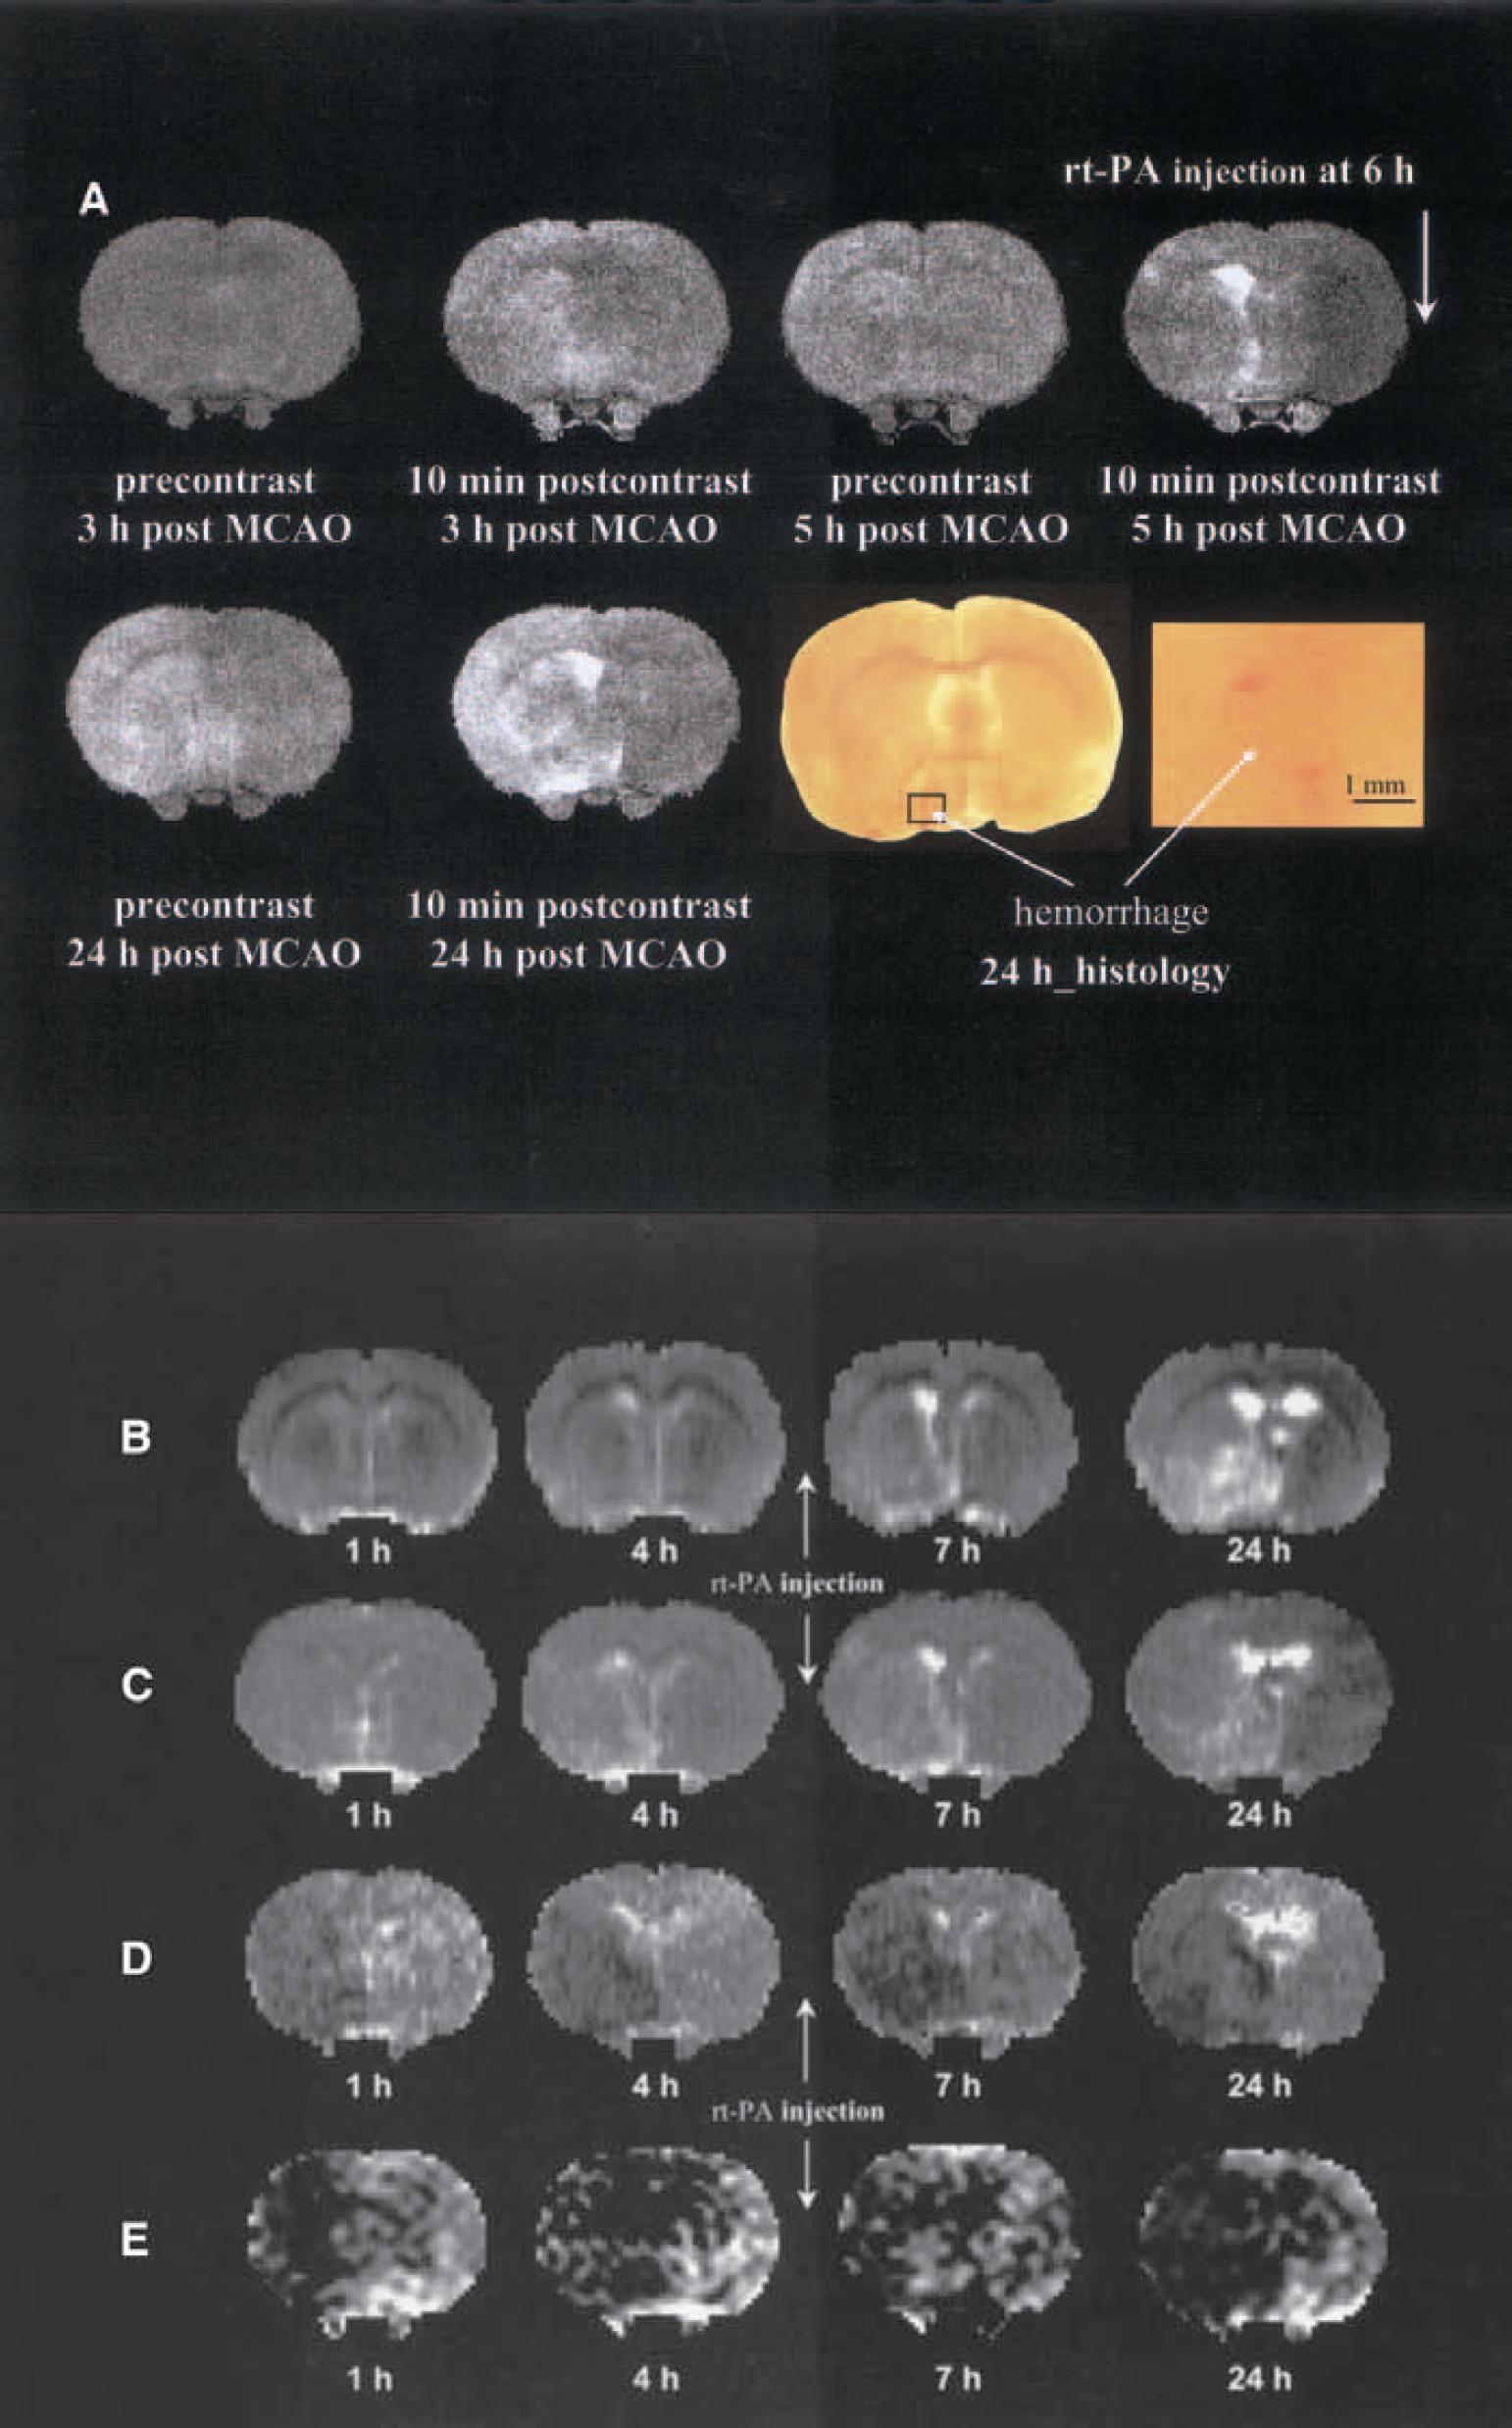
Field effects of MRI on hemorrhagic transformation.
DISCUSSION
In this study, we used MRI to investigate HT in a clinically relevant model of embolic stroke with and without rt-PA intervention. Our data suggest that MT and Gd-DTPA contrast-enhanced MRI are potentially important methodologies in detecting the tissue destined for HT, and may provide an early prediction of gross hemorrhage.
Computed tomography is currently the imaging modality most widely used to exclude the presence of hemorrhage in the evaluation of candidates for thrombolysis (NINDS, 1995). Although magnetic resonance imaging has been used to detect hemorrhage (Thulborn and Atlas, 1996), the emphases of previous studies were focused on the magnetic resonance properties of hemoglobin degradation products (Thulborn and Atlas, 1996). The hemoglobin in the blood extravasates into tissue and becomes deoxygenated. Deoxyhemoglobin produces a nonuni-form magnetic field and results in signal loss (darkening) in T2 and T2*-weighted MRI (Thulborn and Atlas, 1996). Because thrombolytic therapy must be performed within 3 hours of ictus (NINDS, 1995), any MRI method to predict HT must do so before 3 hours. The tissue destined for HT during the very acute phase after stroke may not involve erythrocyte leakage, but severe blood–brain barrier (BBB) damage may be present (Knight, et al., 1998). Our data on the embolic model of stroke indicate that hemorrhage is rarely present within the first few hours after stroke (Zhang, et al., 1997). However, some animals develop hemorrhage within 24 to 48 hours after stroke onset (Zhang, et al., 1997), and the frequency of hemorrhage is increased with delay of rt-PA treatment. Thus, we have a model of HT in the rat embolic stroke similar to that of the human model. We investigated the magnetic resonance signatures of tissue destined to undergo HT. This study provides a preliminary view of the evolution of CEMRI, kinv, T2, ADCw, and CBF appearance in tissue destined for HT.
Our data indicate that measurements of MT-related parameters are sensitive detectors of HT. Maps of kinv in this model of embolic stroke detected HT not only at the delayed time points, but also as early as 3 hours after embolization. Magnetization transfer derives from the exchange of nuclear spin magnetization between “free” and “bound” protons and reflects lyses of protein (Neumar et al., 1996). Severe damage of the BBB during the acute ischemic period may involve a rapid loss of cellular structure through proteolysis and may cause leakage of water and small proteins (Ewing, et al., 1999; Neumar, et al., 1996). This proteolysis and leakage of water and small proteins will reduce the weight of the macromolecule pool and, therefore, will increase kinv. Our data also indicate that kinv is sensitive to HT within 3 hours after embolization.
Early Gd-DTPA enhancement during the acute stage of ischemic stroke appeared sensitive to HT. Based on histologic analysis, Gd-DTPA enhancement in tissue destined for HT is related to early endothelial cell damage with subsequent severe disruption of the BBB. Thus, increases in BBB permeability to small molecules (i.e., Gd-DTPA contrast agent) will identify tissue destined for HT. Early parenchymal enhancement has also been observed with the suture model of focal ischemia in the rat (Knight, et al., 1998), the embolic model in the rabbit (Yenari et al., 1997), and the catheter model in the baboon (Mathews et al., 1994). Those studies also found that the enhancing area overestimated the size of the hemorrhage seen at histologic analysis. A similar size overestimation was also observed in the kinv maps and may be related to differences in what is measured by CEMRI, MT, and histology. The Gd-DTPA and water molecules are much smaller than erythrocytes and, therefore, can cross the BBB earlier and diffuse further than erythrocyte cells in the hemorrhagic area. Although the enhanced area was not able to predict the size of eventual HT, it did distinguish ischemic areas with HT from nonhemorrhagic ischemic areas. Smaller molecular indicators may provide more efficient markers to predict HT, because HT is known to evolve over a period of days or even weeks. Further investigation using different size indicators to adjust the sensitivity and accuracy of HT prediction is warranted.
The T2 measurements also exhibited an ability to detect the differences between HT and non-HT tissues, though T2 was less sensitive than MT or CEMRI. Our data showed that the T2 values in the HT area were higher than in the non-HT ischemic areas, with significant difference 24 and 48 hours after embolization. The HT-related region involves more rapid and severe disruption of BBB. Vasogenic edema develops when the BBB is disrupted in the brain vasculature. The increased T2 in the HT area may indicate more leaky BBB and more severe edema than that in the non-HT area.
Both ADCw and CBF are not sensitive predictors of tissue destined to undergo HT. The ADCw and CBF in the HT area were not significantly different from the non-HT ischemic area in the embolic model of ischemic rat. The embolic model of focal ischemia used in this study produces a low CBF for 24 to 48 hours after embolization and causes severe ischemic damage in the core area of the lesion if the animal is not treated effectively (e.g., 1 hour after embolization) (Jiang et al., 2000). The differences of ADCw and CBF between HT and non-HT ischemic regions were small, because only two HT animals in this study (1-hour rt-PA–treated group) benefited from rt-PA treatment. The conclusion drawn from this study may need to be modified if more HT animals show therapeutic benefit from rt-PA treatment.
The rt-PA treatments affected the incidence of HT in the embolic model of focal ischemia. In this study, HT increased in the delayed (4-hour) rt-PA–treated group and decreased in the early (1-hour) group compared with the nontreated group. These findings are consistent with those of other investigators (Del Zoppo et al., 1990, 1992; Overgaard, 1994). The increase in HT in the delayed rt-PA–treatment group may be due to increased breakdown of small vessel walls in recanalized tissue at the later reperfusion time, which can be expected to cause bleeding within the ischemic area (Zivin and Choi, 1991). In addition, delayed rt-PA treatment amplifies the inflammatory response in ischemic tissue (Zhang et al., 1999), which proceeds to exacerbate microvascular damage and BBB permeability (Zivin and Choi, 1991).
Magnetic field strength dependence in the detection of hemorrhage has been reported using traditional MRI (Thulborn and Atlas, 1996). Because the induced field by deoxyhemoglobin is proportional to the strength of the applied magnetic field (through the magnetic susceptibility coefficient), both T2 and T2* shortening are greater at a higher field. The current study focuses on a very acute stage of HT during which the BBB is severely damaged but erythrocytes have not yet extravasated into tissue. Image contrast between HT and the surrounding ischemic area may be related to field-dependent changes of T1 (CEMRI), MT (kinv), and T2. We expect that MRI at 7 T is more sensitive to subtle enhancement in acute ischemia than corresponding studies at 1.5 T (Lindsey et al., 1994). Further studies are needed to investigate the relation between HT and magnetic field strength.
In conclusion, our data indicate that MRI methodologies show differential sensitivity in detecting of tissue destined for HT. Of these methods, kinv and CEMRI appear most sensitive in the detection of HT at an early time after embolization. Our data suggest that kinv and CEMRI are potentially important methodologies for detecting tissue destined for HT.
Footnotes
Acknowledgments:
The authors thank Grenae Mosley for preparing the manuscript.