
Abstract
The aim of this study was to examine the quantitative relationship between changes in apparent diffusion coefficient (ADC) and transverse relaxivity (ΔR*2) measurements of relative perfusion deficits within the gradients of a focal ischemic insult. Sixty minutes after permanent occlusion of the middle cerebral artery, rats (n = 7) were subjected to spin echo diffusion-weighted scans followed by fast low-angle shot (FLASH) perfusion-sensitive scans. Diffusion-weighted images showed clear ischemic lesions in the affected basal ganglia and cortex. Ischemic deficits were demonstrated as a decrease in first-pass transit of injected boluses of gadodiamide. ADC maps were generated and regions of interest (ROIs) were obtained to span the range of ADC reductions from the lesion center or core to the periphery or penumbra. Corresponding ROIs from the bolus injection images were used to calculate perfusion indexes relative to contralateral levels as ratios of ΔR*2 integrals and ratios of ΔR*2 peak values. In all animals, the degree of ADC reductions was related to the degree of ΔR*2 perfusion deficits, ranging from severe ischemia in the core of the lesion to intermediate and moderate changes toward the lesion periphery. In the ischemic periphery, ADC reductions were linearly correlated with ΔR*2 peak ratios. However, no significant correlation was found between ADC reductions and ΔR*2 integral ratios. These data suggest that magnetic resonance measurements of ADC and ΔR*2 peak ratios can be used to quantitatively assess the variable gradients in focal ischemia, including potentiallyn critical areas at risk in the ischemic periphery.
Keywords
Diffusion-weighted magnetic resonance imaging (DWI) can detect acute cerebral ischemia before lesions are apparent on conventional scans. DWI applies diffusion-sensitizing gradients that make the collected MR signal sensitive to the incoherent motion of water protons (Le Bihan et al., 1988). After ischemia, acute cell swelling and changes in cell membrane permeability result in reduced water diffusion, thus increasing DWI signal intensity (Moseley et al., 1990a; Minematsu et al., 1992; Jiang et al., 1993). Alterations in water proton diffusion can be quantitatively monitored by calculating apparent diffusion coefficient (ADC) (Le Bihan et al., 1988; Jiang et al., 1993).
Dynamic MRI can be used to track changes in first-pass transit of injected contrast agent boluses through the brain. After ischemia, perfusion deficits can be observed as decreases in contrast bolus transit. The change in transverse relaxivity (ΔR*2) that is measured with dynamic MRI is proportional to the concentration of contrast agent remaining in the tissue (Belliveau et al., 1990; Weisskoff et al., 1993). Although extraction of absolute perfusion values with this technique remains complex and elusive, these bolus-tracking methods have been shown to provide reasonably accurate measures of relative changes in cerebral perfusion.
DWI and perfusion-sensitive MRI are being increasingly used for clinical studies of human stroke (Hugg et al., 1995; Sorenson et al., 1995; Ulug et al., 1995; Warach et al., 1995). The promise of being able to rapidly assess stroke and monitor effects of therapy in vivo provides a compelling logic for using these techniques. Although several studies have shown that these MRI techniques are consistent in their ability to visualize cerebral ischemia (Moseley et al., 1990a; de Crespigny et al., 1993; Minematsu et al., 1993; Quast et al., 1993), the quantitative relationship between MR diffusion and relative perfusion changes has not been extensively examined.
In this report, we examined the relationship between the ADC calculated from DWI and perfusion changes calculated from dynamic MR scanning in a rat model of middle cerebral artery (MCA) occlusion. We tested the hypothesis that the combination of quantitative DWI and perfusion-sensitive MRI provides a highly sensitive method for assessing cerebral ischemia, including areas with only mild to moderate perfusion deficits toward the lesion periphery.
MATERIALS AND METHODS
Animal model
All procedures were approved by the MGH Subcommittee for Research Animal Care in accordance with NIH guidelines. Male Sprague–Dawley rats (n = 7) with an average body weight of 311 ± 40 g (mean ± SD) were used for this experiment. The rats were induced with 5% halothane. Animals remained free-breathing on halothane (0.5–1.5%) anesthesia in an air/oxygen mixture throughout the surgical procedure. A femoral arterial line was placed for measuring mean arterial blood pressure and for sampling arterial blood gas and pH. A rectal probe was used for measuring body temperature. A tail vein catheter was placed for injection of the contrast agent.
Permanent left MCA occlusion was performed using the subtemporal approach (Tamura et al., 1981; Lo et al., 1994; Matsumoto et al., 1995). Briefly, the zygomatic arch was dissected and removed along with subsequent muscle layers, thus exposing the underlying skull. The foramen ovale was used as a landmark for the craniectomy. Bone was removed using a dental drill and microroungers, thereby exposing the MCA and branches at the level of the olfactory tract. All arteries in the field were coagulated by microbipolar cautery, then cut and removed. The ipsilateral common carotid artery was also dissected and ligated with 4-0 silk suture to increase lesion consistency.
MRI
Images were acquired in a 2.0 T spectrometer (Sisco, Fremont, CA, U.S.A.). Animals were laid on their backs on top of a thermal water blanket that was maintained at 37.5°C. They were inserted into a cradle attached to a custom-built MR-compatible stereotactic head frame (David Kopf, Fremont, CA, U.S.A.) to eliminate head motion. The head was then positioned within a proton-tuned linear cosine radiofrequency coil of 40-mm diameter, and the coil was centered in the magnet. Anesthesia was maintained as before with 0.5–1.5% halothane. Mean arterial blood pressure was continuously monitored during scanning. T2-weighted conventional sagittal plane scout images were used to locate the rhinal fissure. Five contiguous axial slices were then selected to cover a volume beginning ∼2 mm posterior of the rhinal fissure and extending to the anterior edge of the cerebellum. Conventional diffusion-weighted spin echo sequences (repetition time/echo time = 2,000/50 ms, resolution = 0.3 × 0.6 × 2 mm slice thickness, four averages), requiring an acquisition time of 8.5 min/scan, collected data at two b values (256 and 1,239 s/mm2) at ∼60 min after occlusion. Immediately following these initial diffusion-weighted images, a bolus of gadodiamide (0.5 mmol/kg; Magnevist, Berlex Laboratories, Germany) was rapidly injected into the tail vein as the brain was imaged with the FLASH method (repetition time/echo time = 14/8 ms, 25° flip angle, resolution = 0.6 × 0.6 × 3 mm, 1 image/s) to detect the first-pass cerebral transit of the injected contrast bolus.
Motion may be a common source of artifact in conventional diffusion-weighted images. To test that our head frame eliminated all bulk motion artifact, navigator echo data were acquired on one rat. With the use of different navigator correction schemes (Anderson and Gore, 1995; Marks et al., 1995), no change was seen in corrected images relative to noncorrected ones. Based upon this test and the quality of the diffusion images, we concluded that motion was not a significant concern.
Data analysis
The selected image slice for quantitative analysis was ∼4 mm posterior to the rhinal fissure, centered at the optic chiasm and including the caudate–putamen. This slice was chosen because it represented the location of maximal ischemia for this rat model of focal ischemia (Tamura et al., 1981; Lo et al., 1994; Matsumoto et al., 1995). All analyses were performed utilizing a Macintosh-based image analysis application (DIP Station; Hayden Image Processing Group, CO, U.S.A.). ADC maps were calculated using standard equations (Le Bihan et al., 1988):
where S0 and S1 are the signal of the two DWI scans and b0 and b1 are 256 and 1,239 s/mm2. We previously showed that ADCs calculated from two b values were no different from those fitted with four b values (Matsumoto et al., 1995).
Regions of interest (ROI) were drawn in the cortex and basal ganglia for both hemispheres to obtain mean regional ADC values. To examine the distribution of ADC values within the ischemic lesions, two ROIs were then drawn around both contralateral and ipsilateral hemispheres, excluding white matter tracts of the corona radiata. The ipsilateral ROIs were thresholded according to the following four categories: ADC < 4.0 × 10⁻⁴ mm2/s, 4.0 < ADC < 5.0 × 10⁻⁴ mm2/s, 5.0 < ADC < 6.0 × 10⁻⁴ mm2/s, and ADC > 6.0 × 10⁻⁴ mm2/s. The mean ADC values for the contralateral hemisphere and the four new ipsilateral ROIs were recorded.
These five ROIs were then copied onto the perfusion-sensitive MR images. Signal intensities were plotted over time to assess the first-pass transit of the injected contrast bolus. MR signal intensity data were then converted to ΔR*2 (t) using standard techniques (Belliveau et al., 1990; Hamberg et al., 1993; Roberts et al., 1993; Rosen et al., 1993):
where TE is echo time. ΔR*2 (t) is proportional to the contrast agent concentration–time curves and can therefore be used to estimate perfusion parameters. Both ΔR*2 peak and ΔR*2 integral values were calculated as ratios for ischemic versus normal values obtained from the entire contralateral hemisphere.
To examine the relationship between gradients in ADC reductions and MR-based perfusion deficits, we focused on periischemic zones that encompassed regions with intermediate perfusion deficits. Other studies have shown that periischemic regions in rat MCA occlusions possess regional cerebral blood flow values ranging from 35 to 75 ml 100 g–l min–1 (Tyson et al., 1984; Memezawa et. al., 1992). Assuming an average cerebral blood flow of 125 ml 100 g–1 min–1 in normal rat brain, this translates into a relative perfusion range of 0.28–0.60. Data points from the ROI analysis that fell within this range were selected, and the quantitative correlations between ADC and ΔR*2 peak ratios and ΔR*2 integral ratios were calculated.
Statistical analysis
All data were expressed as means ± SD. Changes in systemic parameters, ADC values, and perfusion ratios were tested using two-tailed t tests. Relationships between ADC and perfusion deficits were assessed using linear regressions. Results with p < 0.05 were considered significant.
RESULTS
Systemic parameters during all experiments (Table 1) were within normal range for spontaneously breathing rats under halothane anesthesia (Memezawa et al., 1992). Mean arterial blood pressure was slightly elevated after induction of focal ischemia.
Systemic parameters
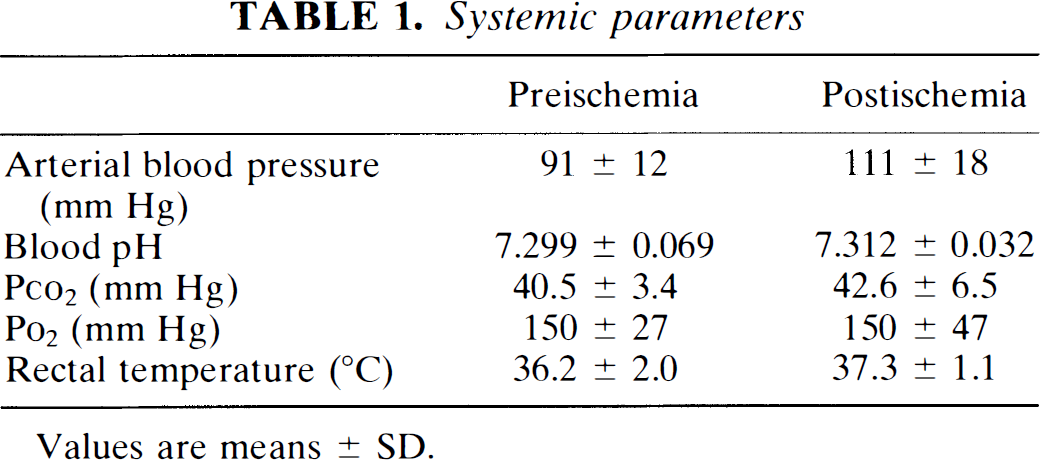
Values are means ± SD.
Focal ischemia was visible on the diffusion-weighted images (b = 1,239 s/mm2) with relative signal intensity increase in the occluded hemisphere (Fig. 1). ADC values were significantly decreased in the ischemic hemisphere compared with values in the contralateral hemisphere. In normal brain, ADC values were 6.79 ± 0.37 × 10⁻⁴ mm2/s and 5.96 ± 0.44 × 10⁻⁴ mm2/s in cortex and basal ganglia, respectively. ADC values in the ischemic hemisphere were decreased to 5.67 ± 0.88 × 10⁻⁴ mm2/s (cortex) and 4.62 ± 0.32 × 10⁻⁴ mm2/s (basal ganglia). The reduction in ADCs were significant for both cortex (p < 0.05) and basal ganglia (p < 0.0001).
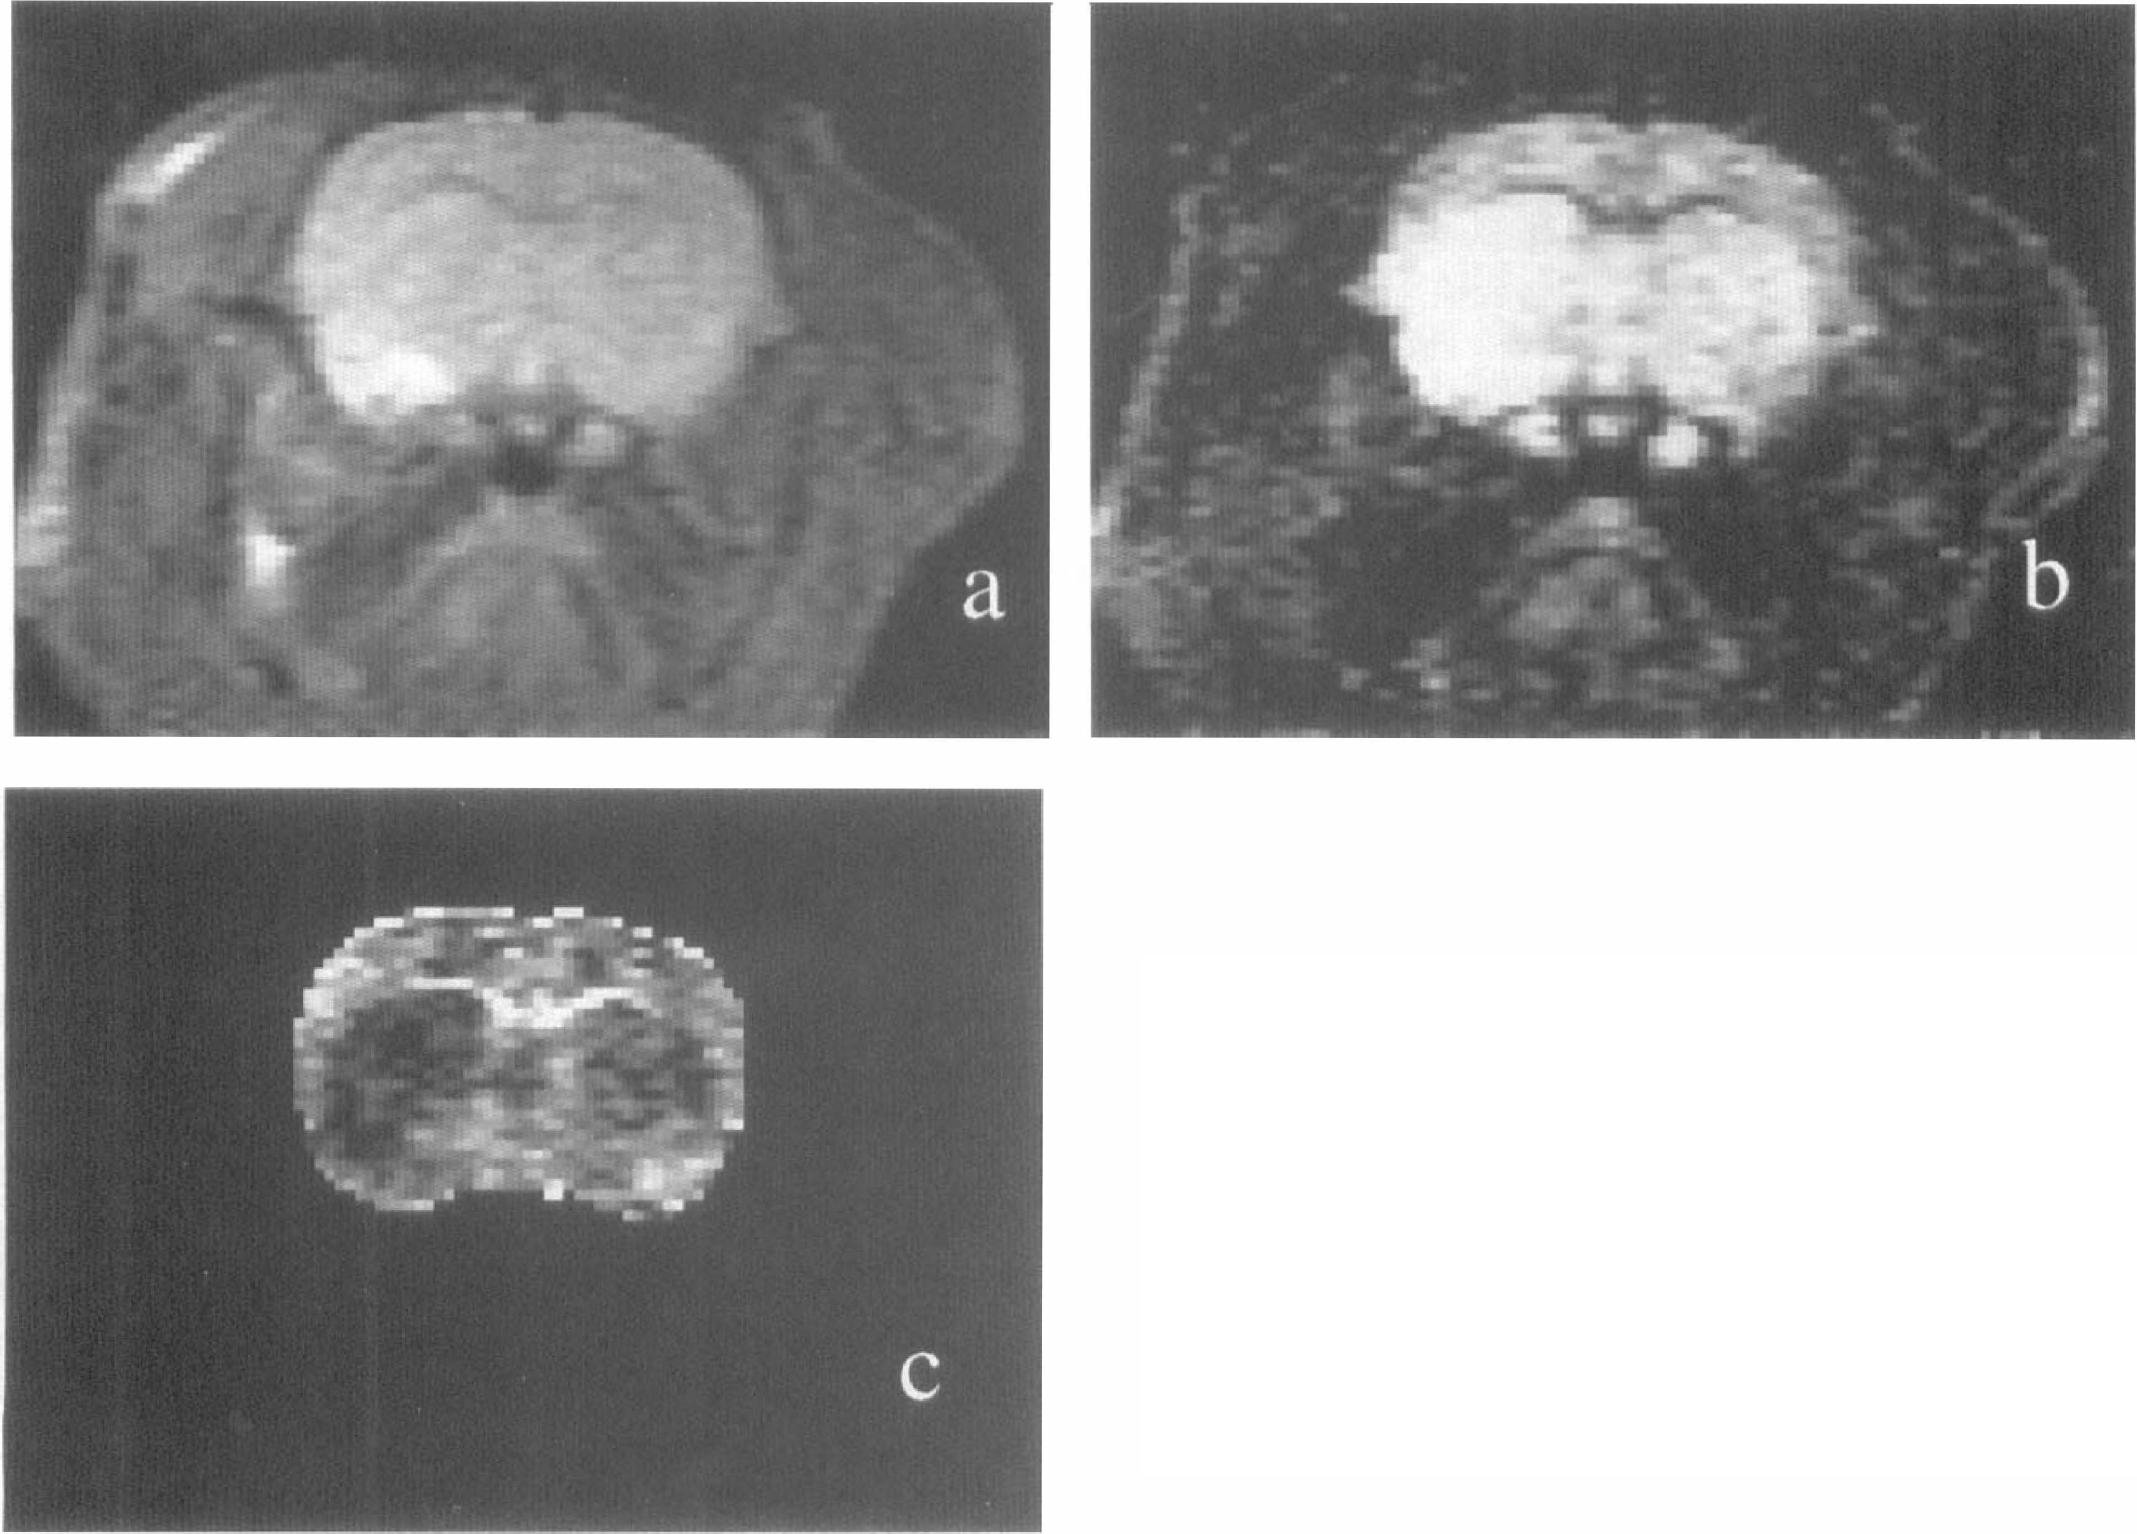
Diffusion-weighted images taken at the level of the caudate–putamen from one experiment.
Perfusion deficits were found in all seven rats on the FLASH MR studies. First-pass transit of the contrast bolus induced a transient reduction in MR signal intensity. This corresponded with a transient increase in ΔR*2. In the ischemic hemisphere, perfusion deficits were manifested as smaller reductions of signal intensity and decreased bolus transit curves. Within the ischemic hemisphere, there was a clear relationship between the reduction in ADC values and the relative perfusion deficits observed with the ΔR*2 bolus transit curves (Fig. 2).
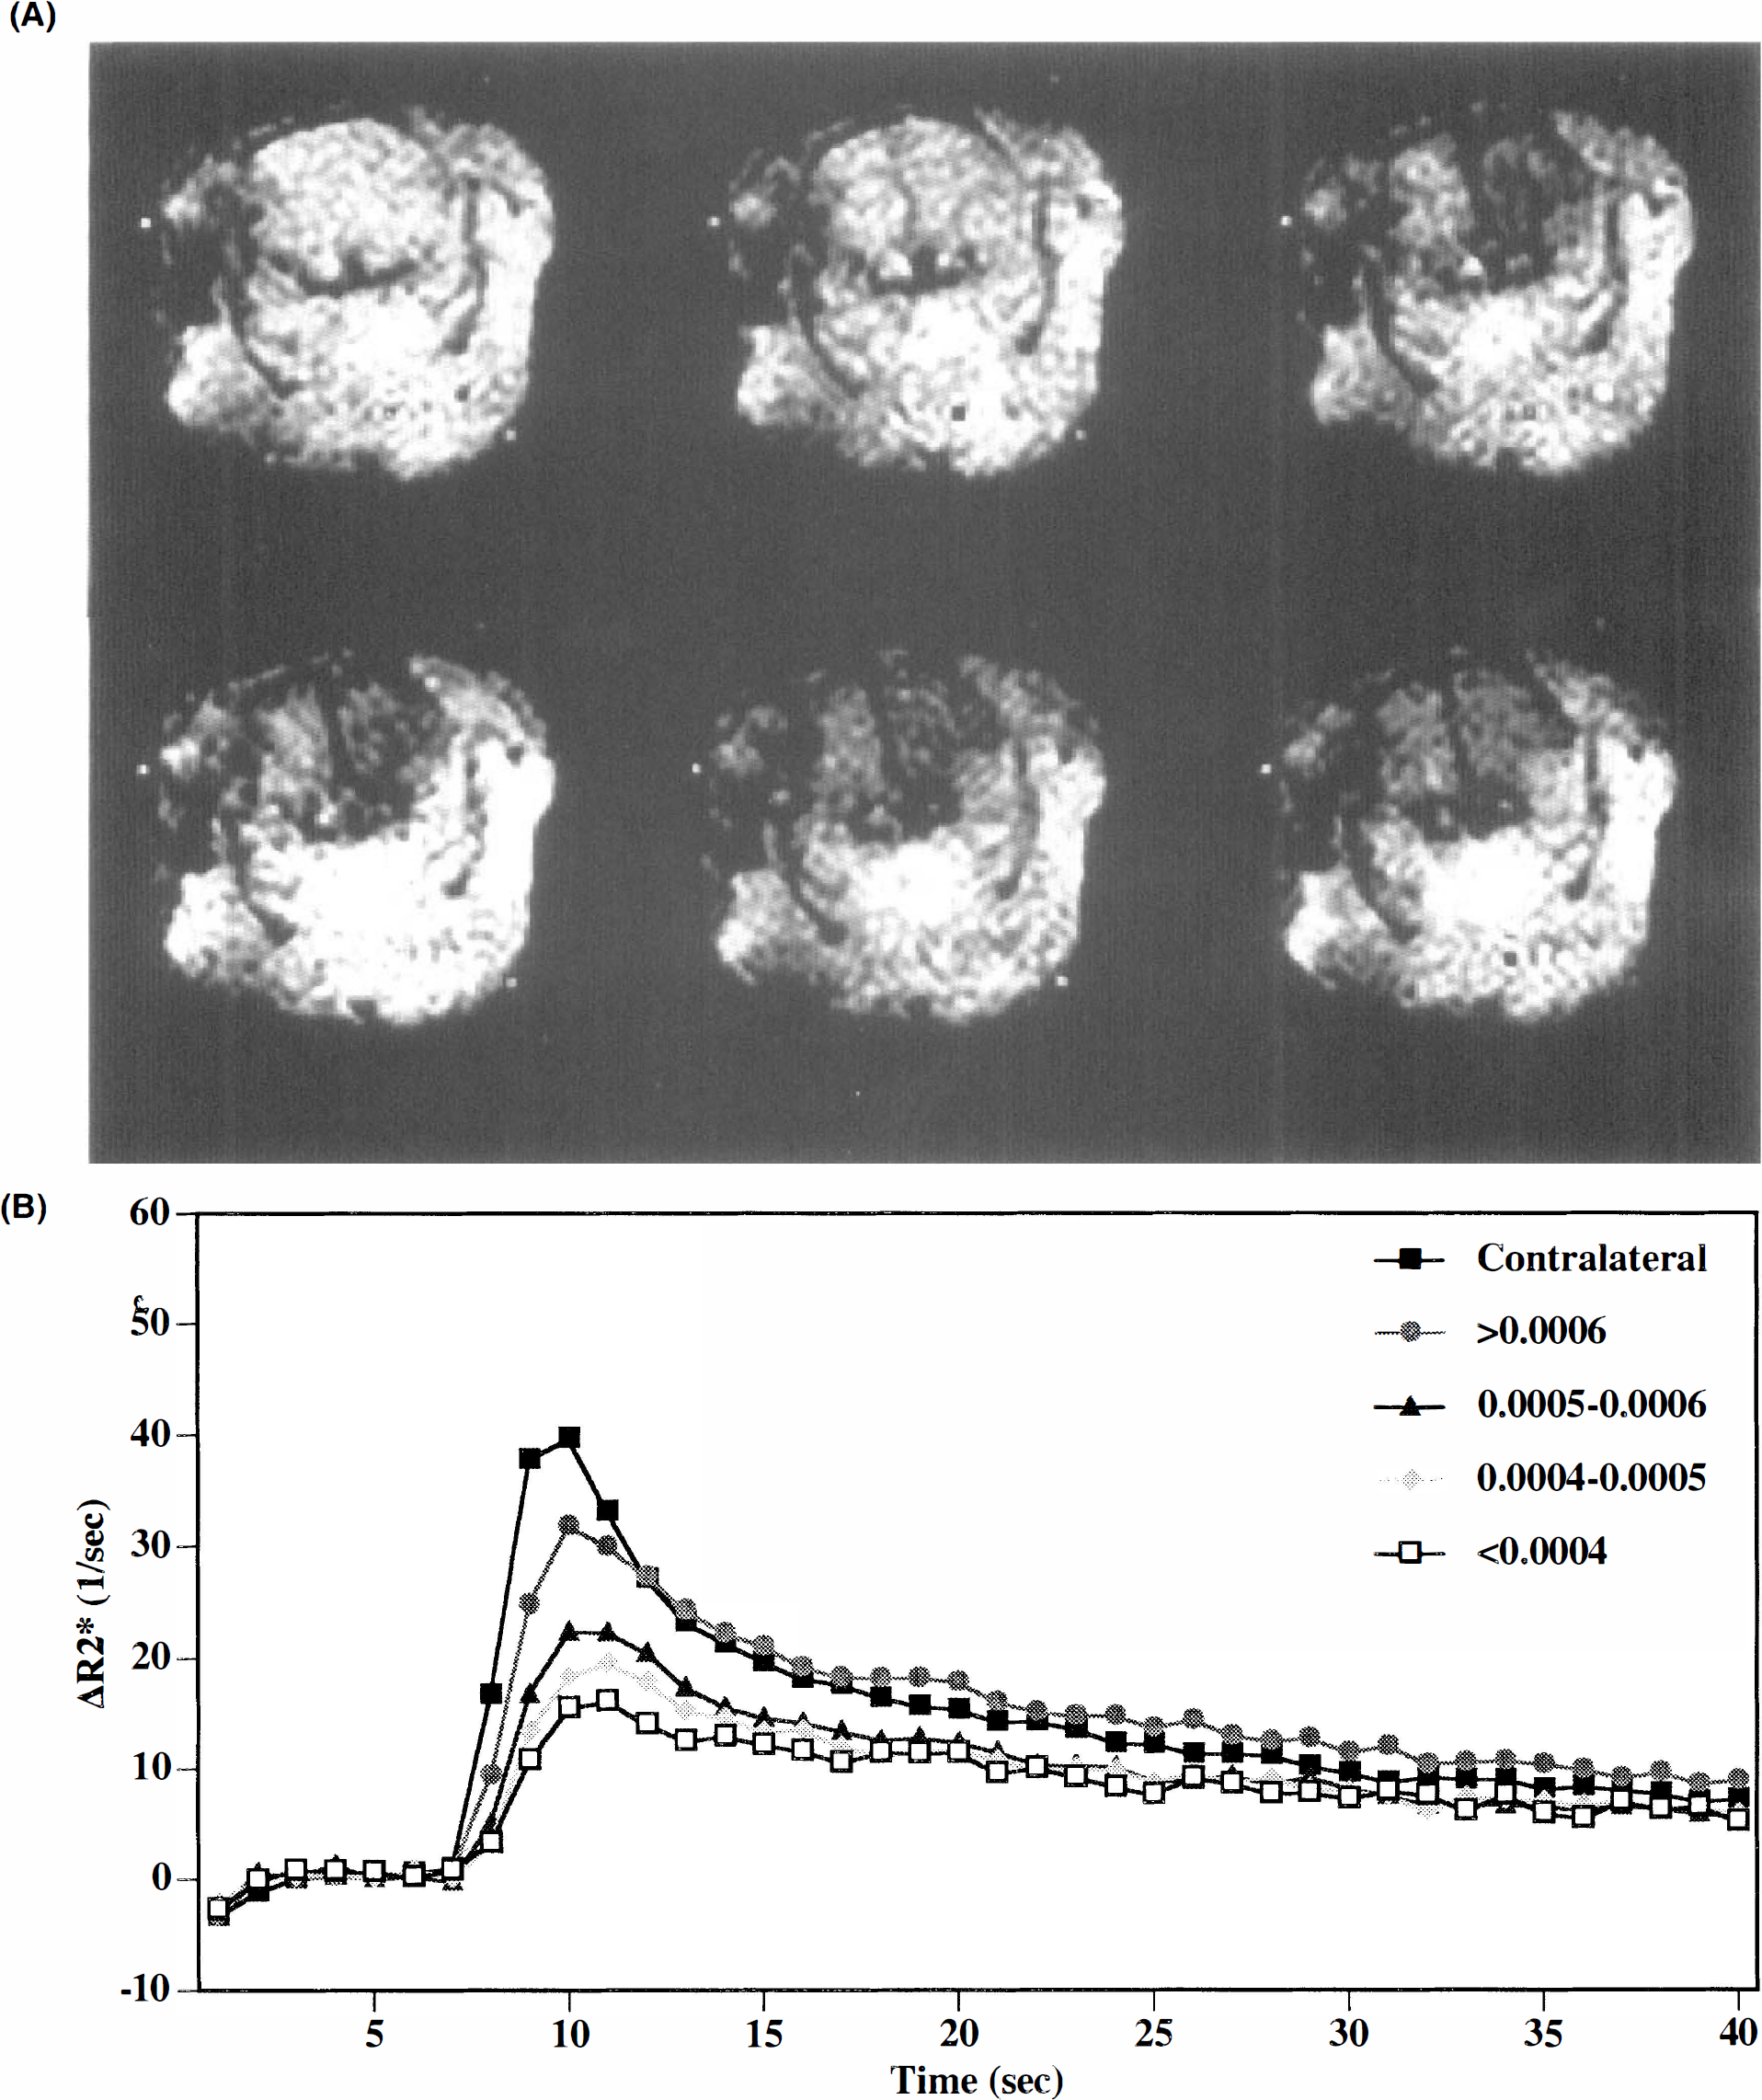
The center or core of the lesion with the most severe ischemia possessed the lowest ADC values. Within this central zone, there was no relationship between ΔR*2-based parameters and the ischemic ADC reductions (r = 0.685, p = 0.3). However, in the intermediate zones that comprised the lesion periphery (i.e., regions with ΔR*2-based perfusion ratios that fell between 0.28 and 0.60), ADC reductions appeared to be related to the degree of relative perfusion deficits. For individual animals, a repeated measures analysis of variance indicated that there was a highly significant relationship between ΔR*2 peak ratios and ADC (F = 35.8, p = 0.0001). When the data were pooled and collectively analyzed, a significant linear correlation was found (Fig. 3a). Interestingly, no correlations were observed between ADC reductions and ΔR*2 integral ratios (Fig. 3b).
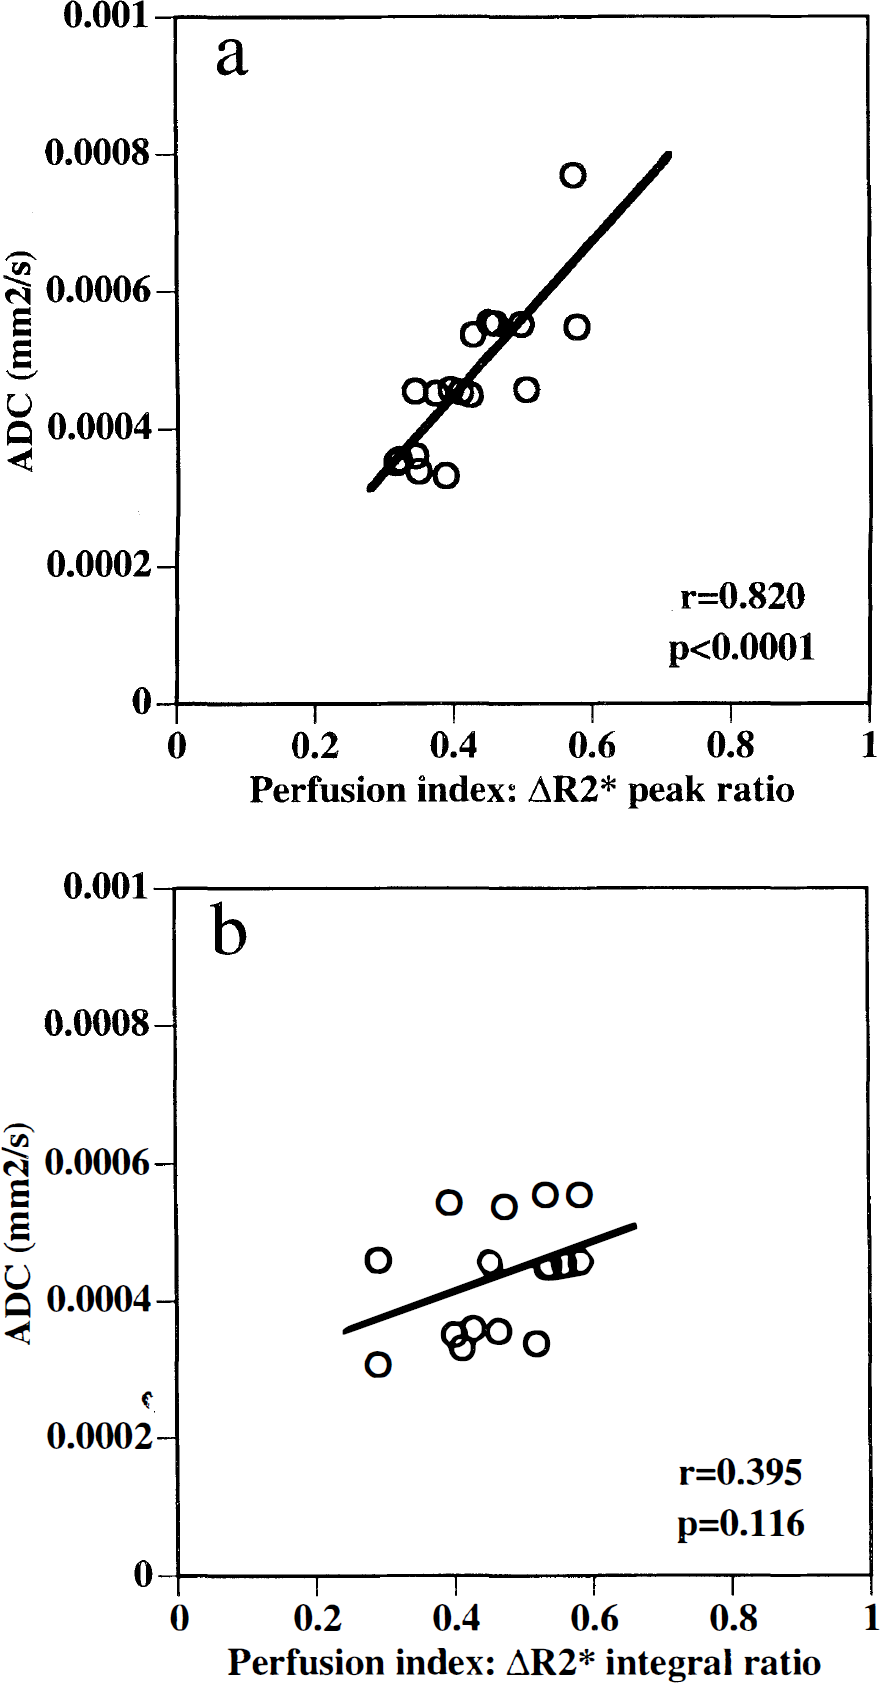
Intermediate perfusion ratios between 0.28 and 0.60 were plotted against apparent diffusion coefficient (ADC) values to ascertain correlation of perfusion and ADC in peripheral ischemic zones.
DISCUSSION
The combined use of DWI and perfusion-sensitive MRI techniques will potentially provide a powerful tool for managing clinical stroke (Hugg et al., 1995; Sorenson et al., 1995; Ulug et al., 1995; Warach et al., 1995). It is therefore important that the relationship between these measurements be quantitatively examined.
Previous studies have suggested that DWI lesions develop only if cerebral blood flow decreases below critical ischemic thresholds. In a gerbil model of global ischemia (Busza et al., 1992) and a cat model of focal ischemia (Dijkhuizen et al., 1994), DWI hyperintensity does not occur until cerebral blood flow has dropped below 15–20 ml 100 g–1 min–1. Other investigators, however, have found that alterations in MR diffusion do not appear to have this all-or-none characteristic. Two other studies with cat focal ischemia have suggested that a linear relationship may exist between ADC reductions and ΔR*2 parameters of cerebral perfusion (Roberts et al., 1993; van Zijl et al., 1995). One reason for this apparent discrepancy may be related to the fact that dynamic bolus MR studies currently provide imperfect estimates of cerebral perfusion, as further discussed herein. However, these results indicate that gradients in ADC reductions can occur in focal ischemia. Although it is possible that partial volume averaging effects may account for the gradual ADC reductions seen toward the periphery of the ischemic distributions, several recent studies have shown that gradations in ischemic pathophysiology are the more likely explanation. Acute DWI lesions include core areas with flow <20 ml 100 g–1 min–1 and complete loss of ATP, as well as penumbral areas with partially preserved energy status (Kohno et al., 1995). Others have shown that gradients in cell swelling and tissue acidosis appear to parallel the ADC alterations seen in focal ischemia (van Lookeren Campagne et al., 1994; Hoehn-Berlage et al., 1995).
The results from this present study showed that maximal ADC reductions of up to 50% were present in the center or core of the ischemic zone. However, in the peripheral zones surrounding the core, only mild to moderate ADC reductions were present. These data are consistent with reports that DWI lesions can be partially reversed after early treatment with glutamate receptor antagonists (Minematsu et al., 1993; Lo et al., 1994) or reperfusion (Hasegawa et al., 1994; Hossmann et al., 1994). It is therefore possible that the combined mapping of ADC and perfusion changes can be used to identify the ischemic penumbra. Recently, it has been shown that ADC transients can occur within these peripheral zones (Hasegawa et al., 1995; Rother et al., 1996). In the present study, however, these ADC transients were not detected due to limitations in the speed of our DWI scans.
Within these peripheral ischemic regions, ADC reductions were linearly correlated with ΔR*2 peak ratios but not with ΔR*2 integral ratios. Since ΔR*2 integral ratios most likely represent relative blood volume and ΔR*2 peak ratios are heavily weighted by blood flow influences (Belliveau et al., 1990; Hamberg et al., 1993; Rosen et al., 1993; Weisskoff et al., 1993), it is possible to speculate that ADC reductions in this study were proportional to blood flow deficits in the ischemic penumbra, whereas tissue injury and flow were decoupled from the blood volume response in these same regions. These data are consistent with the idea that compensatory vasodilation occurs in brain tissue subjected to mild to moderate ischemia (Symon, 1987; Powers, 1991).
Although the time integral of the ΔR*2 curve (and hence contrast agent concentration) is a well established measure of blood volume (Belliveau et al., 1990; Hamberg et al., 1993), the extraction of blood flow rates is more complex (Lassen, 1984; Weisskoff et al., 1993). The peak of the concentration–time curve is an appropriate measure of relative blood flow only under strict conditions of a sharp bolus (Weisskoff et al., 1993). However, dispersion in the arterial input function contributes to the bolus width measured in tissue (Lassen, 1984; Weisskoff et al., 1993). Furthermore, variance in transit times due to microvessel topology contributes additional variance in the tissue time response that cannot, in principle, be decoupled from flow effects without an accurate model of vessel topology (Weisskoff et al., 1993). Nevertheless, computer simulations (Weisskoff et al., 1993) have shown that relative blood flow can be estimated with reasonable accuracy, given similar vascular physiology. In this study, all perfusion parameters were computed relative to contralateral values, thereby minimizing the effects of variations in vascular topology.
Another parameter that can be extracted from dynamic bolus transit studies (besides peak and integral) is the delay in peak arrival times. It has been proposed that delays in bolus peaks can provide additional information on hemodynamic perturbations after cerebral ischemia (Roberts et al., 1993; Soher et al., 1995; Lo et al., 1996). In fact, a recent study of transient focal ischemia suggested that peak delays were more sensitive to reperfusion than other bolus transit parameters (Müller et al., 1995). The caveat remains, however, that all these bolus transit parameters provide only indirect reflections of the perfusion deficits after ischemia.
There are several caveats associated with the present study. First, we did not compare our indirect MR measurements with traditional tracer measurements of blood flow. However, validating dynamic MR techniques was not a goal of the study. It has been shown that bolus transit peaks in rat focal ischemia are linearly correlated with microsphere flow measurements (Goetze et al., 1994). Furthermore, another recent study using MRI bolus tracking also showed a significant linear correlation between MR-based flow parameters and quantitative flow measured autoradiographically (Wittlich et al., 1995). Second, quantitative analysis was performed on only a single slice so that three-dimensional data on diffusion– perfusion relationships were not evaluated. However, other studies suggest that the caudoputaminal slice chosen in this study represents maximal ischemia for this model (Tamura et al., 1981; Lo et al., 1994; Matsumoto et al., 1995). Third, we obtained perfusion data only at a single timepoint after arterial occlusion. We have previously shown that the temporal evolution in ADC profiles matches the progression of vasogenic edema, gliosis, and infarction (Matsumoto et al., 1995). Analysis of long-term diffusion–perfusion changes may provide additional information on stroke pathophysiology. Finally, the use of a linear regression model may not be valid for the whole range of tissue ADCs. We showed that there was no relationship between ADC and ΔR*2 indexes within the ischemic core. A similar phenomenon is likely to be present in normal brain, where ADCs will level off at some maximal level, typically in the range of 6–8 × 10⁻⁴ mm2/s for rat brain (Hasegawa et al., 1994; Hoehn-Berlage et al., 1995; Matsumoto et al., 1995). The linear relationship explored in this report may be limited only to the intermediate zones of ischemia.
In conclusion, we have examined the quantitative relationship between MR diffusion and perfusion measurements in rat focal cerebral ischemia. Our results indicate that gradients in lesion intensity are present, ranging from severe ischemia in the center or core to intermediate and moderate changes toward the lesion periphery. These data suggest that combined measurements of ADC and indirect MR perfusion parameters may be used to quantitatively assess these gradients in focal ischemia, including potentially critical areas at risk in the ischemic penumbra.
Footnotes
Acknowledgment:
This work was supported in part by NIHNS32806 (E.H.L.), HL39810 (B.R.R.) and a grant-in-aid from the American Heart Association (E.H.L.).