
Abstract
Nitroxide free radicals are known to protect cells from oxidative damage. Diffusion-weighted and perfusion-weighted magnetic resonance imaging was used to evaluate the effects of polynitroxyl albumin(PNA) in a middle cerebral artery intraluminal suture model of transient focal cerebral ischemia in the rat. Three groups of Sprague-Dawley rats were investigated: (1) PNA(N = 6), (2) human serum albumin (N = 6), and (3) saline (N = 7). The middle cerebral artery was occluded for 2 hours. Treatment was started 30 minutes after induction of ischemia. A total dose of 1% body weight (volume/weight) of PNA (23.5 mg/dL protein and 110 mmol/L nitroxide), albumin (23.5 mg/dL), or saline was injected intravenously at three time points: 0.5% at 0.5 hours, 0.25% at 2 hours (i.e., just before reperfusion), and 0.25% at 4 hours after occlusion. Six sets of diffusion- and perfusion-weighted magnetic resonance images were acquired throughout the 2 hours of ischemia and the 2 hours of reperfusion. The rats were killed at 24 hours, and the brains were stained with 2,3,5-triphenyltetrazolium chloride (TTC). Diffusion-weighted imaging showed that the growth of the ischemic lesion was suppressed in the PNA-treated group. The 4 hours diffusion-weighted imaging-derived hemispheric lesion volume in the PNA-treated group (25% ± 9%) was significantly smaller than that in the saline-treated(43% ± 13%; P = 0.016) or albumintreated groups (38% ± 6%; P = 0.017). A larger difference was observed for the 24-hour TTC-derived lesion volumes in the PNA (8% ± 7%), saline (35% ± 8%; P< 0.001), and albumin (31% ± 6%; P < 0.001) groups. Perfusion-weighted imaging demonstrated a marked improvement in cerebral perfusion in the PNA-treated group during ischemia and reperfusion. In conclusion, treatment with PNA results in an improvement in perfusion and a reduction of infarct volume in a model of transient focal cerebral ischemia in the rat.
Keywords
Oxidative damage is implicated in ischemic tissue injury (McCord, 1985; Siesjo et al., 1989; Traystman et al., 1991). Nitroxides are stable free radicals that have been shown to protect cells from oxidative damage initiated by superoxide, hydrogen peroxide, or radiation in vitro and in vivo (Nilsson et al., 1989; Mitchell et al., 1990; Samuni et al., 1991a,1991b; Hahn et al., 1994). One such nitroxide free radical, 4-hydroxy-2,2,6,6-tetramethylpiperidine-1-oxyl (tempol), has reduced reperfusion damage in the isolated perfused heart (Gelvan et al., 1991) and has reduced brain damage in rats subjected to closed head injury (Beit-Yannai et al., 1996). The beneficial mechanisms of nitroxides are unclear, but they may involve catalytic reduction of the levels of superoxide (i.e., acting as a superoxide dismutase mimic), oxidation of reduced transition metal ions, and detoxification of secondary organic radicals (Mitchell et al., 1990; Krishna and Samuni, 1994; Krishna et al., 1996). However, the benefit of nitroxides is limited by their short circulatory half-life in vivo. By covalently bonding the nitroxides to human serum albumin, as in polynitroxyl albumin(PNA), the compound under study in this report, the half-life and the antioxidant activity of the nitroxides can be enhanced (Kuppusamy et al., 1996). Unlike free nitroxides, the nitroxides in PNA are bound to a macromolecule and thus remain in the vascular space. Because of its enhanced redox activity, PNA might prove useful in the treatment of cerebral ischemic-reperfusion injury.
An evaluation of PNA in a suture model of transient middle cerebral artery occlusion(MCAO) in the rat is presented in this communication. This study evaluates the following:(1) the effectiveness of PNA in minimizing ischemic injury, (2) the timing of the actions of PNA during ischemia and reperfusion, and (3) the mechanism of action (i.e., hemodynamic or neuroprotective). The magnetic resonance imaging (MRI) techniques of diffusion-weighted MRI (DW imaging) and perfusion-weighted MRI (PW imaging) were used to follow the progression of the ischemic lesion and the perfusion deficit, respectively, during ischemia and reperfusion (Minematsu et al., 1993; Kozniewska et al., 1995). Diffusion-weighted imaging can delineate regions of ischemia because of a reduction of the apparent diffusion coefficient(ADC) of water in ischemic tissue (Moseley et al., 1990). In fact, the ADC in ischemic tissue can decrease significantly as early as a couple of minutes after induction of ischemia (Röther et al., 1996b). Dynamic contrast-enhanced PW imaging (Villringer et al., 1988) can semiquantitatively assess the perfusion deficit during MCAO and can assess the quality of reperfusion after the occluding suture is withdrawn. In addition to evaluating the efficacy of PNA in the aforementioned model of focal cerebral ischemia in the rat, the ability of MRI to monitor both the underlying hemodynamics and the temporal evolution of the ischemic lesion may yield insight about the mode of action of PNA.
MATERIALS AND METHODS
Animal model and protocol
Nineteen male Sprague-Dawley rats (270 to 370 g) were anesthetized initially with 3% halothane in a mixture of air (80%) supplemented with oxygen (20%). The rats were intubated and ventilated to keep the blood gases within the physiologic range. Anesthesia was maintained with 0.75% to 1.5% halothane throughout surgery and imaging. Body temperature was controlled with circulation of warm air. The femoral artery and vein were catheterized to monitor blood pressure and blood gases, and to deliver drug and contrast agent. The rats underwent 2 hours of MCAO induced by an intraluminal suture. Briefly, the tip of a 4-0 monofilament was coated with silicone to a diameter of ∼0.28 mm and was introduced into the internal carotid artery through the isolated stump of the external carotid artery (Koizumi et al., 1986). The suture then was advanced through the skull base to occlude the origin of the middle cerebral artery (MCA).
Immediately after the advancement of the suture, the rats were transferred to the MRI spectrometer. The rats were removed from the magnet at 2 hours after MCAO for withdrawal of the suture and subsequent restoration of blood flow through the internal carotid artery. The rats then were repositioned carefully in the MRI spectrometer for an additional 2 hours of MRI. Anatomical landmarks were employed to allow for the sequential comparison of MRI data. After the imaging protocol was complete at 4 hours after MCAO, the rats were removed from the spectrometer and allowed to recover. At 24 hours, the rats underwent a neurologic examination and were scored as follows: 0 for no apparent deficit, 1 for contralateral forelimb flexion, 2 for decreased grip of the contralateral forelimb when tail is pulled, 3 for contralateral circling only when pulled by the tail, and 4 for spontaneous contralateral circling (Bederson et al., 1986; Menzies et al., 1992). Rats that died before the 24-hour time point were given the poorest score (i.e., 4). After the neurologic examination, the rats were killed, and fresh coronal brain sections (2-mm thick) were stained with a 2% solution of 2,3,5-triphenyltetrazolium chloride (TTC) in saline to obtain an MRI independent measure of the extent of the ischemic injury.
Three groups were studied: (1) PNA (N = 6) (SynZyme Technologies, Inc., Irvine, CA, U.S.A.), (2) human serum albumin(N = 6) (Baxter Healthcare Corp, Glendale, CA, U.S.A.), and (3) saline (N = 7). The nitroxide concentration in the PNA solution was 110 mmol/L, which corresponds to 42 nitroxide moieties per molecule of albumin. Albumin was used to differentiate between the effects of albumin and the nitroxides in PNA. Treatment was started 30 minutes after induction of ischemia. A total dose of 1% body weight (volume/weight) of PNA (23.5 mg/dL protein and 110 mmol/L nitroxide), albumin (23.5 mg/dL), or saline was injected intravenously at three time points after MCAO, namely, 0.5% at 0.5 hours, 0.25% at 2 hours (i.e., just before reperfusion), and 0.25% at 4 hours after MCAO.
Magnetic resonance imaging
To follow the progression of the ischemic lesion, T2-, diffusion-, and perfusion-weighted imaging was performed at six time points after MCAO: 0.25 hours (before first drug treatment at 0.5 hours), 1 hour, ∼1.7 hours(just before reperfusion at 2 hours), ∼2.3 hours (just after reperfusion at 2 hours), 3 hours, and 4 hours. All imaging was performed on a 2-T Bruker Omega CSI spectrometer (Karlsruhe, Germany) equipped with shielded gradients capable of producing 20 G/cm. The head of the rat was centered supinely in a 5.5-cm diameter bird cage radiofrequency coil.
Isotropic or trace diffusion-weighted spin-echo imaging(DW imaging) was used for delineation of the ischemic region, since it can depict the region of ischemia more accurately than single-axis diffusion weighting by removing the confounding effects of anisotropic diffusion on signal intensity (van Gelderen et al., 1994; Lythgoe et al., 1997). The isotropic weighting was achieved within a single scan by using diffusion-sensitizing gradient waveforms (Butts et al., 1997) that satisfy the orthogonality requirements detailed by Wong and colleagues (1995). Each set of diffusion-sensitizing gradients before and after the π radiofrequency pulse had a duration of 25 milliseconds. A high gradient factor, b, of 1300 s/mm2 was used for a DW image and a low b value of 20 s/mm2 was used for a primarily T2-weighted image. Pixel-by-pixel maps of the ADC of water were calculated from these two images (Le Bihan et al., 1986). The images were acquired with a 128 × 128 matrix, field of view 50 mm, repetition time 2.5 seconds, echo time 80 milliseconds, one average, eight coronal slices, slice thickness 1.5 mm, interslice gap of 0.2 mm, and an acquisition time of ∼5.5 minutes.
Perfusion-weighted imaging was performed using spin-echo echo planar imaging to follow the passage of a bolus injection of 0.3 mmol/kg gadolinium diethylenetriaminepentaacetic acid (Magnevist, Schering, Berlin) (Villringer et al., 1988). The echo planar images were acquired with a 64 × 64 matrix, field of view 40 mm, repetition time 1.5 seconds, echo time 88 milliseconds, one average, four coronal slices, slice thickness 2.5 mm, and an interslice gap of 0.2 mm. Sixteen sets of these four slices were acquired continuously for 24 seconds. After 6 seconds of baseline imaging, a bolus of contrast was injected into the femoral vein, and the passage of the bolus of contrast through the brain was monitored by imaging for a further 18 seconds.
Data analysis
The evolution of the ischemic injury was followed by calculating lesion volumes from the DW images. Ischemic areas were defined as regions with hyperintensity greater than 1 SD (consistently∼18%) of the normal contralateral side on the DW images, which is comparable with the thresholds of 15% and 20% used in earlier DW imaging studies (Müller et al., 1995; Kohno et al., 1995). The areas of DW imaging hyperintensity were summed over the central six MR images, thereby covering 10 mm of the brain, and the lesion volume was expressed as a percentage of the hemispheric volume (%HLV). Lesion volumes at 24 hours after MCAO were measured by summing the unstained areas on five TTC sections.
As a semiquantitative measure of cerebral perfusion in the ischemic hemisphere, the time-to-peak, and the maximum signal loss in the bolus-tracking curves were measured in the basal ganglia and the basal and lateral part of the cortex, and were normalized relative to the corresponding regions in the nonischemic hemisphere (Minematsu et al., 1993; Röther et al., 1996a). The bolus delay in the stroked ipsilateral hemisphere compared with the contralateral side is given by

and the bolus peak ratio (BPR) is given by
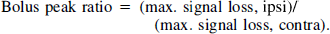
Perturbations in cerebral perfusion can be characterized by a delay in the arrival of the bolus of contrast to the ipsilateral hemisphere of the brain compared with the contralateral hemisphere. In addition, the maximum signal loss yields an estimate of the amount of contrast, and by implication the amount of blood, passing through the brain. Since the signal loss in the ipsilateral hemisphere must be normalized with respect to the contralateral hemisphere, which presumably has normal perfusion, a BPR of 1 implies normal perfusion in the ipsilateral hemisphere and 0 indicates no perfusion. Perfusion changes were analyzed on the central slice at the level of the caudoputamen. In addition to these measurements, the area of tissue with a bolus delay of 2 seconds or more on the ipsilateral hemisphere of the central slice was calculated to demarcate the tissue affected by the MCAO.
Comparisons between the various groups were made with the Student's t test and the level of significance was defined as P ⩽ 0.05 (represented as * in the figures). The mean and SD are presented for the various groups.
RESULTS
Physiology
Body temperature, pH, PaO2, PaCO2, and mean arterial blood pressure were within physiologic range for all groups (Table 1). Both albumin and PNA reduced the hematocrit at 2 and 4 hours after MCAO relative to saline (Table 1). None of the animals experienced subarachnoid hemorrhage. Fourteen of 19 animals survived until the 24-hour time point, and hence infarct volumes at 24 hours could be calculated from TTC-stained sections for these animals. Therefore, TTC data were obtained on six of six PNA-treated, four of six albumin-treated, and four of seven saline-treated animals. One saline-treated animal had a hemorrhagic transformation, and one albumintreated animal had a parenchymal hemorrhage within infarcted tissue. The mean neurologic scores at 24 hours were 3.3 ± 1.1, 2.8 ± 1.2, and 2.2 ± 0.8 for the saline-, albumin-, and PNA-treated rats, respectively. The PNA-treated rats had a better neurologic score than the saline-treated rats, but the difference did not reach significance (P = 0.06).
Parameters of general physiology before and after occlusion of the middle cerebral artery
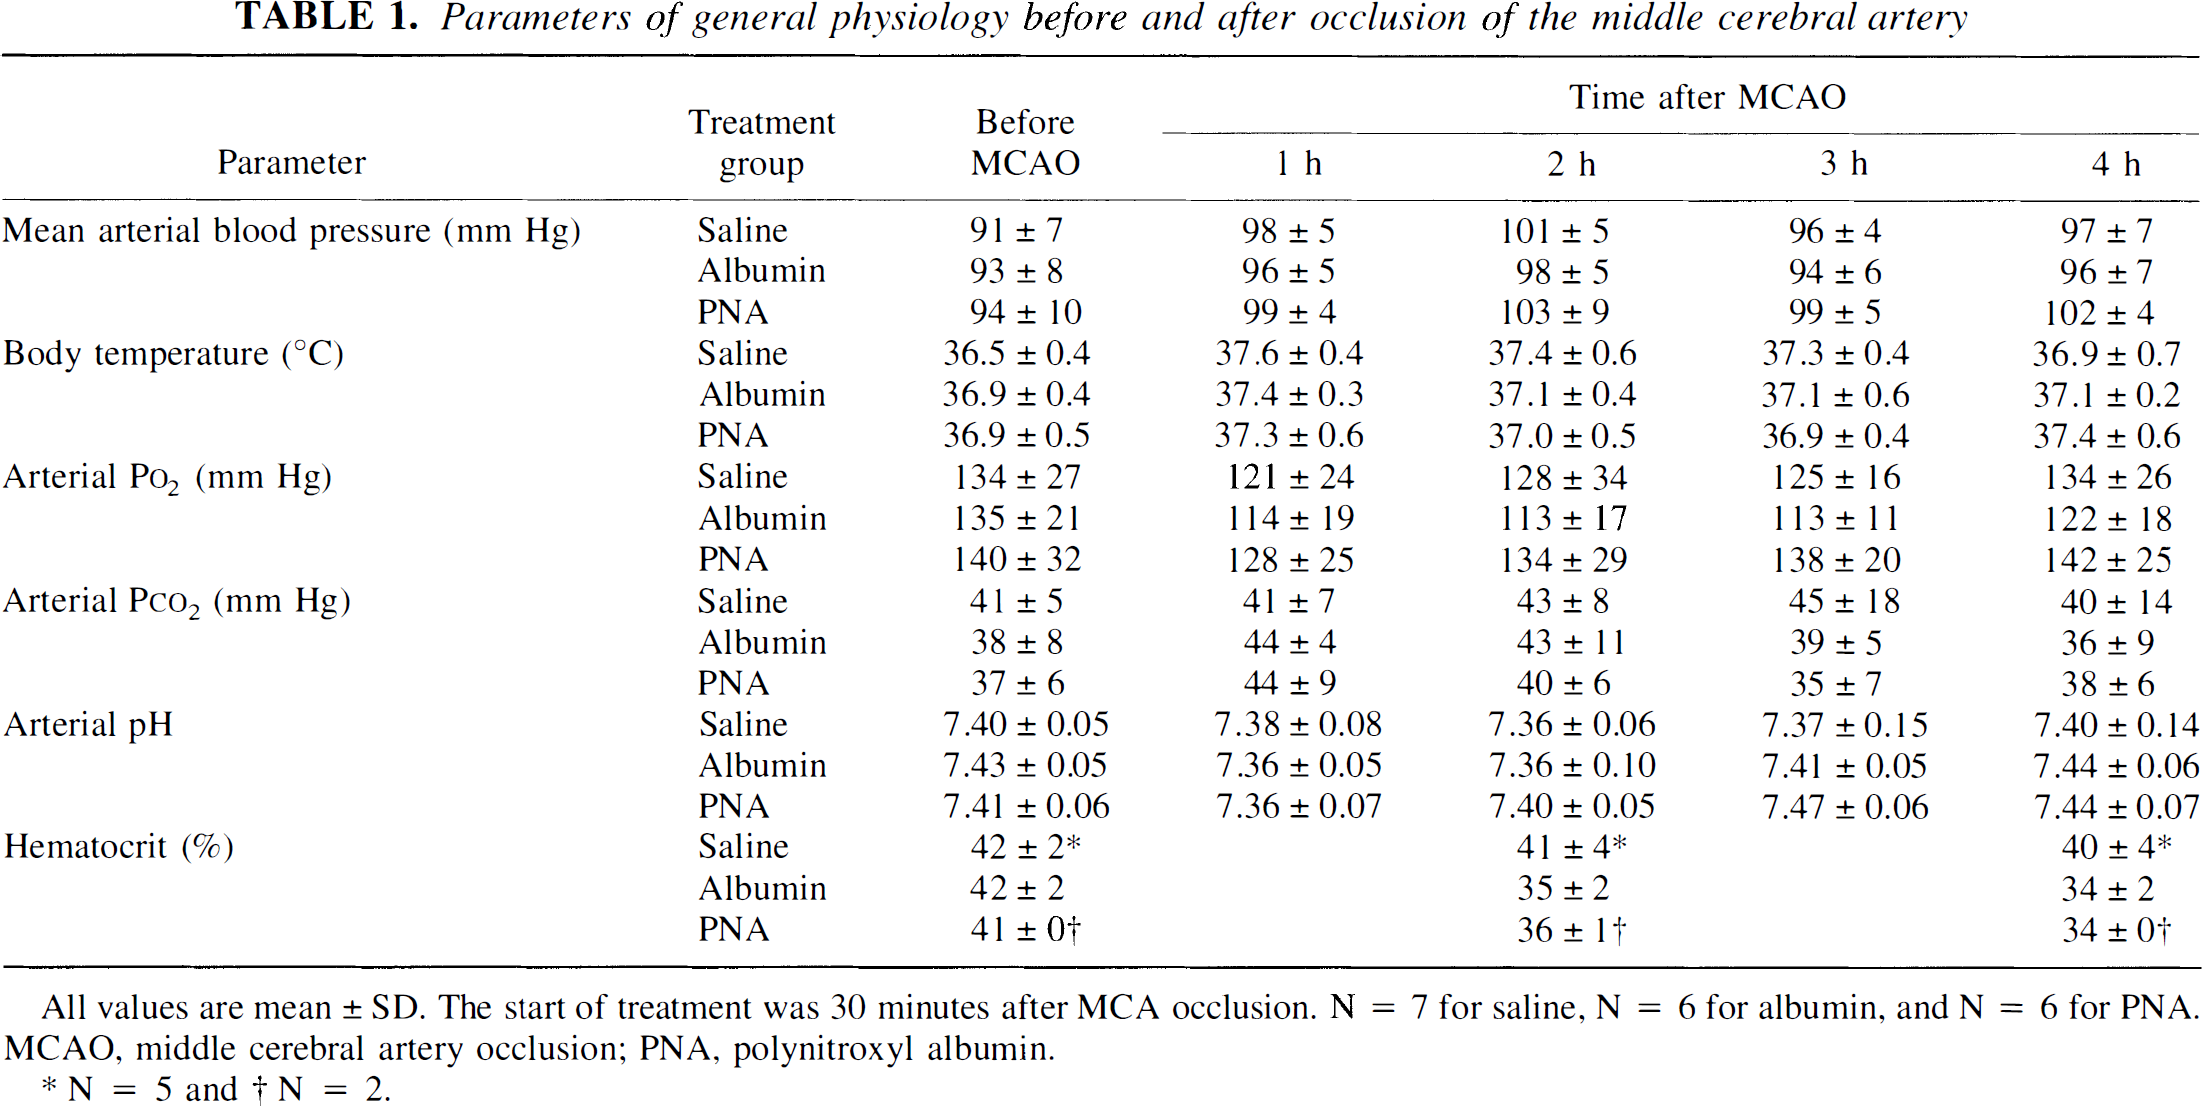
N = 5
N = 2
TTC-derived lesion volume
The final%HLV on the TTC-stained sections at 24 hours after MCAO was significantly lower in the PNA-treated group (8% ± 7%) than in the saline-treated (35% ± 8%;P < 0.001) or albumin-treated (31% ± 6%; P < 0.001) groups (Table 2). The final infarcts at 24 hours after MCAO were not significantly different between the saline- and albumin-treated groups(P = 0.42).
Lesion volumes at 4 and 24 hours after middle cerebral artery occlusion
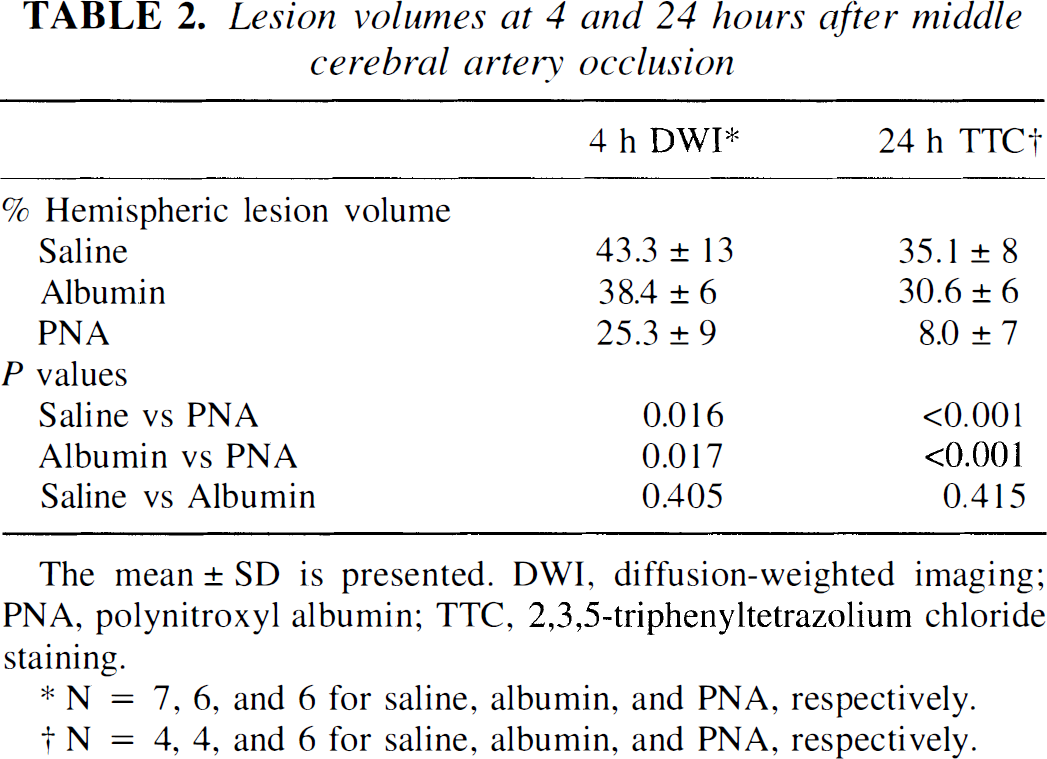
N = 7, 6, and 6 for saline, albumin, and PNA, respectively.
N = 4, 4, and 6 for saline, albumin, and PNA, respectively.
Diffusion-weighted imaging
Diffusion-weighted MR images demonstrating the ischemic lesion in representative saline- and PNA-treated rats over the 4 hours during and after MCAO are shown in Fig. 1. Isotropic diffusion gradients permitted the measurement of ischemic lesions without the complicating factor of signal intensity variations from anisotropic diffusion (van Gelderen et al., 1994; Lythgoe et al., 1997). The evolution of the mean lesion volume in the three treatment groups is shown in Fig. 2. The %HLV for the saline- and PNA-treated groups do not differ before the first treatment at 0.5 hours (P = 0.26), but then the lesion volumes diverge and rapidly become different as soon as 1 hour after MCAO (Fig. 2). The %HLV values in the albumin- and PNA-treated rats are similar before treatment (P = 0.30), but the albumin group has a significantly larger lesion volume than the PNA group at the latest time point of 4 hours after MCAO (P = 0.017). The growth of the lesion is suppressed markedly in the PNA group in contrast to the saline and albumin groups.
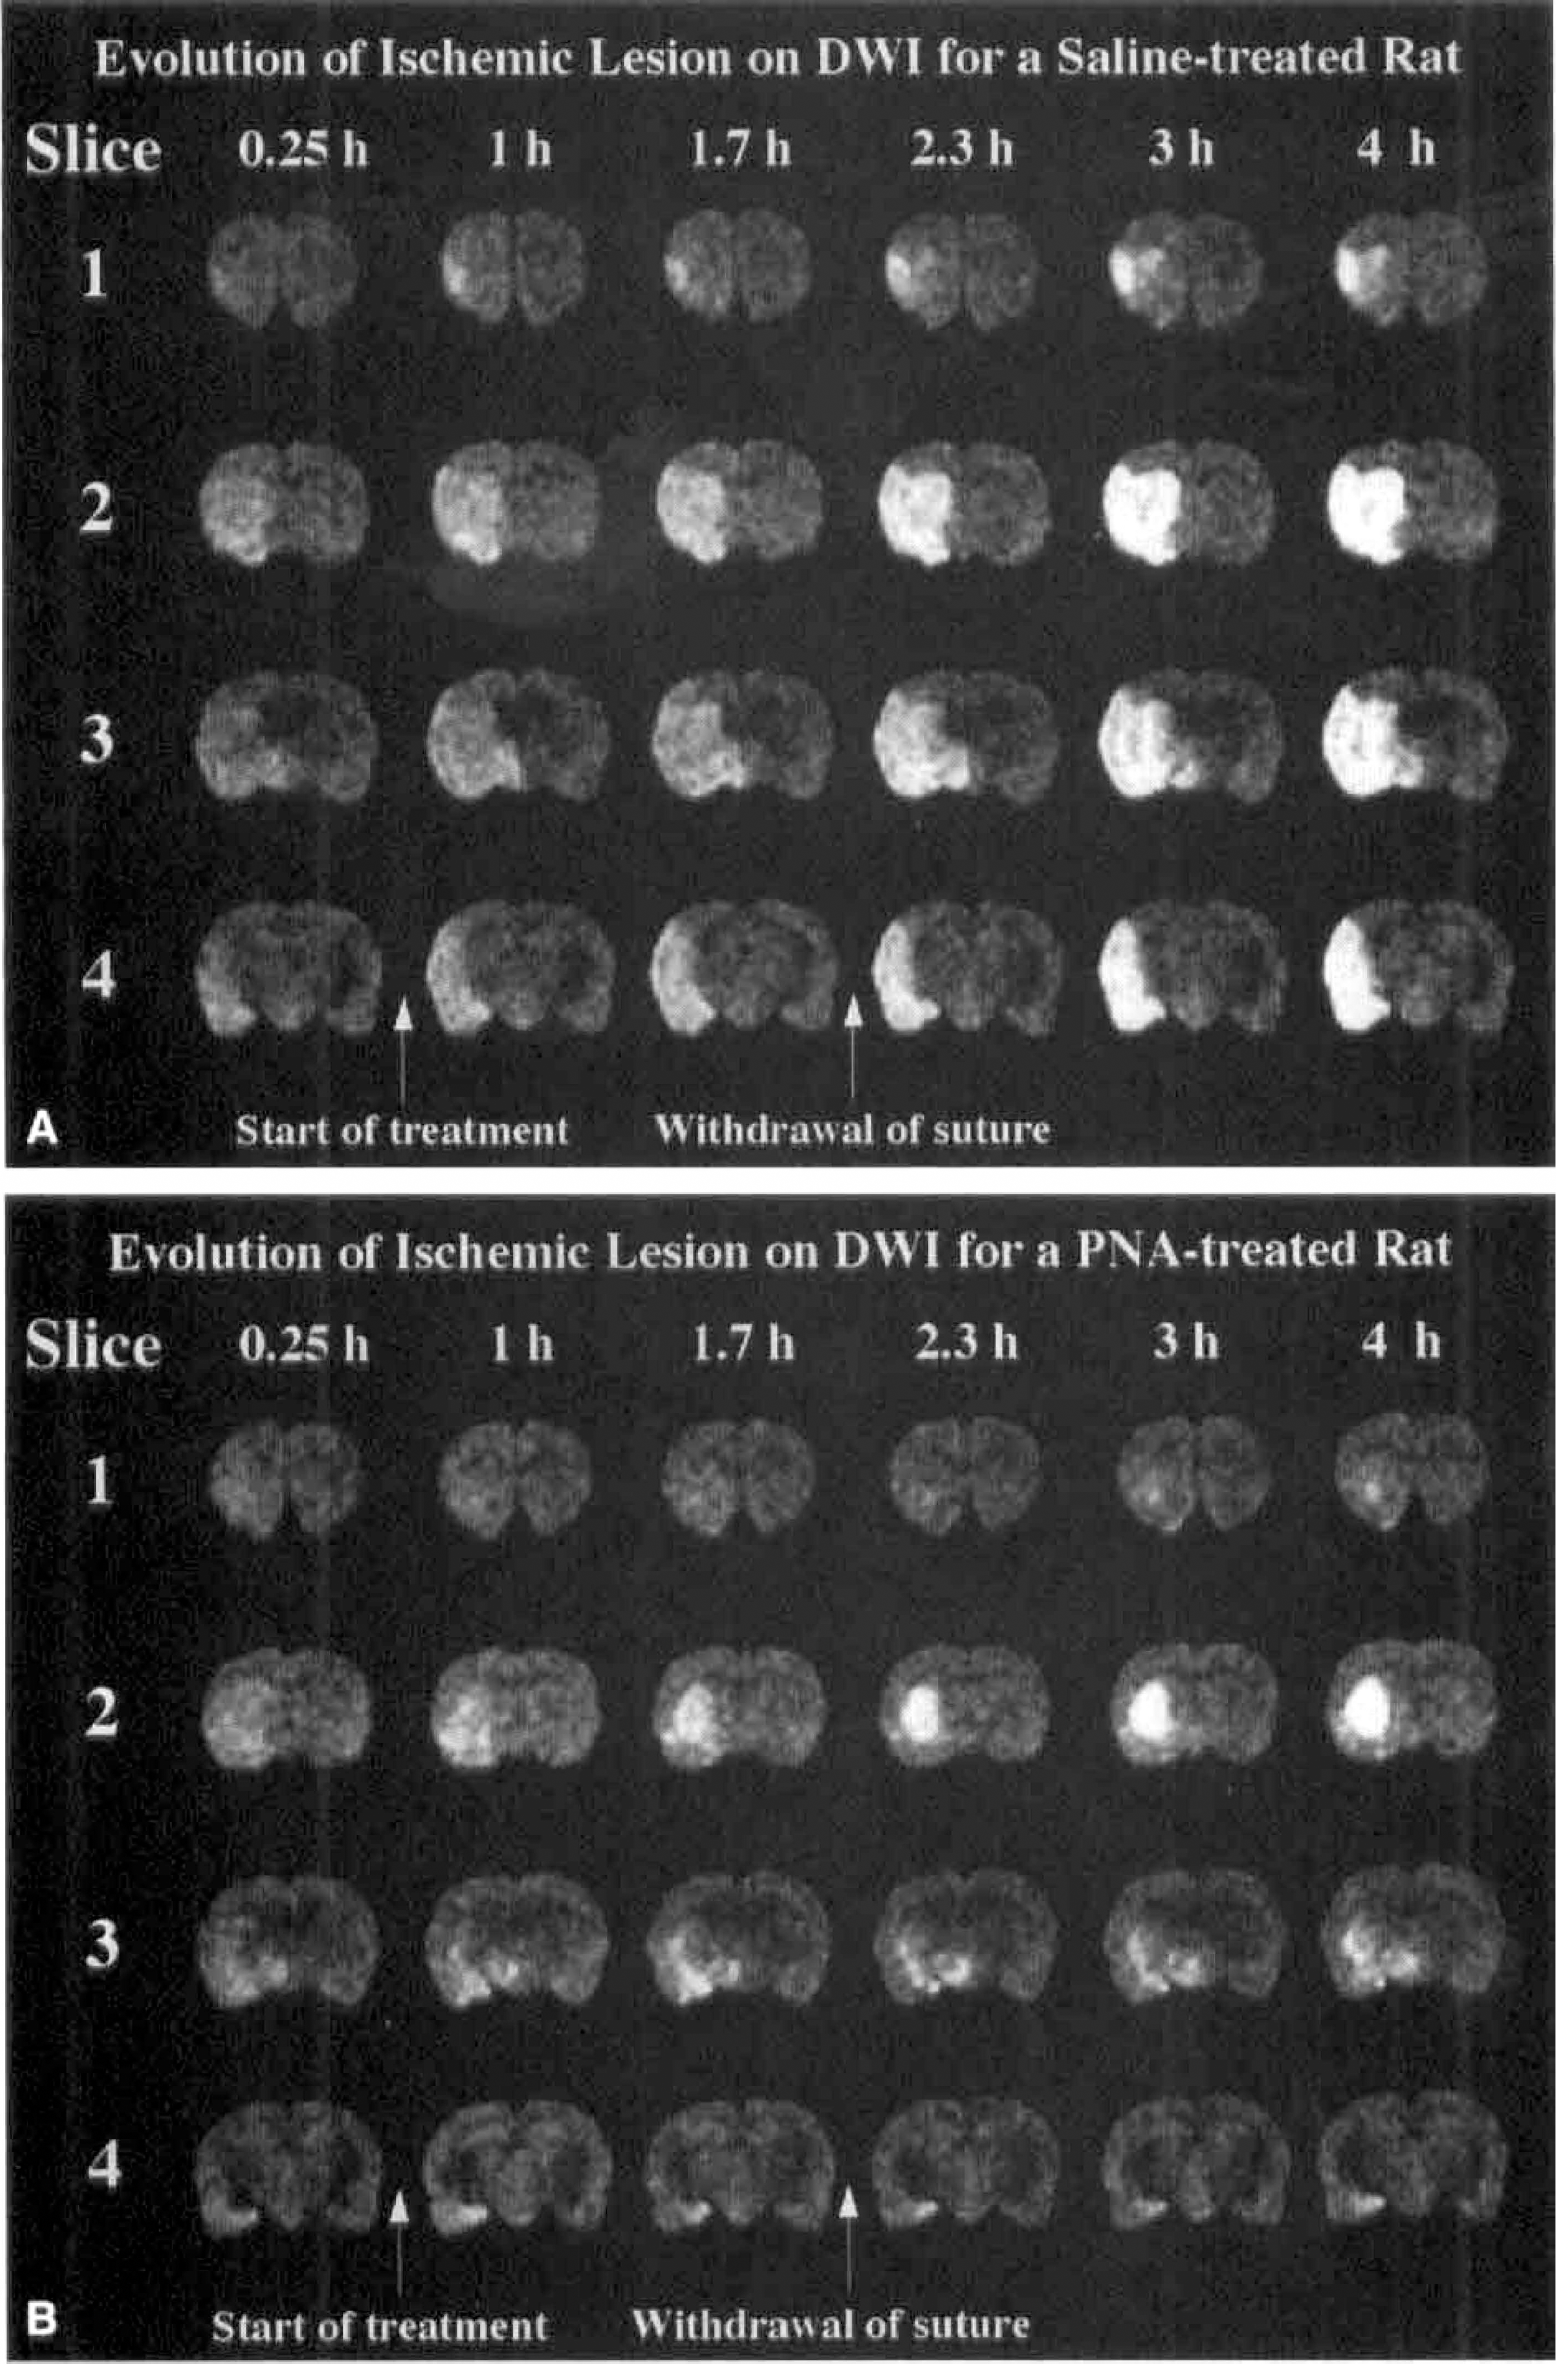
Diffusion-weighted images of four slices are shown for representative rats in the saline-treated
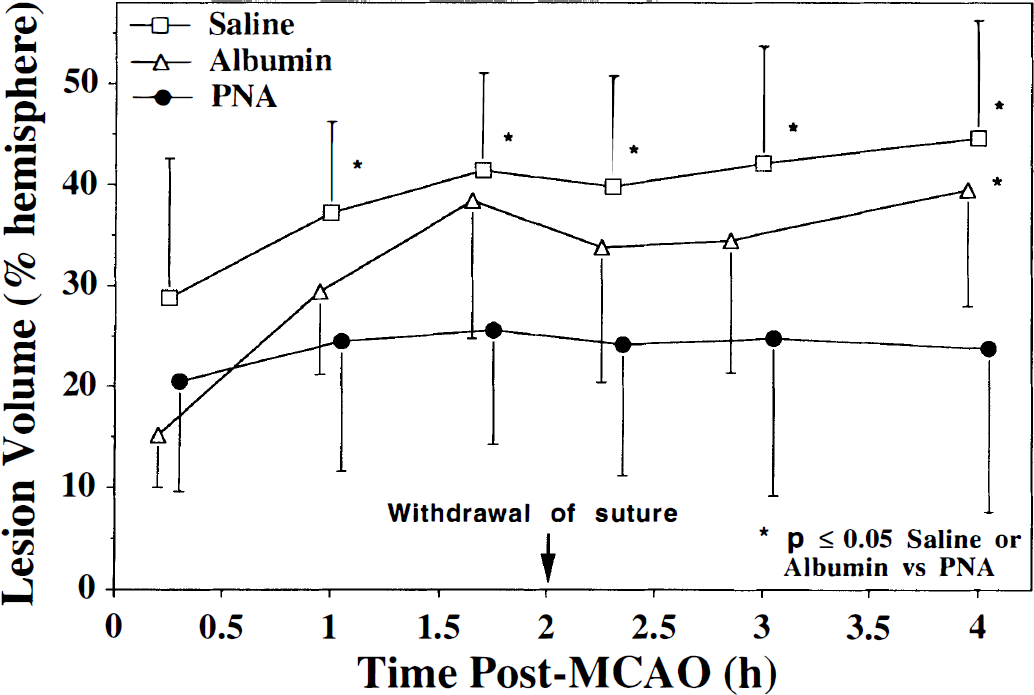
The temporal evolution of the percent hemispheric lesion volume (mean ± SD), as measured by diffusion-weighted imaging, is presented for saline-, albumin-, and PNA-treated rats. A hyperintensity greater than 1 SD of the contralateral signal intensity was used to define the ischemic lesion. The lesion volumes before the initial treatment at 0.5 hours are not significantly different (P = 0.26) between the saline and PNA groups, but as soon as 1 hour after MCAO, the lesion volumes deviate significantly. The lesion grows markedly over the initial 2 hours in the saline group, whereas the growth of the lesion in the PNA group is markedly suppressed. The lesion in the albumin-treated rats also grows within the first 2 hours after MCAO, but it is not significantly different in size from the PNA group until the 4-hour time point. *P < 0.05 between saline or albumin versus PNA.
Table 2 summarizes the %HLV at 4 hours after MCAO. The lesion volumes in the PNA-treated animals are significantly smaller than in the saline- or albumin-treated rats. The lesion volumes at 4 hours did not differ significantly between the saline and albumin groups. Interestingly, the final mean %HLV derived from the DW imaging measurements at 4 hours after MCAO agreed well with that obtained by TTC at 24 hours after MCAO for the saline- and albumin-treated groups (Table 2), which is in agreement with the good correlation between TTC and DW imaging observed by Minematsu and others (1992) in control animals with 3 hours of ischemia. On the other hand, the %HLV from the TTC of the PNA-treated group is smaller than that measured from DW imaging and demonstrates a marked decrease in the volume of ischemic-reperfusion injury between 4 hours and 24 hours after MCAO in the PNA-treated rats.
The ADC values for the normal contralateral hemisphere were similar for all three treatment groups, as were the ADC values in the ischemic regions. The ADC values were (0.70± 0.07) × 10−3, (0.73 ± 0.02) × 10−3, and (0.71 ± 0.03) × 10−3 mm2/s at 15 minutes after MCAO and (0.70 ± 0.05) × 10−3, (0.72 ± 0.02) × 10−3, and (0.73 ± 0.02) × 10−3 mm2/s at 4 hours after MCAO in the contralateral hemisphere of the saline-, albumin-, and PNA-treated rats, respectively. Since the ADC is a function of temperature, this result implies that brain temperature was not influenced by treatment (Hasegawa et al., 1994). In ipsilateral areas, the mean ADC values in ischemic tissue were reduced to (0.48 ± 0.06) × 10−3, (0.52 ± 0.02) × 10−3, and (0.49 ± 0.04) × 10−3 mm2/s at 15 minutes after MCAO and (0.45 ± 0.07) × 10−3, (0.46± 0.05) × 10−3, and (0.49 ± 0.04) × 10−3 mm2/s at 4 hours after MCAO in the saline-, albumin-, and PNA-treated rats, respectively.
Unlike the DW images, the T2-weighted images (not shown) do not delineate the area of the ischemic lesion at the early time points after MCAO. Few abnormal hyperintensities were observed on the T2-weighted images before reperfusion. However, most animals did show significant hyperintensities on T2-weighted images immediately after reperfusion. The T2-weighted intensity, when present within the lesion, increased throughout the remainder of the reperfusion period in parallel with the development of vasogenic edema. In agreement with other reports (Minematsu et al., 1992), the areas of abnormality on the T2-weighted images at 4 hours were less conspicuous and were underestimating the size of the ischemic lesion relative to DW imaging.
Perfusion-weighted imaging
To demarcate the area of brain that is affected by MCAO, the ipsilateral area experiencing a bolus delay of 2 seconds or more was measured on a single slice over the 4 hours after MCAO (Fig. 3). The affected region comprises about 55% to 65% of the hemisphere and is similar for all three groups. After the suture is withdrawn from the origin of the MCA, the area with a bolus delay decreases to about 10% to 20% of the hemisphere. The similarity of the area of bolus delay within the three treatment groups confirms the reproducibility of the suture model of MCAO presented in this study. In addition, the bolus delays within these areas were similar and averaged 5.8 ± 1.0, 5.4 ± 1.0, and 5.1 ± 1.1 seconds for the saline-, albumin-, and PNA-treated rats, respectively, during the initial 2 hours after MCAO. The lack of a significant bolus delay after withdrawal of the suture signified that the origin of the MCA had been reopened properly.
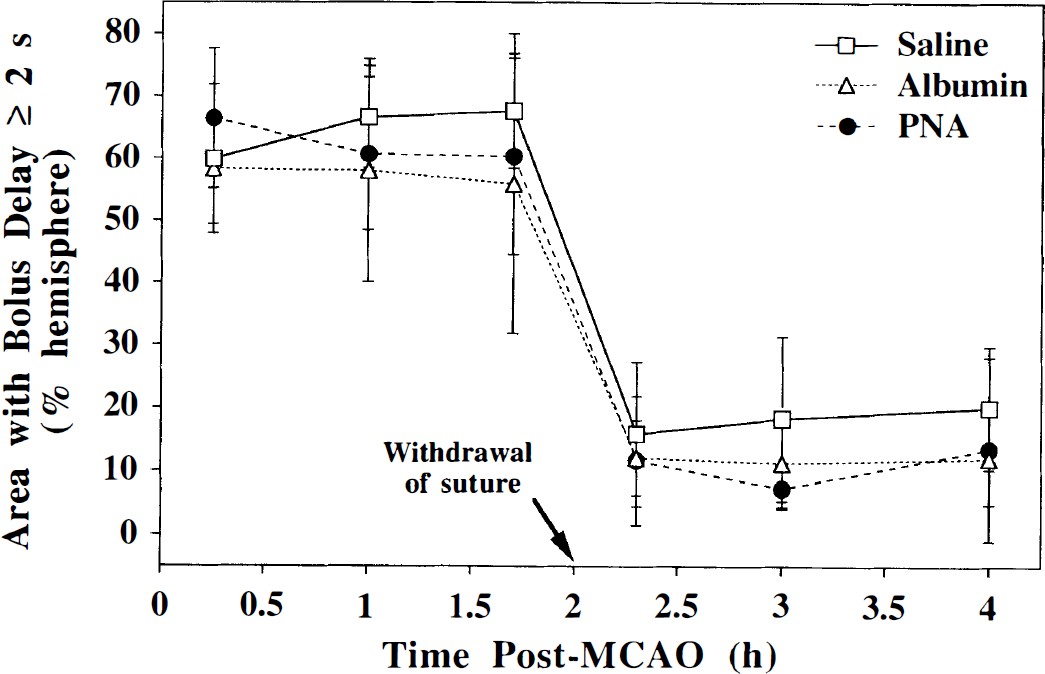
The percent hemispheric area of brain that exhibits a contrast bolus delay of 2 seconds or more in the perfusion-weighted images of a single slice corresponding to the level of the caudoputamen in the saline-, albumin-, and PNA-treated rats. Occlusion of the middle cerebral artery perturbs the cerebral hemodynamics over a similar area in all three treatment groups. As expected, the area of bolus delay decreases markedly after the withdrawal of the occluding suture.
Table 3 presents a single-slice comparison of the hemispheric area that has perturbed hemodynamics, as measured by a bolus delay of 2 seconds or more on the PW images, with the hemispheric lesion area on DW imaging during the initial 2 hours while the suture is occluding the origin of the MCA. Interestingly, the area with perturbations in perfusion is larger than the lesion area on DW imaging at 0.25 hours after MCAO in all three treatment groups, but this mismatch between perfusion and diffusion decreases as the ischemic lesion evolves over time. By the 1.7-hour time point, the DW imaging lesion area has matched the PW imaging lesion area in both the saline- and albumin-treated groups whereas, there is still a mismatch in the PNA-treated group. The diffusion-perfusion mismatch at the early time point reflects the fact that a portion of the original area with perturbed hemodynamics remains above the perfusion threshold for changes in water diffusion. As time progresses, some of these hemodynamically challenged areas of brain are no longer able to sustain their energy stores and succumb to cellular swelling, which is subsequently seen as hyperintensity on the DW images. Transient depolarizations in the periinfarct zone are an additional stress that is likely to contribute to the evolution of the infarct (Busch et al., 1996). Mismatches in PW and DW images have been observed in stroke patients (Sorenson et al., 1996) and in a rat MCAO model (Quast et al., 1993).
A comparison of the area that shows a perturbation of hemodynamics on perfusion-weighted imaging with the lesion area measured by diffusion-weighted imaging during the initial 2 hours after middle cerebral artery occlusion on a single slice
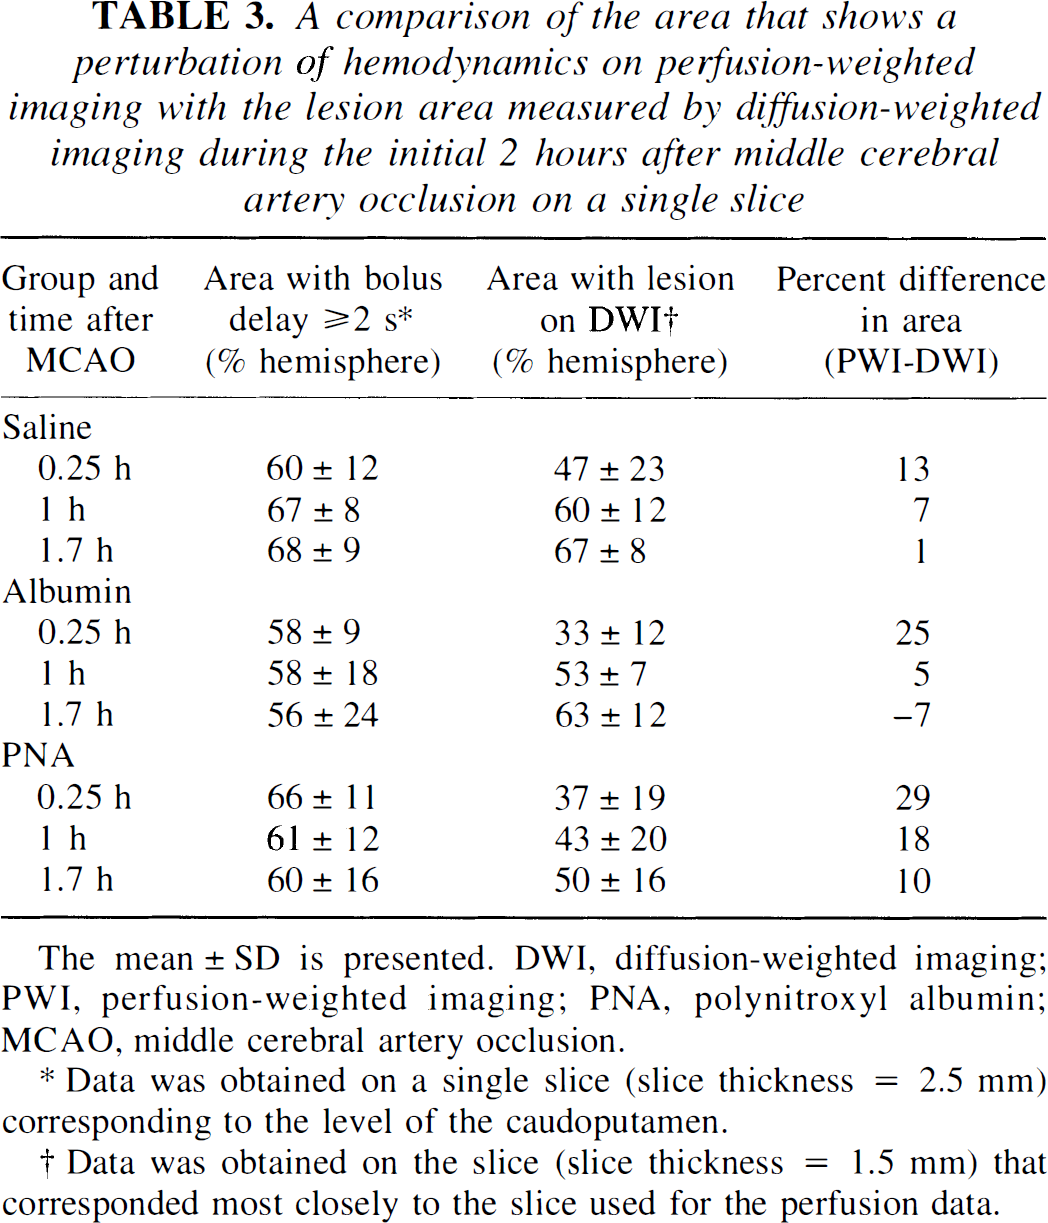
Data was obtained on a single slice (slice thickness = 2.5 mm) corresponding to the level of the caudoputamen.
Data was obtained on the slice (slice thickness = 1.5 mm) that corresponded most closely to the slice used for the perfusion data.
Even though the area of the brain that has a bolus delay is similar for all three treatment groups (Fig. 3), the actual amount of blood passing through the affected region may not necessarily be the same. The BPR is a semiquantitative measure of the perfusion deficit in the stroked ipsilateral hemisphere relative to the presumably normal contralateral hemisphere. The time course of the BPR during the 4 hours after MCAO is shown in Fig. 4 for the ipsilateral basal ganglia and cortex of a single slice in the three treatment groups. The BPR immediately after insertion of the suture, but before any treatment (i.e., at 0.25 hours), is reduced and is not significantly different between the treatment groups for either the basal ganglia or the cortex. However, by 1.7 hours after MCAO, the BPR has decreased to a larger extent in the saline group than in the PNA group. The perfusion status of the albumin group is not significantly different than the PNA group during the initial 2 hours after MCAO. As expected during the reperfusion phase, the BPR increases immediately after withdrawal of the occluding suture in all cases. The PNA-treated animals demonstrate BPR values closer to 1 after reperfusion, reflecting an improved status of perfusion in the ipsilateral hemisphere that is similar to that found in the normal contralateral hemisphere. On the other hand, the saline-treated rats have BPR values well below 1, which implies that perfusion is poor during reperfusion. The mean BPR values for the 2 hours before and 2 hours after withdrawal of the suture are summarized in Table 4. The PNA-treated group has significantly better perfusion than the saline-treated group in both the cortex and the basal ganglia during ischemia and reperfusion. In comparison with the albumin-treated group, the PNA group has significantly better perfusion in the basal ganglia only during the 2 hours after withdrawal of the suture. The albumin group displays higher overall perfusion than the saline group in the cortex but not in the basal ganglia (Table 4).
The bolus peak ratios∗ averaged over either the initial 2 hours of middle cerebral artery occlusion or the 2 hours after the withdrawal of the suture from the origin of the middle cerebral artery†
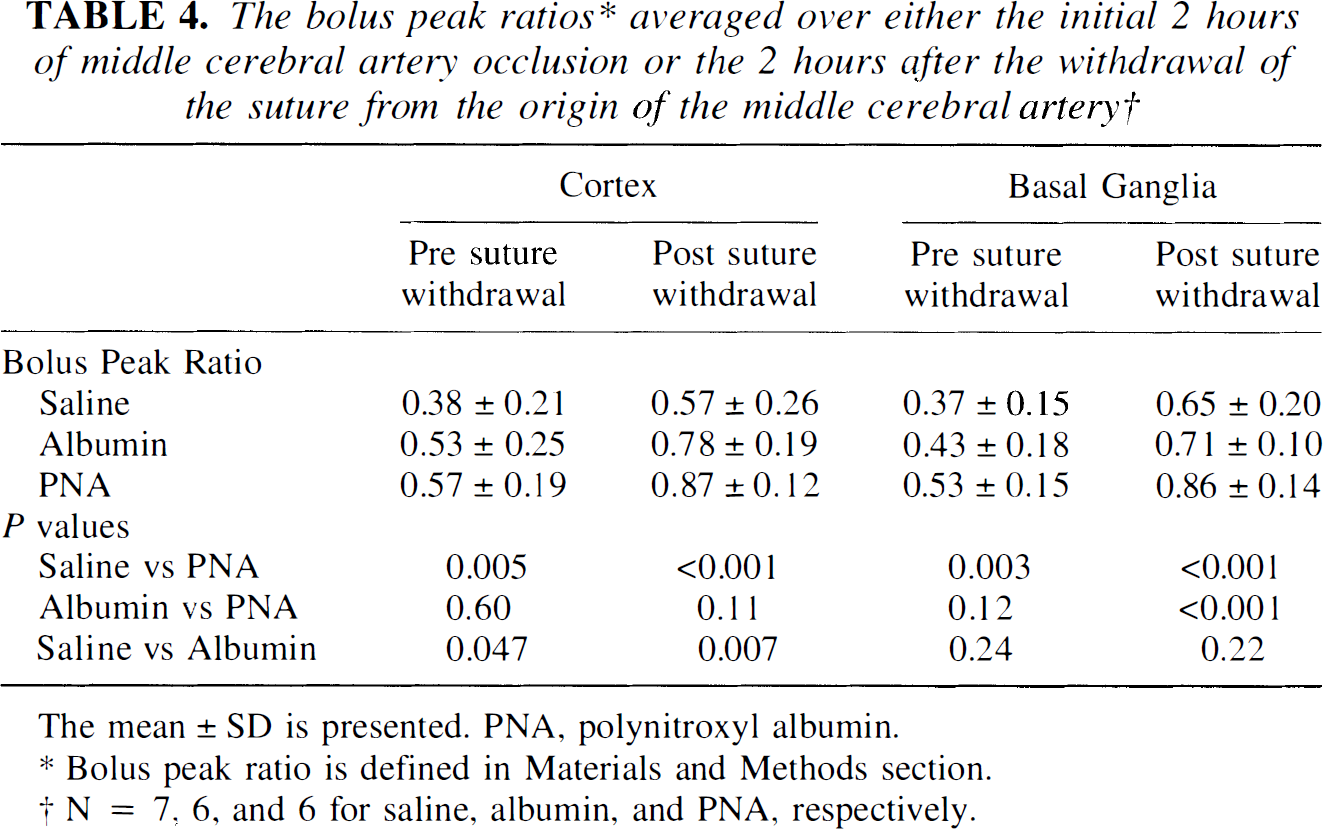
Bolus peak ratio is defined in Materials and Methods section.
N = 7, 6, and 6 for saline, albumin, and PNA, respectively.
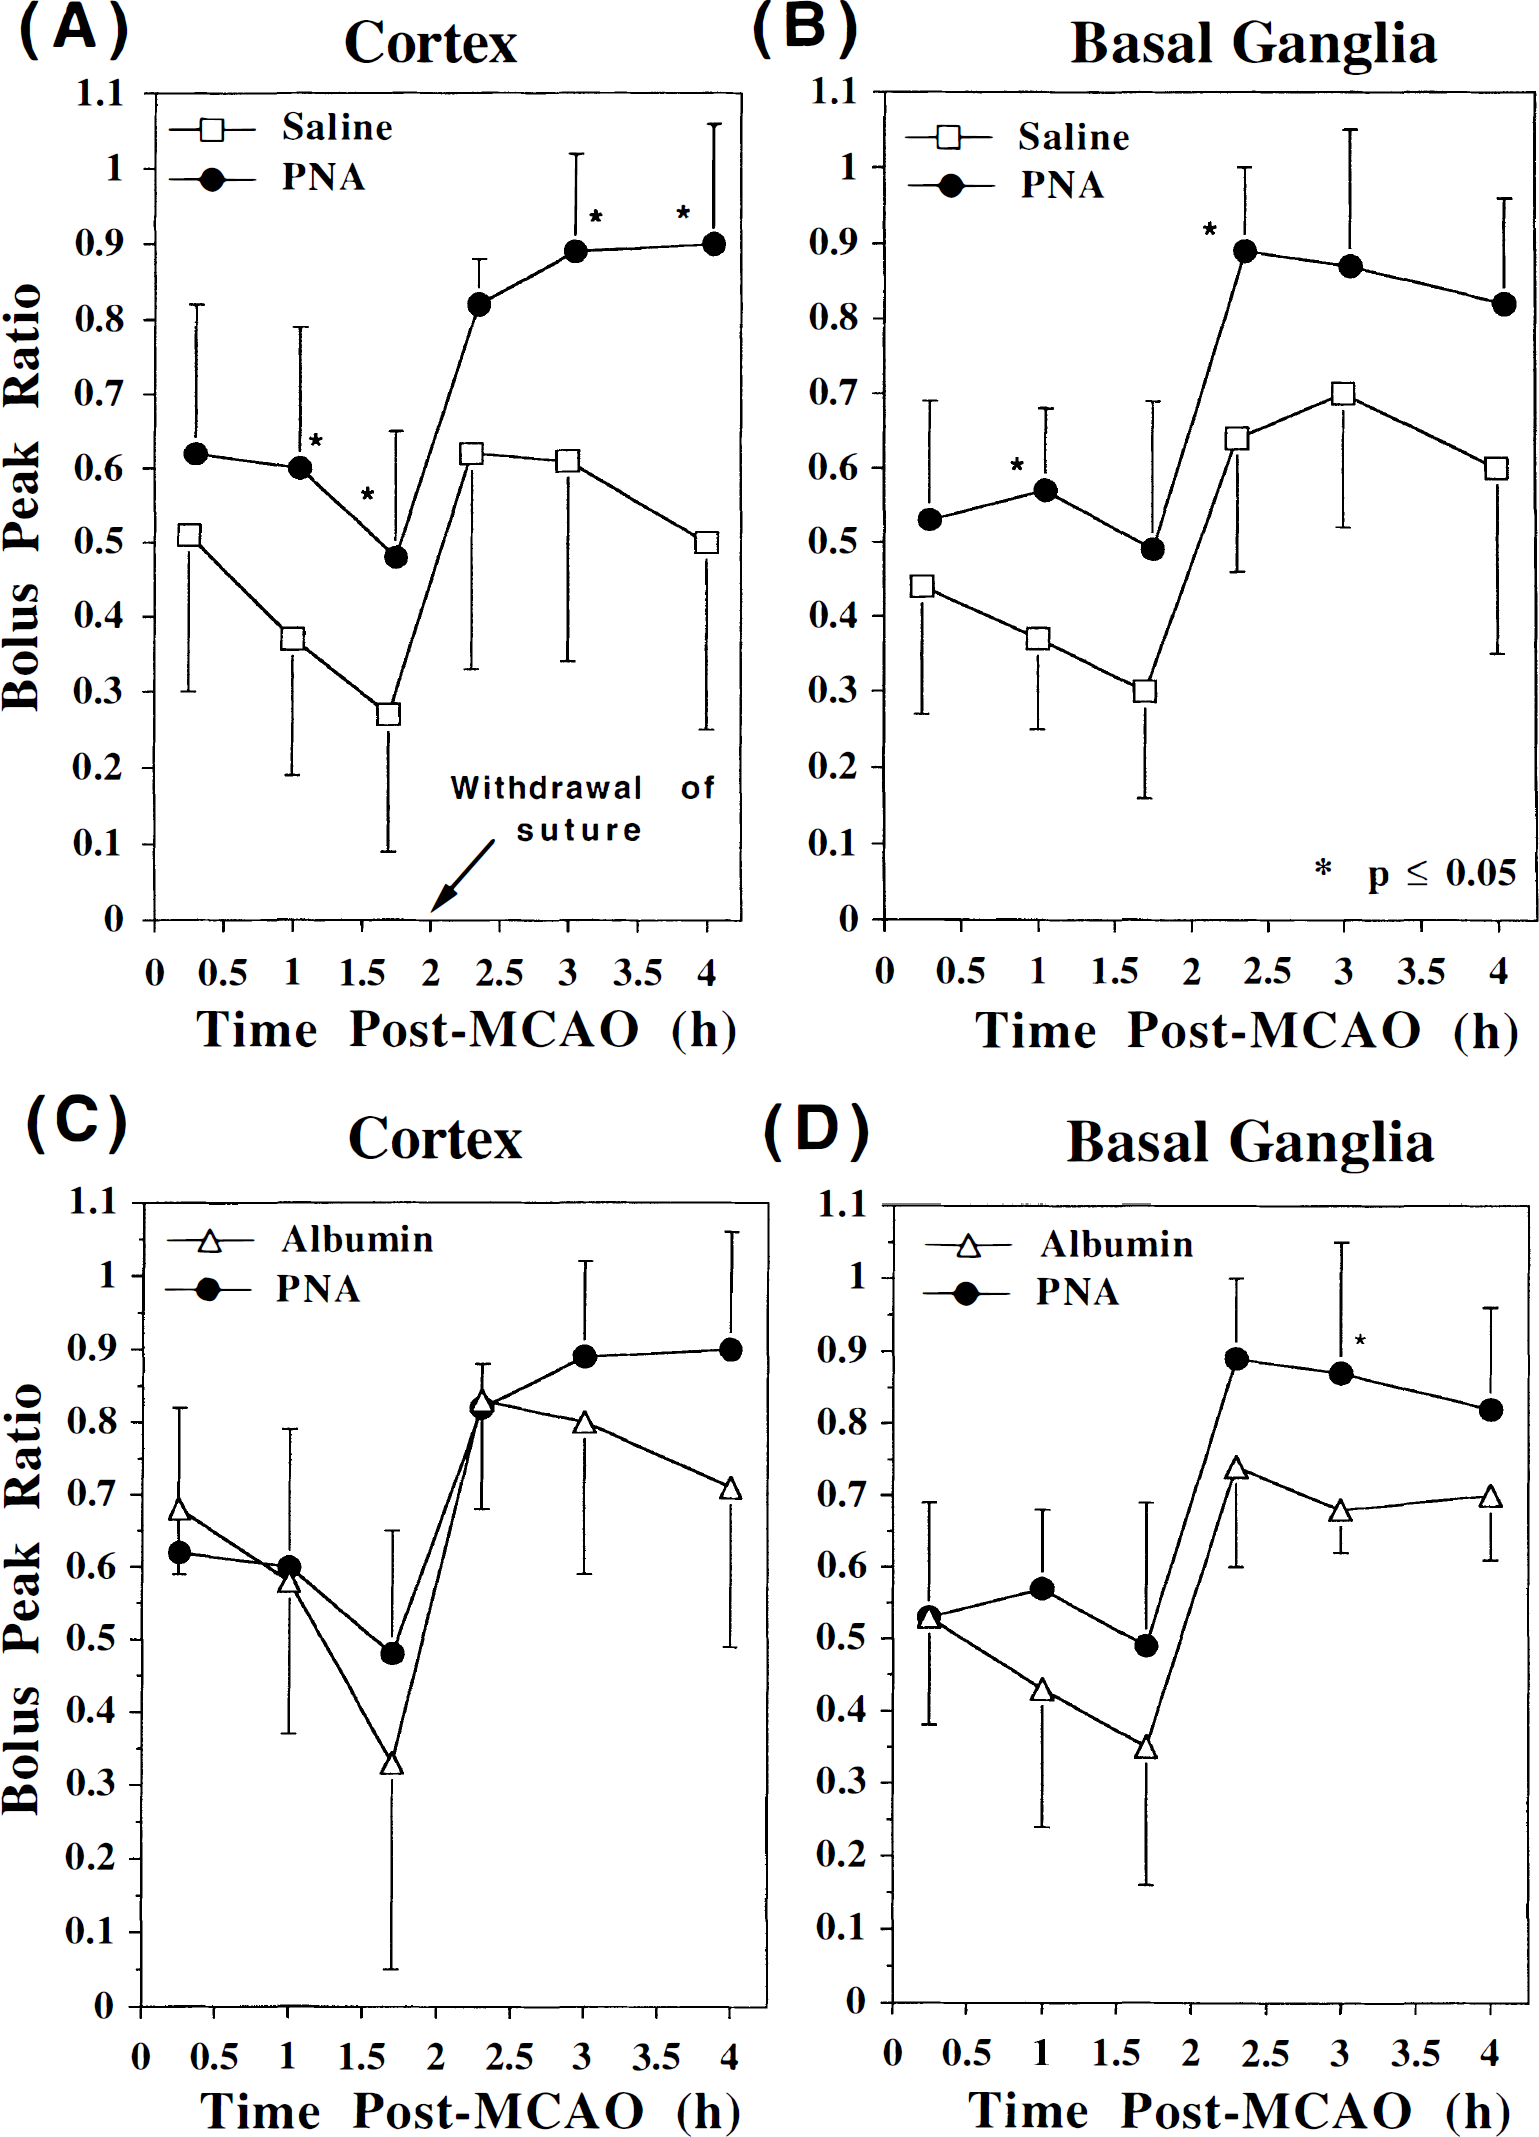
The bolus peak ratio (mean ± SD) in the ipsilateral cortex (saline and PNA
The BPR over the 4 hours after MCAO in the basal ganglia and cortex were combined and averaged to get an overall parameter for the degree of perfusion during the MRI measurements. Fig. 5 illustrates the good correlation between the infarct volume on the 4-hour DW images and the overall perfusion during the 4 hours after MCAO, and demonstrates the importance of the level of perfusion in determining the final lesion volume in all three treatment groups.
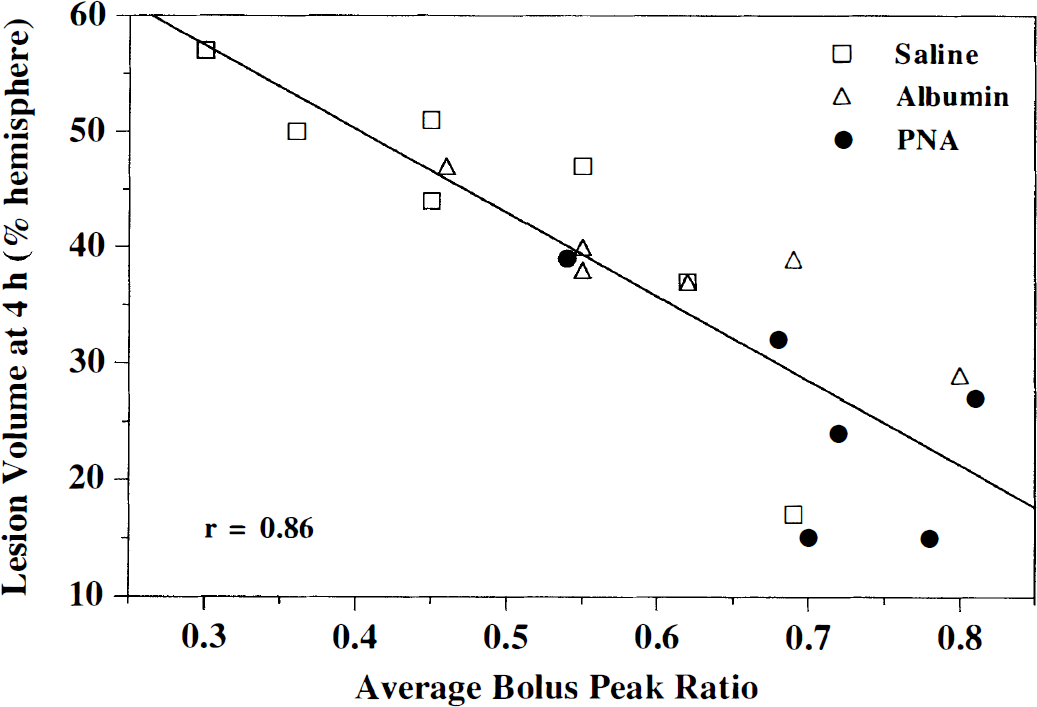
Correlation of the percent hemispheric lesion volume assessed by diffusion-weighted imaging at 4 hours after MCAO with the bolus peak ratio averaged over the entire 4 hours after MCAO. Poorer perfusion (i.e., lower average bolus peak ratios) correlates well with larger infarcts.
DISCUSSION
Perfusion and diffusion-weighted MRI are able to monitor the underlying hemodynamics and the evolution of an ischemic lesion during ischemia and reperfusion. In our study of transient focal cerebral ischemia in the rat, the administration of PNA was shown to reduce the size of the ischemic lesion relative to saline- and albumin-treated rats, as measured by DW imaging at 4 hours after MCAO and by TTC staining at 24 hours after MCAO (Fig. 2; Table 2). By using DW imaging to noninvasively follow the progression of the ischemic lesion, it became clear that the amelioration in the PNA-treated group was occurring before removal of the occluding suture. Both the saline- and albumin-treated groups had significantly larger lesion volumes at 1.7 hours than at 0.25 hours after MCAO, whereas the growth of the lesion in the PNA group was markedly suppressed over this time period. In addition, there was a substantial decrease in %HLV between the 4-hour DW imaging-derived lesion volume and the 24-hour TTC-derived lesion volume in the PNA group (Table 2). The cortex was spared to a greater extent than the subcortical structures of the brain (Fig. 1).
The lesion volumes, as measured on the DW images, at the first time point after MCAO (i.e., 0.25 hours) were not significantly different between the three treatment groups, but part of the improved outcome of the PNA group, relative to the saline group, could result from its smaller ischemic lesion immediately after MCAO. However, this argument does not hold when comparing the PNA group to the albumin group, since the albumin group started off with a slightly smaller lesion. Furthermore, the area with a bolus delay on the PW images was similar for all three groups (Fig. 3) and the initial BPR were not significantly different among the groups (Fig. 4), thereby demonstrating that the perfusion deficits were alike among all three groups used in this study.
Perfusion-weighted imaging performed before and after withdrawal of the occluding suture provides insight into the marked decrease of the ischemic lesion volume in the PNA-treated group. The PNA group demonstrated larger BPR and, hence, better perfusion than the saline-treated group (Fig. 4; Table 4), even during MCAO. In particular, the BPR in the saline- and albumin-treated rats decreased to a large extent between 0.25 hours and 1.7 hours after MCAO, possibly resulting from plugging up of the microvascular bed, in contrast to the PNA-treated rats. This observation suggests that perfusion was improved as a result of PNA and that this improved perfusion may be directly responsible, at least in part, for the reduced size of the ensuing infarct (Fig. 5). Even after removal of the occluding suture, the perfusion in the ischemic territory does not rebound to that found on the normal contralateral side, and thus the BPR values remain below 1. This is particularly evident for the saline-treated group, which has a BPR of only ∼0.6 during the “reperfusion” phase, whereas the BPR of ∼0.9 in the PNA-treated group demonstrates an almost normal degree of perfusion (Table 4). Similarly, others have shown that treatment with albumin-bound superoxide dismutase results in an improved recovery of CBF after reperfusion in a model of global brain ischemia in rats (Takeda et al., 1993). Since the perfusion deficits were not as severe in the PNA group before reperfusion, it is difficult in this study to assess the degree of protection invoked by PNA against reperfusion injury specifically. Further studies with PNA given first at reperfusion or at later time points are needed to see if delayed treatment with PNA could improve outcome such as that observed with the spin trap α-phenyl-N-tert-butyl nitrone (Zhao et al., 1994; Folbergrová et al., 1995).
When following the BPR over time, it is assumed implicitly that the perfusion in the contralateral side remains relatively constant, independent of either stroke evolution in the ipsilateral hemisphere or drug treatment. This assumption is supported by the fact that the actual minimum signal intensity during the passage of the bolus of contrast in the contralateral hemisphere is within error for all six time points during ischemia-reperfusion (data not shown) and is within error for all three treatment groups; namely, absolute minimum signal intensities of 59 ± 10%, 56 ± 9%, and 59 ± 8% for the saline-, albumin-, and PNA-treated groups are measured in the contralateral basal ganglia throughout the 4 hours of ischemia-reperfusion. In addition, others have shown that the CBF, as measured by 14C iodoantipyrine autoradiography, in the contralateral hemisphere is not significantly different between 30 minutes and 2 hours of ischemia in rats (Kohno et al., 1995).
In agreement with our observations of improved hemodynamics in the PNA-treated group, nitroxides have been shown to have vasodilatory actions in the isolated rat heart (Konorev et al., 1995). One potential mechanism is the dismutation of superoxide by the nitroxides of PNA, which may modulate vasoreactivity by influencing the balance between superoxide and nitric oxide (Katusic, 1996). Another possibility is that if PNA could reduce the levels of superoxide and prevent the deterioration of nitric oxide, then microvascular hypoperfusion may be prevented, since nitric oxide can inhibit platelet aggregation and leukocyte adhesion (Iadecola, 1997). In addition, the albumin-treated group has perfusion parameters that are significantly better than the saline-treated group in the cortex (Table 4), and thus some of the hemodynamic improvements of PNA may be related to its albumin component (Matsui et al., 1993). Therefore, the improvement in perfusion may result, in part, from hypervolemic hemodilution. Since PNA remains in the vascular space, a mechanism involving improved hemodynamics is expected. In fact, endothelial cells in the brain can produce hydroxyl free radicals after anoxic injury, and this suggests that the cerebral microvasculature may be an important source of deleterious free radicals (Kumar et al., 1996). Our results support a hemodynamic protective effect of PNA, but we cannot rule out a contribution by neuroprotective mechanisms, since free radicals may diffuse freely throughout the intravascular and extravascular space.
The use of MRI to follow differences in the progression of an ischemic lesion with therapeutic intervention has several advantages over traditional techniques such as histologic examination. Because MRI is noninvasive, the evolution of the ischemic lesion can be monitored in a single animal from the immediate onset of the lesion and onward. This is in contrast to traditional histologic methods, which need a separate group of animals for each time point. In addition, MRI can investigate perfusion throughout the brain with good spatial resolution. Therefore, the degree of the perfusion deficit and recovery can be monitored throughout the ischemiareperfusion episodes, and this can be directly related to the evolving infarct, as viewed with DW imaging.
In conclusion, the combined use of DW and PW MRI permits a thorough investigation of therapeutic drugs for stroke. In this study of transient focal cerebral ischemia in the rat, PNA was shown to reduce the ischemic lesion volume observed on DW imaging at 4 hours after MCAO (P = 0.016) and on TTC-stained slices at 24 hours after MCAO (P < 0.001). Diffusion-weighted imaging demonstrated that there was an improvement in lesion volume as early as intraischemia, that is, before removal of the occluding suture. Perfusion measurements with bolus tracking suggest that an enhancement of perfusion in the stroked hemisphere was one contributing mechanism to the improved outcome of rats treated with PNA.
Footnotes
Acknowledgements
The authors thank Maj Hedehus and Kim Butts for the isotropic diffusion pulse sequence.