
Abstract
There is evidence that the metabolic responses to afferent and efferent nervous activity are dissociated at sites of neuronal excitation in brain. Whether efferent activity follows afferent activity depends on the responsiveness of postsynaptic neurons, which in turn depends on the summation of excitatory and inhibitory postsynaptic potentials. The afferent activity excites the presynaptic terminals and astrocytes, whereas the efferent activity arises from excitation of the dendrites of projection neurons. Measurements in vivo indicate that primary stimulation, elicited by simple stimuli, gives rise to limited increases of energy metabolism associated with afferent activity. Reports show that a major consequence of afferent activity, in addition to the release of excitatory neurotransmitters from presynaptic terminals and the import of glutamate by astrocytes, is the establishment of rates of blood flow commensurate with increased rates of oxidative energy metabolism associated with efferent activity projecting from the site of activation. Increased flow rates overcome the inherent diffusion limitation of oxygen delivery, while increased rates of glycolysis elevate tissue pyruvate contents, to which oxygen consumption rates are matched. In vivo, neurons in the baseline condition sustain no net import of pyruvate or lactate, and the reported changes of metabolism subserving afferent and efferent activity are additive rather than linked by significant additional transfer of pyruvate or lactate from astrocytes. The dissociation of blood flow changes from efferent activity weakens the identification of functional states by changes of blood flow alone. It raises the possibility that uncoupling of flow from oxidative metabolism occurs at sites of low efferent activity, such that dissociations of flow and glycolysis from oxygen consumption signify imbalances of afferent and efferent activity.
METABOLIC RESPONSES TO NEURONAL EXCITATION
Knowledge about the relation between neuronal activity and energy metabolism in brain tissue is essential to the understanding of brain function. The interactions are likely to be complex and to involve several interrelated factors (Gjedde, 1997). These include the cell types involved in brain activity, the mechanisms that link cellular activity to energy demand, and the mechanisms that link energy demand to the energy supply to the brain.
Two fundamental questions underwrite the current attempts to understand these factors: Is oxygen supply to brain tissue diffusion-limited, such that oxygen extraction is always unidirectional and inversely proportional to blood flow? Is oxidative metabolism in excited neurons regulated by glycolysis in astrocytes through the mediation of glutamate and pyruvate or lactate? The answers depend critically on observations of changes of blood flow, glucose and oxygen consumption, and lactate and carbon dioxide production, during perturbations of brain work. The answers have important consequences for the understanding of the organization of brain function.
Oxidative metabolism is the regular conversion of pyruvate and oxygen to carbon dioxide and water. The brain is a net producer of carbon dioxide, lactate, hydrogen ions, and water, under normal circumstances, and oxidative metabolism accounts for 90% of the breakdown of glucose at steady state (Gjedde, 2001). The fundamental questions arise from numerous older and more recent reports of the observation that oxidativemetabolism's share of total brain metabolism declines significantly when neuronal excitation perturbs a previous steady state. The mechanism of the decline is unknown but a current theory claims that the decline is the result of aerobic glycolysis in astrocytes exposed to excitatory neurotransmission (Magistretti et al., 1999). The theory further posits that the lactate generated by the glycolysis in astrocytes eventually undergoes oxidation in neurons in proportion to the total work imposed by the stimulation (Sibson et al., 1998). The theory predicts that the interaction of astrocytic and neuronal metabolic pathways generates both an earlier phase of accumulation of lactate and a later phase of depletion of lactate, the latter the result of increased oxidation in neurons and increased export across the blood-brain barrier.
The decline of oxidative metabolism's share of total metabolism is transient, but the theory specifies no duration of the non–steady state, nor a rate of return to a new steady state. Recent experiments show that the duration of the transient decline of the ratio between oxygen and glucose metabolism (the so-called oxygen–glucose index) varies greatly among different stimuli. This variation could be an important clue to the differential processing of different stimuli.
DEPOLARIZATION, GLUTAMATE–LACTATE EXCHANGE, AND BOLD RESPONSE
Two mechanisms purport to regulate the distribution of energy metabolism among different cell types in the brain. One, the canonical sodium conductance mechanism (Hodgkin and Huxley, 1952) explains how changes of electrochemical gradients across postsynaptic membranes of neurons incur the bulk of the energy expenditure of the working brain (Gjedde et al., 1993; Laughlin et al., 1998). The other, the novel and hypothetical glutamate–lactate exchange mechanism (GLEM) (Sibson et al., 1998; Magistretti et al., 1999), explains how the energy demand of neurons is matched to the release and uptake of excitatory neurotransmitters. The glutamate–lactate exchange mechanism implies a strict compartmentation of the glycolytic and oxidative components of glucose metabolism between two cell types; according to GLEM, total glucose metabolism is the sum of a glutamate-stimulated glycolytic step in astrocytes, which generates 2 molecules of lactate and 2 molecules of ATP from each molecule of glucose, and a depolarization-driven oxidative step in neurons, which generates as many as 36 molecules of ATP from the molecule of glucose originally metabolized to lactate in astrocytes (Shin, 2000). Thus, the key elements of the hypothetical GLEM are the postulates that lactate accumulation during the earlier stage of glycolysis reflects the constraints of the biochemistry of astrocytes, and that lactate depletion during the later stage of oxidation reflects (in part) the constraints of the biochemistry of neurons.
Depending on the viewpoint of the observer, a third mechanism, the diffusion-limited delivery (DILD) of oxygen to brain tissue (Gjedde et al., 1991; Gjedde 1997; Buxton and Frank, 1997), is either an alternative or a supplement to the glutamate–lactate exchange mechanism. The diffusion-limitation is thought to impose a requirement of an excess of blood flow on the regulatory mechanism responsible for the delivery of more oxygen, because the extraction of oxygen is always unidirectional and hence inversely proportional to the rate of the blood flow.
Because DILD is the basis for the use of the blood-oxygenation-level–dependent (BOLD) contrast in magnetic resonance mapping of sites of neuronal excitation, it is a paradox that DILD actually fails to explain the discrepancy between the excessive rise of blood flow and the decline of the oxygen–glucose index in the situations in which the oxygen consumption does not rise. Thus, although GLEM may explain the decline of the oxygen–glucose index when the oxygen consumption rises, it cannot also explain the same discrepancy when the oxygen consumption does not rise. One possibility is that the increase of blood flow is coupled to the increase of glucose consumption during the earlier stage of lactate accumulation, in turn preventing a shortage of oxygen during the later stage of lactate depletion.
Students of these three mechanisms differ about the relative importance they attach to each mechanism. Mintun et al. (2001) take the minimal blood flow changes during moderate hypoxemia to be evidence against the diffusion-limitation of oxygen delivery and also against any late stage of increased oxidation. Buxton et al. (1998) and Friston et al. (2000), conversely, base their modelling of the BOLD response on the existence of DILD. Vafaee and Gjedde (2000) and Gjedde and Marrett (2001), although using estimates of oxygen diffusibility to support the existence of DILD, also take measurements of lactate accumulation to militate against the transfer of pyruvate (either as pyruvate or as lactate) from astrocytes to neurons, and Gjedde and Marrett (2001), in addition, suggest that the earlier stage of elevated rates of blood flow and glycolysis sometimes may be an artifact of the experimental circumstance.
Logothetis et al. (2001) reported significantly higher correlation coefficients for the correlation of the BOLD response to local field potentials than to single-and multi-unit activity in visually stimulated monkeys, implying that the BOLD response is indicative more of the magnitude of the input-driven local field potentials than of the magnitude of output-generating multi-unit activities in a given region. In keeping with the findings of Freeman (1979), Logothetis et al. (2001) report that multi-unit activities often “adapt, returning almost to baseline levels, while local field potential activity [is] always maintained throughout the stimulus presentation.” This observation implies that the BOLD contrast is responsive to activity in regions projecting to the site of the response rather than to the activity of the site projecting to other regions.
The implication is completely consistent with the way observers traditionally regarded local blood flow changes as signs of activity elsewhere (e.g., Pedersen et al., 1997). Mathiesen et al. (1998) reported a dissociation between blood flow changes in cerebral cortex and the frequency of efferent spikes from Purkinje cells undergoing collateral inhibition. Apparently, it is necessary to distinguish between blood flow and BOLD response on one hand and oxygen consumption on the other, if oxygen consumption reflects the projection of the site to other regions. Thus, the links among blood flow changes and rates of glycolysis and oxygen metabolism to different types and phases of stimulation strongly affect the interpretation of cognitive networking, because of the different roles of local field potentials and multi-unit activities in neuronal function.
NEED FOR NEW SYNTHESIS
It is the contention of the present authors that the lack of evidence both of transfer of glucose directly from microvessels to astrocytes and of pyruvate or lactate from astrocytes to neurons places the hypothetical GLEM in considerable doubt and raises the need for an alternative theory with important consequences for the interpretation of functional brain images. Is it possible, as considered by Gjedde and Marrett (2001), that the stages of glycolysis and oxidation could be functionally rather than temporally or anatomically distinguished, the glycolytic step reflecting a state of “stand-by” activation with little postsynaptic depolarization, and the fully activated oxidative step reflecting a state of significant postsynaptic depolarization? The report of Logothetis et al. (2001) introduces the possibility that changes of blood flow and oxygen extraction, observed as changes of the BOLD contrast, reflect afferent rather than efferent activity. This possibility implies that the initial changes of blood flow and glucose consumption are elicited by afferent impulses to a region of excitation, whereas significant changes of oxygen consumption reflect the activation of efferent pathways.
The implication yields the prediction that an artifactually prominent state of glycolysis could be the result of afferent activity of a magnitude to which the neurons and accompanying astrocytes are not habituated. Another deduction is the prediction that the difference between a baseline and a condition of excitation, in terms of blood flow, oxygen or glucose consumption, depends critically on the functional state defining the baseline. If the baseline is in fact a state of stand-by activation, the fully functional activation, in principle, could occur without further change of blood flow but with a substantial increase of oxygen consumption.
CHANGES OF BRAIN ENERGY METABOLISM IN NEURONAL EXCITATION
Most of the energy required for ATP regeneration in the adult mammalian brain arises from the complete oxidation of glucose in the TCA cycle (Sokoloff, 1999). The oxygen–glucose ratio index (OGI), or metabolic ratio, calculated from the theoretical values of the total oxygen and glucose requirements in situations in which glucose metabolism is fully oxidative, is 6. However, on theoretical grounds, judging from the pyruvate and lactate exchange, as well as from the presence of lactate transporters in the brain endothelium, a 5% to 10% lower OGI of close to 5.5 is confirmed in studies of the normal physiologic steady state in vivo. This lower ratio indicates that there is a small exclusively glycolytic contribution to energy production, which lowers the gain of ATP to 34 to 36 mol per mol glucose consumed. The rate of ATP generation provides the simplest definition of the rate of brain energy metabolism and hence of the rate of work performed at steady state, according to the equation,
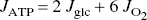
where JATP is the ATP production, Jglc is the glucose consumption, and J o2 is the oxygen consumption. The equation clearly proves that excitation without an increase of oxygen consumption requires little work.
Unfortunately, there are few reports of simultaneous measurements of blood flow and glucose and oxygen consumption in discretely excited regions of the mammalian brain. One reason is the incompatibility of the three measures, glucose consumption measurements taking at least 20 minutes, blood flow and oxygen consumption less than 5 minutes. The majority of reports compare measurements of blood flow with measurements only of oxygen or glucose consumption. Most of these are listed in Table 1, which combines data from previously published studies in conscious humans. On the basis of a qualitative evaluation of the information content, the studies show that the observed responses fall into two categories, depending on the stimulus (Gjedde, 2001), one category including simple (“primary”) somatosensory and visual stimuli with little information content, the other including complex (“secondary”) somatosensory stimuli and motor activity (Fig. 1).
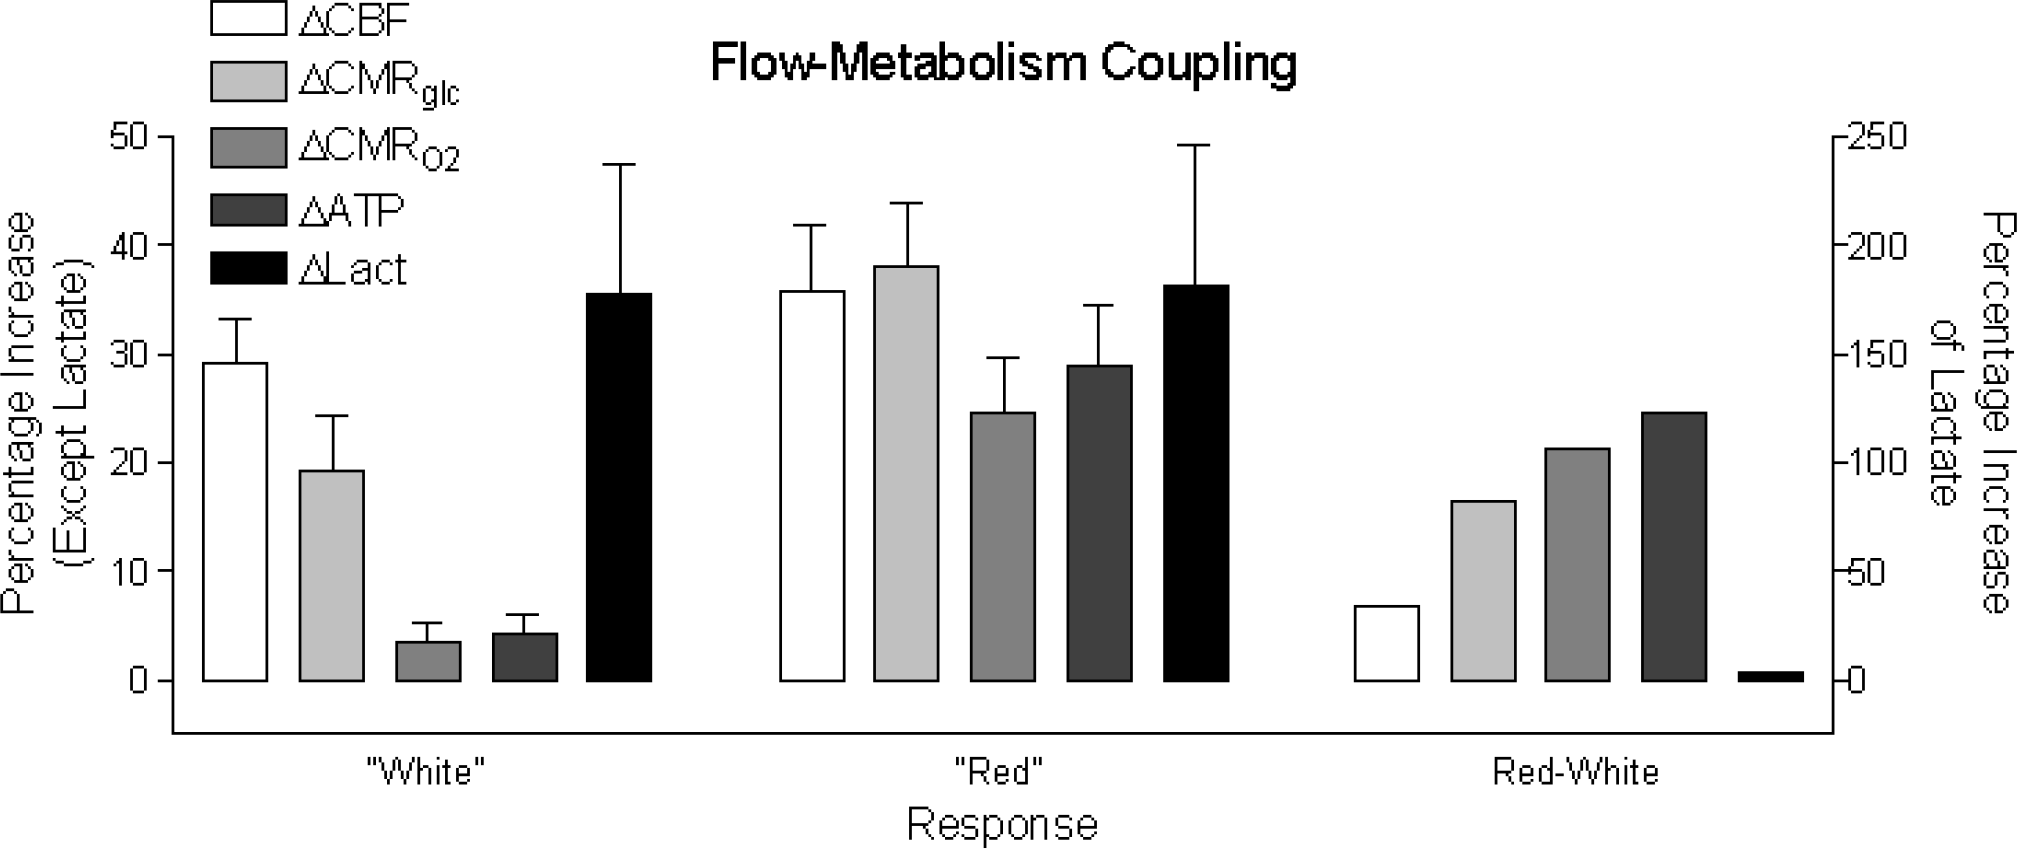
Comparison of red and white metabolic reactivity in the two groups of data shown in Table 1, and subtraction of the white from the red, yielding a third, red-minus-white group. “White” and “red” metabolic activities defined by Collins et al. (1997) as glycolytic and oxidative, respectively. Data are mean ± SEM, pooled from the several PET studies listed in Table 1 (from Gjedde, 2001).
Studies in humans of changes of CBF, CMRglc, and CMRO2, as summarized by Gjedde (2001), and corresponding calculated changes of ATP turnover and pyruvate and lactate generation
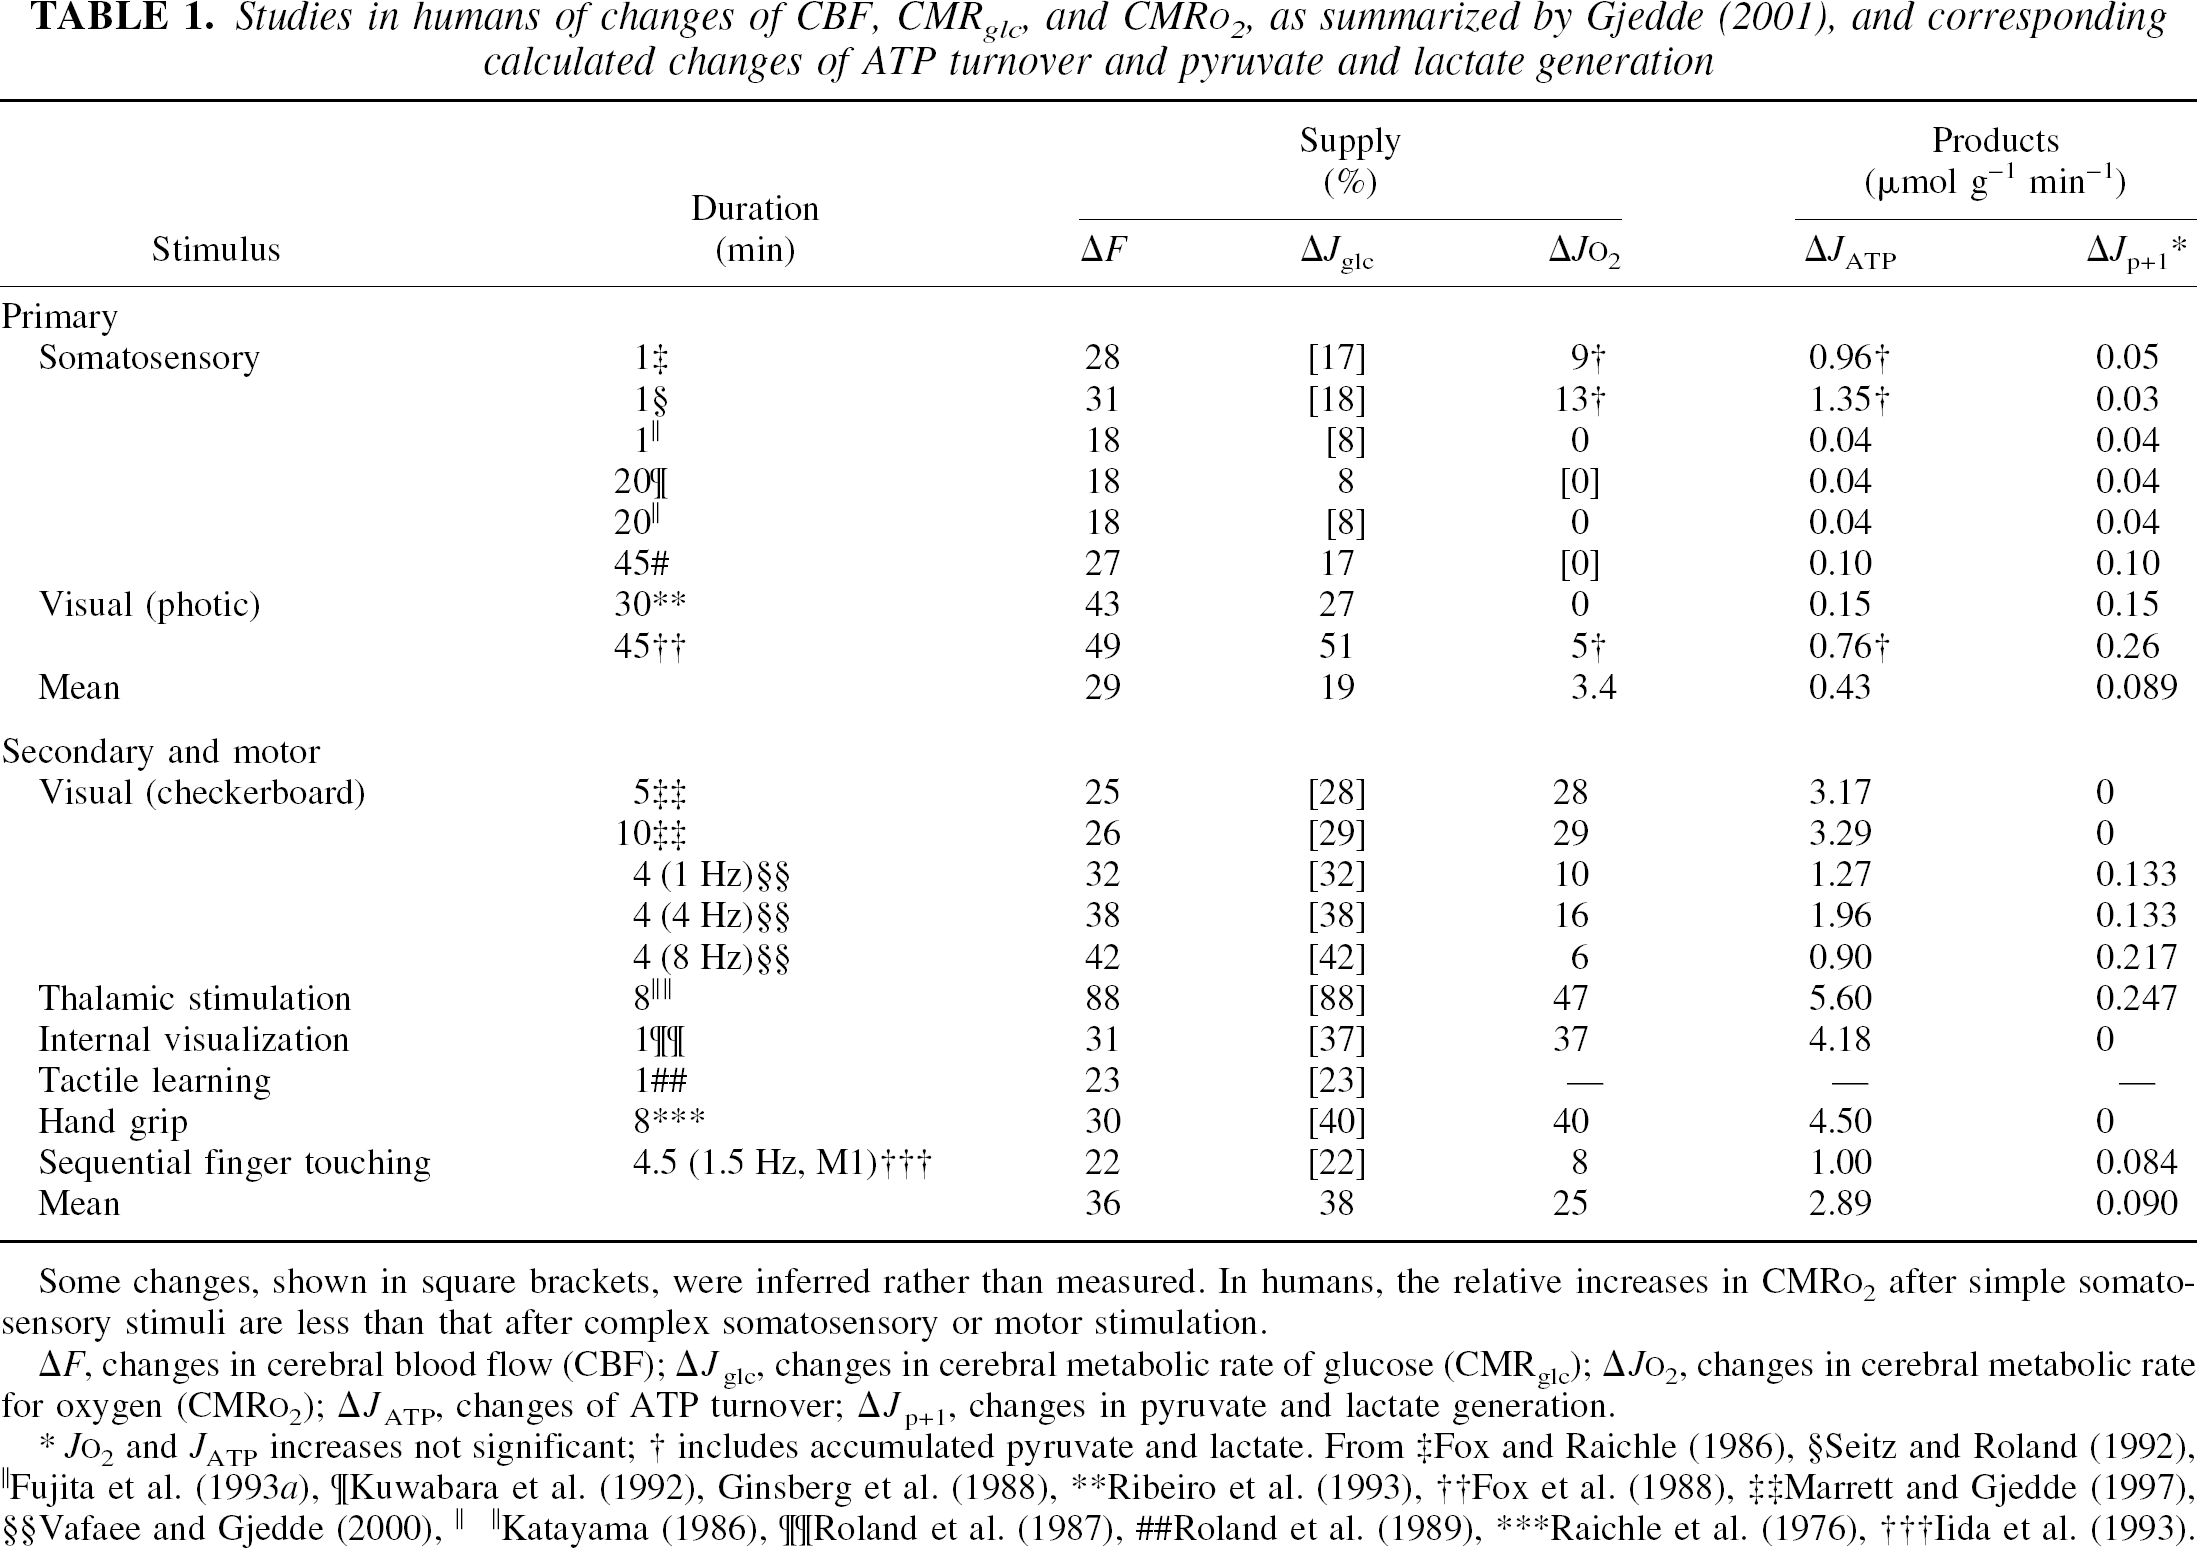
Some changes, shown in square brackets, were inferred rather than measured. In humans, the relative increases in CMRO2 after simple somatosensory stimuli are less than that after complex somatosensory or motor stimulation.
ΔF, changes in cerebral blood flow (CBF); ΔJglc, changes in cerebral metabolic rate of glucose (CMRglc); ΔJO2, changes in cerebral metabolic rate for oxygen (CMRO2); δJATP, changes of ATP turnover; ΔJp+1, changes in pyruvate and lactate generation.
JO2 and JATP increases not significant;
includes accumulated pyruvate and lactate.
From ‡Fox and Raichle (1986), §Seitz and Roland (1992), ∥Fujita et al. (1993a), ¶Kuwabara et al. (1992), Ginsberg et al. (1988), **Ribeiro et al. (1993), ††Fox et al. (1988), ‡‡Marrett and Gjedde (1997), §§Vafaee and Gjedde (2000), ∥ ∥Katayama (1986), ¶¶Roland et al. (1987), ##Roland et al. (1989), ***Raichle et al. (1976), †††Iida et al. (1993).
Complex visual stimuli (e.g., looking at a rapidly reversing blue–yellow radial checkerboard for 4 minutes) increase both blood flow and O2 consumption and lead to substantial increases of ATP generation (Gjedde and Marrett, 2001). In contrast, stimulation with a photic flash from white-light–emitting goggles produces a much smaller increase of O2 consumption and almost no increase of ATP generation (Fox et al., 1988). The minimal change of energy metabolism elicited by a simple stimulus means that no additional work takes place and hence that there is little additional postsynaptic depolarization. The absence of postsynaptic depolarization implies that there is little increase of efferent activity and therefore no postprocessing, as the postsynaptic depolarization is the trigger of the efferent activity.
The discussion above suggests that the marked variation of energy metabolic rates may be related to the degree of postprocessing that stimuli elicit in a given region. Thus, simple stimulation may induce little increase of oxidative metabolism because the limited postsynaptic depolarization fails to activate the mitochondria concentrated in dendrites (Collins, 1997; Wong-Riley, 1989), despite a substantial presynaptic activity. This hypothesis predicts that the glycolytic and oxidative responses are additive, the glycolytic response reflecting the work of astrocytes importing glutamate and potassium, and the oxidative response reflecting the degree of postsynaptic depolarization and the consequent activation of neuronal mitochondria. In analogy to the reactivity of muscle tissue, Collins (1997) called the responses either “white,” when the ATP gain is low and much lactate is being generated, or “red,” when there is substantial generation of ATP for a similar generation of lactate (Fig. 1).
Recent observations by functional magnetic resonance imaging summarized by Hoge and Pike (2001) confirm that the ratio of blood flow change to oxygen consumption change is closer to 2:1 than 10:1 for a complex visual stimulus, suggesting that the work could be a function of the complexity of the stimulus or task. To avoid circularity, complexity in this context must mean a measure of the extent of depolarization and hence change of sodium conductance caused by the processing of the stimulus or task.
GLUTAMATE–LACTATE EXCHANGE AT BASELINE
Proceeding from a simple consideration of conservation of mass, is it possible to calculate the oxygen used by neurons during the combustion of pyruvate molecules of non-neuronal origin? The inequality JNglc ⩾fNATPJO2 /6, where fNATP is the fraction of tissue ATP generated in neurons in vivo, JO2 is the total tissue oxygen consumption, and JNglc is the glucose consumption of neurons, is the criterion of neuronal self-sufficiency. Thus, for average oxygen and glucose consumption rates of 162 and 30 μmol hg−1 min−1, respectively, and generation of 85% of the tissue ATP in neurons (Lebon et al., 2001), glucose consumption in the neurons must equal or exceed 23 μmol hg−1 min−1 to supply the fuel of neuronal oxygen consumption without help from the astrocytes. To actually calculate the extraneuronal fuel (other than glucose itself) of neuronal oxygen consumption, it is necessary to know either the neuronal glucose and oxygen consumption rates, or the extraneuronal glucose and oxygen consumption rates plus the rates of pyruvate and lactate accumulation and net transfer across the blood–brain barrier. Unfortunately, few reports deal with the normal distribution of glucose and oxygen metabolism among neurons and astrocytes in vivo, and none does so for activation. Hertz et al. (1988); Erecinska and Silver (1989); Erecinska et al. (1991); Silver and Erecinska (1994); Erecinska and Silver (1994); Sibson et al. (1998); Itoh et al. (2001) and Wittendorp-Rechenmann et al. (2001) reported various combinations of the rates of oxygen and glucose metabolism in neurons and astrocytes in vitro. Silver and Erecinska (1997) provide a summary and discussion of some of these, and other, findings. From the reports, we glean the information that 5% of total energy metabolism in brain tissue is devoted to the transport of glutamate, that astrocytes in vitro, on a per gram basis, generate four times as much lactate as, and use three-quarters less oxygen than, neurons in vitro; that the rates of glucose phosphorylation of astrocytes and neurons in the brain are approximately equal; and, in some studies only, that astrocytes are more intensely and oxidatively metabolizing than previously believed, such that at least half of their glucose supply is oxidized to carbon dioxide. This kind of information is needed to calculate the relative contributions of each cell type in vivo, which in turn yields the individual metabolic rates of a mixture of neurons and astrocytes. However, upon close inspection it appears that the in vitro measurements must not reflect the cohabitation of neurons and astrocytes in vivo, unless astrocytes are responsible for a considerable share of the ATP generation of mixed neurons and astrocytes. A key question is therefore the extent to which observations in vitro can be said to reflect the largely unknown interaction of the two cell types in vivo.
The following equation yields the relative tissue fractions of neurons and astrocytes in vivo, when the shares of glucose consumption by neurons and astrocytes are known from experiments such as those reported by Wittendorp-Rechenmann et al. (2001),
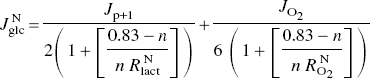
where JNglc is the glucose consumption of neurons, Jp+l is the total generation of pyruvate and lactate in the tissue, n is the neuronal volume fraction of the tissue (of which 17% is assumed to be extracellular fluid and 83% is assumed to be either neurons or protoplasmic astrocytes), RNlact is the ratio between the rates of lactate generation by pure populations of neurons and astrocytes, and RNO2 is the corresponding ratio between the rates of oxygen consumption. Itoh et al. (2001) found these ratios to be approximately 4 for RNO2 and 0.25 for RNlact. Pyruvate and lactate are the products of the metabolism of that part of glucose, which does not undergo full oxidation, expressed in the equation,
where JBBBp+l is the flux of pyruvate and lactate across the blood–brain barrier, and d [P+L]/ dt is the net rate of accumulation of pyruvate and lactate, which is nil in the steady state when there is no accumulation or depletion of pyruvate or lactate.
Equation (2) yields the fraction of the tissue occupied by neurons (n) when the values of JNglc (50% of total; Wittendorp-Rechenmann et al., 2001), RNlact, RNO2 (0.25 and 4; Itoh et al., 2001), Jo2 (measured in vivo), and Jp+1 (calculated by equation 3), are entered into the equation, under the improbable assumption that neurons and astrocytes are equally oxidative in vitro and in vivo. The average rates of metabolism of oxygen and glucose in the tissue are those listed in the left-most column of Table 2. With these values, equation (2) predicts that neurons occupy no more than 19% of the cerebral cortex in vivo, and that as much as 46% of the energy metabolism of the tissue occurs in the astrocytes. This result is not consistent with observations of the volume of neurons in cerebral cortex, and of astrocytes' low share of brain metabolism.
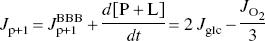
Estimates of metabolic properties of neurons and astrocytes in vivo, calculated from published in vitro data with equations (1–5) for baseline conditions, and from Table 1 for activation conditions
Fraction of total ATP generated in astrocytes.
Under the alternative assumptions that neurons occupy 50% and astrocytes occupy 33% of the volume of the cerebral cortex in vivo (Norenberg 1994), equation (2) predicts that astrocytes are responsible for 15% of the total energy metabolism of cortical tissue in vivo. Applied to the normal cortical averages of the human brain, this percentage leads to the estimates of the metabolic fluxes in normally resting brain (“baseline”) listed in the left-hand columns of the right-hand sections of Table 2. Thus, although all reports indicate that neurons produce lactate in vitro, the calculation indicates that neurons match the oxygen consumption to the glucose supply in vivo and hence use no pyruvate or lactate from astrocytes and export no pyruvate or lactate (Fig. 2). However, the calculation depends critically on the assumptions and may change if the assumptions are refined.
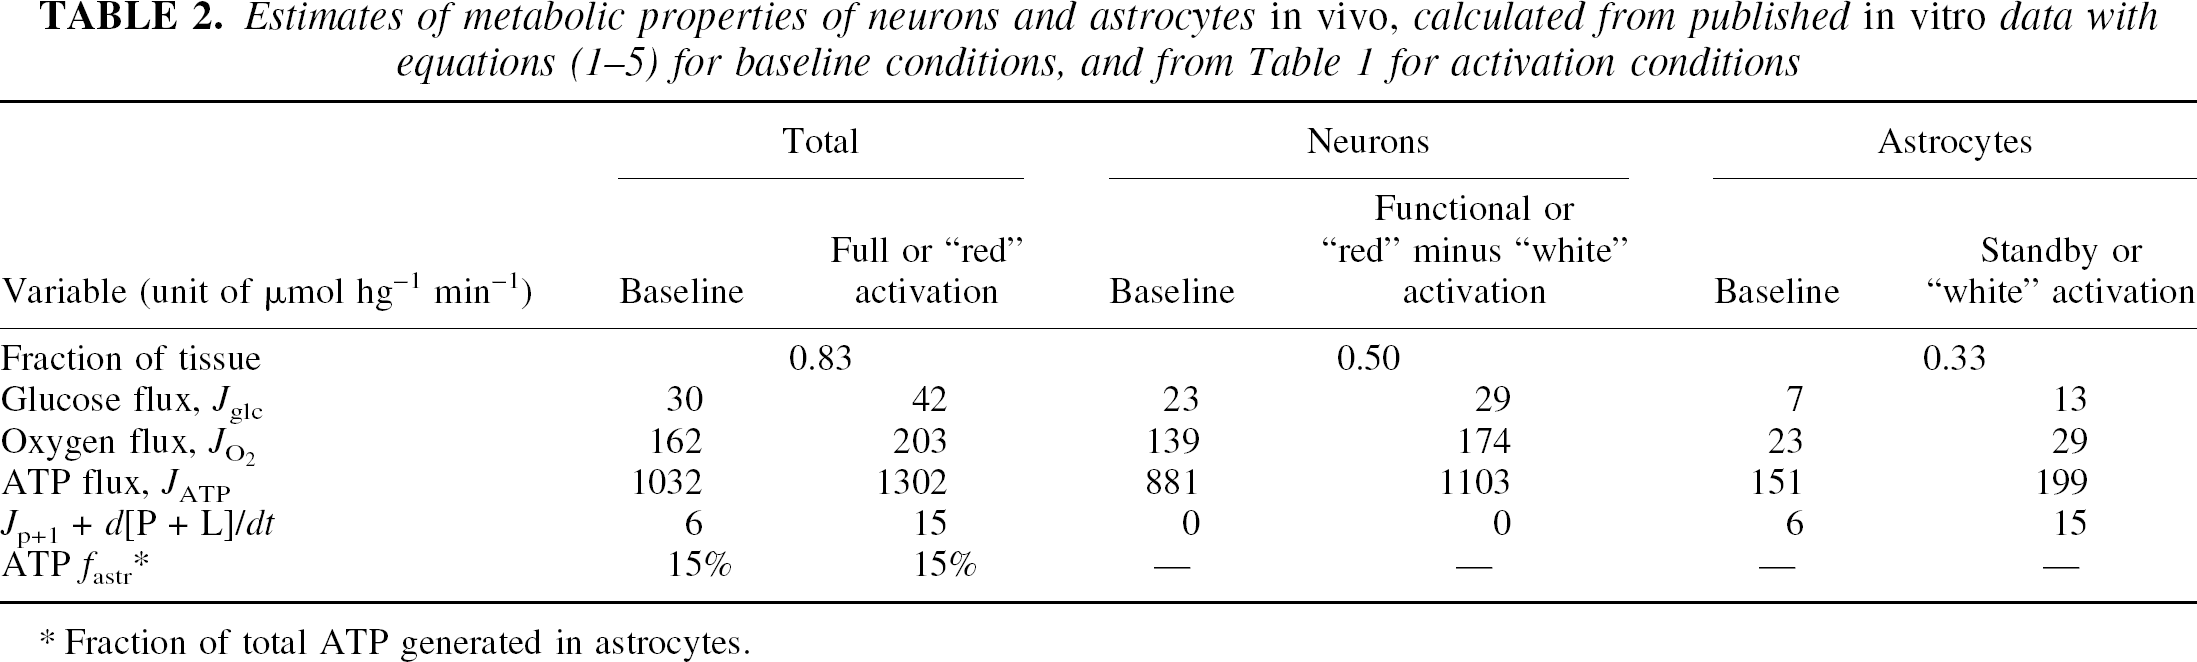
Summary of meta-analysis of fluxes of lactate and pyruvate in astrocytes and neurons (in units of μmol hg−1 min−1) at baseline and during activation, according to Tables 1 and 2. The breakdown of glucose to pyruvate (Pyr) involves a flux-generating step mediated by hexokinase. A near-equilibrium concentration ratio between pyruvate and lactate is established by lactate dehydrogenase. In vitro, LD5, an astrocyte-specific subtype of this enzyme, catalyses a low ratio between pyruvate and lactate, whereas LD1, found in neurons and astrocytes, catalyzes a high ratio. For thermodynamic reasons, it is unlikely that these differences can exist in vivo, because they create futile cycling between the pyruvate and lactate pools.
GLUTAMATE–LACTATE EXCHANGE DURING EXCITATION
The key question of the hypothetical glutamate–lactate exchange mechanism is whether extraneuronal pyruvate or lactate contributes to neuronal oxidative metabolism during activation. This is even more difficult to assess quantitatively than the contribution during the resting steady state. One approach is to subtract the putative “white” or glycolytic response from the “red” or fully oxidative response to appropriate stimuli. If the oxidative response takes advantage of the accumulation of lactate during the glycolytic phase, the accumulation should be significantly less for an oxidative response than for a glycolytic response, hence yielding a negative lactate generation for the difference. Conversely, if the two responses were additive and independent, the oxidative response would not be expected to reduce the amount of lactate produced in the tissue. In turn, the observation of no difference is evidence against additional neuronal metabolism of pyruvate or lactate generated in astrocytes during activation, above the contribution made in the baseline condition.
We calculated the rates of generation of ATP and lactate according to equations equations (1) and (3). The subtraction shown in the right panel of Figure 1 reveals substantial rises of oxygen consumption and ATP generation, but very little further change of blood flow and no change of lactate generation, positive or negative, for the transition from “white” to “red.” The subtraction confirms that the lactate accumulation is not attenuated by increased oxidative metabolism, in neurons or elsewhere. The numbers are shown in the right-hand columns of Table 2, in which the results of the subtraction are converted to rates of oxygen metabolism and lactate generation in neurons and astrocytes. There is no additional extraneuronal contribution to the oxidative metabolism of neurons.
Figure 2 summarizes the two responses, the glycolytic/astrocytic and the oxidative/neuronal, in terms of pyruvate flux. Some observers claim that neurons could produce lactate in vitro, yet would prefer extraneuronal lactate to neuronal glucose in vivo. In support of this claim, Poitry-Yamate et al. (1995) and Itoh et al. (2001) both report that the rate of lactate metabolism is at least twice the rate of metabolism of equimolar amounts of glucose in neurons in vitro. However, these reports merely confirm that glucose yields twice as many molecules of pyruvate as lactate, and they do not rule out an effect of pyruvate concentrations elevated by the presence of the two substrates at higher concentrations than normally encountered in vivo (e.g., 10 mmol/L glucose and 2 mmol/L lactate).
Cellular compartmentation
Astrocytic processes possess glutamate transporters that remove glutamate released into the synaptic cleft from presynaptic nerve terminals (Bergles and Jahr, 1997). Within astrocytes, glutamine synthetase converts glutamate to glutamine, which, in turn, is released from astrocytes, taken up by neurons, and converted back to glutamate by glutaminase, a neuronal enzyme. Thus, the localization of key transporters and enzymes leads to compartmentalization of glutamate and glutamine between neurons and astrocytes. In contrast, glucose transporters on astrocyte and neuronal membranes allow glucose in the bloodstream to diffuse across the blood–brain barrier and cell membranes into the interstitium and from there to all cells, and thus permit equilibration of glucose concentrations in the extracellular and intracellular spaces. Hexokinase, a cytosolic enzyme, converts each molecule of glucose to two molecules of pyruvate.
Theoretically, pyruvate has several potential fates, which may differ in neurons and astrocytes: It enters mitochondria via the mitochondrial monocarboxylic transporter where it is the substrate for pyruvate dehydrogenase. Pyruvate in the cytoplasm also converts to lactate in a reversible reaction that is catalyzed by lactate dehydrogenase. Pyruvate is a substrate for transport out of the cells and out of the brain by the monocarboxylate transporters. The abundance of the transporters of both lactate and pyruvate, and the near-equilibrium between pyruvate and lactate pools, ensure rapid and reversible exchange between intra-and extracellular pools of pyruvate and lactate. For this reason, it is unlikely that major concentration differences can exist among different pools of pyruvate, or among different pools of lactate. Thermodynamically, it is probable that pyruvate and lactate outside of mitochondria form unified substrate pools (Fig. 2).
Recently, different subtypes of lactate dehydrogenase have been identified, each with a distinct localization and activity: LD1, the oxidative subtype with a low ratio of lactate to pyruvate in vitro, is present in neurons; and LD5, the glycolytic subtype with a high ratio of lactate to pyruvate in vitro, is located in glial cells (Tholey et al., 1981; Bittar et al., 1996). Because it is difficult tounderstand how the differences between the isozymes translate into compartmentalization in vivo, different lactate-to-pyruvate ratios mediated by these lactic dehydrogenase subtypes may predominate in different situations and at different times, rather than at different places in the tissue. In turn, these temporal variations may establish different changes of the concentrations of pyruvate and lactate generated in neurons and astrocytes under different conditions of activation.
FUNCTIONAL COMPARTMENTATION
Figure 1 and Table 2 predict that activations can occur as a transition from a stand-by condition to the fully activated situation in which oxygen consumption rises significantly but there is little change of blood flow. Thus, if a stimulation happened to activate a region in which the baseline is at stand-by rather than at rest, would a significant increase of oxygen consumption rather than blood flow be measured? Figure 1 and Table 2 raise the possibility that three fundamentally different levels of focal activity exist in the brain, one characterized by baseline values of blood flow and oxygen metabolism; a second level characterized by increased blood flow but little increase of oxygen consumption, because of inhibition of postsynaptic depolarization, this condition best described as “stand-by”; and a third level characterized by increased blood flow and increased oxygen consumption because of significant postsynaptic depolarization and efferent projection from the site.
The meta-analysis in the right panel of Figure 1 shows that the blood flow increase of the differential “red-minus-white” response is smaller than the increase of oxygen consumption. It means that activations could exist for which a “white” type of response is the baseline for a “red” type of response. Hence, some subtractions could yield a substantial increase of oxygen consumption but very little change of blood flow. Results by Vafaee and Gjedde (2001) confirm that blood flow increases are minimal for some kinds of brain work. They reported a significant increase of oxygen consumption, but no increase of blood flow in PET measurements in the putamen of 14 volunteers performing right-hand fingers-to-thumb apposition taps.
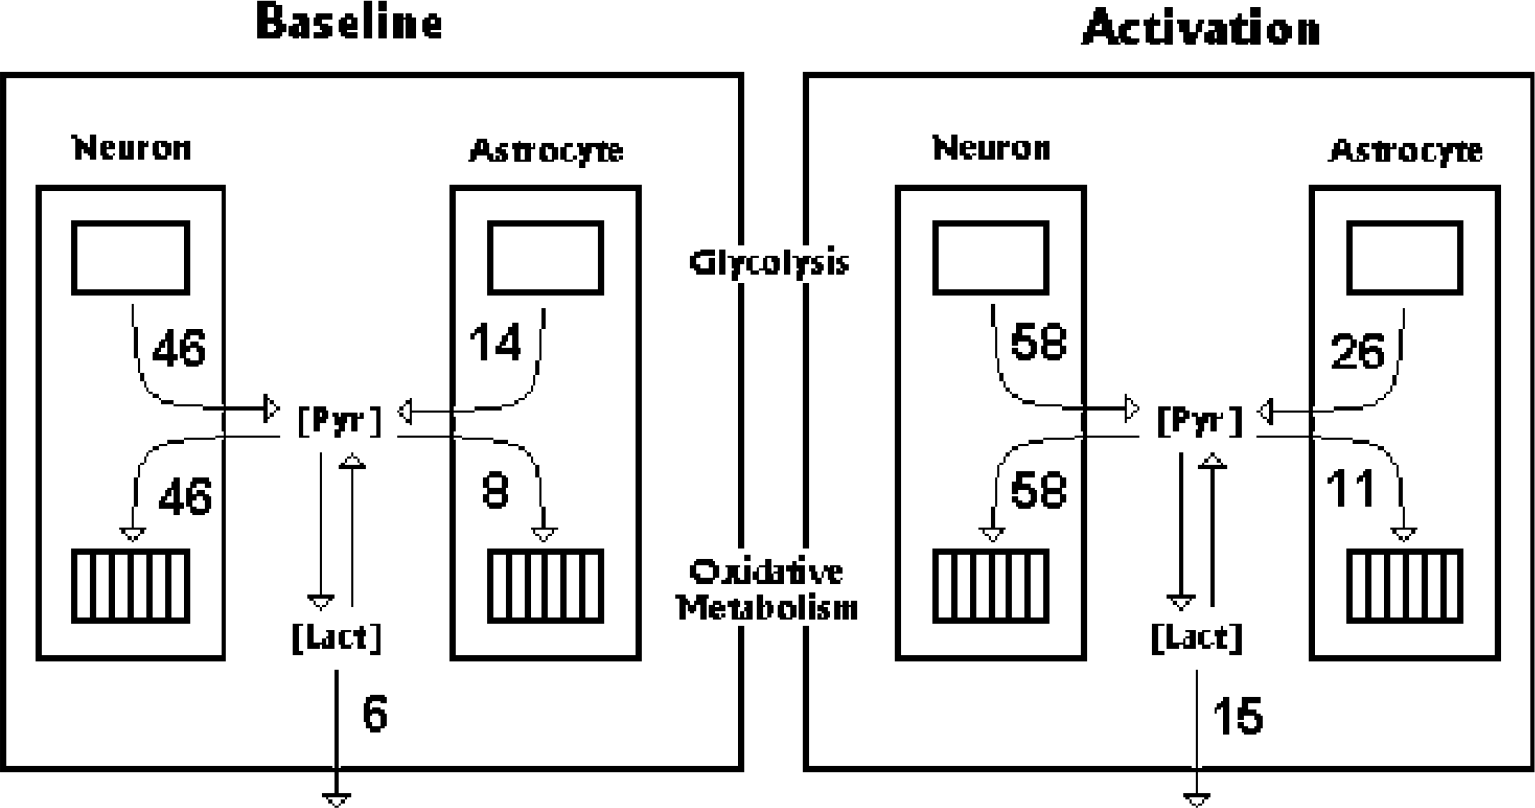
A model of the cellular relations suggested by this finding is shown in Figure 3. The stand-by condition is established by afferent activity and hence causes release of excitatory neurotransmitters, but the postsynaptic depolarization is prevented by inhibition. The excitatory neurotransmitters are removed by adjacent astrocytes, which undergo a limited activation of metabolism. The oxidative response is low because the mitochondria located preferentially in dendrites (Wong-Riley, 1989) are not stimulated. Only when the collateral inhibition is lifted does postsynaptic depolarization ensue and significant oxygen consumption commence. The switch from stand-by to full activation accompanies a fully functional response to afferent impulses. Incoming traffic with a low informational content, as in primary or simple stimulation, presumably would not proceed to a fully activated condition and therefore would not cause a major change of oxygen consumption.
Model of neuronal and glial relationships hypothetically explaining three levels of functional brain activity suggested by observations summarized in Figure 1. Depending on degree of positive and/or negative feedback, output or projection neuron may be more or less depolarized.
OXYGEN CONSUMPTION: RELATION TO GLYCOLYSIS
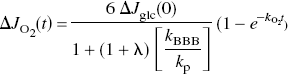
Although a stand-by condition with a full hemodynamic response clearly establishes a higher oxygen tension in the tissue, it is a question whether the elevated glycolytic rate of the same stand-by condition could contribute to a subsequent elevation of the rate of oxidative metabolism. Equation (3) shows that the pyruvate content and oxygen consumption are closely linked when the rate of glycolysis is constant, because the blood–brain export of lactate is a function of the lactate concentration, which in turn is a near-equilibrium product of the pyruvate concentration. Applying the near-equilibrium ratio between the lactate and pyruvate concentrations to equation (3), the following relationship establishes the relation of oxygen consumption to the pyruvate content (Gjedde and Marrett, 2001),
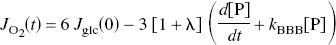
where Jo2 (t) is the variable oxygen consumption, Jglc (0) an approximately constant rate of glycolysis, λ theconstant near-equilibrium ratio between the concentrations of lactate and pyruvate, [P] the tissue content of pyruvate, and kBBB the net rate of blood–brain clearance of pyruvate and lactate. This equation yields a differential equation for the change of pyruvate content as a function of the oxygen consumption,
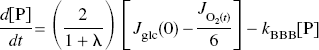
which implies that the change of the pyruvate content is closely linked to the change of oxygen consumption as a function of time.
There is growing evidence that neuronal excitation causes glucose consumption to rise rapidly and oxygen consumption to rise more slowly towards a new steady state defined by the intensity of neuronal work. Gjedde and Marrett (2001) measured the rate of change of the rate of oxygen metabolism during visual stimulation in humans. The stimulus was exposure of the left eye to a semi-annular checkerboard. The average increase of oxygen consumption rose from 20.5% at 3 minutes to 27.5% at 8 minutes. When the oxygen consumption mono-exponentially approaches a new steady state,
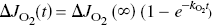
it follows that the oxygen consumption has risen in direct proportion to the rise of the pyruvate content,
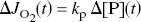
such that the increase of oxygen consumption is a function of the initially increased glucose consumption (Gjedde and Marret, 2001),
where kp, the rate constant of pyruvate clearance by oxidative metabolism, equals the term (ko2 −kBBB)(1 + λ).
The problem with this relation is the uncertainty about early changes of glucose consumption. The rise of oxygen consumption in proportion to a rise of pyruvate gained support from recent ingenious experiments by Paulson et al. (2001), who reported evidence of the transient decline of the oxygen–glucose index (OGI) in whole-brain of rat following a strongly arousing stimulus. The measured values of the index are shown in Figure 4. The values were fitted by an extension of equation (9), in which the changes of oxygen and glucose consumption are both expressed as functions of time,
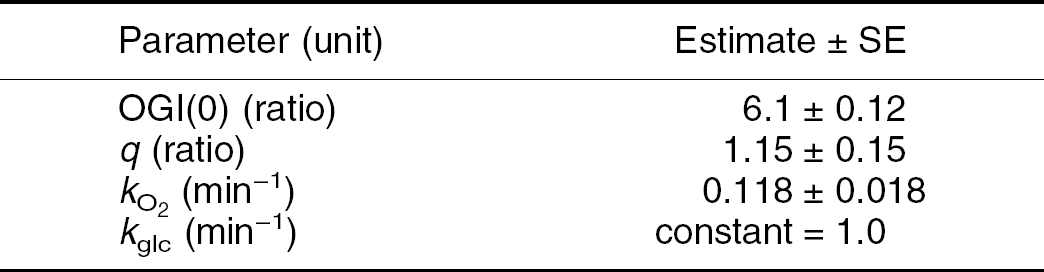
Oxygen–glucose index (OGI) of rats subjected to strongly arousing stimulus at time zero, as function of time after onset of arousal. Curve represents fit of equation (9) to measurements (open circles) reported by Paulson et al. (2001), where OGI(0) is baseline oxygen–glucose index, q is fractional increase of oxygen and glucose consumption, and ko2 and kglc are rate constants of approach to new steady state. Abscissa: Time after onset of stimulus (minutes). Ordinate: Oxygen–glucose index measured as ratio between arterial and cerebral venous concentrations of oxygen and glucose. Estimates of parameters for fit shown in graph are:
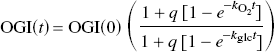
where q represents the steady-state fractional increments of oxygen and glucose consumption. The steady-state increment averaged 115% of the baseline. Whereas the oxygen consumption approached the new steady state with a time constant of 8.5 min (ko2 = 0.12 min−1), the glucose consumption rose so rapidly that the time constant remained essentially indeterminate at 1 minute or less (Fig. 4).
In some cases, changes of the BOLD response with time, although controversial, have been interpreted as reflections of time-dependent changes of oxygen consumption in relation to blood flow (Hathout et al., 1994; Frahm et al., 1996; Bandettini et al., 1997; Fransson et al., 1999; Bruhn et al., 2001), but the time courses and magnitudes of these changes vary greatly in relation to stimulus and MR sequence parameters.
OXYGEN CONSUMPTION: RELATION TO OXYGEN TENSION
Is it possible to postulate that changes of blood flow and glycolysis adjust oxygen tension in mitochondria and pyruvate content in cytosol, respectively, in preparation for increases of oxygen consumption which may or may not occur, depending on the subsequent projection of activity from the site in question? This question addresses the issue of the magnitude and changes of oxygen tension in brain tissue. It has been known for many years that the average oxygen tension of brain tissue rises transiently in response to certain electrical or physiological stimuli (e.g., Travis and Clark, 1965; Cooper et al., 1966; Gijsbers and Melzack 1967; Leniger-Follert and Lübbers, 1976), whereas it falls in response to other stimuli, both physiologic and pathologic (e.g., Davies and Rémond, 1947; Meyer et al., 1954; Ingvar et al., 1962; Caspers and Speckmann, 1972; Sick and Kreisman, 1979; Kreisman et al., 1979).
Nonetheless, it is a fact that these measurements do not identify a tissue oxygen tension of nil. Krogh (1919) provided the classical treatment of oxygen delivery to tissue in the shape of the Krogh cylinder around a capillary, which described the profile of oxygen tensions in the tissue, the farthest corners, reckoned from the arterial end of the capillaries, having the lowest tensions, requiring relief by capillary recruitment in conditions of elevated work. The Krogh cylinder specifically modelled a tissue with straight capillaries running in parallel, whereas brain capillaries form chaotic jumbles of vessels of no predictable direction or organization. For this reason it is unlikely that anatomically realistic profiles of oxygen tensions in brain tissue can be obtained by solution of partial differential equations of the kind introduced by Krogh (Wang and Bassingthwaighte, 2001).
Gjedde (1997) proposed a simplified approach to the prediction of oxygen tension profiles in brain tissue. As elaborated by Vafaee and Gjedde (2000), the model assumes that the oxygen tension at the end of the diffusion path, however defined, must be close to zero, because estimates of the average oxygen conductivity in brain tissue in relation to the average surface area of capillaries indicate that the pressure head necessary for supplying the tissue is equal to the average oxygen tension in capillaries (Gjedde et al., 1998).
In the absence of significant oxygen tension in mitochondria at the end of the diffusion path, the oxygen consumption of the tissue as a whole, integrated over all tissue elements, must depend exclusively on the average capillary oxygen tension, which in turn depends on the oxygen extraction fraction,
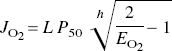
where L is the oxygen diffusibility, assumed to be constant in the absence of recruitment, P50 is the hemoglobin half-saturation oxygen tension, also assumed to be constant at 26 mm Hg, h is the Hill coefficient, and Eo2 is the oxygen extraction fraction.
The model explains how measurable changes of average tissue oxygen tension can depend on the choice of baseline in relation to the degree and type of stimulation and still be consistent with the diffusion-limitation of blood–brain transfer of oxygen: A series of profiles are shown in Figure 5, based on an average apparent cortical oxygen conductivity of 4 μmol hg−1 min−1 mm Hg−1 (Gjedde et al., 1998). This conductivity is consistent with the oxygen tension in mitochondria at the end of the diffusion path being close to zero, when the average capillary oxygen tension is 40 mm Hg and the average baseline oxygen consumption is 160 μmol hg−1 min−1, as listed in Table 2. The profiles are linear, because they reflect the even distribution of equivalent sinks (mitochondria). The average tissue oxygen tension in the baseline state is 20 mm Hg, in keeping with values measured by a variety of methods (Fig. 5, “baseline”).
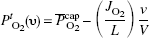
Tissue oxygen tension profiles in different functional states. Tissue oxygen tension, Pto2 (v), as function of percentage of volume served by capillary bed, V, was generated by rearrangement of equation (10),
What happens to the profile of oxygen tensions in states of increased oxygen consumption or decreased arterial oxygen tension (arterial hypoxemia)? Ignoring the physically dissolved oxygen in arterial plasma, equation (10) can be solved for cerebral blood flow, F, as a function of the only remaining variable, the arterial oxygen tension Pa o2,
where Chb is the arterial hemoglobin concentration. Because of the magnitude of the Hill coefficient (2.8), this equation of the independent relations of blood flow to oxygen consumption and oxygen tension makes the predictions (1) that blood flow would not need to rise substantially to maintain normal oxygen consumption in arterial hypoxemia above 40 mm Hg, because the ratio P50 /Pao2, raised to the power of h, is very small when P50 ≪ Pao2, and (2) that blood flow would need to rise substantially to support increased oxygen consumption, because the ratio Jo2 /(L P50), raised to the power of h, is large, when Jo2 ≫ (L P50).
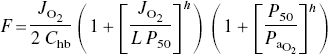
Experiments have verified both predictions. It is well known that arterial hypoxemia is associated with increases of cerebral blood flow only when the arterial oxygen tension falls below 40 mm Hg (Shimojyo et al., 1968). In 17 patients breathing 6% oxygen, whole-brain blood flow rose significantly only when the arterial oxygen tension dropped below at most 40 mm Hg (Figs. 6A and B). Oxygen consumption changed negligibly, even at the lowest oxygen tensions tested (23 mm Hg). Figure 6B shows that the measurements of whole-brain blood flow as a function of arterial oxygen tension closely match the values predicted by equation (12). For the case of functional activation of visual cortex, Mintun et al. (2001) showed that the increase of blood flow is independent of the degree of hypoxemia, as also predicted by equation (11).
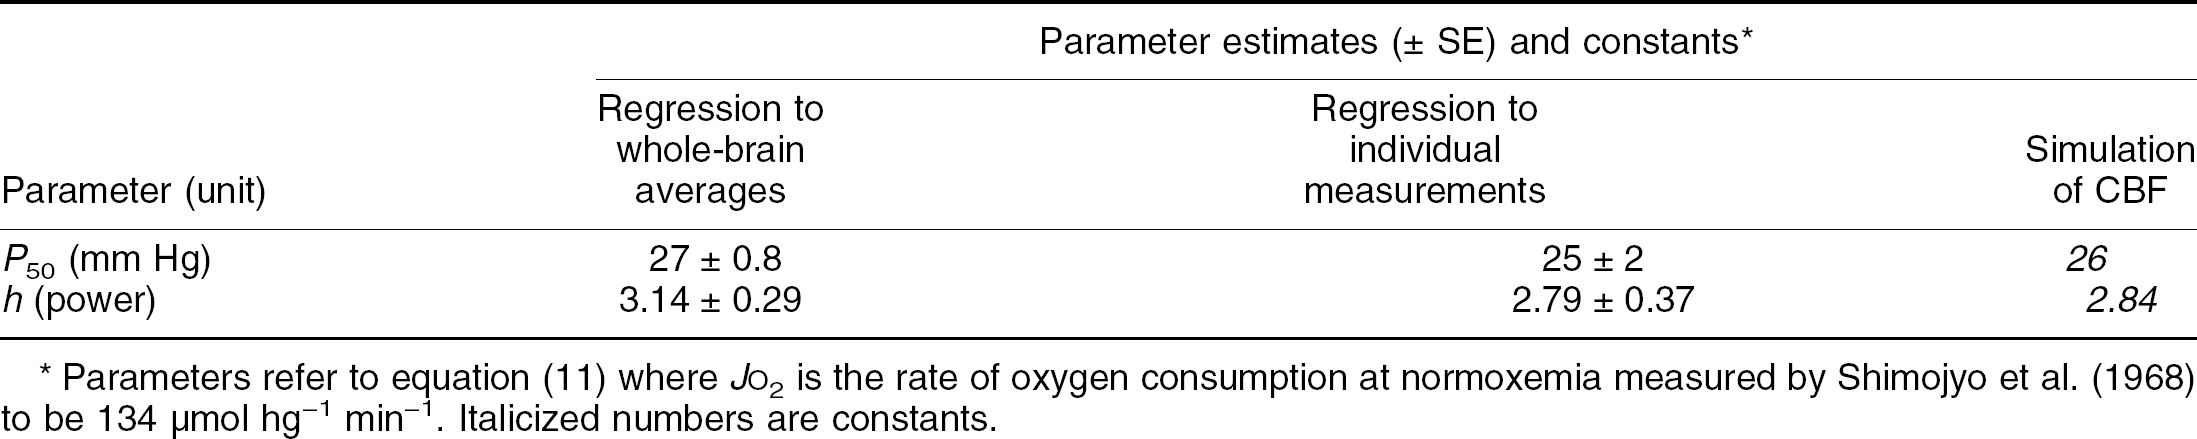
Cerebral blood flow change in response to arterial hypoxemia. Measurements of cerebral blood flow, F, as a function of arterial oxygen tension, Pao2 were fitted by equation (11) (Vafaee and Gjedde, 2000), where Jo2 is oxygen consumption (134 μmol hg−1 min−1), Chb is the arterial hemoglobin concentration (7 mmol/L), L is the oxygen conductivity (3 μmol hg−1 min−1), h is Hill coefficient, and P50 is oxygen–hemoglobin half-saturation tension. The equation was fitted to the measurements of Shimojyo et al. (1968) (open circles). Left panel, fit of equation to reported average values of CBF (lower curve) and approximately constant oxygen consumption (upper curve); right panel, flow values simulated from normal averages of parameters (thin line), and fit of equation (thick line) to reported individual values of CBF (open circles):
The model underlying the profile of oxygen tensions in brain tissue predicts that the capillary oxygen tension must rise in a stand-by activation to support an increased gradient of oxygen tension in the tissue. As shown in Figure 5, the average tension in the tissue rises to 30 mm Hg (“standby”). When an increase of the oxygen consumption occurs in response to a more functional activation, the average tissue tension drops to 25 mm Hg (“activation”). For pathologic excitations, the capillary oxygen tension could rise but the average oxygen tension would decline if the activity in some parts of the tissue outstripped the oxygen supply to the rest of the tissue (“seizures”). Thus, it is possible, with a fluctuating pattern of activation, to have both positive and negative changes of oxygen tension, depending on the choice of baseline. The finding of Sick and Kreisman (1979) of a reduction of oxygen tension by a more complex visual stimulus is in complete agreement with the finding of Vafaee and Gjedde (2001) that a more demanding motor task, repetitively executed, sustains little change of blood flow but a substantial increase of oxygen consumption in a nonprimary region of the brain (putamen).
CONCLUSIONS
The observations summarized in this review allow the distinction to be made between afferent and efferent phases or states of functional activation. The afferent phase primarily involves the presynaptic terminals and astrocytes, whereas the efferent phase involves the dendrites (and perhaps cell bodies) of projection neurons and interneurons. The changes of metabolism occurring in each condition appear to be additive and not to be characterized by significant transfer of lactate from astrocytes to neurons, and there is no suggestion that glycolysis in astrocytes supports the oxidative metabolism of neurons in the baseline condition. In addition to the release of neurotransmitters from the presynaptic terminals and the import of the neurotransmitter by astrocytes, a major function of the afferent phase appears to be the establishment of a blood flow level sufficient to support an increased level of oxidative energy metabolism associated with projection from the site of activation. The increased flow rates overcome an inherent diffusion limitation of oxygen delivery, while the increased rate of glycolysis accomplishes an increase of tissue pyruvate content, to which the oxygen consumption appears to be correlated.
Primary activations with little increase of energy metabolism, elicited by simple or sometimes unusually prolonged stimulations, fit the description of the afferent phase. The variable metabolic rate of the efferent phase makes it difficult to draw firm conclusions about functional state from changes of blood flow alone. In fact, it is possible that the more dramatic examples of uncoupling of flow from oxidative metabolism reflect the situations in which the postsynaptic activation is minimal. In this sense, it is possible that changes of flow and glycolysis, which are dissociated from changes of oxygen consumption, could signify states of inhibition of functional activity.
Footnotes
Acknowledgments:
The authors thank Michele Gammeltoft for her untiring work with the manuscript of this review.