
Abstract
The regulation of brain energy metabolism during neuronal activation is poorly understood. Specifically, the extent to which oxidative metabolism rather than glycolysis supplies the additional ATP necessary to sustain neuronal activation is in doubt. A recent hypothesis claims that astrocytes generate lactate with the muscle-type lactate dehydrogenase (LDH) isozyme LD5. Lactate from astrocytes then undergoes oxidation in neurons after reconversion to pyruvate by the LDH subtype LD1. On the basis of this hypothesis, the authors predicted that the time course of an excitatory increase of the oxidative metabolism of brain tissue must depend on the degree to which astrocytes provide neurons with pyruvate in the form of lactate. From the known properties of the LDH subtypes, the authors predicted two time courses for the changes of oxygen consumption in response to neuronal stimulation: one reflecting the properties of the neuronal LDH subtype LD1, and the other reflecting the astrocytic LDH subtype LD5. Measuring oxygen consumption (CMR o2) with positron emission tomography, the authors demonstrated increased CMR o2 during sustained stimulation of visual cortex with a complex stimulus. The CMR o2 increased 20.5% after 3 minutes and 27.5% after 8 minutes of stimulation, consistent with a steady-state oxygen–glucose metabolism ratio of 5.3, which is closest to the index predicted for the LD1 subtype. The index is equal to the oxygen–glucose metabolism ratio of 5.5 calculated at baseline, indicating that pyruvate is converted to lactate in a cellular compartment with an LDH reaction closest to that of LD1, whether at rest or during stimulation of the visual cortex with the current stimulus. The findings are consistent with a claim that neurons increase their oxidative metabolism in parallel with an increase of pyruvate, the latter generated by neuronal rather than astrocytic glycolysis.
Positron emission tomography (PET), functional magnetic resonance imaging (MRI), and optical intrinsic signal imaging detect changes of blood flow or blood oxygenation in brain. Increases and decreases are believed to be secondary to changes of the underlying neuronal activity and metabolism, but the actual energy costs of focal stimulation of neuronal activity are unknown. Departures from steady state perturb the relationship between neural activity and cerebral metabolism and blood flow (CBF). Examples include Leão's spreading depression of electroencephalographic activity, associated with paradoxically increased CBF and metabolism, and conditions of decreased oxygen or glucose delivery, which often raise neuronal firing and cause seizures in extreme cases. Thus, substrate delivery is not coupled directly to the functional activity of nerve cells in the absence of steady state (Creutzfeldt, 1975; Gjedde, 1997).
Although measurements of CBF, oxygen metabolism (CMR o2), and glucose consumption (CMRglc) of the cerebral cortex indicate almost complete oxidation of glucose at steady state, CMR o2 may dissociate from blood flow and glucose consumption during focal sensory stimulation (Fox et al., 1988), suggesting that the adenosine triphosphate (ATP) required to sustain the excitation must arise from glycolysis alone rather than from oxidative phosphorylation. Lactate then is produced from pyruvate at a rate regulated by the kinetic profile of lactate dehydrogenase (LDH) as well as by the redox potential and pH of the cytosol. As a near-equilibrium reaction, at normal pH, the LDH reaction is strongly balanced toward lactate and hence buffers any increase of pyruvate, but the balance depends on the properties of the prevailing LDH isozyme, LD1 (Nakae and Stoward, 1994; Marchat et al., 1996) or LD5 (Onigbinde et al., 1992; Sanz et al., 1990).
A recent hypothesis postulates that direct glycolytic generation of ATP in astrocytes is the rule rather than the exception during neuronal excitation (Pellerin and Magistretti, 1994; Magistretti et al., 1999). The hypothesis makes three claims about neuronal excitation in vivo: that is, that there is net generation rather than consumption of lactate in astrocytes, which alone possess the glycolytic LDH subtype LD5 (Bittar et al., 1996); that there is net transfer of lactate from astrocytes to neurons by the monocarboxylate transporters (Broer et al., 1997); and that there is net consumption rather than generation of lactate in neurons, which possess only the oxidative subtype LD1 (Brooks et al., 1999). Thus, if the brain tissue depends on lactate generated in astrocytes for the oxidation requirements of excited neurons, their oxidative metabolism cannot rise more rapidly than dictated by the subtype of LDH prevailing in astrocytes, if this indeed provides a substantial fraction of the pyruvate metabolized in excited neurons.
The claims yield two predictions: first, that the balance of lactate generation switches from the oxidative heart-type LD1 to the glycolytic muscle-type LD5 during neuronal activation; and second, that the high lactate–pyruvate ratio of the near-equilibrium LD5 reaction commensurately delays the onset of oxidative metabolism.
It is possible to test these claims by modeling the effect of the combined pyruvate–lactate pools on oxygen consumption during functional activation of brain tissue in humans. The size of these pools is related to the time course of the buffering of pyruvate by the LDH reaction. Considering that pyruvate is the substrate of oxidative metabolism, the time course of the increase of oxidative metabolism was shown by the modeling to reflect the buffering of pyruvate and hence of the kinetic properties of the LDH responsible for the buffering because the oxidative metabolism, according to the shuttle hypothesis, cannot rise more than allowed by the supply of pyruvate, although it may, of course, rise less.
Novel findings in brain provide evidence for delayed coupling of CMR o2 to blood flow. Results from functional MRI and magnetic resonance spectroscopy indicate that oxidative metabolism in cerebral cortex may increase measurably as late as 2 to 15 minutes after the onset of sustained stimulation, in keeping with buffering of pyruvate by the generation of lactate–pyruvate pools, but the extent to which the delay indicates increased glycolysis is unknown (Chen et al., 1993; Hathout et al., 1994; Frahm et al., 1996; Vafaee et al., 1998, 1999, 2000; Hoge et al., 1999; Vafaee and Gjedde, 2000).
For astrocytes to be the site of generation of the lactate sustaining the increased metabolism of excited neurons, and for the hypothesis of the astrocyte–neuron lactate shuttling to remain valid, the time constant of change of the oxidative metabolism increased by excitation must indicate a more glycolytic reaction of LDH than at rest. We tested this prediction by measuring the CMR o2 as a function of time with PET, using the method of Ohta et al. (1992).
Theory
From the model of pyruvate metabolism shown in Fig. 1, we derived a differential equation for the change of the cytosolic pyruvate content induced by an increase of the rate of glycolysis. The differential equation accounts for the fates of pyruvate (carboxylation in astrocytes, export from neurons and astrocytes, reduction to lactate, or transport into mitochondria) and lactate (oxidation to pyruvate or export from cells),
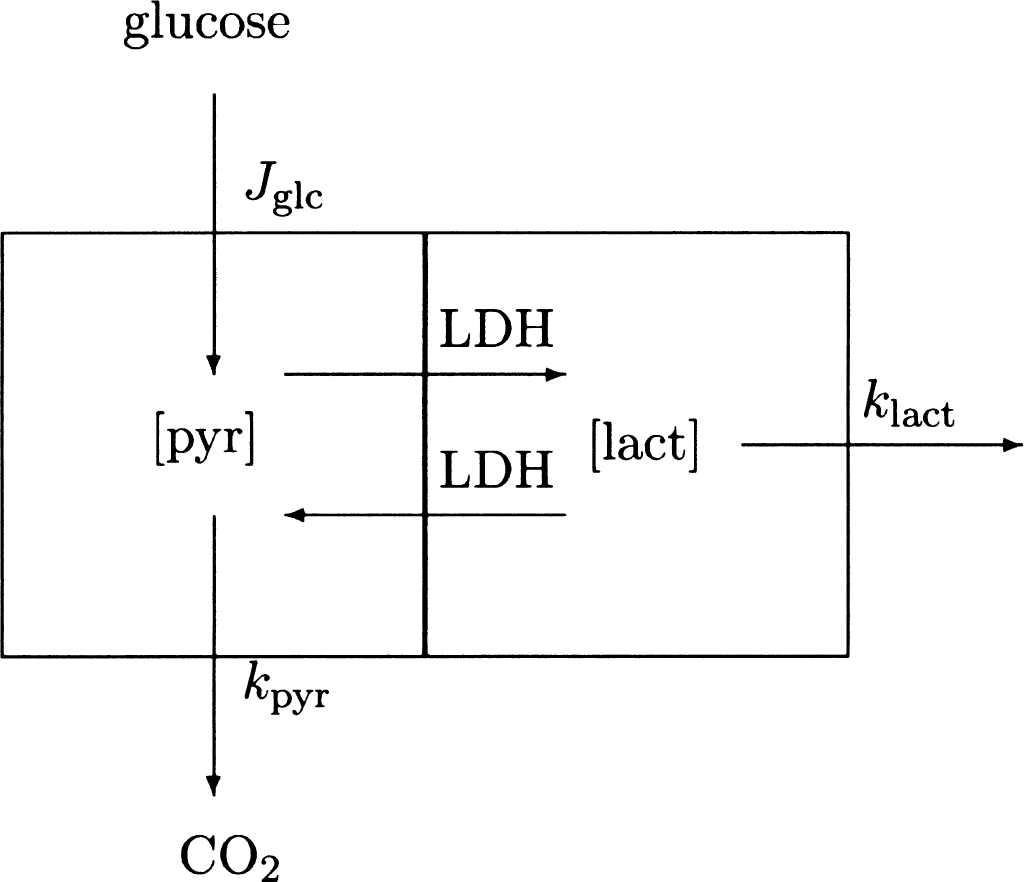
Simplified model of main metabolic reactions regulating glycolysis and oxygen consumption in brain. Symbols are defined in the text. Metabolites linked by the near-equilibrium transport reactions were assumed to form single kinetic compartments. Lactate and CO2 productions then are regulated by the prevailing LDH kinetic properties (λ), microvascular export of lactate (klact), and rate of pyruvate entry into mitochondria (kpyr). The clearance of pyruvate is the ratio between the maximum transport capacity of mitochondrial monocarboxylate transporter mMCT. The clearance of lactate is the ratio between the maximum transport capacity of the monocarboxylate transporter MCT1 of the blood–brain barrier.
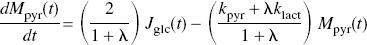
where Mpyr (t) is pyruvate content, Jglc is the rate of glucose phosphorylation, kpyr and klact are the rate constants of the clearances of pyruvate and lactate, respectively, and λ is the near-equilibrium ratio between the contents of pyruvate and lactate, treated here as a constant equal to the ratio of the Michaelis constants of LDH toward the two substrates. The clearance of pyruvate is the ratio between the maximum velocity of the flux-generating pyruvate dehydrogenase (PDH) reaction and the pyruvate content of the tissue. The clearance of lactate is the ratio between the maximum transport capacity of the monocarboxylate transporter (MCT1) of the blood–brain barrier and the lactate content of the tissue.
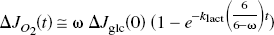
Under the important assumption of constant coefficients, discussed later, the equation was solved for the tissue content of pyruvate (ΔMpyr) as a function of the duration of stimulation,
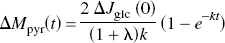
where ΔJglc (0) is the assumed stimulation-induced instantaneous step increase of glycolysis, and k is a lumped term equal to [kpyr + λklact]/[1 + λ]. As the near-equilibrium ratio between the concentrations of lactate and pyruvate, λ depends on the affinities of the prevailing isozymes of LDH (LD1 –LD5), as influenced by the cytosolic redox potential and the pH (Kaplan and Everse, 1972). The ratio λ varies with the isozyme, such that the heart-type LD1 (H4) has the lowest ratio and the muscle-and liver-type LD5 (M4) has the highest. The higher the ratio between the affinities of LDH (i.e., the lower the ratio between the Michaelis constants) for lactate and pyruvate, the lower the value of λ.
On the basis of the lactate shuttle hypothesis, we reasoned that the value of kpyr, after a possible initial change, must remain constant during the excitation because it would not change in astrocytes, if they are oxidatively unresponsive to excitation, or in neurons, if the supply of pyruvate from astrocytes accompanies the change of oxidative metabolism during excitation. The formal argument involves the pyruvate and lactate transporter of the mitochondrial membrane (mMCT) and the properties of the mitochondrial lactate dehydrogenases, LD-Mt1 and LD-Mt2, which maintain a low pyruvate–lactate ratio in mitochondria, as well as a high ratio between pyruvate in cytosol and pyruvate in mitochondria, possibly enhanced by pyruvate carboxylation in neurons (Brandt et al., 1987, Brooks et al., 1999, Hassel and Bråthe, 2000), and hence may not be associated with an increase of the net flux, except when pyruvate is increased in the cytosol (Appendix).
The rate of oxidation of pyruvate can rise to a maximum set by the rate of pyruvate clearance from the cytosol,
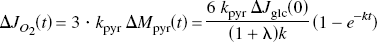
which predicts the change of the oxidative metabolism, CMR o2 (JO2), as a fraction of the assumed instantaneous step change of glycolysis, which, at steady state, is an oxygen–glucose metabolism ratio (ω) for the excitation,
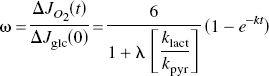
where the term λklact / kpyr is an index of the tissue's glycolytic capacity, as dictated by the blood–brain export capacity for lactate (klact), the kinetic profile of LDH (λ), and the mitochondrial import capacity for pyruvate (kpyr). Appropriate substitution reveals that this ratio is largely a function of the lumped rate constant k when the rate of lactate clearance is constant,
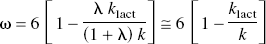
where ω is the oxygen–glucose metabolism ratio for the excitation. The ratio λ/(1 + λ) is close to unity because λ >> 1. This relationship is the basis for the use of estimates of k, the rate of approach to steady state, to determine the oxidativeness of metabolism,
in which k equals 6 klactt/(6 − ω), under the assumption of instantaneous step changes of Jglc and kpyr, if any, and little change of klact.
MATERIALS AND METHODS
We used the Scanditronix PC2048–15B PET tomograph with a spatial resolution of 6.5 mm (full width at half maximum) in all three dimensions. Images were reconstructed as 128 × 128 matrices of 2 × 2 mm pixels, using filtered back-projection with a 20-mm Hanning filter, full width at half maximum. Corrections were made for tissue attenuation, dead time, and scatter. A short indwelling catheter was placed in the left radial artery. The subjects were positioned in the tomograph with their heads immobilized in a self-inflating foam headrest. Blood samples were collected manually and calibrated with respect to the tomograph.
Nine healthy right-handed volunteers without apparent neurologic deficits (aged 22 to 37) gave informed consent to a protocol approved by the Research Ethics Committee of the Montreal Neurological Institute. The volunteers viewed two different visual stimuli on a 21-inch color video monitor suspended 36 to 40 cm from their eyes. Each subject's right eye was occluded with an eye patch and black cloth for the entire tomography session, during which subjects gazed at the center of the screen presenting the stimulus. The baseline stimulus (BL) was a cross hair presented at the center of the screen. The activation stimulus (CB) was an annular red–black checkerboard disk that reversed contrast at 8 Hz. The stimulus had a 1° fixation cross at center. The checkerboard (CB) stimulus had an inside radius of 5° and an outside radius of 20° restricted to the left of the cross. The annulus extended from +45° to −45° of the horizontal meridian. The combination of monocular viewing with the left eye and a stimulus restricted to the left visual hemifield was intended to confine activation to the right primary visual cortex.
For the baseline measurement, the subjects were instructed to gaze at the cross hair. The tomography started 30 seconds later and lasted 3 minutes. During the two activation measurements, the subjects viewed the stimulus for totals of 6 (CB1) or 11 (CB2) minutes. The subjects reported no difficulty in maintaining fixation for these periods, during the last 3 minutes of which the CMR o2 was measured. All subjects underwent the same sequence of stimulations (BL, CB1, CB2). Between the end of one PET scan and the beginning of the next, subjects were instructed to rest for a period of 10 to 15 minutes.
The CMR o2 was measured by single-breath inhalation of 60 to 80 mCi15O-labeled oxygen (Ohta et al., 1992). Parametric brain maps of CMR were computed for all 15 image planes and normalized for differences in global CMRO2. The PET images from each subject were co-registered with the corresponding MRI volumes and transformed to stereotaxic coordinates using an automated feature-matching algorithm (Evans et al., 1991). Difference volumes (stimuli minus baseline) were computed and averaged across all subjects. The significance of a given change in CMR o2 was assessed by application of an intensity threshold to the t-statistic images (Evans et al., 1992). Two [15O]O2 tomographies were rejected on technical grounds when subjects inhaled the tracer incorrectly.
For each subject, magnetic resonance images were obtained from a Philips Gyroscan ASC (1.5 T). The MRI consisted of 64 contiguous 2-mm transverse sections. The t-statistic volume was obtained by dividing every intracerebral voxel in the difference volume by the mean standard deviation in normalized units of CMR o2 (Fox and Mintun, 1989; Worsley et al., 1992; Woods et al., 1993).
RESULTS
The mean value of CMR o2 for gray and white matter was 138 μmol hg−1min−1. The visual stimulation significantly changed the oxygen consumption in the right visual cortex of the volunteers by 20.5% after the short (3 to 6 minutes) and by 27.5% after the long (8 to 11 minutes) stimulus presentations, as shown in Fig. 2. Table 1 lists the average changes from baseline of oxygen clearance for all individuals (computed at the peak of the group-mean image), as well as the mean of the maximum differences detected in a search volume centered over right visual cortex of each individual. We used these values to determine the oxidativeness of metabolism at baseline and during continuous excitation.
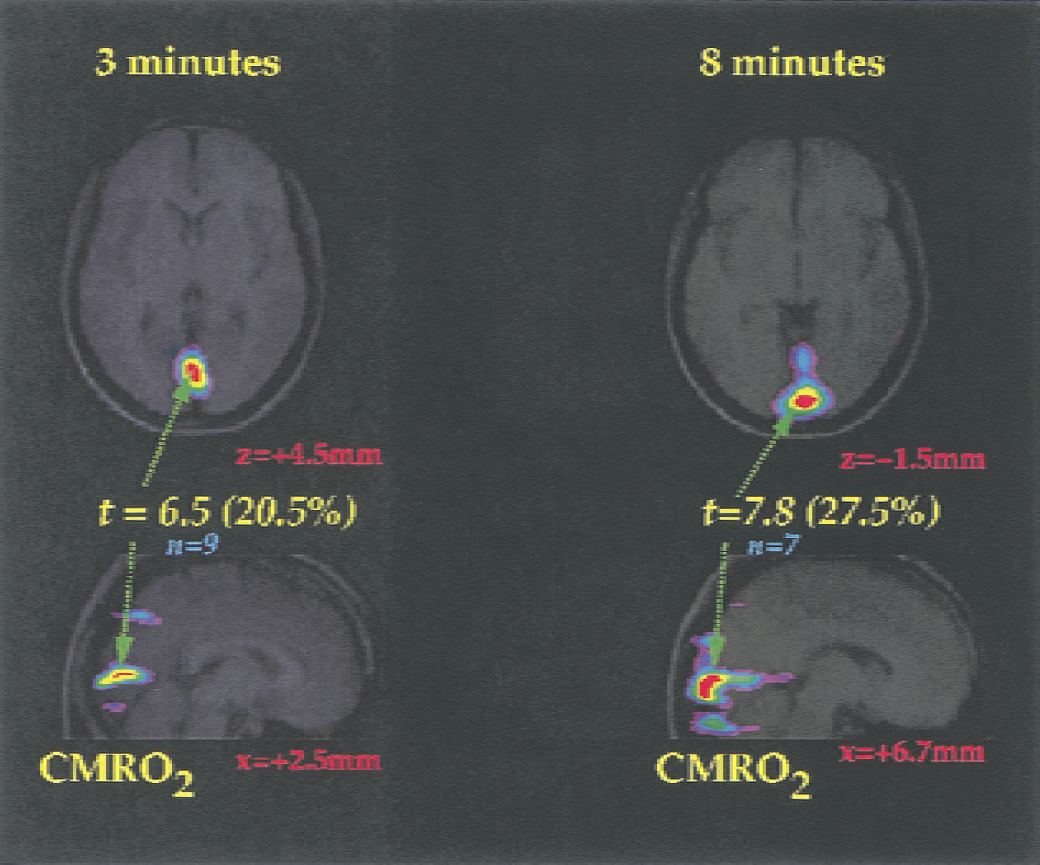
Average increases of CMR o2 observed after short (3 to 6 minutes) and long (8 to 11 minutes) stimulation periods. Stimulus was a semiannular checkerboard restricted to the left visual hemifield. Right eye was occluded. Baseline consisted of fixation on a cross hair. Figures show merged average positron emission tomography (PET) and magnetic resonance images. The magnetic resonance images are averages computed from the nine subjects. The number of subjects contributing to the PET averages varies as indicated in Methods. The coordinates are listed in Table 1. The t-maps were computed according to the method of Worsley et al. (1992). Values of t above 3.75 yield a false-positive rate of 0.58 in 458 resolution elements if the volume of gray matter is taken as 500 mL.
Significant changes of local oxygen consumption during checkerboard stimulation of human visual cortex
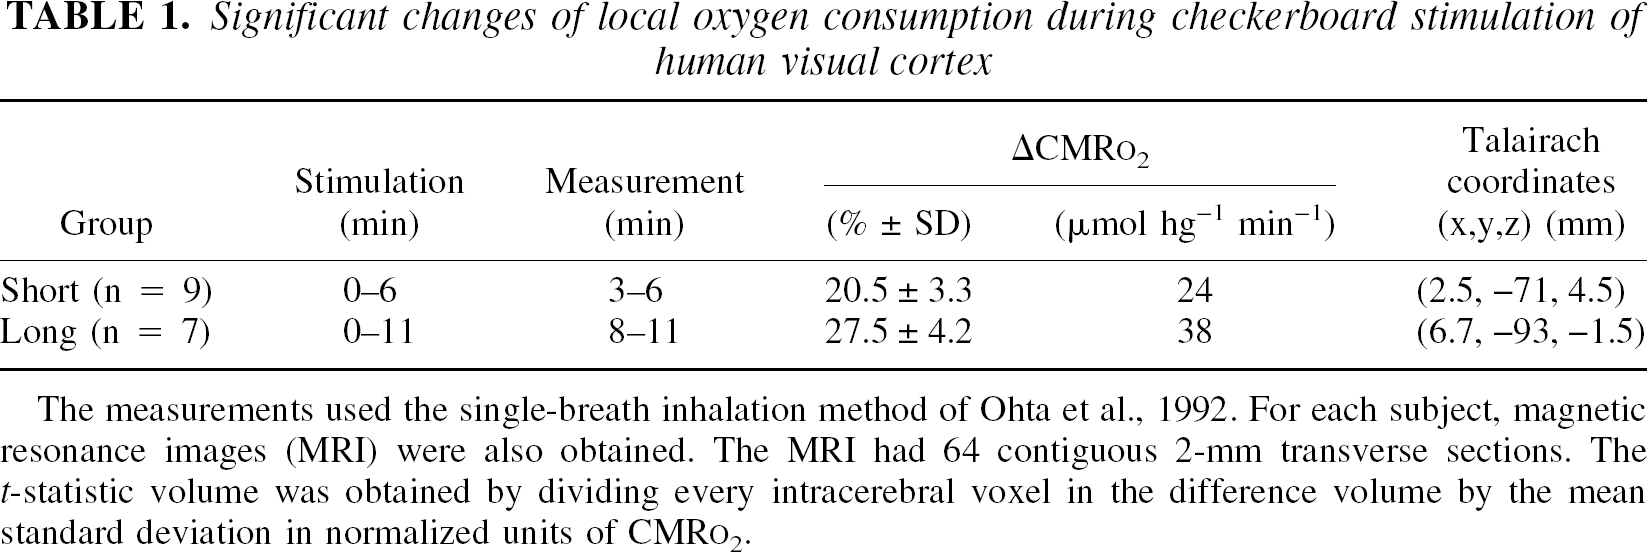
The measurements used the single-breath inhalation method of Ohta et al., 1992. For each subject, magnetic resonance images (MRI) were also obtained. The MRI had 64 contiguous 2-mm transverse sections. The t-statistic volume was obtained by dividing every intracerebral voxel in the difference volume by the mean standard deviation in normalized units of CMRO2
Baseline metabolism
The kinetic properties of the LDH subtypes in vitro are listed in Table 2. The corresponding lactate–pyruvate ratio of the LD5 reaction at steady state is an order of magnitude greater than that of LD1.
Isoenzymatic properties of LDH
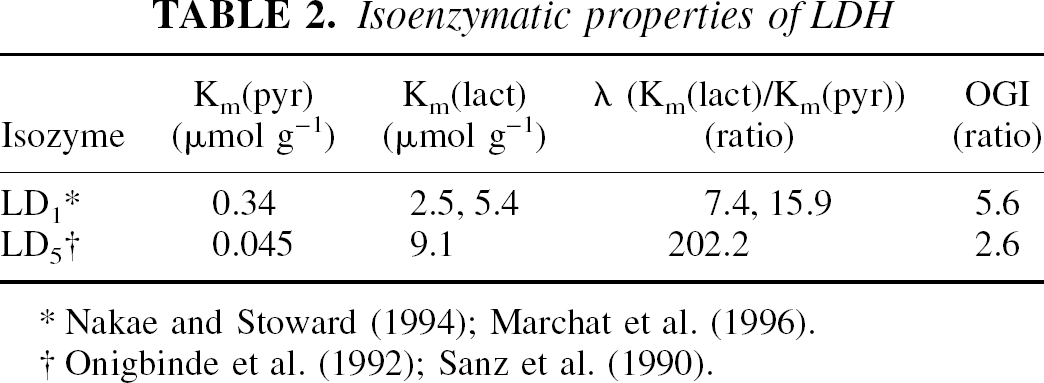
Nakae and Stoward (1994); Marchat et al. (1996).
Onigbinde et al. (1992); Sanz et al. (1990).
The steady-state baseline values of the rate constants kpyr and klact are listed in Table 3. We used these values to derive the hypothetical values of the oxygen–glucose metabolism ratio in vivo for the LDH subtypes listed in the top panel of Table 4 for hypothetical tissues having entirely one or the other of the subtypes, and for average gray matter of cerebral cortex in the middle panel of Table 4. In human cerebral cortex in vivo, the ratio between the rates of oxygen and glucose consumption has the baseline value of 5.5, and the baseline ratio between the tissue contents of lactate and pyruvate in human cerebral cortex reviewed for the in vivo situation is 18 (Gjedde, 2001). This ratio is associated with the lumped rate constant k of 0.34 min−1 listed in the middle panel of Table 4.
Baseline clearances of pyruvate and lactate
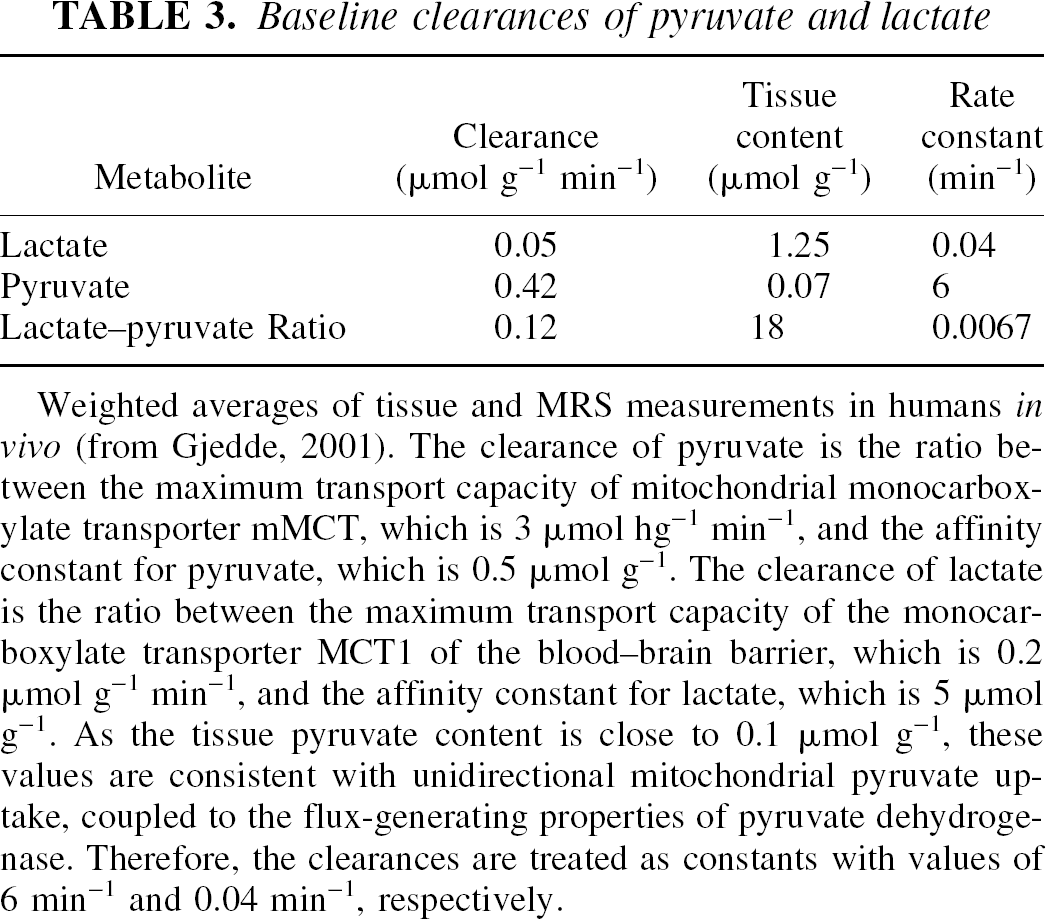
Weighted averages of tissue and MRS measurements in humans in vivo (from Gjedde, 2001). The clearance of pyruvate is the ratio between the maximum transport capacity of mitochondrial monocarboxylate transporter mMCT, which is 3 μmol hg−1 min−1, and the affinity constant for pyruvate, which is 0.5 μmol g−1. The clearance of lactate is the ratio between the maximum transport capacity of the monocarboxylate transporter MCT1 of the blood–brain barrier, which is 0.2 μmol g−1 min−1, and the affinity constant for lactate, which is 5 μmol g−1. As the tissue pyruvate content is close to 0.1 μmol g−1, these values are consistent with unidirectional mitochondrial pyruvate uptake, coupled to the flux-generating properties of pyruvate dehydrogenase. Therefore, the clearances are treated as constants with values of 6 min−1 and 0.04 min−1, respectively.
Pyruvate buffering as index of oxidativeness of metabolism at baseline and during activation of visual cortex
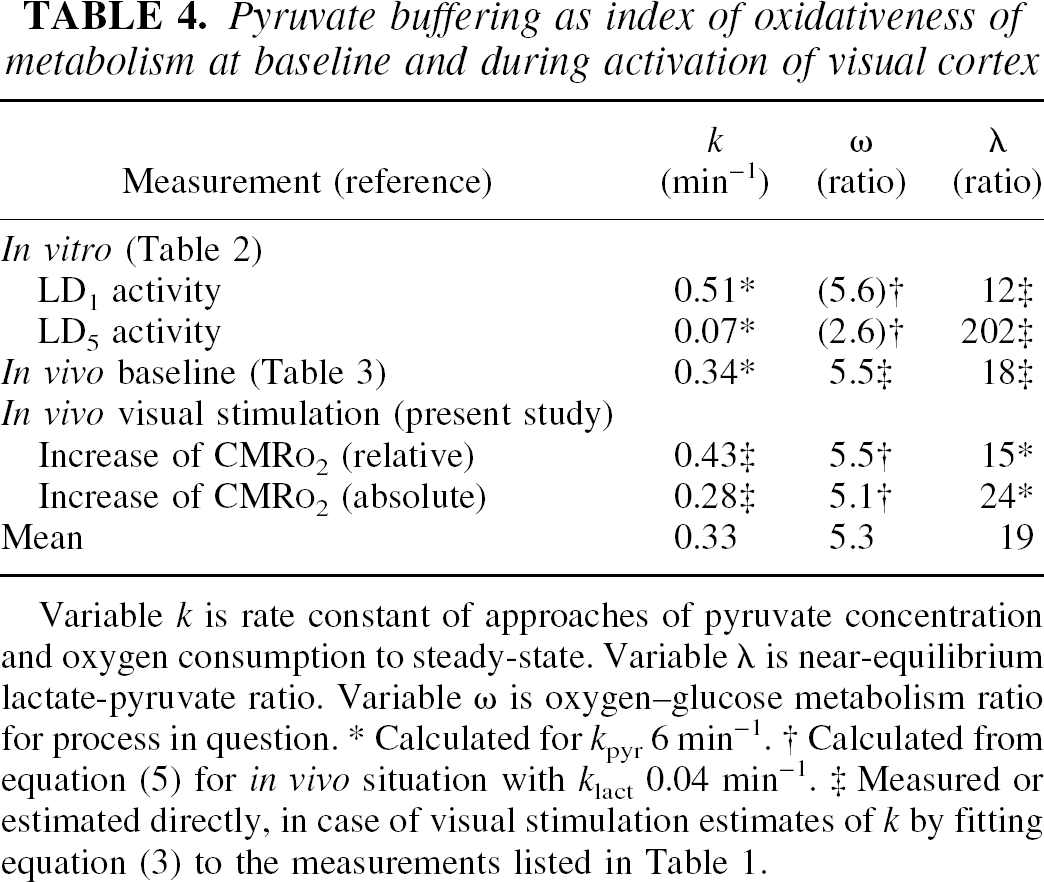
Variable k is rate constant of approaches of pyruvate concentration and oxygen consumption to steady-state. Variable λ is near-equilibrium lactate-pyruvate ratio. Variable ω is oxygen–glucose metabolism ratio for process in question.
Calculated for kpyr 6 min−1.
Calculated from equation (5) for in vivo situation with klact 0.04 min−1.
Measured or estimated directly, in case of visual stimulation estimates of k by fitting equation (3) to the measurements listed in Table 1.
Activated metabolism
We used Eqs. 2 and 6 to predict the changes of the pyruvate concentration (Eq. 2) and the oxygen consumption (Eq. 6), for two different LDH kinetic profiles shown in the left panel of Fig. 3, one consistent with the in vivo baseline situation dominated by the LD1 subtype shown in the middle panel of Table 4, the other indicating a switch to the more glycolytic time course dictated by the value of the oxygen–glucose metabolism ratio and the corresponding rate constant k for LD5 shown in the top panel of Table 5. The predictions yielded substantially different time courses of the change of CMRO2.
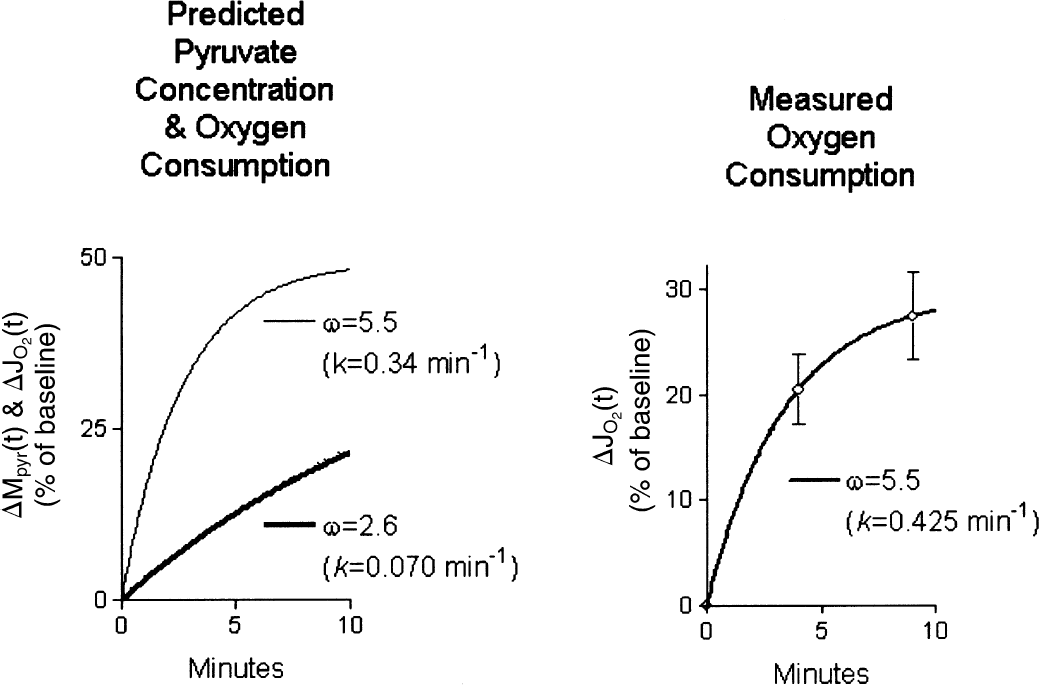
Predictions of rate of increase of oxidative metabolism differentiated by subtype of lactate dehydrogenase, according to Eqs. 2 and 3. Oxidative capacity associated with the presumed heart-type LDH was modeled with k = 0.34 min−1(λ = 18), and presumed muscle-type LDH with rate constant k = 0.070 min−1(λ = 200). Abscissae: minutes. Ordinates: increase (percentage of baseline). Left panel: Time course of relative increases of pyruvate concentration and oxygen consumption; the increase is greater for presumed heart-type with λ = 18 than for presumed muscle-type with λ = 200. Right panel: Estimation of rate constant of increase of oxidative metabolism, relative to baseline, calculated from measurements listed in Table 3. The rate constant of 0.425 min−1 is consistent with lactate–pyruvate ratio of 14.5, which is close to the normal average and hence consistent with normal lactate generation.
The value of the rate constant of approach during excitation was estimated by fitting Eq. 3 to both the relative and absolute changes of CMR o2 listed in Table 1. The relative change is shown in the right panel of Fig. 3. The regression yielded the average rate of increase of oxygen consumption of k =0.33 min−1, consistent with the activation of a population of cells with a kinetic profile of LDH close to that of the steady-state baseline with a rate constant of 0.34 min−1, consistent with a functional predominance of LD1 also during the continued neuronal excitation.
DISCUSSION
The current study has three results: oxidative metabolism of visual cortex rose significantly with continuous stimulation of human visual cortex with a motion- and contrast-rich stimulus; the supply of pyruvate accompanied the rise of oxidative metabolism at the onset of stimulation; and the additional supply of pyruvate accompanying the rise of oxygen consumption originated in a tissue compartment with a preponderance of the LDH subtype LD1, assumed to characterize neurons.
The coupling between blood flow and oxygen consumption during neuronal excitation is the subject of discussion among several schools of thought. Two questions are at the forefront of this discussion. The first question is whether neurons increase their oxidative metabolism during excitation. If they do, the second question is whether the increased metabolism is fueled more or less entirely by pyruvate produced from lactate generated in astrocytes. The findings of the current study support the claim that neurons increase their oxidative metabolism in proportion to an increase of pyruvate, generated by neuronal rather than astrocytic glycolysis.
Thus, the study does not support the extreme claim that neuronal oxygen consumption never rises substantially during excitation, the work being supported entirely by glycolysis in astrocytes and the resulting lactate being cleared by the circulation, nor does it support the equally extreme claim that neuronal excitation is supported entirely by oxidative metabolism fueled by lactate generated in astrocytes. Rather, the study shows that neuronal and astrocytic pathways of energy metabolism remain as distinct during neuronal excitation as they are at rest.
Although the current study is not the first yielding evidence of increased oxidative metabolism, earlier reports from us and others failed to detect any substantial increase in CMR o2 during binocular photic (Ribeiro et al., 1993) or vibrotactile stimulation (Ohta et al., 1999, Fujita et al., 1999, Fox et al., 1988). These findings rule out differences of method of analysis of the PET data as an explanation of the discrepancies among studies. In the current study, the stimulus was monocular and peripheral, extending between 5° and 20° from fixation, unlike the binocular 1.5° to 15.5° stimulation used in the earliest study, which failed to reveal a substantial increase of oxygen consumption (Fox et al., 1988). Also, previous investigators determined the increase relative to an eyes-closed rest condition. In the current study, stimulation was confined to the hemi-retina of the left eye to restrict the activation to the right hemisphere.
In previous studies, acquisition times ranged from 1 minute for a CBF measurement with [15O]water to 40 minutes for a CMR o2 measurement. Direct comparison of measurements obtained during such widely different durations is inherently difficult. In the earlier studies, scanning began after 30 seconds of stimulation and continued throughout the entire measurement, which ranged from 60 seconds to 5 minutes for the [15O]O2 studies.
Whereas the site of reception of the stimulus in the visual field may influence the metabolic demand (Tootell et al., 1988), there is sufficient overlap between the stimulus conditions of the current study and those performed by Fox et al. (1988) to conclude that the length of stimulation before scanning is the distinguishing variable in these studies.
The increases of oxygen consumption and the accompanying increases of ATP turnover imply that the neuronal work was elevated during the sustained stimulation. The increase is consistent with activity-driven changes in the heterogenous staining of cytochrome oxidase density (Wong-Riley, 1979; Horton and Hedley-Whyte, 1984; Livingstone and Hubel, 1984; Wong-Riley et al., 1993).
Although the mechanism by which some populations of neurons acquire greater densities of cytochrome oxidase remains unknown, the “blob” patterns of V1 (and thin-or thick-interstripe patterns in visual area V2) are modulated by neuronal activity (because elimination of firing activity eliminates the blobs) and are selective for different stimulus parameters such as contrast and color. It would be difficult to understand the activity-driven changes in cytochrome oxidase if no measurable increases in oxygen metabolism occurred during visual stimulation, such as are reported here.
A major question raised by the current results concerns the mechanism and importance of the apparent dependence of oxidative metabolism on the content of pyruvate in the cytosol. Although the mitochondrial LDH subtypes may clamp the mitochondrial pyruvate at a level that is too low to allow the PDH activity to rise without an increase of pyruvate, the converse cannot be concluded, that is, that the pyruvate concentration drives the oxidative metabolism. Rather, the results suggest that the role as true pathway substrate of the flux-generating PDH reaction is a function shared among several metabolites and factors. Equation 8 (see Appendix) suggests that changes of mitochondrial lactate and the kinetic properties of the mitochondrial LDH subtypes, expressed in ratios such as the mitochondrial lactate–pyruvate ratio λm, could maintain the constancy of the rate constant (kpyr) of pyruvate clearance from the cytosol.
For several reasons, the results of the current study render a hypothesis of astrocyte–neuron lactate shuttling unnecessary as an explanation. First, the hypothesis revives an ancient belief in the nurturing role of astrocytes, according to which astrocytic processes siphon glucose directly from the microvessels to neurons. The fallacy of this claim was exposed when it was definitively proven that the end feet of astrocytes form no part of the blood–brain barrier and hence do not restrict the use of glucose to astrocytes (Andriezen, 1893; Brightman and Reese, 1969; Brightman et al., 1970).
Second, the metabolism of astrocytes is not substantially less oxidative than that of neurons. According to recent measurements, the glycolytic metabolism of astrocytes represents 10 to 30% of the total; with an OGI of 5 (Silver and Erecinska, 1997). Because the energy requirements of glutamate uptake and amination in astrocytes account for no more than 5% of the oxidative total in rat brain (Shulman and Rothman, 1998), glutamate uptake and amination cannot be entirely glycolytically powered, because it then would account for all of glycolysis. The oxidativeness of the tissue metabolism may decline during some forms of neuronal excitation, but the current measurements reject that possibility for the annular checkerboard stimulus. Although other stimuli may exist for which the hypothesis is upheld, there is no evidence that such stimuli are handled physiologically in brain.
Third, although the lactate dehydrogenase and monocarboxylate transporter proteins have been presented as recently discovered key elements in the operation of the shuttle, neither protein, as catalyst of a near-equilibrium reaction, can be claimed to indicate a net direction of flux in vivo, nor is the discovery of these transporters novel (Oldendorf, 1973; Pardridge, 1981). On thermodynamic grounds, it can be argued that the rapid exchange of monocarboxylates among the compartments of brain tissue effectively rules out different kinetic properties of the cytosolic LDH subtypes in vivo. If the subtype differences do not exist in vivo, then the greater relative generation of lactate in astrocytes must be caused by a lower oxidative capacity, neurons and astrocytes contributing equal portions of pyruvate but supporting unequal rates of pyruvate oxidation. Only then does it follow that some of the pyruvate metabolized by neurons originated in astrocytes as pyruvate or lactate. It follows from Eq. 6 that differences among tissues with different oxygen–glucose metabolism ratios can be explained by different values of λ, related to the LDH kinetics, or of kpyr, related to mitochondrial density or activity, or both. If λ has the same effective value in all cells sharing the same pyruvate and lactate pools, kpyr is two- to three-fold higher in neurons than in astrocytes to explain the differential oxidativeness measured by Silver and Erecinska (1997). Similar arguments apply to subcellular compartments. In short, pyruvate is produced at the sites of glycolytic enzymes and oxidized at the sites of mitochondria.
Fourth, although glycolysis of deoxyglucose can be inhibited by blockade or elimination of glutamate transport in vivo, this inhibition itself does not prove that glycolysis is confined to astrocytes. Therefore, the finding does not directly address the question of the site of the increased glycolysis accompanying neuronal excitation in vivo (Kojima et al., 1999; Tanaka et al., 1997). For example, it is possible that the blockade of glutamate transport directly or indirectly interferes with neuronal resynthesis and release of glutamate.
The current evidence is consistent with observations that neurons supply and use the same share of the brain's pyruvate at rest and during activation. The increased CMR o2 observed in this study is relevant to the understanding of the so-called blood oxygenation level-dependent functional MRI signal, inasmuch as this signal is quenched when CMR o2 rises. The finding yields the prediction that the current stimuli may cause blood oxygenation level-dependent signals to fade rapidly as the increase of CMR o2 approaches the increase of CBF.
In conclusion, excitation unleashes a sequence of metabolic events leading to an increase of blood flow, possibly preceded by a few seconds' exhaustion of a small tissue oxygen reserve (“initial dip”). The increased blood flow raises tissue oxygen reserves in anticipation of a subsequent increase of oxygen consumption (Vafaee and Gjedde, 2000). The excitation raises neuronal and astrocytic glycolysis rates, and the pyruvate content and oxygen consumption rise until a new steady state is reached, unless stimulation ceases. The new steady state of oxygen consumption is defined by the strength and adequacy of the stimulus and the oxidative capacity of the tissue. The excessively increased blood flow at the onset of stimulation can be viewed as a hemodynamic response function akin to the central command regulation of systemic hemodynamics in the case of muscle work (Nowak et al., 1999).
Footnotes
APPENDIX
The appendix explains in greater detail the possible reasons for the approximate constancy of the rate constant of the cytosolic pyruvate clearance, kpyr, for the duration of a given functional metabolic state. This constancy makes the flux of pyruvate effectively proportional to its concentration. One reason is pharmacokinetic, the other analytic. The reasons include the discovery of a lactate shuttle between the cytosol and the mitochondria, mediated by the mMCT transporter (Brooks et al., 1999). The rate constant of the cytosolic pyruvate clearance is defined as,
where Jpyr is the net flux of pyruvate from the cytosol into mitochondria and Mpyr the content of pyruvate in cytosol.
Pharmacokinetically, the flux of pyruvate from the cytosol is mediated by the bidirectional mitochondrial transporter of monocarboxylic acids (mMCT), which also transports lactate,)
where Tmax is the maximal transport capacity and Mpyr is the pyruvate content of the cytosol. The ratio λ is the near-equilibrium lactate–pyruvate ratio in the cytosol, and λm is the lactate–pyruvate ratio of the mitochondria, both influenced by the NAD+–NADH ratio and pH in the respective compartments. The ratio χlact is the lactate concentration relative to the Michaelis constant of the transporter toward lactate. Because the LDH subtypes of cytosol and mitochondria catalyze near-equilibrium reactions, these ratios must be approximately equal in cytosol and mitochondria, in keeping with the observation that the LDH subtypes of mitochondria are the same as those of the cytosol. The presence of the lactate shuttle between cytosol and mitochondria clamps the pyruvate ratio between cytosol and mitochondria at the high λm /λ ratio and turns the activity of the PDH complex, equal to the net flux mediated by the mMCT, effectively into a function of the pyruvate content of the cytosol,
where Vmax and Km are the actual Michaelis constants of the PDH complex toward pyruvate. Thus, the activity relative to the concentration is,
where the λm ratio, as a function of the NAD+–NADH ratio and the pH of the mitochondrion, is two orders of magnitude greater than the λ ratio, as a function of the NAD+–NADH ratio and the pH of the cytosol. This difference renders the rate of pyruvate dehydrogenation independent of the pyruvate concentration in the mitochondrion, or the rate of pyruvate dehydrogenation proportional to the pyruvate content of the cytosol,
from which it follows that the rate of transport also must be approximately unidirectional, and the rate constant of transport must be approximately independent of the pyruvate content.
Analytically, the monoexponential approach of oxygen consumption toward a steady-state increment of ΔJO2, with a rate constant of k, is commensurate with pyruvate clearance from the cytosol with a rate constant of,
where ΔJO2 and ΔJglc are the steady-state increments of oxygen and glucose consumptions, respectively, the former as a monoexponential approach, the latter as an instantaneous increase. To obtain this result, let pyruvate clearance from the cytosol occur at the variable rate of ΔJO2 (t)/3 rather than in direct proportion to Mpyr (see Fig. 1),
It follows that the solution to this modification of Eq. 1 is,
When the change of oxygen consumption approximates a monoexponential approach to a steady-state increment,