
Abstract
Ischemic tolerance in brain develops when sublethal ischemic insults occur before “lethal” cerebral ischemia. Two windows for the induction of tolerance by ischemic preconditioning (IPC) have been proposed: one that occurs within 1 hour after IPC, and another that occurs 1 or 2 days after IPC. The authors tested the hypotheses that IPC would reduce or prevent ischemia-induced mitochondrial dysfunction. IPC and ischemia were produced by bilateral carotid occlusions and systemic hypotension (50 mm Hg) for 2 and 10 minutes, respectively. Nonsynaptosomal mitochondria were harvested 24 hours after the 10-minute “test” ischemic insult. No significant changes were observed in the oxygen consumption rates and activities for hippocampal mitochondrial complexes I to IV between the IPC and sham groups. Twenty-four hours of reperfusion after 10 minutes of global ischemia (without IPC) promoted significant decreases in the oxygen consumption rates in presence of substrates for complexes I and II compared with the IPC and sham groups. These data suggest that IPC protects the integrity of mitochondrial oxidative phosphorylation after cerebral ischemia.
Numerous studies support the hypothesis that reperfusion after cerebral ischemia contributes substantially to ischemic injury (Chan, 1994; Choi, 1993; Siesjo and Smith, 1991; Watson and Ginsberg, 1989) and that mitochondrial dysfunction may be involved as an injury mechanism (Abe et al., 1995; Ankarcrona et al., 1995; Saris and Eriksson, 1995; Schinder et al., 1996; White and Reynolds, 1996, 1997).
Evidence for mitochondrial dysfunction has been described by many investigators. Others and we have shown that the postischemic brain exhibits prominent changes in redox activity of mitochondrial respiratory chain components in vivo and in vitro (Pérez-Pinzón et al., 1997a, 1997b, 1998a, 1998b; Rosenthal et al., 1995; Welsh et al., 1982, 1991). Mitochondria isolated from ischemic brain exhibited decreases in state 3 respiratory rates of approximately 70% with NAD-linked respiratory substrates (Sciamanna et al., 1992). Cafe et al. (1994) showed that nonsynaptosomal mitochondria were insensitive to ischemia but that they became dysfunctional in the late reperfusion phase. Mitochondria from synaptic terminals were greatly affected by ischemia but partially recovered during reperfusion. Sims and Pulsinelli (1987) also report that in rat model of forebrain transient ischemia, the rate of oxygen consumption decreases in the CA1, CA3, and CA4 regions in the late reperfusion phase. This study was performed in homogenates from different brain subregions.
Postischemic mitochondrial redox state has been characterized by shifts toward oxidation (hyperoxidation) of respiratory chain components (Pérez-Pinzón et al., 1997a, 1997b, 1998a, 1998b; Rosenthal et al., 1995). This hyperoxidation of electron carriers has been interpreted as either a response to decreased substrate availability (Rosenthal et al., 1995) or a reaction of mitochondrial complexes to reactive oxygen species (ROS) (Pérez-Pinzón et al., 1997a). Postischemic mitochondria also may be a major source of ROS, and free radical-mediated damage has been linked to reperfusion injury after brain ischemia (Flamm et al., 1978; Fridovich, 1979; Hall et al., 1993; Kontos, 1989; Siesjo et al., 1985; Vlessis et al., 1990). However, recent findings suggest that this hyperoxidation may result from loss of electron carriers, such as cytochrome c and NADH, from mitochondria after ischemia (Pérez-Pinzón et al., 1999a). The loss of cytochrome c from mitochondria might affect respiratory chain activity or it may trigger the apoptotic cascade (Charriaut-Marlangue et al., 1996; Nitatori et al., 1995). This is suggested by findings that apoptosis (programmed cell death) may be linked to mitochondria and their release of cytochrome c (Ankarcrona et al., 1995; Kluck et al., 1997; Schinder et al., 1996; Yang et al., 1997).
Ischemic preconditioning (IPC) refers to the ability of a brief (“sublethal”) ischemic episode, followed by a period of reperfusion, to increase an organ's resistance to injury (ischemic tolerance) after a subsequent ischemic event. This induction of tolerance to ischemia resulting from sublethal ischemic or anoxic insults has gained attention as a robust neuroprotective mechanism against conditions of stress such as anoxia or ischemia in heart and brain (Alkhulaifi et al., 1993; Kato et al., 1992; Lin et al., 1992, 1993;Murry et al., 1986; Walker et al., 1993).
A suggested mechanism of neuroprotection by IPC may involve the protection of mitochondria. We recently found that anoxic preconditioning did not protect hippocampal slices against mitochondrial hyperoxidation (Centeno et al. 1999). This type of preconditioning paradigm involves the first window of preconditioning: neuroprotection (i.e., the time between IPC and ischemia is only 30 minutes). It is known that IPC neuroprotection is more robust in the second window that develops over days (i.e., when the time between IPC and ischemia is 1 to 3 days). Thus, we decided to test the hypothesis that IPC would protect mitochondria in this second window.
MATERIALS AND METHODS
Chemicals
All chemicals were of analytical grade and were purchased from Sigma (St. Louis, MO, U.S.A.). The protein assay kit was purchased from Bio-Rad (Hercules, CA, U.S.A.)
Animal model
All animal procedures were carried out in accordance with the Guide for the Care and Use of Laboratory Animals published by the National Institutes of Health and were approved by the Animal Care Committee of the University of Miami. Male Wistar rats weighing 250 to 300 g were fasted overnight and then anesthetized with 3% halothane and 70% nitrous oxide (in a balance of oxygen) by inhalation. The femoral arteries were cannulated for blood pressure measurements and for arterial sampling of blood gases. Arterial blood gases (178 pH/blood gas analyzer, Ciba-Corning), plasma glucose levels (One Touch glucose monitor, Lifescan), and hematocrit were measured intermittently throughout the experiment. Goals were to maintain blood gases in the normal range (arterial P co2 = 35 to 40 mm Hg, P o2 120 to 140 mm Hg). If this range was not maintained throughout the period of surgery and data collection, the rats were discarded and data were not further analyzed. The rats underwent endotracheal intubation and were artificially ventilated with 0.5% halothane and 70% nitrous oxide (in a balance of oxygen). The rats were immobilized with pancuronium bromide (0.75 mg/kg intravenously). Both common carotid arteries were exposed by a midline ventral incision and gently dissected free of surrounding nerve fibers. Ligatures of polyethylene (PE-10) tubing, contained within a double-lumen Silastic tubing, were passed around each carotid artery. Brain temperature was monitored with a 33-gauge thermocouple implanted in the temporalis muscle (Dietrich et al., 1993). The temperature was maintained at 36° to 37°C throughout the experiment by a small warming lamp placed above the animal's head.
Production of cerebral ischemia
Before each ischemic insult, blood was gradually withdrawn from the femoral vein into a heparinized syringe to reduce systemic blood pressure to 50 mm Hg. Cerebral ischemia then was produced by tightening the carotid ligatures bilaterally. We have previously shown that this procedure promotes loss of ion homeostasis (anoxic depolarization as measured with potassium-selective microelectrodes), as well as histopathologic changes (Pérez-Pinzón et al., 1997a). To allow postischemic reperfusion, the carotid ligatures were removed, and the shed blood was reinjected into the femoral vein. This infusion usually restored mean arterial blood pressure to 130 to 140 mm Hg. The vessels were inspected to verify that perfusion was re-established. The only difference between the “test” ischemic insult and the ischemic preconditioning insult was the duration of the insult. Test ischemia was of 10 minutes' duration, whereas preconditioning ischemia was only of 2 minutes' duration. Descriptions for all groups are as follows:
Sham: Sham surgery was performed on the animals 24 hours before killing.
Ischemia: Ten minutes of ischemia was induced 24 hours before killing.
IPC: Two minutes of ischemia (IPC) was induced 24 hours before test ischemia (group 2).
Animals were killed 24 hours thereafter.
Isolation of brain mitochondria
Hippocampal and striatal mitochondria were isolated according to a procedure described previously with minor modification (Dunkley et al., 1988). In brief, rats were decapitated under halothane anesthesia 24 hours after ischemia or sham operation. The hippocampus and striatum were removed immediately and immersed into cold (4°C) isolation medium. The average weight of hippocampus and striatum in all animal groups was approximately 120 mg and 70 mg (pooled from both hemispheres), respectively. Isolation medium consisted of 250 mmol/L sucrose, 1 mg/mL bovine serum albumin (fraction V) (BSA), 1.0 mmol/L ethylenediaminetetraacetic acid, and 0.25 mmol/L dithiothreitol pH 7.4. Tissue was minced with a pair of scissors and rinsed thoroughly with the isolation medium. The minced tissue then was suspended in isolation media containing nagarse (2.5 mg/g tissue) (Lee et al., 1993). The minced tissue was incubated in this solution for 2 minutes. At the end of the incubation, tissue was homogenized in a hand-operated glass Teflon homogenizer by seven up-and-down strokes. The homogenate was diluted to yield 10% (W/V) homogenate. The homogenate was centrifuged at 500 ×g for 5 minutes in Sorvall RC5 centrifuge. The supernatant was collected in another tube. To get enough yield of mitochondria (sufficient to perform measurements of respiratory control index (RCI), adenosine diphosphate-to-oxygen (ADP—O) ratio, respiration in presence of three different set of substrates and activities of complexes I to IV), the pellet was rehomogenized and diluted to 10% (W/V). The resulting homogenate was centrifuged at 500 ×g for 5 minutes in Sorvall RC5 centrifuge. The supernatant then was pooled with the supernatant obtained from the previous centrifugation. The pooled supernatant was layered on the Percoll gradient. The gradients were prepared in 3.0 mL polycarbonate tubes and consisted of 0.6 mL each of 23, 15, 10, and 3% (vol/vol) Percoll. The gradients were centrifuged at 32,500 ×g for 5 minutes. The nonsynaptic mitochondrial pellet was collected from the bottom of the 23% Percoll layer. The nonsynaptic pellet was washed once with isolation media, using 3.0 mL polycarbonate tubes, by centrifugation at 15,000 ×g for 10 minutes. The resulting pellet then was washed with 0.25 mol/L sucrose. Using 3.0 mL polycarbonate tubes, by centrifugation at 15,000 g for 10 minutes. The resulting nonsynaptic mitochondrial pellet then was suspended in 0.25 mol/L sucrose to give approximately 0.75 to 1.5 mg protein per milliliter. This suspension was used as a source of mitochondria in all the experiments. The entire procedure was completed within 1 to 1.5 hours. All operations were carried out at 4°C.
Polarographic studies in isolated mitochondria
Substrate oxidation rates and phosphorylating capacities of isolated mitochondria were determined polarographically and were carried out essentially according to the procedure of Hofhaus et al. (1996). In brief, oxygen consumption was measured polarographically in a medium containing 150 mmol/L sucrose, 25 mmol/L Tris–HCl (pH 7.4) and 10 mmol/L potassium phosphate buffer (pH 7.4) using a 0.25 mL-capacity incubation chamber with a water jacket (30°C) and a Clark-type oxygen electrode (Hansatech Instruments). The medium inside of the chamber was stirred continuously using an electromagnetic bar stirrer. The oxygen electrode was connected to a computer, and oxygraphs were recorded using oxygraph software (Hansatech Instruments).
The RCI and ADP–O ratios were measured in presence of 5 mmol/L pyruvate and 2.5 mmol/L malate. For this experiment, 0.03 to 0.05 mg mitochondrial protein was added into the assay. The RCI is defined as the ratio of the respiratory rate in presence and absence of ADP (i.e., state 3/state 4) (Chance and Williams, 1956). In brief, the slope of state 3 respiration was calculated from the oxygraphs. We assume that 1 mL of buffer contains 230 nmol O2 at 30°C when equilibrated against air at 1 ATA. Based on this, the oxygen content in the respiration buffer used in the microassay chamber (0.25 mL) was calculated. From these estimates, the oxygen consumption was calculated during state 3 respiration from the slope of the oxygraph (Fig. 1A). Similar calculations are carried out for state 4 but in the absence of ADP.
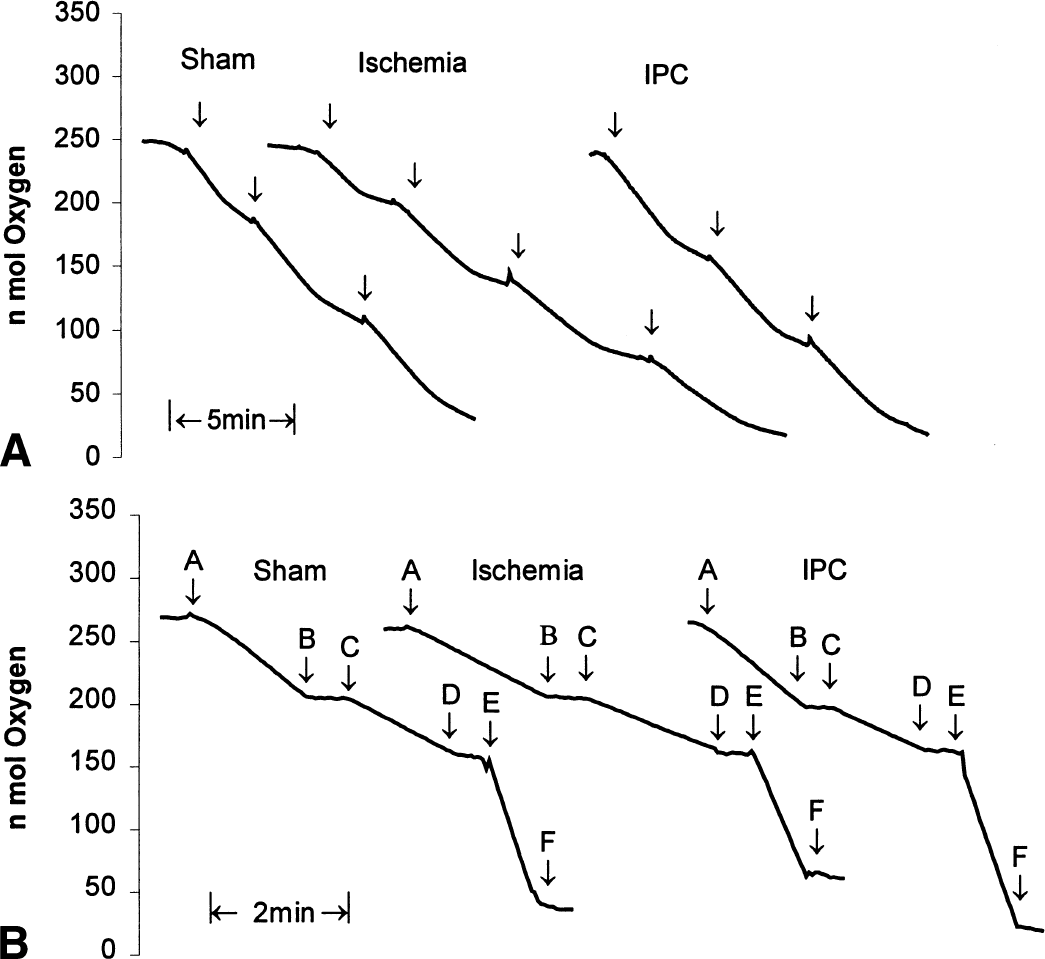
Typical polarographic traces for the three animal groups.
The ADP–O ratios were measured polarographically, as described earlier (Chance and Williams, 1956). In brief, ADP–O ratio is defined as moles of ADP phosphorylated per moles of oxygen consumed (slope of state 3 over the time required for total consumption of the ADP added to the buffer).
For substrate oxidation, 0.03 to 0.05 mg mitochondrial protein was added into the assay. The experiment was performed in a media as described earlier. The oxidation of 5 mmol/L pyruvate plus 2.5 mmol/L malate was measured in the presence of excess ADP (0.5 mmol/L final concentration). The rate of oxygen consumption was recorded for up to 2 to 3 minutes. The reaction was inhibited by addition of 10 μL rotenone (5 μmol/L), a complex I inhibitor. In the same assay, 8 mmol/L succinate plus 4 mmol/L glycerol-3-phosphate was added. The rate of oxygen consumption was recorded up to 2 to 3 minutes. The reaction was inhibited by addition of 10 μL antimycin (10 μmol/L), a complex III inhibitor. In the same assay, 0.5 mmol/L ascorbate plus 200 μmol/L N,N,N′,N′–tetramethyl-p-phenylenediamine (TMPD) was added. The rate of oxygen consumption was recorded up to 1 to 2 minutes. The reaction was inhibited by addition of 3 μL potassium cyanide (0.2 mol/L).
Spectrophotometric studies in isolated mitochondria
The measurement of the specific activity of the individual complexes of the respiratory chain was performed spectrophotometrically, as described by Rustin et al. (1994). A total of 20 to 40, 5 to 10, 1 to 5, and 7 to 15 μg of mitochondrial protein was used to determine the activities of complexes I, II, III, and IV, respectively. Assays of all four complexes were performed at 37°C. The volume of reaction was 1.0 mL in the case of each complex.
Measurements of rotenone-sensitive NADH-decylubiquinone oxidoreductase (complex I)
The assay was performed at 340 nm using the acceptor decylubiquinone (50 μmol/L) and 0.8 mmol/L NADH as a donor, in 10 mmol/L Tris-HCl buffer (pH 8.0) medium containing 1 mg/mL BSA. To make the mitochondrial internal membrane permeable to NADH, mitochondria were incubated with H2 O for 3 minutes at 37.5°C. Using 3 μmol/L rotenone allowed us to quantify the rotenone-sensitive activity.
Measurements of succinate decylubiquinone dichlorophenol indophenol reductase (complex II)
The assay was performed at 600 nm using 80 μmol/L dichlorophenol indophenol as the acceptor and 10 mmol/L succinate as the donor in a medium containing 10 mmol/L KH2 PO4 (pH 7.8), 2 mmol/L ethylenediaminetetraacetic acid, and 1 mg/mL BSA in the presence of 50 μmol/L decylubiquinone, 3 μmol/L rotenone, and 0.2 mmol/L adenosine triphosphate (ATP) and 0.3 mmol/L potassium cyanide. The addition of 10 mmol/L malonate inhibited the oxidation of succinate.
Measurements of decylubiquinone cytochrome c reductase (complex III)
The assay was performed at 550 nm using 40 μmol/L cytochrome c (oxidized) as the acceptor and 50 mmol/L duroquinol as the donor in the medium containing 10 mmol/L KH2 PO4 (pH 7.8), 2 mmol/L ethylenediaminetetraacetic acid, and 1 mg/mL BSA in the presence of 0.3 μmol/L rotenone, 10 mmol/L succinate, 0.2 mmol/L ATP, and 0.3 mmol/L KCN. The addition of 0.4 μmol/L antimycin A allowed us to distinguish between the reduction of cytochrome c catalyzed by complex III and the nonenzymatic reduction of cytochrome c by the reduced quinone. The initial rate of cytochrome c reduction was used for the calculation of activity.
Measurement of cytochrome c oxidase (complex IV)
The assay was performed at 550 nm using 50 μmol/L cytochrome c (reduced) as the donor, in an isosmotic medium (10 mmol/L phosphate buffer, 0.3 mol/L sucrose, pH 6.5, 1 mg/mL BSA) after making the external mitochondria membrane permeable with 2.5 mmol/L lauryl maltoside. The initial rate of cytochrome c reduction was used for the calculation of activity.
Proteins were measured using the Bio-Rad protein assay kit based on the method of Bradford (Bradford, 1976). Bovine serum albumin was used as standard.
Statistical analysis
Comparisons were made among the three groups with analysis of variance, and specific differences among the three groups were obtained with a Bonferroni's post-hoc test. All data are expressed as a mean plus/minus the standard deviation.
RESULTS
Table 1 summarizes the physiologic variables in each animal group. Mean arterial blood pressure was held at 50 mm Hg during ischemia. All other physiologic variables remained unchanged throughout the experiment in all three groups.
Physiological parameters
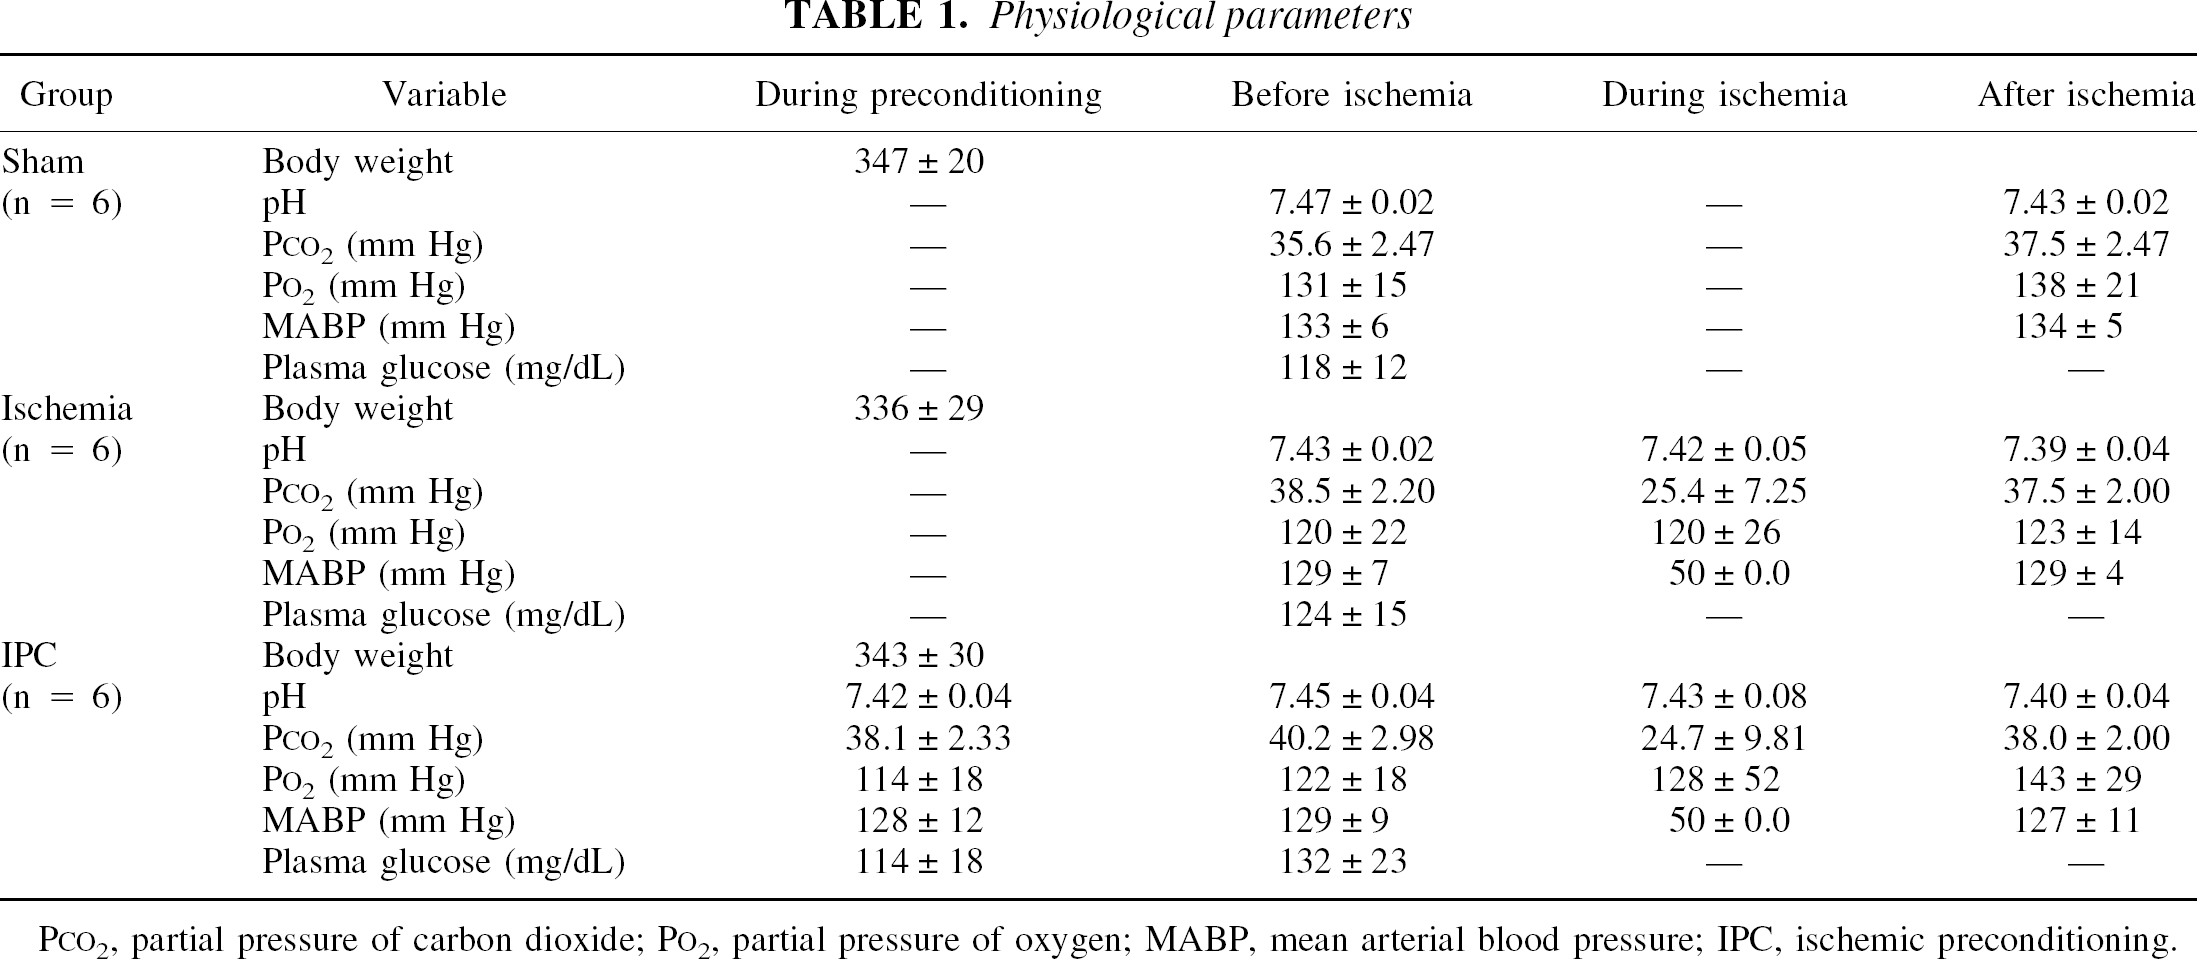
PCO2, partial pressure of carbon dioxide; PO2, partial pressure of oxygen; MABP, mean arterial blood pressure; IPC, ischemic preconditioning.
Mitochondrial yields from hippocampus and striatum were 400 to 600 μg and 350 to 450 μg protein per brain, respectively. Statistical analysis comparing the yield of mitochondrial protein from hippocampus and striatum in all three groups was carried out. This was important to determine whether the yield of mitochondria among the three groups was similar because it has been suggested that ischemia may yield weaker mitochondria, which may be damaged during the fractionation procedure. No significant differences were found among the three groups under scrutiny. In the case of hippocampus, the yield of mitochondria was 0.50 ± 0.01 mg (n = 9), 0.49 ± 0.03 mg (n = 8), and 0.49 ± 0.03 mg (n = 8) in control, ischemic, and IPC groups, respectively. In the case of striatum, the yield of mitochondria was 0.42 ± 0.03 mg (n = 8), 0.45 ± 0.03 mg (n = 7), and 0.43 ± 0.03 mg (n = 9) in control, ischemic, and IPC groups, respectively.
Hippocampus
Figure 1A shows typical examples of the oxygen consumption traces obtained from hippocampal nonsynaptic mitochondria in all three groups to determine state 3 and 4 respiration rates. Mean state 3 and 4 rates in the nonsynaptic mitochondria isolated from the hippocampus are shown in Fig. 2. In the ischemic group, mean state 3 respiration rates were significantly lower by approximately 37% (P < 0.01) and 36% (P < 0.01) compared with the sham and IPC groups, respectively. Even though lower rates were observed in state 4 in the ischemic group as well, when compared with the sham and IPC groups, these differences were not significant. No significant differences were observed in state 3 and 4 between the sham and the IPC groups.
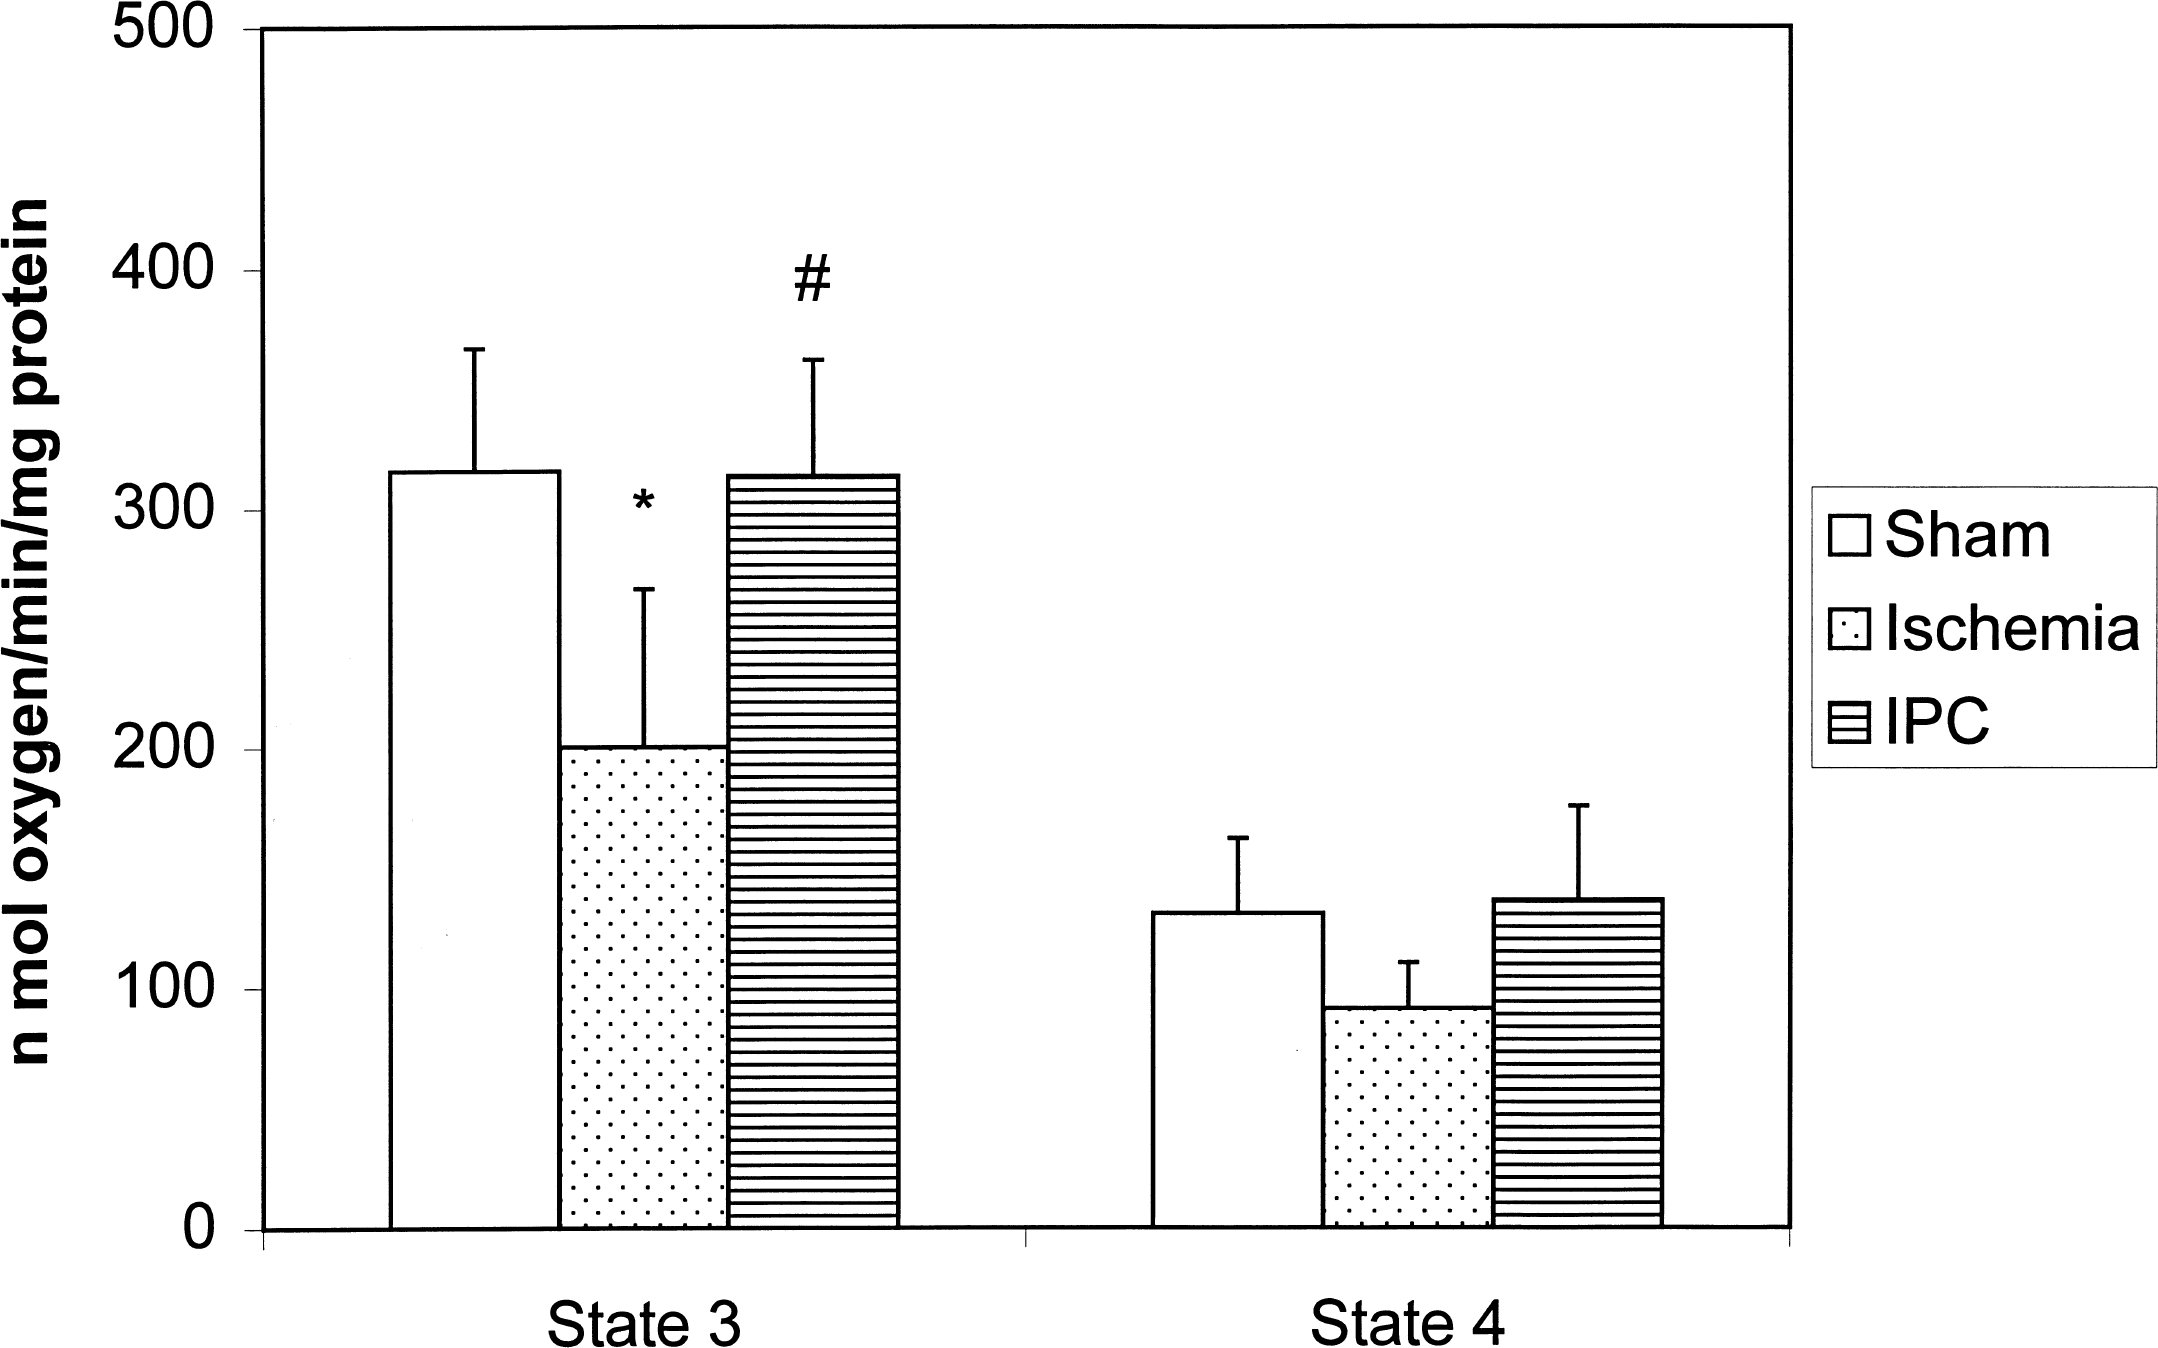
State 3 and 4 respiration rates in nonsynaptic mitochondria isolated from hippocampus of ischemic (n = 6), ischemic preconditioning (IPC, n = 7), and sham (n = 6) groups. Rate of oxygen consumption was measured in the presence and in absence of ADP. *, P < 0.01 ischemia versus sham group; #, P < 0.01 ischemia versus IPC group.
Mean RCI (ratio of state 3 and state 4 respiration) and ADP–O ratios in the nonsynaptic mitochondria isolated from hippocampus are shown in Table 2. Although both RCI and ADP–O values decreased in the ischemia group compared with sham and IPC groups, these differences were not statistically significant.
Respiratory control ratio (RCI) and ADP/O ratios in nonsynaptic mitochondria isolated from hippocampus of ischemic and ischemic-preconditioned rats
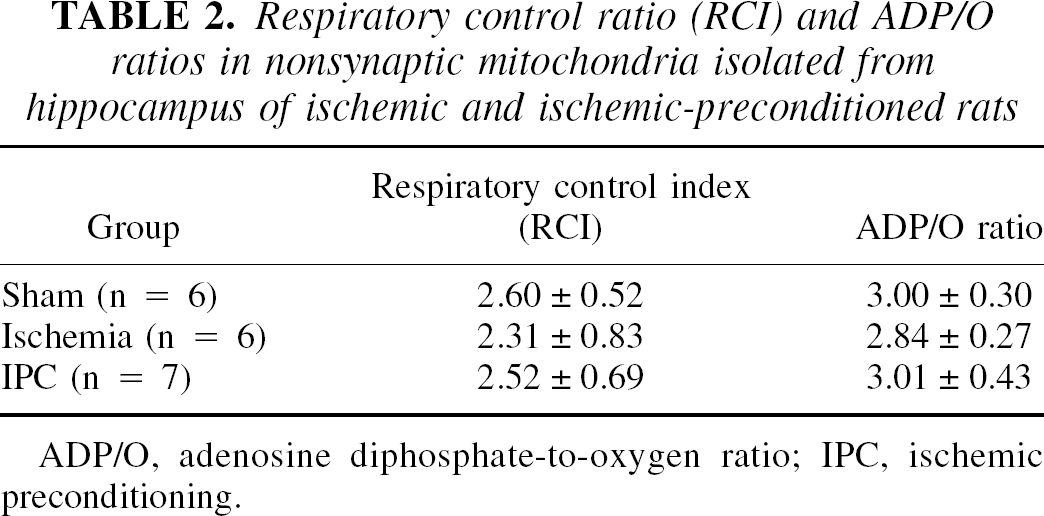
ADP/O, adenosine diphosphate-to-oxygen ratio; IPC, ischemic preconditioning.
To investigate further the function of mitochondrial respiratory chain complexes, we measured the rate of oxidation of different substrates in nonsynaptic mitochondria isolated from hippocampus. Figure 1B shows typical examples of the oxygen consumption traces obtained from hippocampal nonsynaptic mitochondria in all three groups to determine the rate of oxidation of different substrates.
Figure 3 shows the mean rate of respiration in nonsynaptic mitochondria isolated from hippocampus in the presence of different substrates. When pyruvate and malate were added as substrates, oxygen consumption in the ischemic group was lower by 34% (P < 0.05) and 37% (P < 0.01) compared with the sham and IPC groups, respectively. No significant differences were found between the sham and IPC groups.
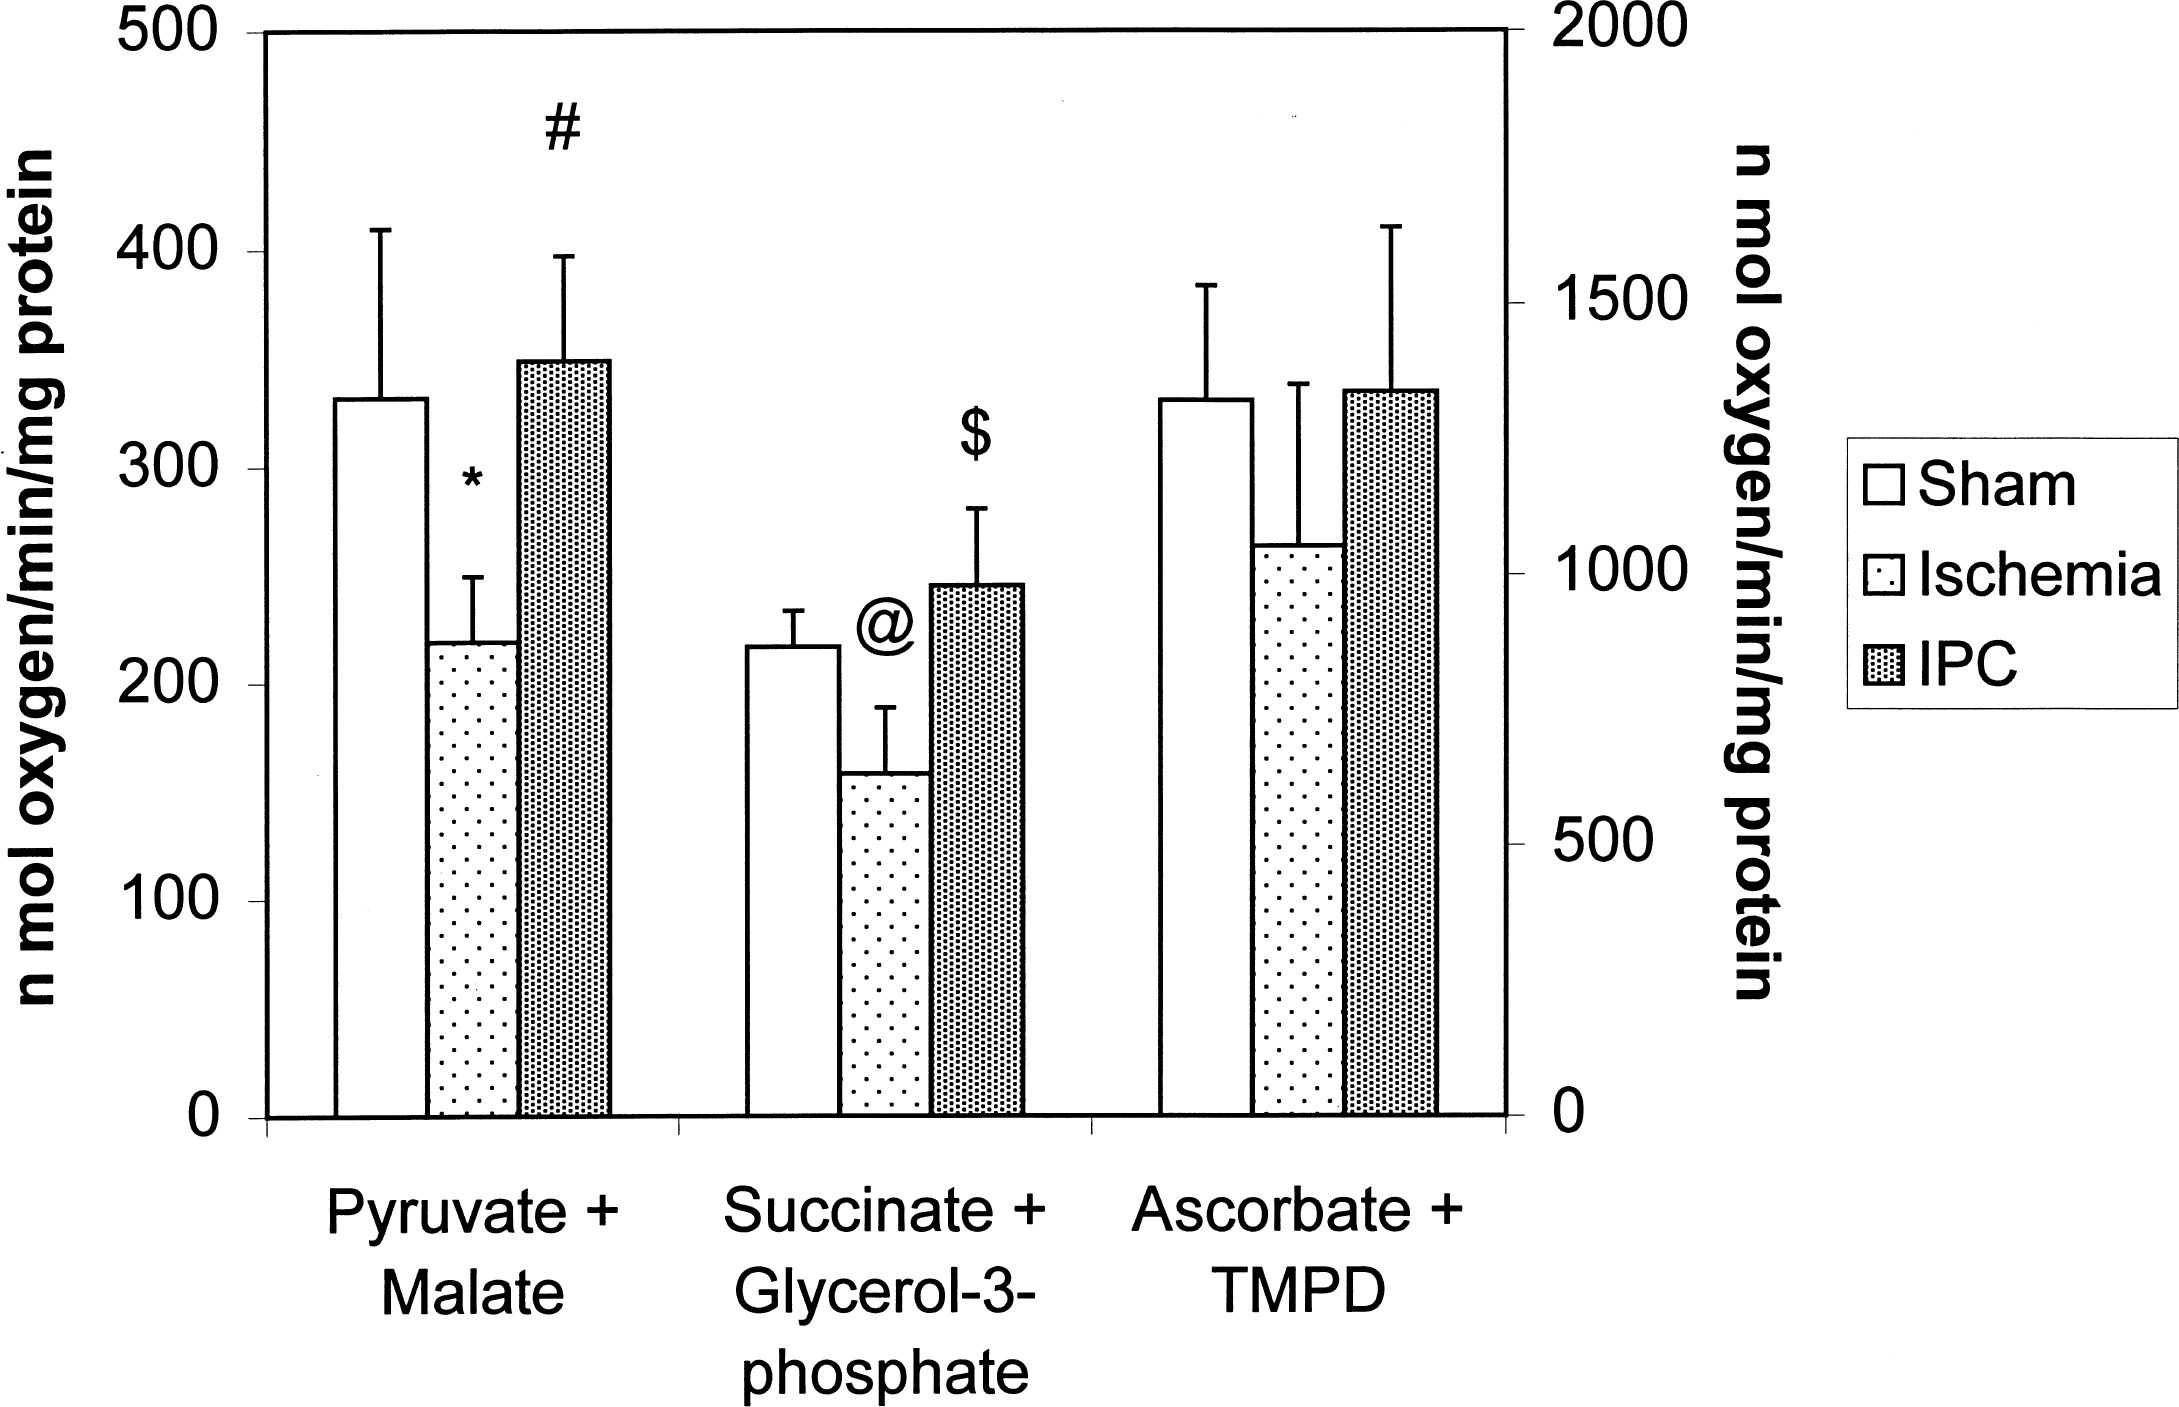
Substrate oxidation rates in nonsynaptic mitochondria isolated from hippocampus of ischemic (n = 7), ischemic preconditioning (IPC, n = 6), and sham (n = 7) groups. Left abscissa represents data from pyruvate—malate and succinate—glycerol-3-phosphate; right abscissa represents data from ascorbate plus tetramethyl-p-phenylenediamine (TMPD). *, P < 0.05 ischemia versus sham; #, P < 0.01 ischemia versus ischemic preconditioning (IPC); @, P < 0.01 ischemia versus sham; $, P < 0.001 ischemia versus IPC.
When succinate and glycerol-3-phosphate were added as substrates, oxygen consumption in the ischemic group was lower by 27% (P < 0.01) and 36% (P < 0.001) when compared with the sham and IPC groups, respectively. No significant differences were found between the sham and IPC groups.
Oxygen consumption of mitochondria isolated from sham, IPC, and ischemic groups was not significantly different when ascorbate and TMPD were added as substrates. However, this rate was lower in the ischemic group by approximately 20% and 21% when compared with the sham and IPC groups, respectively.
Based on these differences in respiration rates among groups, we further analyzed changes in specific mitochondrial enzymatic complex activities. These data are presented in Table 3. There was a trend in which complex I and IV activities were decreased in the ischemic group when compared with the sham and IPC groups. However, these differences were not statistically significant.
Complex I, II, III, and IV activities in nonsynaptic mitochondria isolated from hippocampus of ischemic and ischemic-preconditioned rats
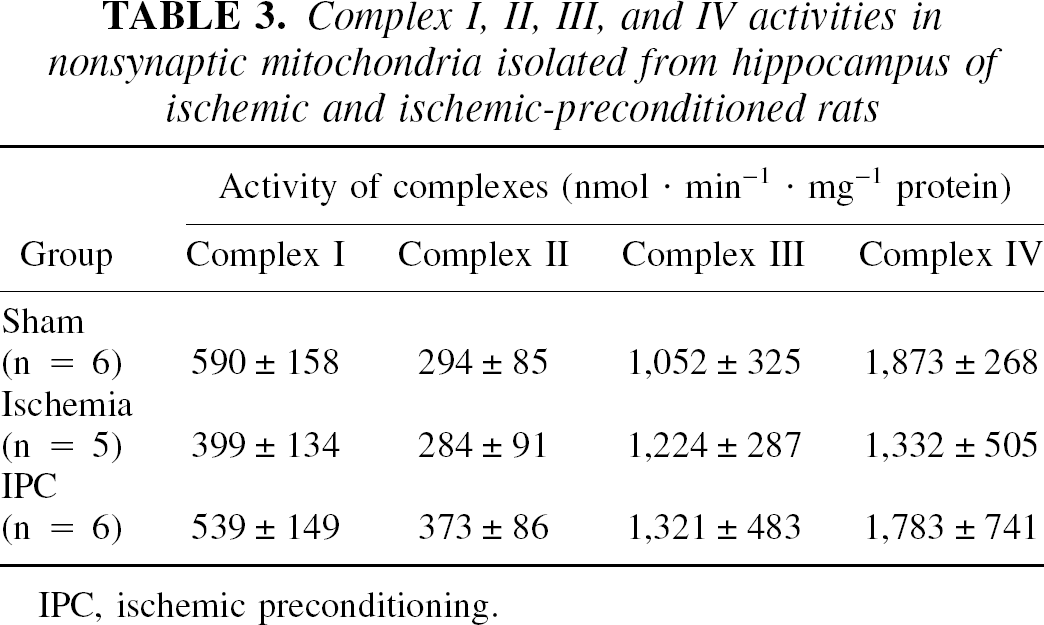
IPC, ischemic preconditioning.
Striatum
Mean state 3 and 4 rates, RCI, and ADP–O ratios are presented in Table 4. No significant differences were found in any of these values among groups. However, strong trends toward inhibition of these values were observed in state 3 and 4 rates in the ischemic group compared with sham and IPC groups. In the ischemic group, mean state 3 and state 4 respiration rates were lower by 29% and 31%, respectively compared with sham group. Mean state 3 and 4 respiration rates were 29% and 27% lower, respectively, in the ischemic group compared with the IPC group.
State 3 and state 4 respiration rates, respiratory control ratio (RCI), and ADP/O ratios in nonsynaptic mitochondria isolated from striatum of ischemic and ischemic-preconditioned rats
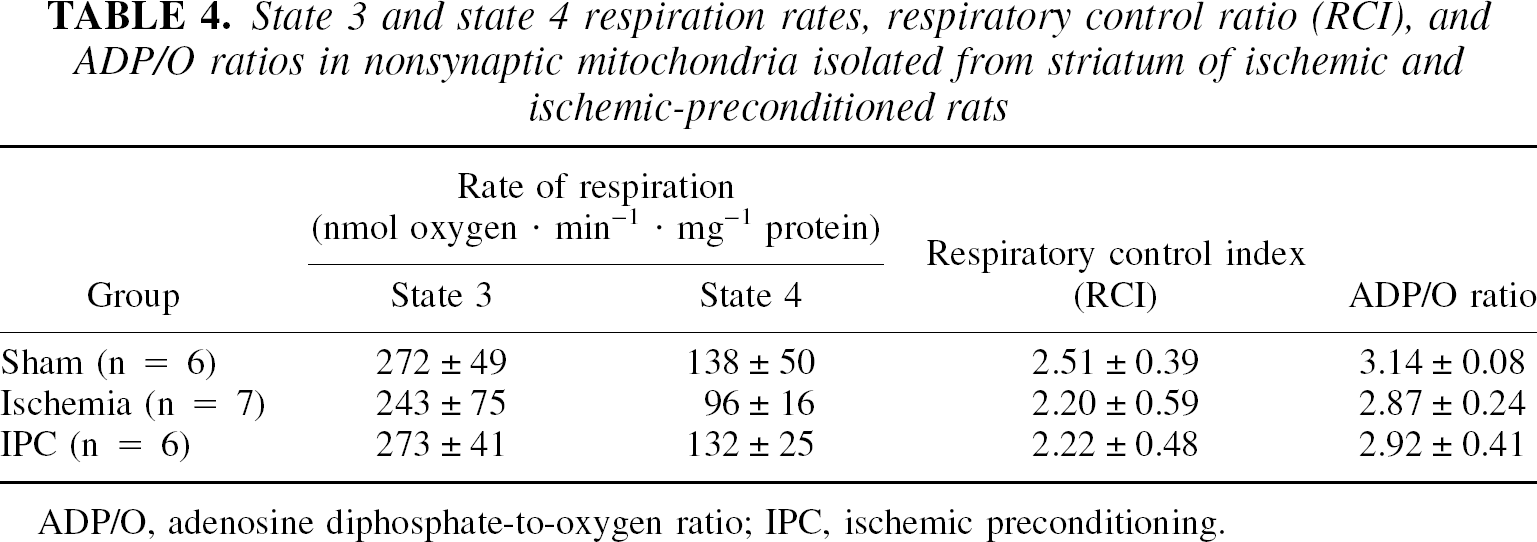
ADP/O, adenosine diphosphate-to-oxygen ratio; IPC, ischemic preconditioning.
Mean rates of respiration in nonsynaptic mitochondria isolated from striatum in the presence of different substrates are shown in Table 5. We observed similar trends in striatum as those observed in the hippocampus. When the substrates were pyruvate and malate, the oxygen consumption rate was lower by 15% in the ischemic group compared with the sham group, and by 18% when compared with the IPC group.
Substrate oxidation rates in nonsynaptic mitochondria isolated from striatum of ischemic and ischemic-preconditioned rats
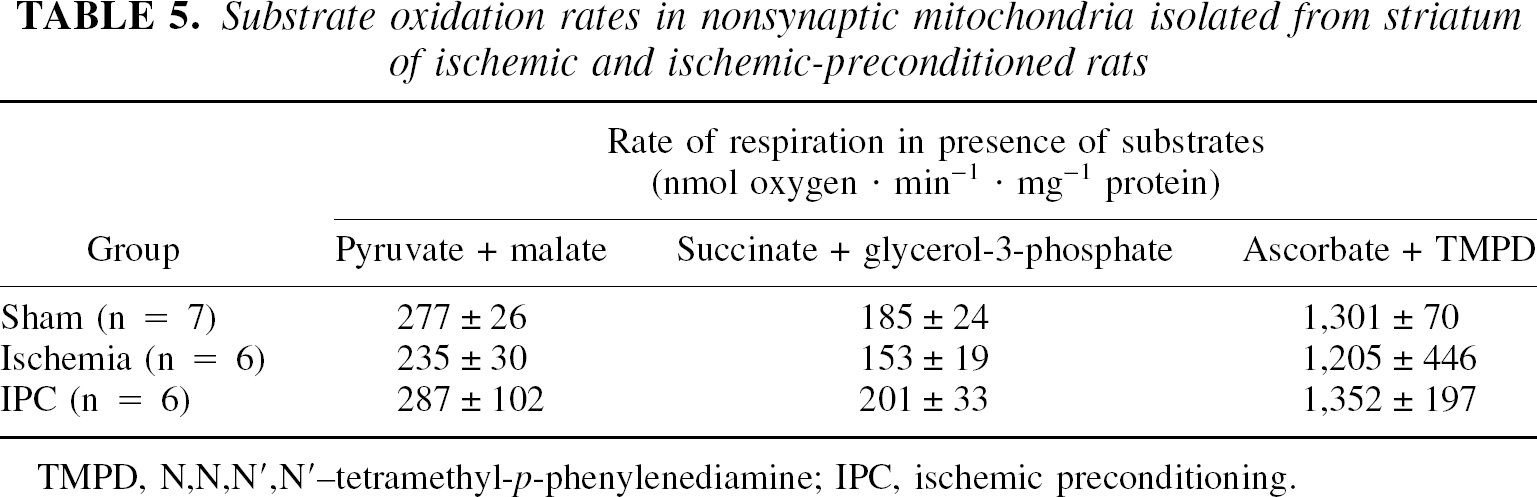
TMPD, N,N,N′,N′ –tetramethyl-p-phenylenediamine; IPC, ischemic preconditioning.
When succinate and glycerol-3-phosphate were added as substrates, the oxygen consumption rate was lower by 17% in the ischemic group compared with the sham group, and by 24% compared with the IPC group. No differences were found when ascorbate and TMPD were added as substrates.
Complex I, II, III, and IV activities in nonsynaptic mitochondria isolated from striatum are shown in Table 6. There were no statistically significant differences in any of the activities of these complexes.
Complex I, II, III, and IV activities in nonsynaptic mitochondria isolated from striatum of ischemic and ischemic-preconditioned rats
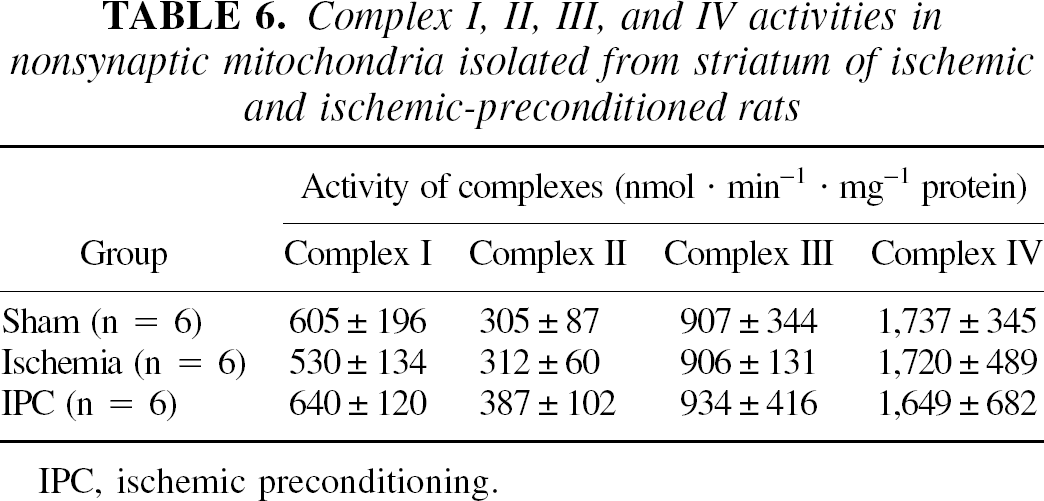
IPC, ischemic preconditioning.
DISCUSSION
The main aim in the current study was to determine whether IPC would protect nonsynaptic mitochondria during the late reperfusion phase. We show here that hippocampal nonsynaptic mitochondrial dysfunction is ameliorated by IPC treatment.
In the current study, we confirm previous studies that showed that late reperfusion after cerebral ischemia resulted in mitochondrial damage (Cafe et al., 1994). An advantage from our studies is that we looked specifically at hippocampal mitochondria. This was important because hippocampus is selectively vulnerable to this model of global ischemia. To achieve measurements in isolated mitochondria from relatively small sample size (i.e., hippocampus and striatum) the volume of gradient was scaled down to 3.0 mL instead of 10 mL (Dunkley et al., 1988).
Our results showing decreases in states 3 and 4 respiration in ischemic nonsynaptic mitochondria from hippocampus corroborated previous studies (Li et al., 2000). These results suggest impairment in oxidative phosphorylation. The cumulative effect of decreased activities of mitochondrial complexes might be a key cause behind this impaired oxidative phosphorylation.
Evidence that this is the case was shown in previous studies. For example, brain mitochondria isolated during ischemia exhibited decreases in state 3 respiratory rates with NAD-linked respiratory substrates, implicating inhibition of complex I (Sciamanna et al., 1992). Schild et al. (1997) showed a decline of the activity of the NADH–cytochrome c–oxidoreductase complex after hypoxia and reoxygenation in isolated rat liver mitochondria. They suggest that decreased activity of this complex is likely to cause the drop in active respiration. However, oxidative modifications of mitochondrial proteins were observed, as indicated by carbonyl formation (Schild et al., 1997). We presume that in our case, oxidative modifications of mitochondrial protein or decreases in content of respiratory chain complexes may be responsible for decreases in mitochondrial complex activities after 24 hours of reperfusion. We and others have shown evidence that levels of NADH are decreased after anoxia or ischemia (Dora et al., 1986; Duckrow et al., 1981; Mayevsky et al., 1985; Paschen et al., 1985; Pérez-Pinzón et al., 1997b, 1998a, 1998b; Rosenthal et al., 1976; Tanaka et al., 1986; Welsh et al., 1982, 1991). Intracellular changes that could modulate the apparent mitochondrial hyperoxidation of electron carriers after ischemia include decreased substrate availability and disruption or loss of the electron carriers from the mitochondrial matrix. Consistent with either of these mechanisms are findings that antioxidants or lowered extracellular calcium ion activity limited mitochondrial hyperoxidation and improved electrical recovery after anoxia in hippocampal slices (Pérez-Pinzón et al., 1997b). Cytosolic calcium ion accumulation and ROS could impair key metabolic enzymes required in substrate production or could promote mitochondrial membrane disruption that could result in the translocation of the electron carriers of the respiratory chain. For example, ROS may inhibit the pyruvate dehydrogenase complex through protein oxidation, a process that is potentiated by elevated calcium (Bogaert et al., 1994). These changes could explain the deficits at the level of complex I observed in the current study.
During reperfusion (or reoxygenation), an increase in intramitochondrial Ca2+can trigger the generation of reactive oxygen species, induction of mitochondrial permeability transition, dissipation of the transmembrane mitochondrial gradient, and efflux of small molecules and proteins such as cytochrome c (Fiskum et al., 1999; Galeffi et al., 2000). This, in turn, could explain decreases in oxygen consumption rates in hippocampus after ischemia in the current study. We found that cytosolic cytochrome c was increased after global cerebral ischemia in rat brain; conversely, reducible cytochrome c (presumably the intramitochondrial fraction of this cytochrome) was decreased after anoxia in hippocampal slices (Pérez-Pinzón et al., 1999b). These results suggest that anoxia and ischemia, followed by reoxygenation and reperfusion, respectively, results in changes in the mitochondrial transition pore, osmotic lysis of mitochondria, or both. These changes may produce an overall loss in reducible electron carriers, which, in turn, would compromise energy production and promote ROS production. Translocation of cytochrome c after cerebral ischemia has been demonstrated by many different groups (Fujimura et al., 1998, 1999, 2000; Nakatsuka et al., 1999, 2000; Sugawara et al., 1999; Pérez-Pinzón et al., 1999b; Sasaki et al., 2000).
A key finding in the current study was that IPC protected mitochondria against the deficits in respiration through complexes I to IV. Recent studies demonstrate that ROS and the resulting oxidative stress play a pivotal role in neuronal cell death. There are two major regions in the electron transport chain where ROS are produced. One is complex I, and the other is complex III (Zamzami et al., 1996). Because oxidative stress is implicated in the pathophysiologic change that ensues after cerebral and cardiac ischemia (Kanan and Jain, 2000), it can be surmised that a key mechanism by which IPC protects hippocampus against delayed neuronal cell death is by protecting mitochondrial oxidative phosphorylation.
The mechanism by which IPC affords protection to mitochondria remains undefined. A possible mechanism may involve up-regulation of neuroprotective genes. Cai and Storey (1996) found that anoxia stress induces up-regulation of the genes for NADH–ubiquinone oxidoreductase subunit (encoded by mitochondrial gene) and cytochrome oxidase subunit 1 (encoded by mitochondrial gene) in the anoxic-resistant turtle heart (Cai and Storey, 1996). We presume that IPC may up-regulate certain genes responsible for the activities of these complexes, which may render hippocampal mitochondria resistant to “lethal” ischemia.
Another possible mechanism may involve better maintenance of ATP. There is considerable evidence for the role of ATP depletion, which follows hypoxic–ischemic insults, in the development of mitochondrial damage and the subsequent activation of downstream cell death pathways (Galeffi et al., 2000). Yabe et al. (1997) have shown that in preconditioned heart, the glycolytic ATP production increases. They also have demonstrated that ATP and creatine phosphate concentration remained higher in preconditioned group compared with nonpreconditioned group (Yabe et al., 1997). A higher level of ATP in preconditioned group may prevent cytochrome c release from the mitochondria, as was previously observed by Nakatsuka et al. (1999).
Finally, we did not observed significant differences in nonsynaptosomal mitochondria derived from striatum, even though a strong trend was observed, whereby IPC and sham groups were similar and the ischemic group exhibited dysfunction similar to the one observed in hippocampus. An explanation for this lack of difference is that in the model of global cerebral ischemia used in the current study, 10 minutes of ischemia does not produce significant histopathologic changes in the striatum (Globus et al., 1990).
In conclusion, we demonstrate here that IPC protected hippocampal nonsynaptosomal mitochondria against deficits in mitochondrial oxidative phosphorylation observed 24 hours after cerebral ischemia. These data suggest that IPC protects the integrity of mitochondrial oxidative phosphorylation after cerebral ischemia and suggest new mechanisms by which IPC promotes neuroprotection, that is, inhibition in ROS production and preservation of the energy producing pathways. However, from this study, we cannot define whether IPC protection of mitochondria is the key mechanism by which IPC promotes tolerance. Finally, the precise mechanism of how IPC ameliorates mitochondrial dysfunction after cerebral ischemia remains undefined.