
Abstract
[11C]-DASB, namely [11C]-3-amino-4-(2-dimethylaminomethyl-phenylsulfanyl)-benzonitrile, is a new highly selective radioligand for the in vivo visualization of the serotonin transporter (SERT) using positron emission tomography (PET). The current study evaluates different kinetic modeling strategies for quantification of [11C]-DASB binding in five healthy humans. Kinetic analyses of tissue data were performed with a one-tissue (1CM) and a two-tissue (2CM) compartment model. Time-activity curves were well described by a 1CM for all regions. A 2CM model with four parameters failed to converge reliably. Reliable fits of the data were obtained only if no more than three parameters were allowed to vary. However, even then, the rate constants k3 and k4 were estimated with poor precision. Only the ratio k3/k4 was stable. Goodness of fit was not improved by using a 2CM as compared with a 1CM. The minimal study duration required to obtain stable k3/k4 estimates was 80 minutes. For routine use of [11C]-DASB, several simplified methods using the cerebellum as a reference region to estimate nonspecific binding were also evaluated. The transient equilibrium, the linear graphical analysis, the ratio of target to reference region, and the simplified reference tissue methods all gave binding potential values consistent with those obtained with the 2CM. The suitability of [11C]-DASB for research on the SERT using PET is thus supported by the observations that tissue data can be described using a kinetic analysis and that simplified quantitative methods, using the cerebellum as reference, provide reliable estimates of SERT binding parameters.
Alterations in the serotonin transporter (SERT) have been described in several neuropsychiatric conditions. Postmortem studies reported decreased SERT densities in cortical and subcortical regions of Parkinsonian subjects (Cash et al., 1985), depressed patients (Crow et al., 1984), and suicide victims (Stanley et al., 1982). In addition to its association with pathophysiologic processes, the SERT is the primary target of the widely prescribed specific serotonin reuptake inhibitors (SSRIs). Given the wide use of these drugs in the treatment of depression, there is a strong incentive to explore their biochemical effects directly in patients. In the study of the mode of action of both existing and new antidepressant drugs keen insight thus would be gained with the ability to measure their occupancy, their pharmacokinetics, and their effect on regulation of the SERT in vivo. Such an approach can be performed in the living human brain using positron emission tomography (PET) and a suitable radioligand for the SERT.
Several radioligands have been developed as PET markers for the SERT. These radioligands differ with respect to their affinities and specificities for the SERT, their specific to nonspecific binding ratios, and their brain kinetics. Successful conversion of paroxetine, a ligand of choice for labeling the SERT in vitro, into a PET imaging agent has not been accomplished despite its high potency for uptake inhibition (Suehiro et al., 1991). Other SSRIs drugs with high affinity for the SERT, such as sertraline, citalopram, or fluoxetine, have been labeled with 11 C but also displayed low specific-to-nonspecific binding ratios in vivo (Hashimoto et al., 1987; Lasne et al., 1989; Shiue et al., 1995; Hume et al., 1992). McN-5652 is another potent blocker of serotonin uptake although it displays a moderate selectivity toward the dopamine and norepinephrine transporters (Maryanoff et al., 1990). [11C](+)-McN-5652 has been described as a promising PET radiotracer for the SERT in the baboon brain, with a modest specific-to-nonspecific ratio (Szabo et al., 1995). However, the low specific-to-nonspecific binding ratios observed with [11C](+)-McN-5652 in humans, together with the extended acquisition time required to obtain stable estimates of SERT density indices, limit its application as a PET imaging agent in vivo (Parsey et al., 2000). In vivo PET imaging of SERT thus would clearly benefit from the development of a radiotracer with high selectivity for the SERT and high levels of signal-to-noise ratios.
A new class of potent SSRIs recently has been described, namely N-methyl-2-(arylthio)benzylamines, which possess a high affinity and selectivity for the SERT. Two derivatives of this class of compounds, IDAM and ADAM, have been described to display subnanomolar affinities for the SERT and a high selectivity over the dopamine and noradrenaline transporters both in vitro and in vivo in rats (Kung et al., 1999; Choi et al., 2000). Both derivatives have been labeled with 123 I and were described as suitable radioligands for in vivo visualization of the SERT using single photon emission computerized tomography (SPECT) in primates (Acton et al., 1999; Oya et al., 1999, 2000). The authors have recently synthesized and radiolabeled with 11 C a series of N methyl-2-(arylthio)benzylamines analogues for PET visualization of the SERT (Wilson and Houle, 1999; Wilson et al., 2000a). Four of these compounds displayed nanomolar or subnanomolar affinity for the SERT, and a greater than 1,000-fold affinity for the cloned human SERT over the dopamine transporter and the norepinephrine transporter in in vitro binding essays (Wilson et al., 2000a). Ex vivo studies of the brain pharmacokinetics of one of these analogues, namely [11C]-DASB ([11C]-3-amino-4-(2-dimethylaminomethyl-phenylsulfanyl)-benzonitrile), have given promising results in rats and showed that [11C]DASB binding in SERT-rich brain regions was both saturable and specific for the SERT (Wilson et al., 2000a). Preliminary studies in humans showed that the regional distribution of [11C]-DASB uptake was concordant with the known densities of SERT sites in the brain (Houle et al., 2000). However, further validation for the use of this radioligand in humans is required.
The aim of this study was to evaluate the prospect of using [11C]-DASB for quantification of SERT populations in the human brain. Regional brain uptake curves of [11C]-DASB were quantified using kinetic modeling analyses based on either one-or two-tissue compartments and involving two to four rate constants. In addition, simplified methods were evaluated to determine the most appropriate method for quantification of [11C]-DASB binding in routine clinical research.
MATERIALS AND METHODS
Subjects
This study was approved by the Human Subjects Review Committee of the University of Toronto. Five healthy volunteer subjects (3 men and 2 women, aged 25 to 50 years) were recruited and provided their informed consent before participation. Subjects were screened for history of psychiatric and medical illnesses. None of the subjects was taking any drugs.
Radiochemistry
[11C]-DASB was synthesized as described previously (Wilson et al., 2000a, 2000b). Briefly, [11C]-CH3 I was trapped in a high performance liquid chromatography (HPLC) sample loop coated with a solution of the N-normethyl precursor (1 mg) in diamethylformamide (80 μL). After 5 minutes at ambient temperature, the contents of the sample loop were injected onto a reverse-phase HPLC column, and the fraction containing product collected, evaporated to dryness, formulated in saline, and filtered through a 0.2 μm filter. Radiochemical purities were greater than 98%.
Positron emission tomography system
Studies were performed on an 8-ring brain PET camera system Scanditronix GEMS 2048–15B (Scanditronix Medical, General Electric, Uppsala, Sweden) that measured radioactivity in 15 brain sections with a thickness of 6.5 mm each (Litton et al., 1990). The intrinsic inplane resolution of the reconstructed images is 4.5 mm full width at half maximum. Transmission scans were acquired with rotating 68 Ge sources and were used to correct the emission scans for the attenuation of 511 keV photons through tissue and head support. Images were reconstructed using the transmission scan data for attenuation correction and a Hanning 5-mm filter.
Positron emission tomography studies
A thermoplastic mask was made for each subject and was used with a head fixation system during the PET measurements. Cannulae were inserted in the radial artery for blood sampling and in the controlateral arm antecubital vein for radioligand injection. A saline solution of 10.2 mCi (SD = 1.2 mCi) [11C]-DASB at a specific radioactivity of 1000 Ci/mmol (SD = 145 Ci/mmol) was injected intravenously as a bolus immediately flushed with 10 mL saline. Radioactivity in brain was measured in a series of sequential frames of increasing duration (from 1 to 5 minutes). In 3 subjects, the total time for measurement of radioactivity in brain was 90 minutes; it was extended to 120 minutes in the remaining 2 subjects.
An automatic blood sampling system was used to measure radioactivity in arterial blood during the first 20 minutes of the experiment. At the same time and thereafter, manual blood samples were drawn at 5, 10, 15, 20, 30, 45, 60, and 80 minutes after radiotracer injection. An additional blood sample was withdrawn at 110 minutes in the 2 subjects for which PET scanning time was extended to 120 minutes. An aliquot of each blood sample was taken to measure radioactivity concentration in total blood. The remainder of blood was centrifuged (1500 g, 5 minutes) and a plasma aliquot counted together with the total blood sample using a Cobra II gamma counter (Packard Instrument Company, Downers Grove, IL, U.S.A.) crosscalibrated with the PET system. Blood-to-plasma ratios determined from the manual samples were used to correct the blood radioactivity time-activity curve measured by automatic sampling and to generate the plasma radioactivity curve. The remaining volume of each manual plasma sample (3 mL) was used to determine unchanged radioligand and its metabolites in plasma. The fraction of unchanged ligand in plasma was fitted to a sum of two exponential functions. A metabolite-corrected plasma curve was generated by the product of the two curves. The corrected plasma curve was then fitted to a sum of three exponential functions (with the ascending part of the curve linearly interpolated between measured values), and the resulting fitted curve was used as input function (CP (t), nCi/mL) for the kinetic and graphical analyses.
Determination of ligand metabolism in plasma
In each experiment, the fraction of plasma radioactivity representing unchanged [11C]-DASB was determined by a combination of solid phase extraction and HPLC. Plasma samples (3 mL) were applied to a solid-phase extraction cartridge (OASIS 6 cc; Waters, Milford, MA, U.S.A.), which was preconditioned with 5 mL each of tetrahydrofuran (THF), ethanol (EtOH), and water. The cartridge then was eluted by partial vacuum and washed successively with 5 mL 5% methanol (MeOH) in water, 5 mL 22% acetonitrile (CH3 CN) in water containing 0.1 N ammonium formate, and 1.5 mL THF. Each of the fractions, the cartridge, the whole blood and plasma samples were counted for radioactivity. The THF fraction was evaporated in a stream of nitrogen to near dryness, taken up in 250 μL HPLC buffer, and analyzed by HPLC for metabolites. HPLC analysis was performed using a Novapak C18 column (300 × 7.5 mm; Waters) using 40:60 CH3 CN/H2 O + 0.1 N ammonium formate at 5 mL/min with inline UV (254 nmol/L) and radioactivity detectors (LB507A; Berthold Technologies, Bad Wildbad, Germany). Binding of [11C]-DASB to human plasma proteins was performed using an ultrafiltration technique described previously (Price et al., 1993).
Regions of interest
Each subject had a brain magnetic resonance imaging (MRI) examination. T1 -weighted and proton density images were obtained on a Signa 1.5 T MRI scanner (General Electric Medical System, Milwaukee, WI, U.S.A.). Both T1 -weighted and proton density images were acquired with spin-echo pulse sequences. Each subject's MRI scan was co-registered to the PET scan using Rview8/mpr realignment software (Studholme et al., 1997).
Regions of interest (ROIs) for the striatum, thalamus, hypothalamus, occipital cortex, frontal cortex, and cerebellum were drawn with reference to the co-registered MRI. Each ROI was drawn in two adjacent sections, in both hemispheres, and data from the same ROI were pooled to obtain the average radioactivity concentration in the volume of interest. Regional radioactivity was determined for each frame, corrected for decay, and plotted versus time.
Data analysis
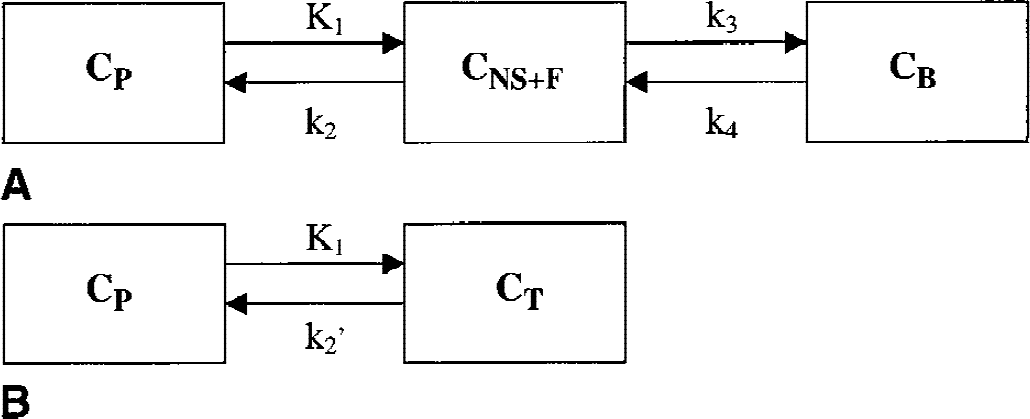
Kinetic analysis. Kinetic analysis of tissue data was performed with a 1CM and a 2CM. The 2CM (Fig. 1A) includes: the radioactivity concentration of unchanged radioligand in plasma (CP), the concentration of radioligand free and nonspecifically bound in tissue (CNS+F), and the concentration of radioligand specifically bound to receptor sites (CB). The rate constants K1 (mL g−1 min−1) and k2 (min−1) describe the influx and efflux rates, respectively, for radioligand diffusion through the blood–brain barrier. The rate constants k3 and k4 describe the radioligand transfer between the nondisplaceable compartment (that is, CNS+F) and the specific binding compartment (CB). Model equations for the 2CM analysis of radiotracer binding to receptors are given by
Two-tissue


The rate constant k3 (min−1) is the product of the bimolecular association rate constant kon and the concentration of available receptors (Bmax − B), with B << Bmax because experiments were performed at tracer dose and high specific radioactivity. At such conditions, k3 = (kon Bmax). k4 (min−1) is the unimolecular receptor dissociation rate constant koff. After replacement of k3 and k4, Eq. 2 can be written as

At equilibrium (that is, dCB (t)/dt = 0), the ratio k3/k4 can be defined as the ratio Bmax over KD, which is referred to as the binding potential (BP) (Mintun et al., 1984):

with KD = (koff/ kon). The BP calculated from the ratio k3/k4 obtained using the 2CM analysis is referred as BPkin.
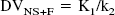
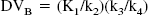
The concept of distribution volume (DV) (mL g−1) is also frequently used in tracer kinetics to estimate binding site density. The total DV (DVT) has the advantage to be a more stable parameter than the individual kinetic parameters determined from compartmental analysis (Koeppe et al., 1991; Carson et al., 1993). The DVT of a radioligand in a tissue is the volume of tissue in which the radioligand would have to distribute to reach a concentration equal to that in plasma. It is defined as the sum of the DV in the free and nonspecifically bound compartment (DVNS+F) and the DV in the specifically bound compartment (DVB). DVNS+F and DVB can be expressed in terms of the kinetic rate parameters as follows:

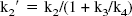
A simplification of the 2CM into a 1CM can be made by assuming that the concentrations CNS+F and CB equilibrate rapidly and are combined in one single compartment noted CT (Fig. 1B). The total distribution volume for the 1CM is noted as DV′ and is given by

Nonlinear least square fitting.
Nonlinear least squares fitting (NLSF) analyses using the Marquardt algorithm (Marquardt, 1963) and based on the 1CM and 2CM were applied to the time-activity curves for regional [11C]-DASB uptake. Cerebral blood volume was fixed at 5% for all ROIs (Leenders et al., 1990).
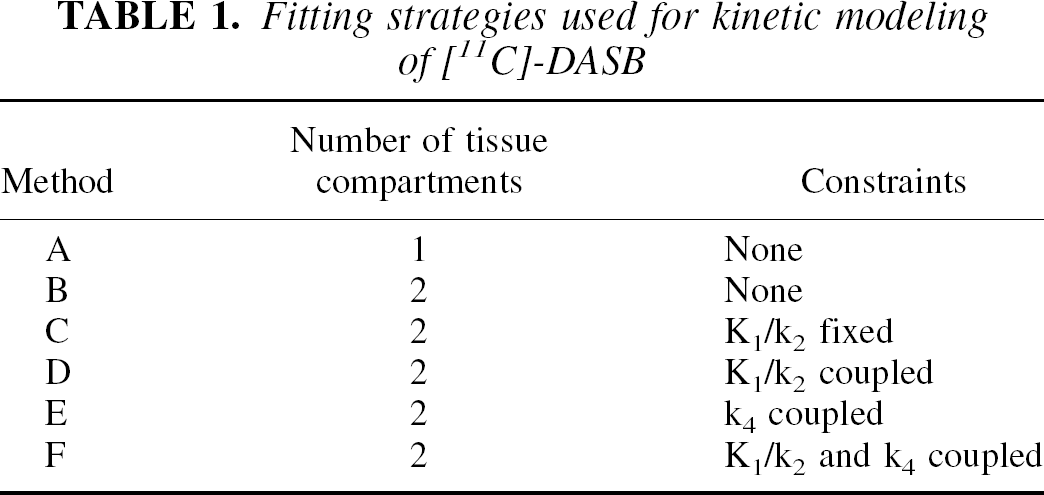
Different model configurations were used for analysis of [11C]-DASB kinetics (Table 1). Method A was based on the 1CM, and NLSF analyses were performed to estimate K1, k2 ′, and DV′. Method B was based on the 2CM, and NLSF analyses were performed to estimate the 4 rate constants K1, k2, k3, k4. To improve the stability of the fits, four other fitting strategies were tested. All four were based on the 2CM. In Method C, the ratio K1/k2 in target ROIs was fixed to the DV′ value estimated in the cerebellum using the 1CM, under the assumption that radioactivity in cerebellum represent free and nonspecifically bound radiotracer and that DVNS+F is similar between regions. Three rate constants—K1, k3, and k4 (with k2 = K1/ DVNS+F)—were estimated. Methods D, E, and F used several combinations of parameter coupling as previously described by Buck et al. (1996). In these latter methods, it was assumed that certain parameters such as the ratio K1/k2 and k4 were similar between regions. Nonlinear least squares fitting analyses were accordingly performed by fitting simultaneously data from all regions and guided by the constraint of finding parameter values common to all regions. Nonlinear least squares fitting analyses were performed using the dedicated software PMOD (Burger and Buck, 1997; Mikolajczyk et al., 1998).
Fitting strategies used for kinetic modeling of [11C]-DASB
Statistics.
Several statistical methods were used to compare the two models. Goodness of fit was evaluated using the Akaike information criterion (AIC) (Akaike, 1974), the Schwartz criterion (SC) (Schwartz, 1978), and F test statistics. Higher AIC and SC values were indicative of a better fit. Statistical significance using the F test was assumed for P ≥ 0.05.
The standard error of the parameters was given by the diagonal of the covariance matrix (Carson, 1986), expressed as percentage of the parameter value (coefficient of variation, %COV), and used to assess the parameter identifiability by the NLSF procedure. Calculation of %COV was possible only for fitted parameters. For derived parameters such as k3/k4, the SD of the mean (n = 5 subjects) was calculated, expressed as percentage of the mean derived parameter value, and used as an indication of the stability of the parameter estimate (%VAR = SD/mean × 100).
Effect of study duration on parameter estimates
The effect of study duration on parameter stability was estimated by shortening the fitting interval. Study durations ranging from 40 to 90 minutes after [11C]-DASB injection were evaluated. The identifiability of DV′ (Method A) and k3/k4 (Method C) was evaluated in each region. For each region and duration, each parameter was expressed as the percentage of the value obtained when 90 minutes of scanning data was considered. The SD on the mean of each parameter value was used as an indication of the stability of the parameter estimate. In addition, in the 2 subjects for whom PET data acquisition time was extended to 120 minutes, regional time-activity curves also were fitted for 100, 110, and 120 minutes, and the outcome measures obtained at these extended times were compared to the 90-minute value.
Simplified method analyses
Simplified methods were applied to determine the stability and reliability of BP. Evaluation of the various methods to determine [11C]-DASB BP was based on both the comparison with BP values obtained from the kinetic modeling approach and the degree of intersubject variability (%VAR) of the parameter. Several simplified approaches were evaluated.
Linear graphical analysis: BPLogan.
The graphic approach described by Logan et al. (1990) for the analysis of reversible radioligand binding was applied for the quantification of [11C]-DASB. A plasma input function corrected for the presence of labeled metabolites (CP (t)) was used. The ratio ∫t0 ROI(t′)dt′/ROI(t) was plotted versus ∫t0 CP (t′)dt′/ROI(t), with ROI(t) describing radioactivity in a defined ROI as a function of time. The DVT of the radioligand in that ROI was determined from the linear portion of the plot obtained. The ratio of the DVT in a ROI to that obtained in cerebellum, a reference region containing negligible densities of SERT, is related to the SERT binding site parameter by

Simplified reference tissue model: BPSRTM.
According to this approach, the time-activity curves for a region devoid of specific binding sites, CNS+F (t), is used as an indirect input function, CP (t). For [11C]-DASB, the cerebellum was used as the reference region, assuming that no SERT sites are present in this region. The major assumptions of this approach are that the exchange rates between the nondisplaceable and specific compartments are so fast that they are combined in a single compartment, and that the level of nondisplaceable binding in the reference and the target regions is similar (Lammertsma and Hume, 1996). An expression including BP can be derived that relates radioligand concentration in a target region to the radioligand concentration in the reference region. From the time-activity curves measured in the reference and in the target regions, best estimates of BP can be obtained using NLSF analysis. The BP calculated with this approach is referred to as BPSRTM.
Ratio analysis: BPratio.
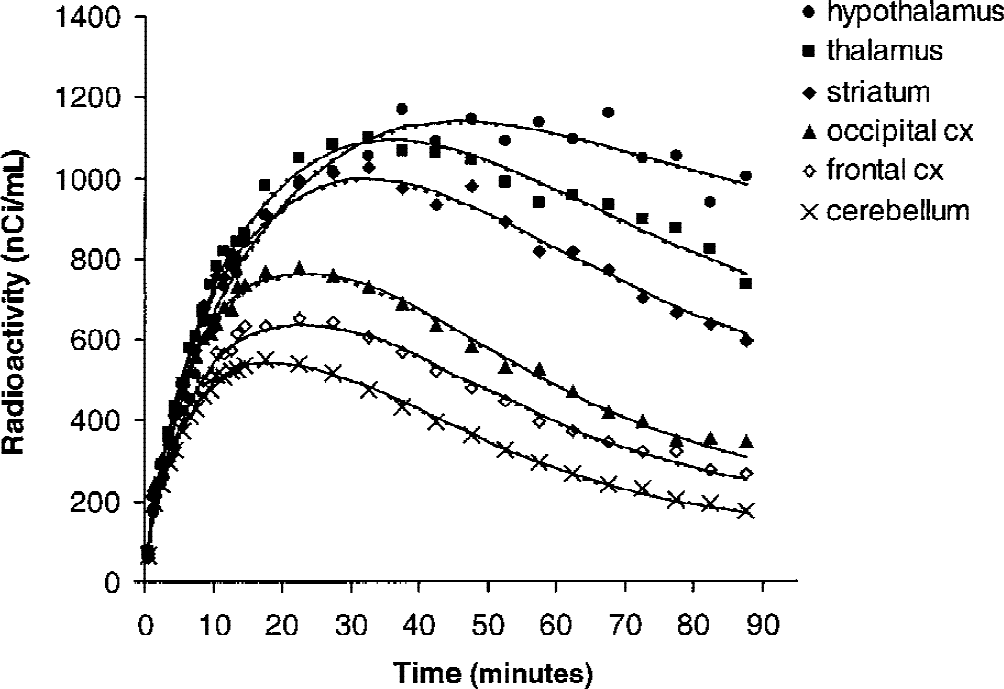
The time curve for specific radioligand binding was defined as the radioactivity concentration in a ROI subtracted with that in the cerebellum: CB (t) = CROI (t) − CCEREB (t). Radioactivity in the cerebellum thus was used as an estimate for CNS+F. The time curves for CB and CNS+F were integrated at late times—that is, from t1 = 55 minutes to t2 = 90 minutes. The BPratio was calculated according to the following equation:
Transient equilibrium analysis: BPEq.
Time for transient equilibrium was defined as the moment when CB (t) peaked—that is, dCB/dt = 0 (Farde et al., 1989). A set of three exponential functions was fitted to the time curves for CB (t) and CNS+F (t), and the peak for CB (t) was defined on the fitted curve. The ratio between CB and CNS+F obtained at transient equilibrium is equal to k3/k4 and is referred here as BPEq.
Simulation study
A simulation study was performed to estimate the error induced by regional changes in radioligand delivery on BP values calculated using both the ratio method and the SRTM. Changes in radioligand delivery, such as caused by changes in cerebral blood flow (CBF), were simulated by changing the K1 value by ±30% (in 10% increments) around the K1 value obtained from the 2CM. Tissue time-activity curves obtained in the striatum of one specific subject (90 minutes of data acquisition) were fitted according to Method F. The kinetic parameters derived from the fitted curve were: K1 = 0.87 mL g−1 min−1; K1/k2 = 13.63 mL g−1, k3 = 1.27 min−1, k4 = 0.72 min−1. Simulated tissue time-activity curves were generated with the K1/k2 and the k4 values fixed to the values derived from Method F, with K1 values ranging from 0.61 to 1.13 mL g−1 min−1 and with k3 values ranging from 0.36 to 2.16 min−1, which corresponded to k3/k4 values ranging from 0.5 to 3. A cerebellar time-activity curve also was generated according to the 1CM with K1 = 0.76 mL g−1 min−1 and k2 ′ = 0.056 min−1. BPratio and BPSRTM then were calculated using those simulated time-activity curves. For each assumed k3/k4 value, BPratio and BPSRTM were compared to the corresponding BP value obtained when using the original fitted time-activity curves—that is, K1 = 0.87 mL g−1 min−1.
RESULTS
Plasma analysis
The HPLC analysis of the THF fractions showed only the presence of unmetabolized [11C]-DASB in all human subjects analyzed at every time points examined in all subjects. Furthermore, previous experiments in which whole human blood was spiked with [11C]-DASB demonstrated that more than 97% of the radioactivity was eluted in the THF fraction (data not shown). These data indicate that measuring radioactivity in the successive fractions eluted from the solid-phase extraction cartridge is sufficient to determine the fraction of radioactive metabolites in human plasma. HPLC analysis thus is not required for future analysis of [11C]-DASB metabolism.
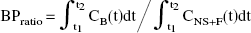
The fraction of unmetabolized [11C]-DASB in plasma decreased throughout the time-course of the study and was approximately 40% ± 7% at 30 minutes and 17% ± 3.5% at 80 minutes (Fig. 2A). All metabolites were more polar than the parent compound and thus unlikely to pass the blood–brain barrier. The free fraction of [11C]-DASB in plasma was determined to be 11.0% ± 1.2%. Figure 2B shows a representative curve for unchanged radioactivity in plasma, which was used as input function in the NLSF and graphical analyses.
Kinetic analyses
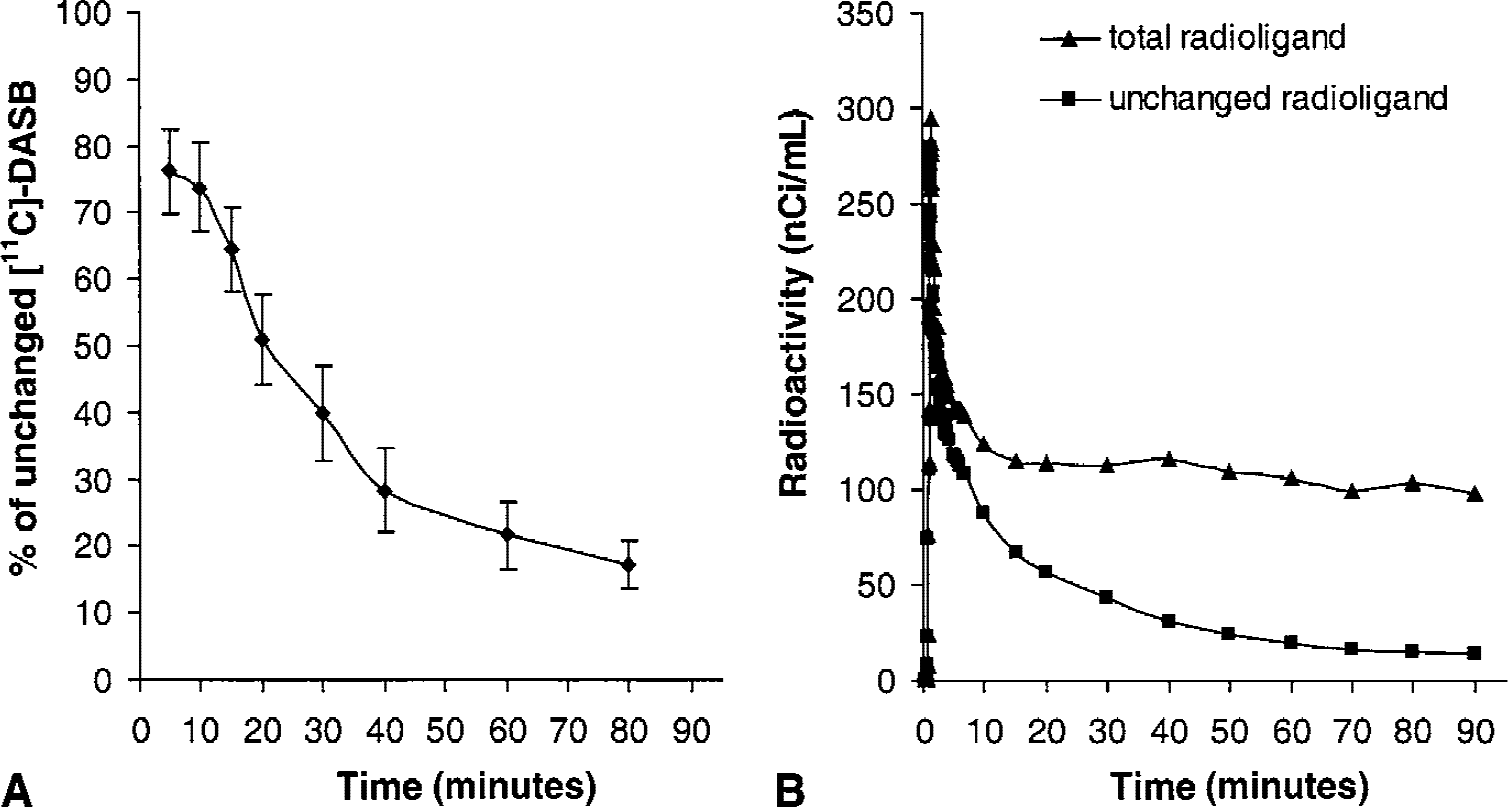
Characteristic time-activity curves obtained after intravenous injection of [11C]-DASB in one subject are shown in Fig. 3. The highest radioactivity concentration was observed in hypothalamus, intermediate levels were observed in thalamus and striatum, and modest to low levels of radioactivity were observed in cortical regions and cerebellum, respectively. Radioactivity levels peaked at approximately 20 minutes postinjection in the cerebellum and cortical regions, whereas it peaked later in both the striatum and thalamus (between 30 and 40 minutes) and in the hypothalamus (between 50 and 60 minutes).
Representative time-activity curves for regional brain radioactivity obtained after intravenous injection of [11C]-DASB in one healthy subject. For each brain region, the symbols correspond to the experimental measured values, the dashed line corresponds to the fitted curve obtained according to a one-tissue compartment model (Method A), and the solid line corresponds to the fitted curve obtained according to a two-tissue compartment model with K1/k2 ratio in target regions of interest fixed to that found in cerebellum with a one-tissue compartment model (Method C).
1CM configuration.
Results obtained from NLSF analyses using Method A are presented in Table 2. Tissue time-activity curves were well-described by a 1CM and convergence was achieved for all regions. The rate constant K1 was high and ranged from 0.62 mL g−1 min−1 in the hypothalamus to 0.79 mL g−1 min−1 in the thalamus. K1 values were well identified in all regions with %COV close to 2%. The rate constant k2 ′ showed a larger variation between regions with values raging from 0.013 min−1 in a region rich in SERT sites such as the hypothalamus to 0.053 min−1 in cerebellum, a region devoid of SERT. This parameter was also well identified in all regions with %COVs inferior to 5%. The rank order for DV′ values estimated with the 1CM was: hypothalamus > thalamus > striatum > occipital cortex > frontal cortex > cerebellum.
Rate constants obtained by the kinetic 1CM analysis of [11C]-DASB binding
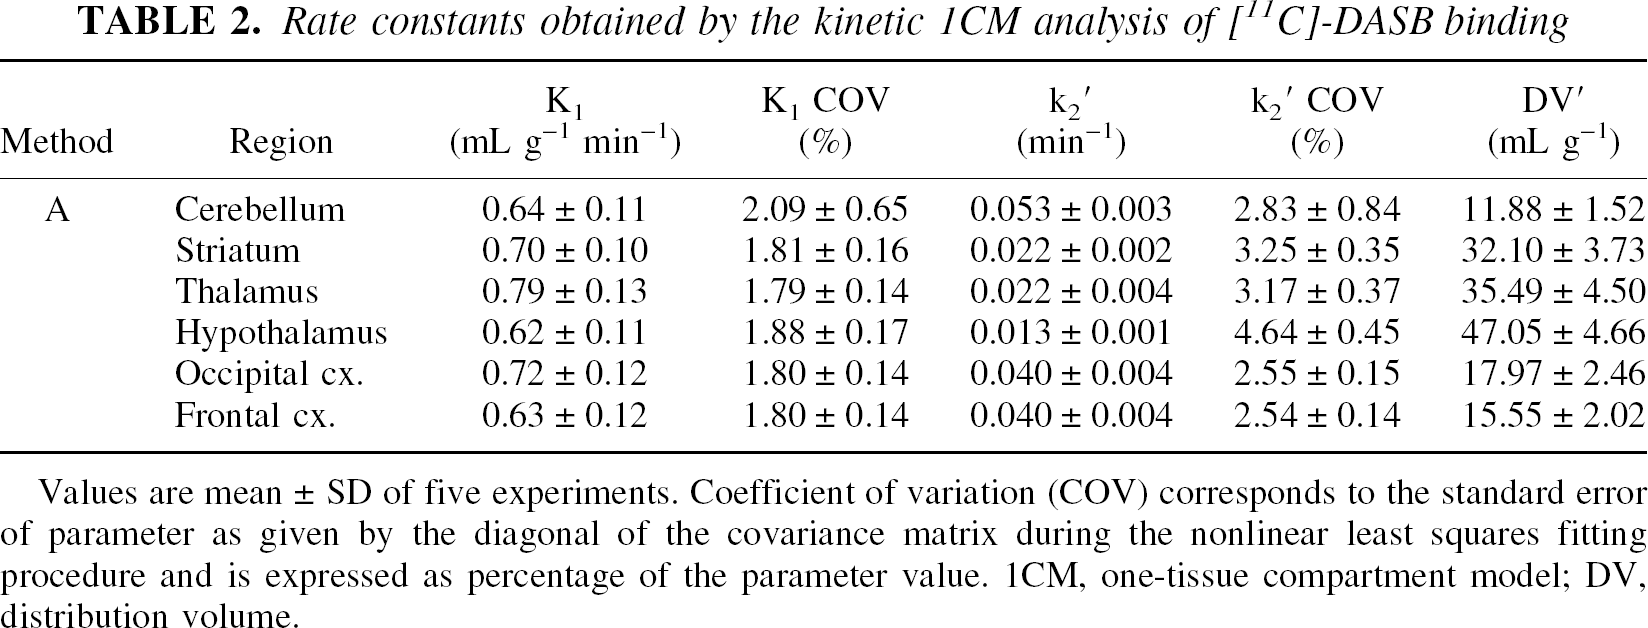
Values are mean ± SD of five experiments. Coefficient of variation (COV) corresponds to the standard error of parameter as given by the diagonal of the covariance matrix during the nonlinear least squares fitting procedure and is expressed as percentage of the parameter value. 1CM, one-tissue compartment model; DV, distribution volume.
2CM configuration.
Results obtained using the 2CM configuration are presented in Table 3. Only data obtained with Methods C, D, and F are presented. Indeed, Methods B and E both failed to reach convergence in all regions and all subjects. Extension of PET data acquisition time from 90 to 120 minutes did not solve problems with model convergence in the 2 subjects tested. In all subjects, reliable fits of the data were obtained only if no more than three parameters were allowed to vary. Constraining the 2CM fitting procedure removed the convergence difficulties and resulted in adequate fits of the data. In Method C, fixing the free plus nonspecific DV in target ROIs to the DV′ estimated in the cerebellum was sufficient to reach convergence. However, even then, the individual rate constants k3 and k4 were estimated with poor precision, as exhibited by the large standard errors in parameters estimates (COV > 100%). Even though individual parameter values for k3 and k4 were highly variable, the ratio k3/k4 was stable and was estimated with a much higher accuracy. Interindividual variability in k3/k4 values were highly consistent across brain regions as assessed by %VAR ranging from 7% in the frontal cortex and striatum to 18% in the occipital cortex (Table 3). As expected, the ratio k3/k4, which is proportional to Bmax (Eq. 4), correlated well with the known regional densities of SERT sites. Comparisons between the mean regional BP values as measured in the current experimental conditions using [11C]-DASB and Method C and the mean [3H]paroxetine specific binding values reported postmortem in corresponding regions of the human brain are shown in Fig. 4. Positron emission tomography measures of [11C]-DASB BP were significantly correlated with the in vitro measures of [3H]paroxetine binding sites densities reported by Bäckström et al. (1989) (Fig. 4A;r2 = 0.96; Student's t-test:P < 0.01) and Laruelle et al. (1988) (Fig. 4B; r2 = 0.81; Student's t-test:P < 0.05).
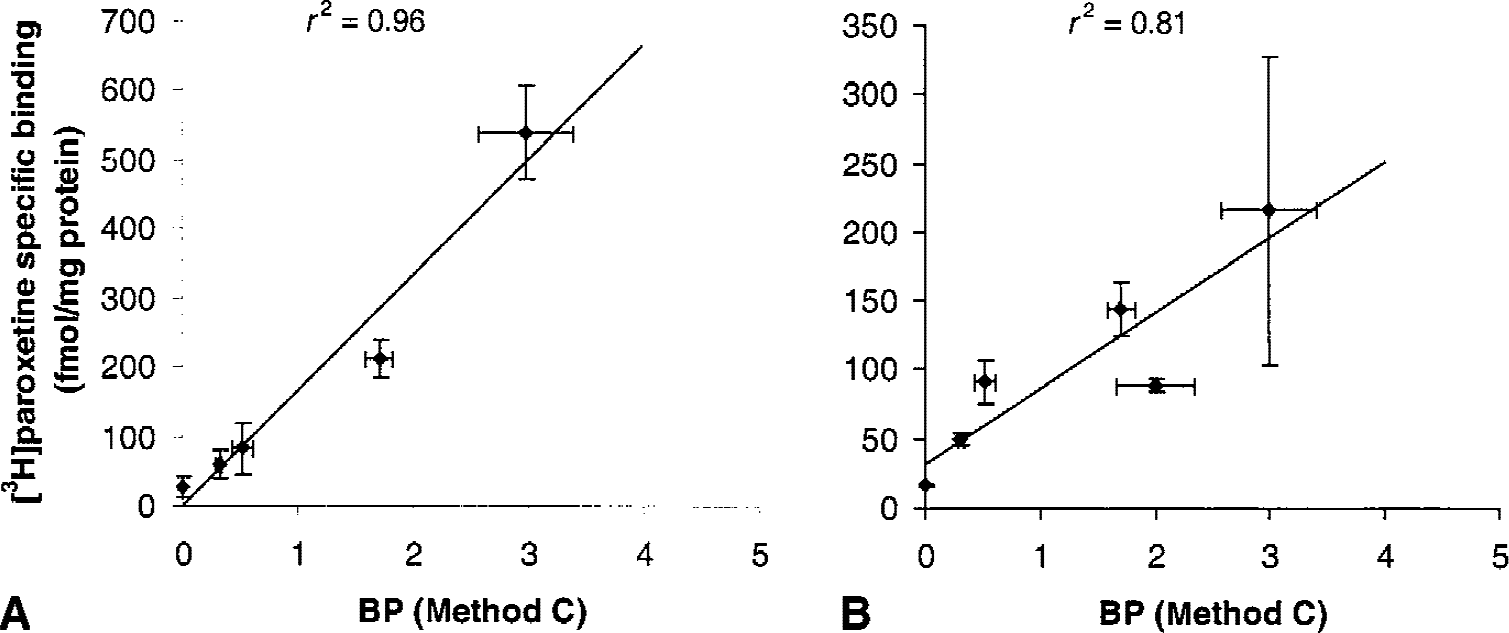
Correlations between [11C]-DASB binding potential (BP) values in various brain regions as determined using Method C and the density of [3H]paroxetine binding sites reported by
Rate constants obtained by the kinetic 2CM analysis of [11C]-DASB binding
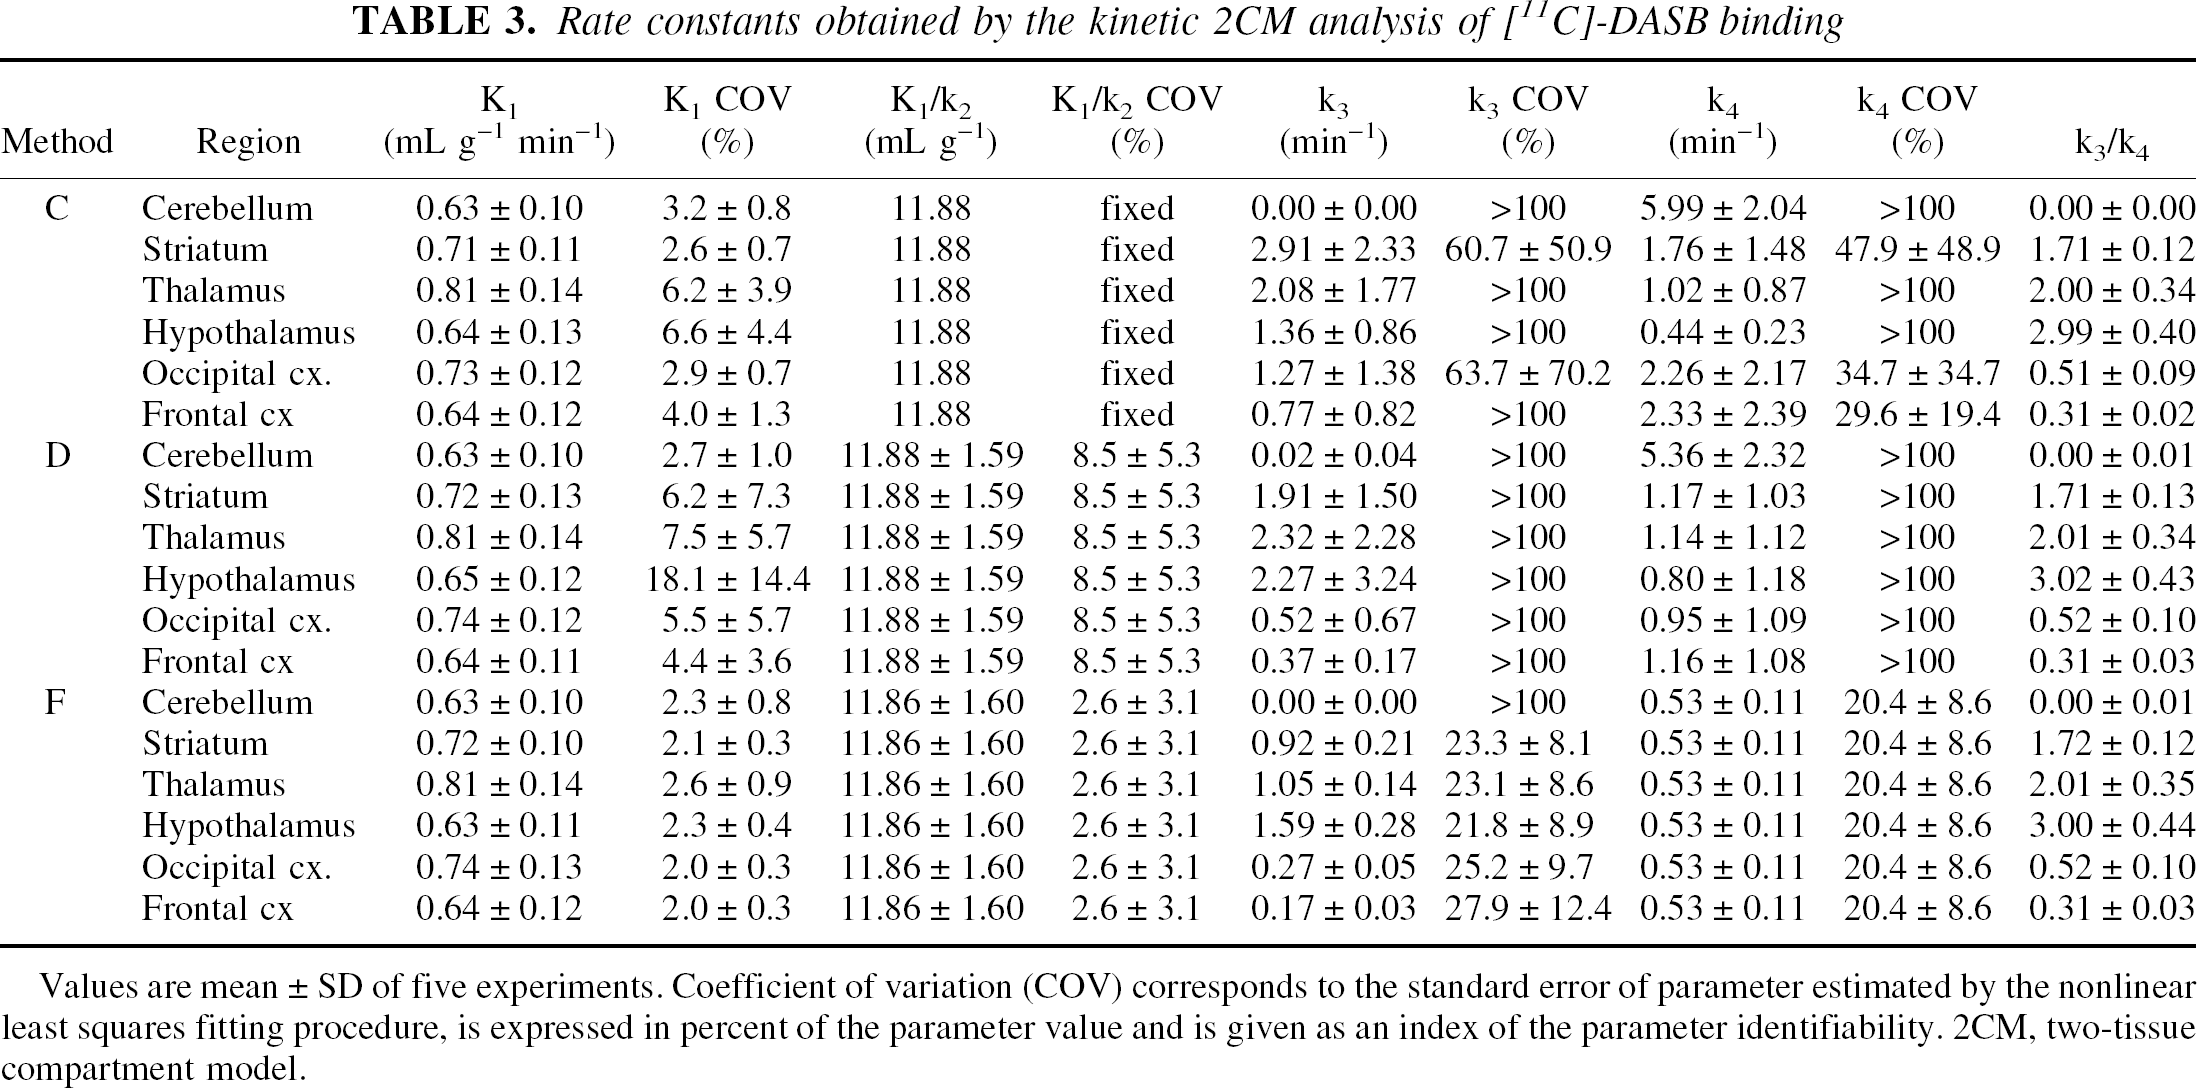
Values are mean ± SD of five experiments. Coefficient of variation (COV) corresponds to the standard error of parameter estimated by the nonlinear least squares fitting procedure, is expressed in percent of the parameter value and is given as an index of the parameter identifiability. 2CM, two-tissue compartment model.
Examples of curve fits obtained by applying Methods A and C to [11C]-DASB TAC data are shown in Fig. 3. Goodness of fits was not statistically improved by using Method C as compared with Method A as assessed with F test. In addition, both the AIC (AIC = 88 ± 31 and 90 ± 31 for Method A and C, respectively; repeated measures analysis of variance [ANOVA]: F1,29 = 0.44;P > 0.05) and the SC (SC = 91 ± 31 and 94 ± 31 for Method A and Method C, respectively; repeated measures ANOVA: F1,29 = 1.31;P > 0.05) were not statistically different between the methods.
Method D yielded kinetic parameter estimates that were similar to those obtained with Method C (Table 3). The standard errors on the determination of K1 values (as demonstrated by %COV) were significantly greater than with Method C (repeated measures ANOVA: F1,29 = 4.64;P < 0.05), which were in turn greater than with Method A (repeated measures ANOVA: F1,29 = 27.76;P < 0.001). Coupling K1/k2 between regions during the fitting procedure did not improve the identifiability of k3 and k4 with %COV exceeding 100%, but gave k3/k4 values that were similar to those obtained with Method C.
In Method F, coupling both K1/k2 and k4 during the fitting procedure significantly improved the identification of [11C]-DASB kinetic parameters. As compared with Methods C and D, Method F significantly decreased the standard errors associated with k3 and k4, with %COV ranging from 20% to 30% (Table 3). k3 values were high and varied between regions according to their relative density of SERT sites. The ratios k3/k4 estimated with Method F were identical to those estimated with Method C. Method F did not improve the AIC and SC values as compared with Method C (AIC = 90 ± 31 and 90 ± 31 for Methods C and F, respectively; repeated measures ANOVA: F1,29 = 0.96;P > 0.05; SC = 94 ± 31 and 94 ± 31 for Methods C and F, respectively; repeated measures ANOVA: F1,29 = 0.96;P > 0.05).
Stability of k3/k4 values versus study duration
To define the minimum PET data acquisition time required to derive stable BP values using method C, all regional time-activity curves were fitted for various periods of time ranging from 40 minutes to 90 minutes in 10-minute increments (Fig. 5). k3/k4 values for less than 70-minute study duration were greater than for 90 minutes, especially in regions with high density of SERT sites such as hypothalamus. With only 40 minutes of data included, k3/k4 increased to 130% of the 90-minute value. In regions with lower density of SERT sites, stable values for BP were reached for study duration greater than 50 minutes. Similar results were obtained for derivation of DV′ (data not shown). In the 2 subjects tested, extending PET scanning time to 120 minutes yielded outcome measures that were close (within 5%) to their 90-minute value.
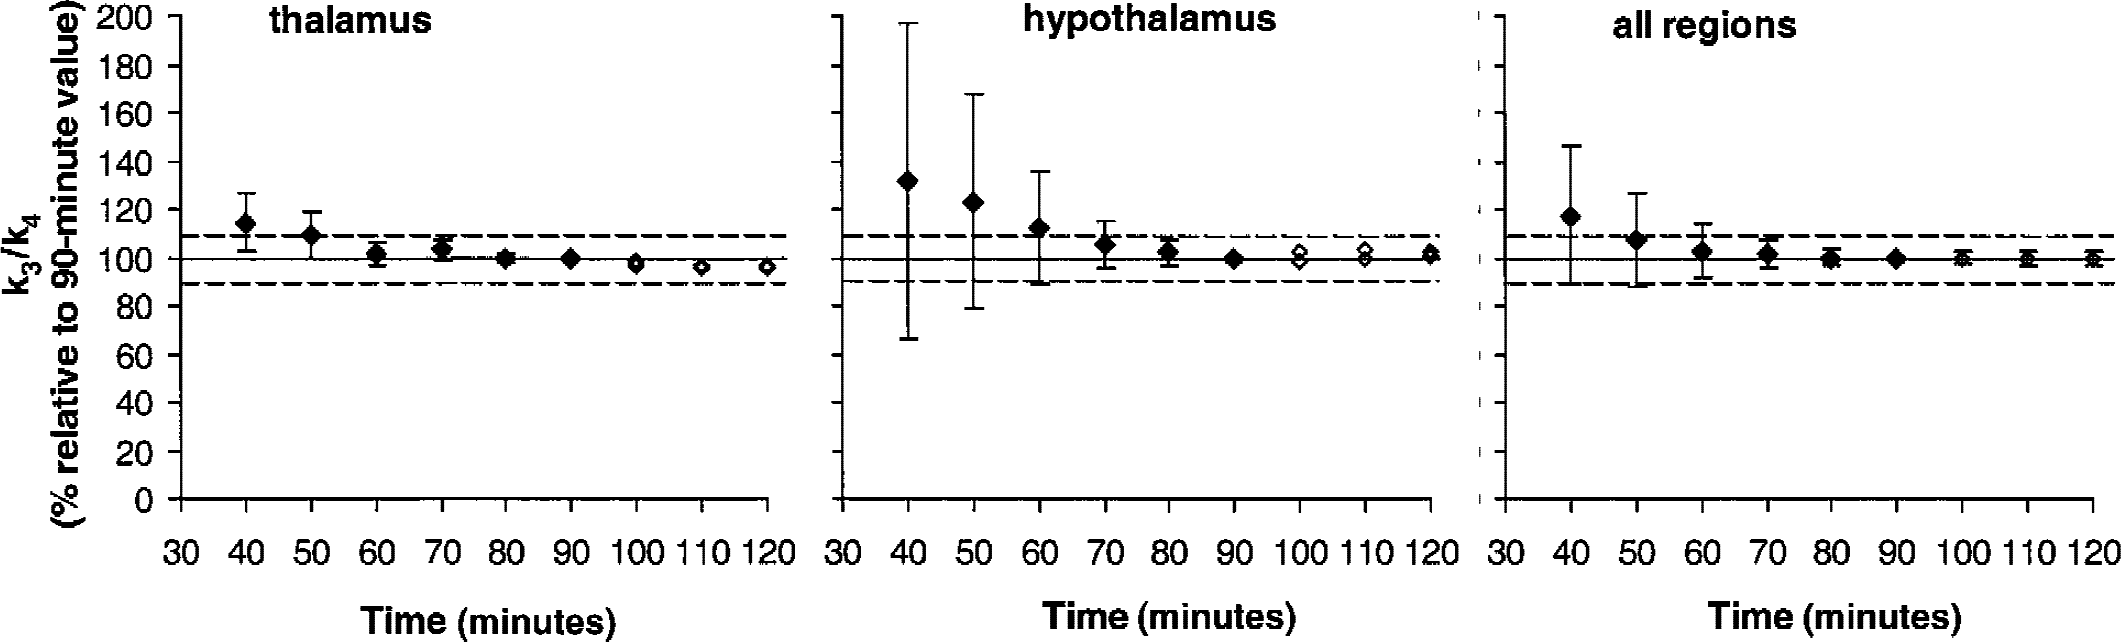
Effect of study duration on the stability of k3/k4 ratio values as estimated with Method C in the thalamus, hypothalamus, and all regions combined. For less than 90 minutes of study duration (closed symbols), each parameter was expressed as the mean ± SD (n = 5) percentage of the value obtained when 90 minutes of acquisition data was considered. In 2 of the 5 subjects examined, positron emission tomography data acquisition time was extended to 120 minutes. The parameter values obtained at extended times and expressed as percentage of the relative 90-minute value obtained in each subject is also plotted (open symbols).
Simplified method analyses
Total distribution volume values derived from the Logan graphical approach produced comparable results to those obtained using the kinetic 1CM approach (Table 4). The 2 measures were significantly correlated (slope = 0.87;r2 = 0.98; Student's t-test:P < 0.001). However, the graphical approach yielded DV values that were significantly less (range: −3% to −19%; mean: −8%) than those estimated with the 1CM approach (Table 4; repeated measures ANOVA: F1,29 = 6.18;P < 0.02). Underestimation of total DV using the graphical approach was more pronounced in regions with high SERT levels such as hypothalamus.
Comparison of total distribution volume values between methods
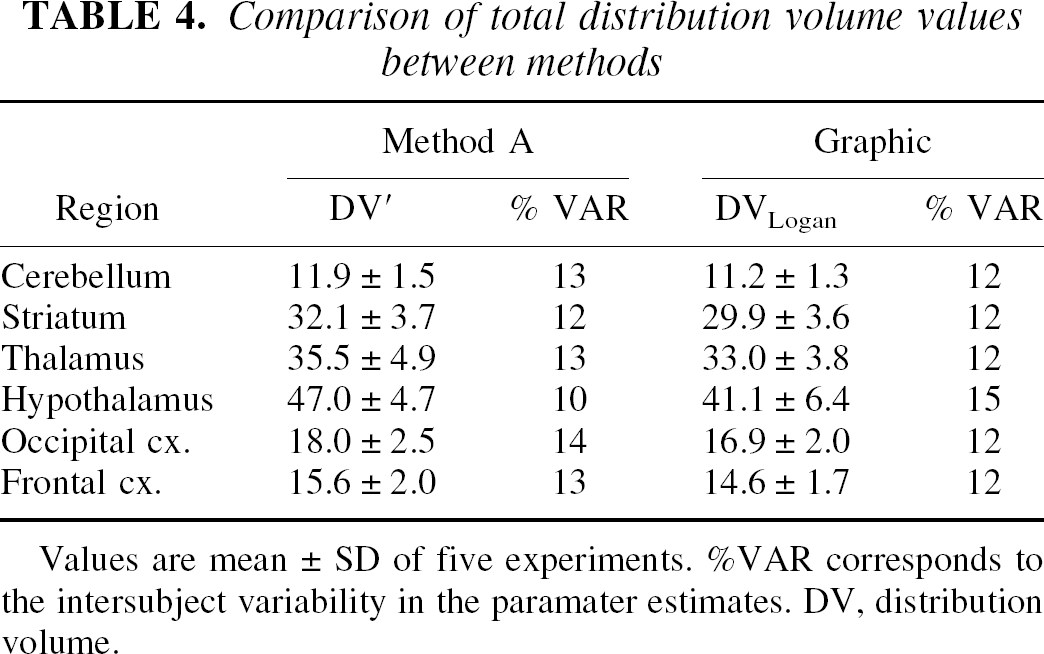
Values are mean ± SD of five experiments. %VAR corresponds to the intersubject variability in the paramater estimates. DV, distribution volume.
The average BP values obtained by the five different methods are given in Table 5. Binding potential values obtained by the four simplified methods were in close agreement with those obtained by the kinetic Method C. The interindividual variability was greater for the ratio method and smallest for the transient equilibrium method. The peak of specific binding uptake was reached between 40 and 50 minutes in the cortical regions, and between 50 and 60 minutes in the striatum and thalamus. In the hypothalamus, time for transient equilibrium occurred later and was not reached within the time frame of the experiment (90 minutes) in 3 of the 5 subjects. Hence, the transient equilibrium approach was not always applicable in the hypothalamus.
Comparison of BP values obtained using different methods
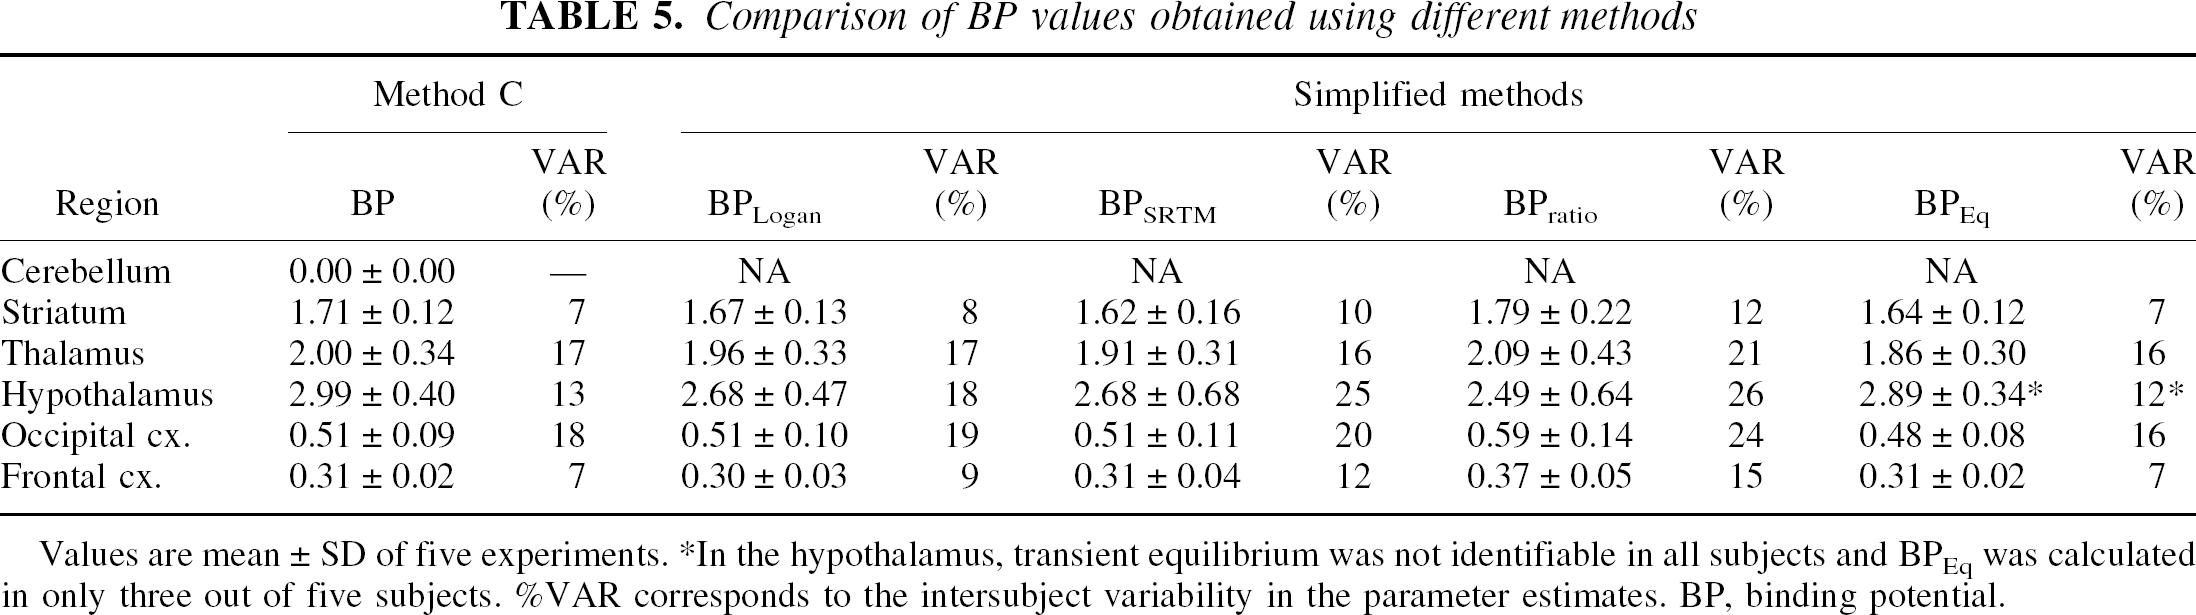
Values are mean ± SD of five experiments. *In the hypothalamus, transient equilibrium was not identifiable in all subjects and BPEq was calculated in only three out of five subjects. %VAR corresponds to the intersubject variability in the parameter estimates. BP, binding potential.
The BP calculated with the graphic, the SRTM, and the ratio methods were compared with the BP obtained with Method C. The error in BP calculated with the graphic method (range: −9% to +3%; mean: −5%) were smaller than those calculated with the SRTM method (range: −9% to +20%; mean: −7%), which in turn were smaller than those calculated with the ratio method (range: −13% to +26%; mean: +14%).
Simulations
Errors in BPratio for assumed k3/k4 and K1 values are shown in Fig. 6. Decreases in K1 were associated with underestimation of BPratio, whereas increases in K1 were associated with overestimation of BPratio. For all k3/k4 values, increases in K1 values up to 30% led to errors in the estimation of BPratio that were less than 10%. Underestimation in BPratio greater than 10% were observed for K1 values less than 20% and k3/k4 values greater than 2. The effect of changes in K1 on BPSRTM was small with maximal error inferior to 1% (data not shown).
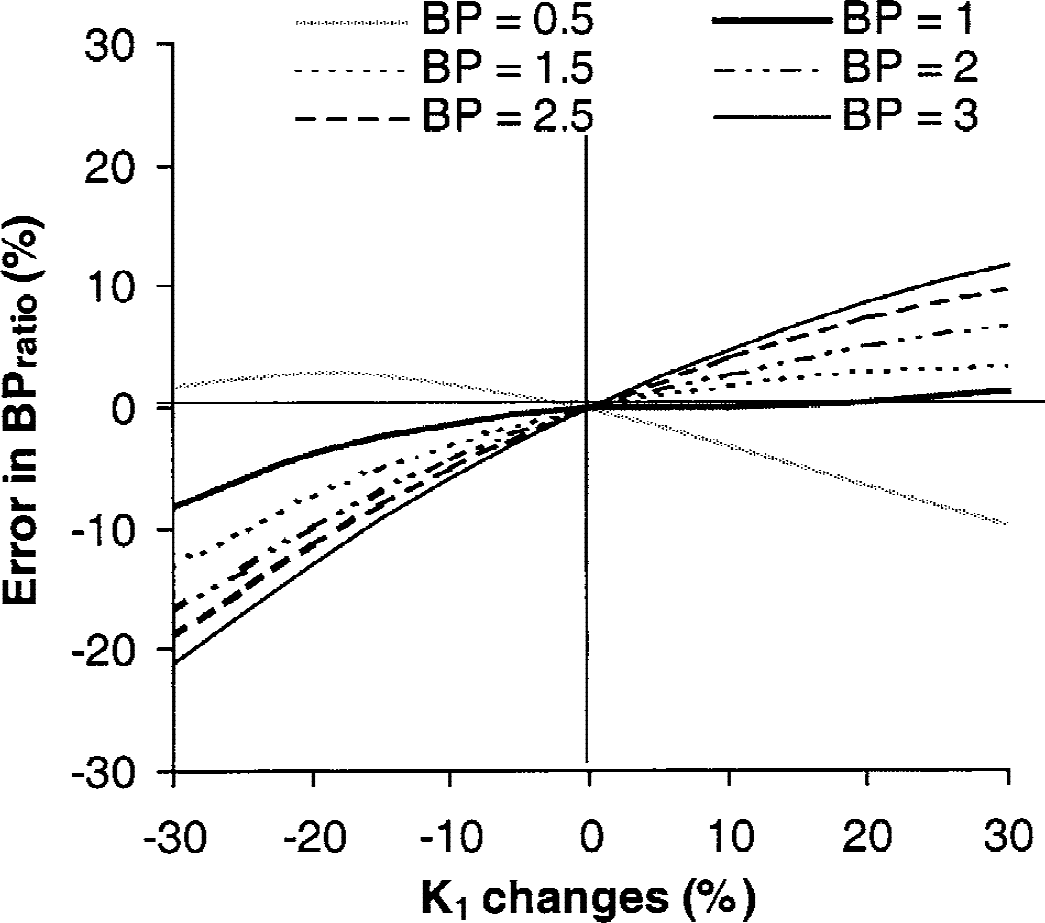
Errors caused by changes in k3/k4 and K1 values on binding potential (BP) values calculated using the ratio method.
DISCUSSION
The primary goal of this study was to evaluate methods to obtain reliable estimates of SERT density from the analysis of [11C]-DASB brain uptake curves in humans. As previously described (Houle et al., 2000), the regional distribution of [11C]-DASB uptake was concordant with the known densities of SERT sites in the brain. The highest levels of radioactivity were observed in the hypothalamus, intermediate levels were observed in the thalamus and striatum, whereas modest to low levels of radioactivity were observed in the cortical regions and cerebellum, respectively.
Kinetic analyses of [11C]-DASB brain uptake curves revealed that a 1CM was sufficient to describe the time-activity data. Convergence was achieved in all subjects and all brain regions. The transport parameter K1 was high, indicating that [11C]-DASB is highly extracted, and was estimated precisely in all regions. The moderate intersubject variability of 10% to 14% suggested that the 1CM does provide sufficiently accurate estimates of [11C]-DASB total distribution volumes, DV′. Although DV′ includes information both on radioligand delivery and binding to specific receptor sites, at equilibrium DV′ should be independent of tracer delivery and is assumed to give an index of receptor site density. This assumption was supported by the observation that the rank order of DV′ values correlated well with the typical rank order of SERT densities found in the human brain postmortem (Cortes et al., 1988; Laruelle et al., 1988; Backstrom et al., 1989).
The free and nonspecific distribution volume measured for [11C]-DASB in the cerebellum was high (DV′ = 11.9 ± 1.5 mL g−1) as compared with that of other neuroreceptor radioligands—such as the D2 -receptor antagonist [11C]raclopride (0.42 ± 0.06 mL g−1;Lammerstma et al., 1996), the 5HT-1A receptor antagonist [carbonyl-11C]WAY-100635 (0.54 ± 0.11 mL g−1;Gunn et al., 1998), or the D1 -receptor antagonist [11C]NNC 112 (2.54 ± 0.42 mL g−1;Abi-Dargham et al., 2000). [11C]-DASB DV′ measured in cerebellum is likely to represent an appropriate estimate of the nondisplaceable DV. Indeed, several postmortem studies in humans reported either undetectable (Cortes et al., 1988) or extremely low SERT site density (Backstrom et al., 1989; Laruelle et al., 1988) in the cerebellum. Furthermore, Western blot analysis disclosed only a trace amount of SERT protein in autopsied human cerebellar cortex (S. Kish, personal communication). Such high values for free and nonspecific DV seems to be a property shared by several SERT radioligands. Indeed, cerebellar distribution volume values equal to 17.8 ± 1.9 mL g−1 and 16.8 ± 4.0 mL g−1 have been reported for [11C]-McN 5652 in humans (Parsey et al., 2000) and [11C]venlafaxine in swine (Smith et al., 1997), respectively.
An unconstrained 2CM with the estimation of four kinetic parameters failed to reach convergence in all subjects and all brain regions. Reducing the complexity of the 2CM by reducing the number of floating parameters solved the convergence problem. This was done by different methods that all constrained parameter values in the model that were predicted not to have large variations between brain regions. Method C consisted to estimate the free and nonspecific binding from the cerebellum, a region relatively devoid of SERT sites, and to subsequently use that estimate in the analysis of receptor-rich region kinetics. This approach has been used successfully to improve the kinetic parameter estimation of several radioligands such as [11C]flumazenil (Price et al., 1993), [123 I]iomazenil (Laruelle et al., 1994), or [11C]MDL 100,907 (Watabe et al., 2000). Method C did not allow identification of k3 and k4 individually, but was found to provide reasonably precise estimates of the ratio between the two rate constants k3/k4. The difficulty in deriving reliable individual estimates of k3 and k4 from a 2CM three parameters configuration while obtaining a relatively stable ratio between both parameters has already been reported by Koeppe et al. (1991) for kinetic analysis of [11C]flumazenil. This problem with parameter identifiability is because of the rapid equilibration occurring between the free and nonspecific and the specifically bound ligand compartments that preclude their kinetic identification with accuracy. The rapid rate of [11C]flumazenil binding as compared with its brain delivery rate has led Koeppe et al. (1991) to propose a 1CM kinetic analysis for [11C]flumazenil. This simplified configuration also appears to be the method of choice for [11C]-DASB. Moreover, a strong overall correlation across the 5 subjects was observed (r = 0.96) between k3/k4 (BP) values estimated from Method C and the DV′ values estimated from the 1CM, indicating that DV′ is an appropriate parameter for assessing [11C]-DASB binding site density.
A limitation of the aforementioned kinetic approaches is that both assume that the use of cerebellum as a reference region to estimate free and nonspecific binding is valid. Although postmortem studies did not reveal significant levels of [3H]paroxetine binding in human cerebellum (Cortes et al., 1988; Laruelle et al., 1988; Backström et al., 1989), a 2CM analysis with a more precise identification of receptor-related parameters in cerebellum would further validate this assumption. In an attempt to improve the identifiability of k3 and k4, a second set of methods (Methods D, E, and F) was evaluated that consisted to couple every set of ROI data with a common parameter or a combination of common parameters during the 2CM fitting procedure. These methods have the advantage that no reference region is required to estimate the free and nonspecific binding. Fitting simultaneously data from all regions while coupling parameters that are supposed to be similar across regions increase the amount of data available. This fitting strategy has been shown to substantially increase the identifiability of kinetic parameters (Raylman et al., 1994; Buck et al., 1996, 2000). Because both the free and nonspecific binding and the molecular dissociation constant k4 are expected to be similar across regions, the authors fit their data by coupling either one of these parameters or both.
Coupling both the free and nonspecific binding and k4 substantially reduced the COVs on k3 and k4 estimates, and enabled the 2CM fitting procedure to determine the relative contribution of free and nonspecific and specific pools with acceptable levels of accuracy. k3 values, which are directly related to Bmax, were extremely low in cerebellum, further supporting its use as a reference region for analysis of [11C]-DASB PET experiments.
The ratios k3/k4, which equal Bmax/KD, ranged from 0.31 in the frontal cortex to 2.99 in the hypothalamus with intermediate values of 2.00 in the thalamus. From a conceptual point of view, the ratio k3/k4, as determined in the current study, is similar to the equilibrium specific to nonspecific partition coefficient values noted for V3″ and used by certain authors to evaluate Bmax/KD. V3′ values previously reported for [11C](+)-McN 5652 in humans are close to 0 in several regions of the frontal cortex and are equal 0.92 and 1.63 in thalamus and hypothalamus, respectively (Parsey et al., 2000). The higher SERT density indices obtained with [11C]-DASB as compared with those obtained with [11C](+)-McN 5652 favor [11C]-DASB as a more suitable radioligand for in vivo evaluation of the SERT.
Scan duration is a factor to consider when evaluating a prospective new PET radioligand for clinical evaluation in patients. Indeed, the scan duration needs to be long enough to obtain stable estimates of receptor-related parameters but, at the same time, it has to be short enough both to meet patient compliance and to avoid excessive distortion of the time-activity data by incremental noise. The latter is especially important late in the study because of decay of the short half-life carbon 11 radionucleotide. These criteria were fulfilled with [11C]-DASB because the authors determined that no longer than 80 minutes of data acquisition were needed to provide stable measures of both DV′ and k3/k4 values in all brain regions.
The transient equilibrium, the graphical analysis, the ratio, and the STRM methods gave BP values in good agreement with those obtained with the kinetic Method C. Distribution volume values derived by the graphical and the kinetic (Method A) approaches were strongly correlated, but the graphical approach yielded systematic lower values. Underestimation of DV values derived from the Logan graphical analysis has already been described and has been demonstrated to be caused by the sensitivity of this approach to statistical noise (Abi-Dargham et al., 2000). However, the advantage of estimating DV with the graphical approach is that no assumption is required concerning the rate of equilibration between compartments. When compared with the BP obtained with the kinetic approach, the graphical and the transient equilibrium approaches yielded the smallest errors in BP estimates (5% average underestimation for both methods). However, the need for arterial sampling and plasma metabolite analysis in the graphical approach and the inapplicability of the transient equilibrium approach in SERT-rich regions when 90 minutes of PET data are considered preclude their use for derivation of BP values in routine clinical studies.
The SRTM method slightly underestimated BP (by an average of 7%), whereas large overestimations of BP (by an average of 14%) were obtained when using the ratio method. The ratio method used late time-activity data that are not obtained under equilibrium conditions and that have been demonstrated to be more affected by statistical noise (Lammertsma et al., 1996; Ito et al., 1998). This can explain at least in part the larger errors obtained with this method. Moreover, the simulation study indicated that the errors introduced by decreases in regional CBF in target brain regions relative to the reference region on the determination of BPratio were larger than 10% in SERT-rich regions. The authors concluded that the SRTM method is the most suitable method for routine quantification of SERT density indexes using PET and [11C]-DASB, because it estimates BP values with reasonable bias, it does not require determination of an arterial input function, and this method, as theoretically predicted, is not sensitive to potential differences in CBF between the target and the reference regions.
In summary, [11C]-DASB can be used to visualize and quantify SERT density in the human brain. The distribution of radiotracer accumulation is consistent with the known densities of SERT sites. The 1CM was more applicable than the standard 2CM, as the latter exhibited problems with model convergence. A constrained 2CM with estimation of 3 kinetic parameters did not improve goodness of fits as compared with the 1CM, but did provide stable BP estimates that were significantly correlated with the density of SERT sites reported in vitro. Thus, calculation of the BP from a 2CM (3 parameters) or an estimation of DV′ from the simplified 1CM are the 2 alternatives for estimation of SERT densities using [11C]-DASB. Simplified quantitative methods based on the use of cerebellum as a reference region gave BP values in good agreement with those obtained using the kinetic approach. Among the four simplified methods evaluated, the SRTM method was chosen as the most suitable because it gave the best trade-off between lowest errors in BP estimates, easy applicability for routine use, and lowest sensitivity to potential changes in regional CBF.
The suitability of [11C]-DASB for quantitative examination of the SERT in vivo using PET is thus supported by the observations that tissue data can be described using a kinetic analysis and that simplified quantitative methods, using the cerebellum as a reference region, provide reliable estimates of SERT binding parameters.
Footnotes
Acknowledgments:
The authors gratefully acknowledge Kevin Cheung for assistance during the PET experiments, Verdell Goulding for the subject's recruiting, and Armando Garcia, Jin Li, and Ruiping Guo for radiochemistry support.