
Abstract
This article describes the kinetic modeling of [11C]SL25.1188 ([(S)-5-methoxymethyl-3-[6-(4,4,4-trifluorobutoxy)-benzo[
INTRODUCTION
Monoamine oxidase B (MAO-B) is an important enzyme on the outer mitochondrial membrane found mainly in serotonin releasing neurons and astrocytes in the brain.1–3 It has several key roles including metabolizing monoamines such as dopamine, norepinephrine, benzylamine, and tyramine, but also influencing apoptosis and oxidative stress. 1
Given these roles it has been proposed that abnormalities of MAO-B level and function contribute to the pathology of Alzheimer's disease, Parkinson's disease, Huntington's disease, major depressive disorder, and substance abuse. 1 To date, investigations have largely focused on Alzheimer's disease, for which abnormally elevated MAO-B levels in the prefrontal cortex are frequently found, 4 and Huntington's disease, for which elevated MAO-B level in the striatum was reported, 5 and cigarette smoking, for which globally reduced MAO-B binding was found. 6 Selective MAO-B inhibitor therapeutics have been approved for the treatment of major depressive disorder and Parkinson's disease and are under development for Alzheimer's disease. The broad range of illness for which abnormal MAO-B levels are implicated suggest high impact on diseases for society. Investigations of MAO-B in this broader range of conditions could be facilitated by the availability of highly quantitative MAO-B imaging methods with positron emission tomography (PET).
Several MAO-B radiotracers for PET have been developed but only [11C]L-deprenyl
7
and its derived [11C]L-deprenyl-D2
8
have been evaluated
[11C]SL2511.88 is a new radiotracer that is selective for MAO-B.12,13 On tail-vein administration in rats, <3% radioactive metabolites are present in rat brain 30 minutes after injection (this work). In baboon, this radiotracer shows desirable properties with high brain uptake, reversible TACs, and binding values proportional to known MAO-B density. 13 Further investigations of this technique had largely stopped due to the challenges with the original radiosynthesis that required the use of carbon-11 labeled phosgene, which requires specialized apparatus, expertise and is limited to very few laboratories worldwide. To address this barrier, our group developed a synthesis route that that takes advantage of a new technology, [11C]carbon dioxide fixation 14 does not require phosgene. 15
In the present study, we sought to investigate [11C]SL2511.88 as a suitable radioligand to image MAO-B in humans. We investigated: (1) whether one-tissue compartment or two-tissue compartment models (1-TCM of 2-TCM) fit better the TAC, (2) the identifiability of total distribution volume (1/T), the distribution volume of the specifically bound radiotracer (1/s), and the binding potential (BPND), (3) whether the regional values of such parameters were correlated with the known densities of MAO-B in the same regions; (4) the stability of these parameters in relation to the length of PET scanning; and (5) the reproducibility of these parameters under test-retest conditions.
MATERIALS AND METHODS
Radiosynthesis of [11C]SL2511.88
The radiotracer was synthesized using [11C]CO2 fixation techniques as previously described. 15 Cyclotron-produced [11C]CO2 in N2 was bubbled at 10mL/min into a solution of (S)-1-methoxy-3-[6-(4,4,4-trifluorobutoxy) benzo[d]isoxazol-3-ylamino]propan-2-ol (0.3 μmol) and 2-tert-butylimino-2-diethylamino-1,3-dimethyl-perhydro-1,3,2-diazaphorine (BEMP; 1%, v/v) in dry CH3CN (100 μL) in a septum-sealed 1-mL conical glass vial at ambient temperature. After 1 minute, a solution of phosphorus oxychloride (POCl3) (0.2%, v/v) in dry CH3CN (100 μL) was added. After 30 seconds, the reaction was quenched with buffer and purified by high-performance liquid chromatography before formulation and sterilization.
Metabolite Studies in Rat
All animal experiments were performed under humane conditions, with approval from the Animal Care Committee at the CAMH, and in accordance with the guidelines set forth by the Canadian Council on Animal Care. Determination of the extent of formation of radioactive metabolites in rat brain extracts and rat plasma was performed as previously described.
16
Briefly, rats (male, Sprague-Dawley, 300 to 350 g) were injected with 50 to 100MBq of high specific activity [11C]SL25.1188 (1 to 2 nmol) in 0.3mL of buffered saline
Human Subjects
Seven healthy volunteers (4 men and 3 women; age, 19 to 49 years) participated in this study. All subjects were free of current medical and psychiatric illness based on history (including structured clinical interview for DSM-IV), physical examination, electrocardiogram, urinalysis (including drug screening), and blood tests (complete blood count and serum chemistry). All subjects provided written informed consent after all procedures were fully explained. Research Ethics Board approval was obtained at the Centre for Addiction and Mental Health.
Positron Emission Tomography Protocol
Each subject was scanned twice (5 ± 1 weeks of separation). The injected mass and injected radioactivity of [11C]SL25.1188 ranged from 0.6 to 2.3 μg and from 7.2 to 10.5 mCi, respectively. A custom-fitted thermoplastic mask was made for each subject and used with a head fixation system during PET measurements to minimize head movement. The PET scanning was performed using a 3D High Resolution Research Tomograph (HRRT) (CPS/Siemens, Knoxville, TN, USA), which measures radioactivity in 207 slices with an interslice distance of 1.22 mm. The detectors of the HRRT are an LSO/LYSO phoswich detector, with each crystal element measuring 2 × 2 × 10mm3. A transmission scan, measured using a single photon point source, 137Cs (
The images were reconstructed into 28 time frames: The first frame was of variable length being dependent on the time between the start of acquisition and the arrival of [11C]SL2511.88 in the tomograph field of view. The subsequent frames were defined as 5 × 30 seconds, 1 × 45 seconds, 2 × 60 seconds, 1 × 90 seconds, 1 × 120 seconds, 1 × 210 seconds, and 16 × 300 seconds. All images were decay corrected.
Head movement in the dynamic PET acquisition was corrected using frame-by-frame realignment. Low noise, nonattenuation-corrected images (created with iterative reconstruction) were used to optimize the frame-by-frame realignment process. A normalized mutual information algorithm was applied with SPM8 (Wellcome Trust Centre for Neuroimaging, London, UK) to coregister each frame to the frame from 12.25 to 17.25 minutes after the radioligand arrives to the field of view (frame number 13), which showed a high signal-to-noise ratio. Parameters from the normalized mutual information were applied to the corresponding attenuation-corrected dynamic images to generate a movement-corrected dynamic image.
Measurement of [11C]SL2511.88 in Plasma
Arterial sampling was withdrawn continuously for the first 22 minutes from the radial artery cannula and counted using an automatic blood sampling system (ABSS, Model # PBS-101 from Veenstra Instruments, Joure, Netherlands). Polytetrafluoroethylene tubing was used to minimize tube adhesion of [11C]SL2511.88. The rate of the blood pump was 350 mL/h the first 7.25 minutes and then slowed to 150 mL/h. In addition, manual samples were taken close to the wrist of the subject at
An aliquot of each manual blood sample was taken to measure radioactivity concentration in total blood. Samples at
was used to fit the blood-to-plasma ratios with HCT fixed to the measured value. The remaining volume of each manual plasma sample was used to determine the fraction of parent radioligand in plasma (
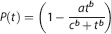
For the kinetic analysis, the input function was a metabolite-corrected plasma curve generated by multiplying the plasma TAC by the fraction of parent radiotracer. The input function and the blood TAC were extended from 80 to 90 minutes using an exponential extrapolation from the discrete samples at 30, 45, 60, and 80 minutes of parent compound in plasma and blood, respectively.
Magnetic Resonance Image and Regions of Interest Delineation
For the anatomic delineation of regions of interest (ROIs), a brain magnetic resonance image was acquired for each subject. The magnetic resonance scans were performed on a Discovery MR750 3.0T GE scanner (Milwaukee, WI, USA) equipped with an 8-channel headcoil. 2D axial proton density images were acquired as follows: fast spin echo imaging, echo time/repetition time/echo train length = MinFull/6s/8, receiver BW ± 15.63kHz, field of view = 22 cm, 256 × 256 sampling matrix, slice thickness = 2 mm and a parallel imaging acceleration factor of 2. Regions of interest for the cerebellar cortex, head of the caudate (hereafter referred to as caudate), putamen, frontal cortex, temporal cortex, anterior cingulate cortex, thalamus, and pons were automatically generated based on individual proton density-magnetic resonance images using in-house imaging pipeline, ROMI. 22 ROMI utilizes computer vision techniques based on the probabilities of gray matter to fit a standard template of ROIs to an individual high-resolution magnetic resonance image scan. The individual MRIs are then registered to a frame averaged PET image so that the individual refined ROI template is transformed to the PET image space to allow the TAC generation from each ROI. Coregistration was done using SPM2 (Wellcome Trust Centre for Neuroimaging, London, UK), which optimizes a measure of normalized mutual information. 23 Activities measured were normalized to standard uptake value (SUV) dividing by injected dose/weight of the subject.
Kinetic Analysis
Following the definitions proposed in a consensus nomenclature for reversibly binding radioligands,
24
TAC data were analyzed with 1-TCM to estimate
Delay and Dispersion
The radioactivity in the blood, as measured by the ABSS,
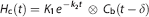
The deconvolution was performed iteratively using the Landweber method (30 iterations in the Fourier space) (Equation (44) in ref 30, referred as ‘reblurred’ Van Cittert):
For the estimation of δ, the initial rise of the TACs was approximated by the whole brain TAC ‘head curve’
δ was fixed to the same value for all ROIs.
Nonlinear Least Square Fitting
Nonlinear fitting of the kinetic models was performed with the Levenberg-Marquardt algorithm using a trust-region implemented in the function
Each model configuration was implemented to account for the contribution of activity from the cerebral blood volume assuming that cerebral blood volume was 4% of the cortical gray-matter tissue. 31
The percent coefficient of variation (COV = 100% standard error/mean) was used to measure the identifiability of the kinetic variables. The standard error was estimated from the diagonal of the covariance matrix. A smaller COV indicates better identifiability.
All data points were included in the fitting and brain data for each frame were weighted relative to other frames based on the trues

where
Statistics
Goodness of fit was evaluated using the Akaike Information Criterion (AIC) 33 and the Model Selection Criterion (MSC). 34 Lower AIC and higher MSC values were indicative of a better fit. Group data are expressed as mean ± SD.
The test-retest reproducibility was evaluated in three ways: (1) within-subject variability and between-subject variability were calculated and expressed as a standard deviation and COV, (2) test-retest variability (TRV) was calculated as the mean across subjects of the ratio of the absolute difference between measurements to average of the measurements, and (3) reliability (intraclass correlation coefficient (ICC)) calculated according to the following equation:
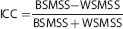
where BSMSS and WSMSS are the mean sum of squares between and within subjects, respectively. This coefficient is an indicator of the relative contributions of the two sources of variance and while a value of — 1 is associated with all variability attributable to within-subject variance, a value of 1 is associated with all variability associated with between-subject variance.
RESULTS
Arterial Blood Analysis
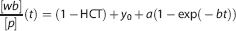
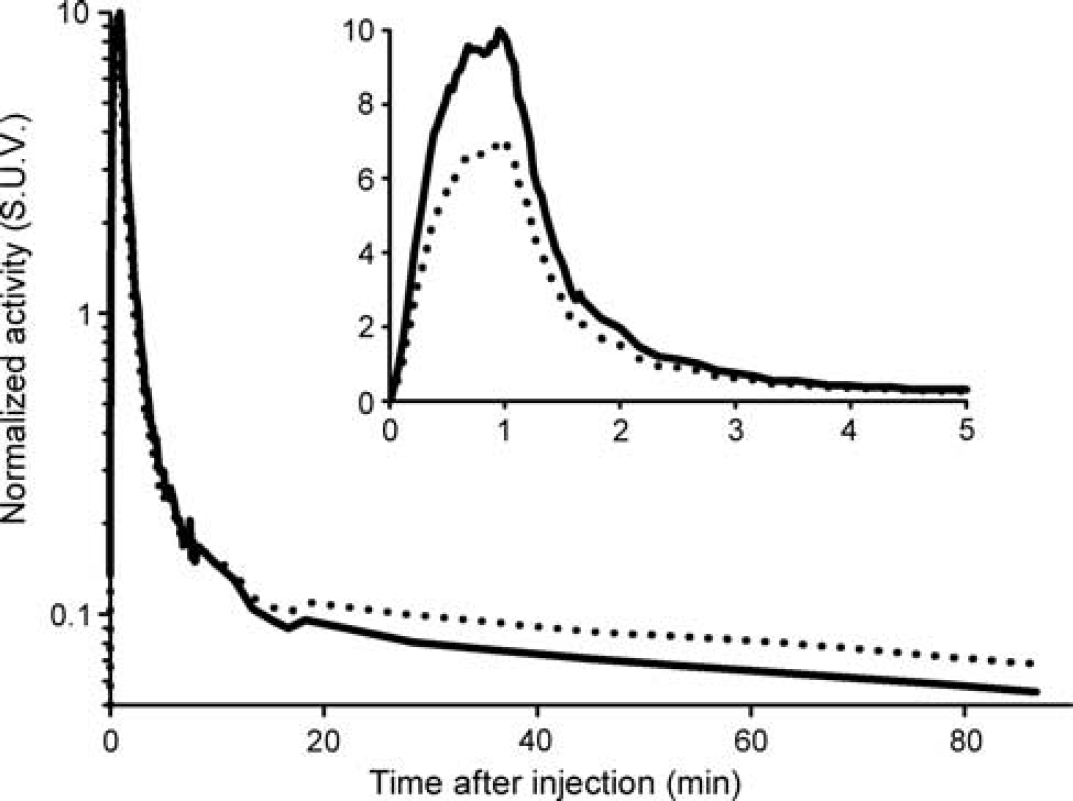
Radioactivity in blood (Figure 1) reaches a maximum of 6.8 SUV at 70 seconds after injection, followed by a quick washout. The ratio of blood to plasma started in a value close to 1-HCT (hematocrit) and after 30 minutes reached a plateau at around 0.99 (Supplementary Figure S2). The mono-exponential (Equation (1)) fitted the discrete samples with HCT = 0.42 ± 0.04,
Average (
The average curve of unmetabolized [11C]SL25.1188 in plasma taken into account the correction by dispersion (Figure 1) reaches a maximum of 10 SUV 60 seconds after injection and thereafter rapidly declines. The radioactivity 2 minutes after the peak is 10% of the peak value. Free fraction was 0.82 ± 0.07% (
Brain Uptake
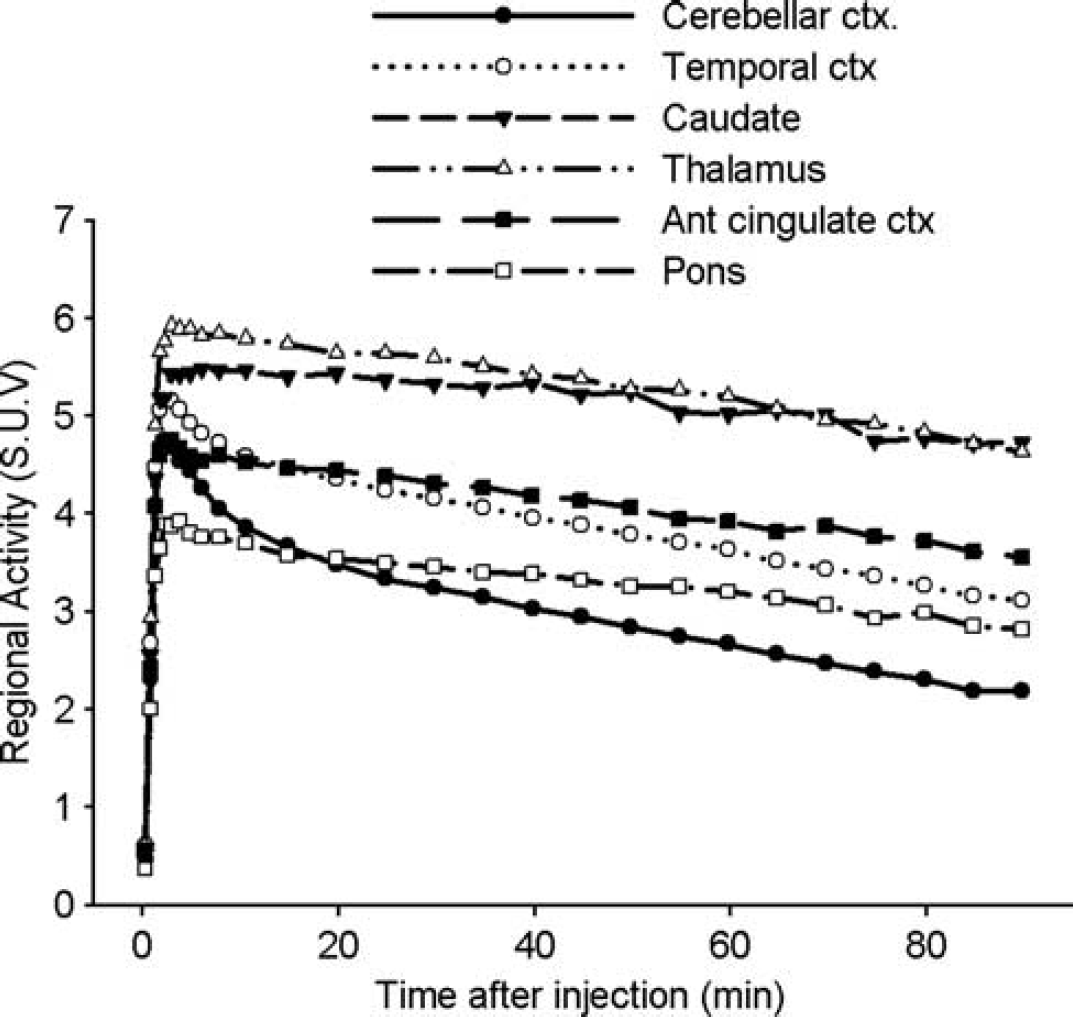
After [11C]SL25.1188 injection, all subjects showed high brain uptake of radioactivity that peaked between 2 and 6 minutes across the regions and declined more quickly in regions known to have lower MAO-B levels as compared with regions with higher concentrations of MAO-B (Figure 2; Supplementary Figure S1). At one extreme, the caudate showed a peak of 5.5 SUV at 6 minutes follow by a slow washout, such that at the end of the scan the activity was reduced only by 15% respect to the peak value. On the other, the cerebellar cortex showed a peak of 4.7 SUV earlier at 2 minutes followed by a quick washout, showing at the end of scan an activity 54% lower than the peak value. The cortical areas peaked simultaneously to the cerebellum at 5.2 SUV and then washed out to values 40% lower than of the peak value. The putamen and thalamus peaked higher and earlier than caudate, and presented a faster washout. The pons peaked lower than the rest of the ROIs. Radiotracer uptake in the PET image was consistent with the postmortem studies of MAO-B distribution.2,35
Average (
Kinetic Analysis
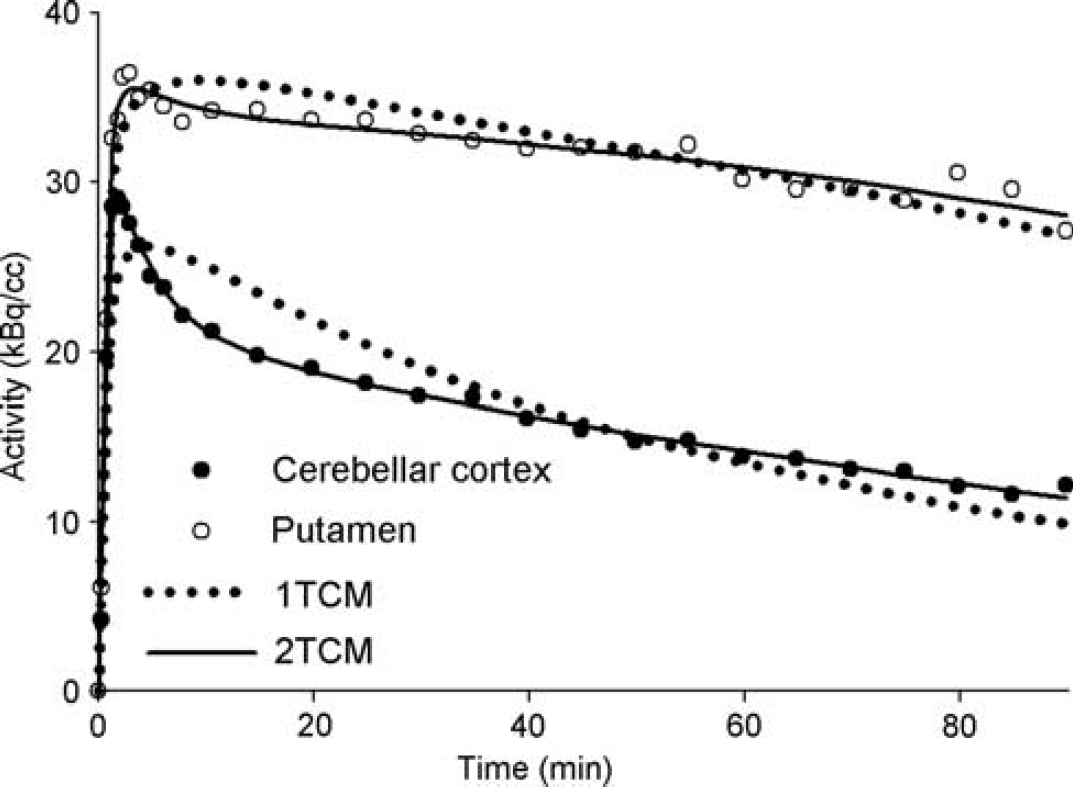
Regional activities in the cerebellar cortex (black circles) and putamen (white circles) for a single scan. Circles are the measured values; continues lines are the best fitting with a two-tissue compartment model (2-TCM) and the dotted lines are the best fitting with a one-tissue compartment model (1-TCM).
Regional kinetic parameter (mean ± SD) of seven subjects obtained with a 2-TCM using full length of scan data (90 minutes)
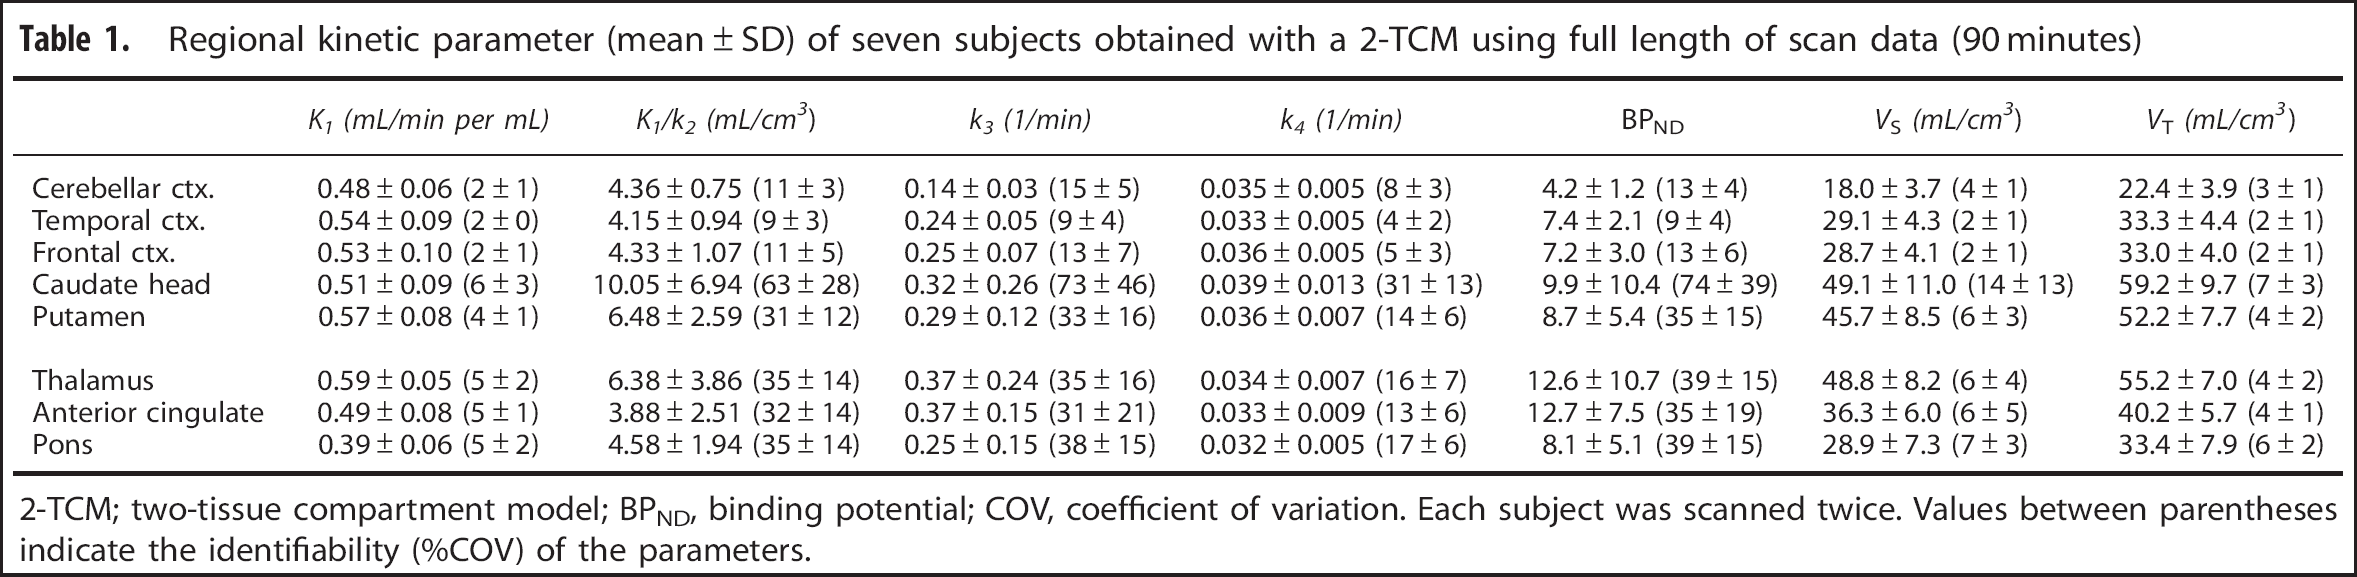
2-TCM; two-tissue compartment model; BPND, binding potential; COV, coefficient of variation. Each subject was scanned twice. Values between parentheses indicate the identifiability (%COV) of the parameters.
Reproducibility of [11C]SL25.1188 total distribution volume (
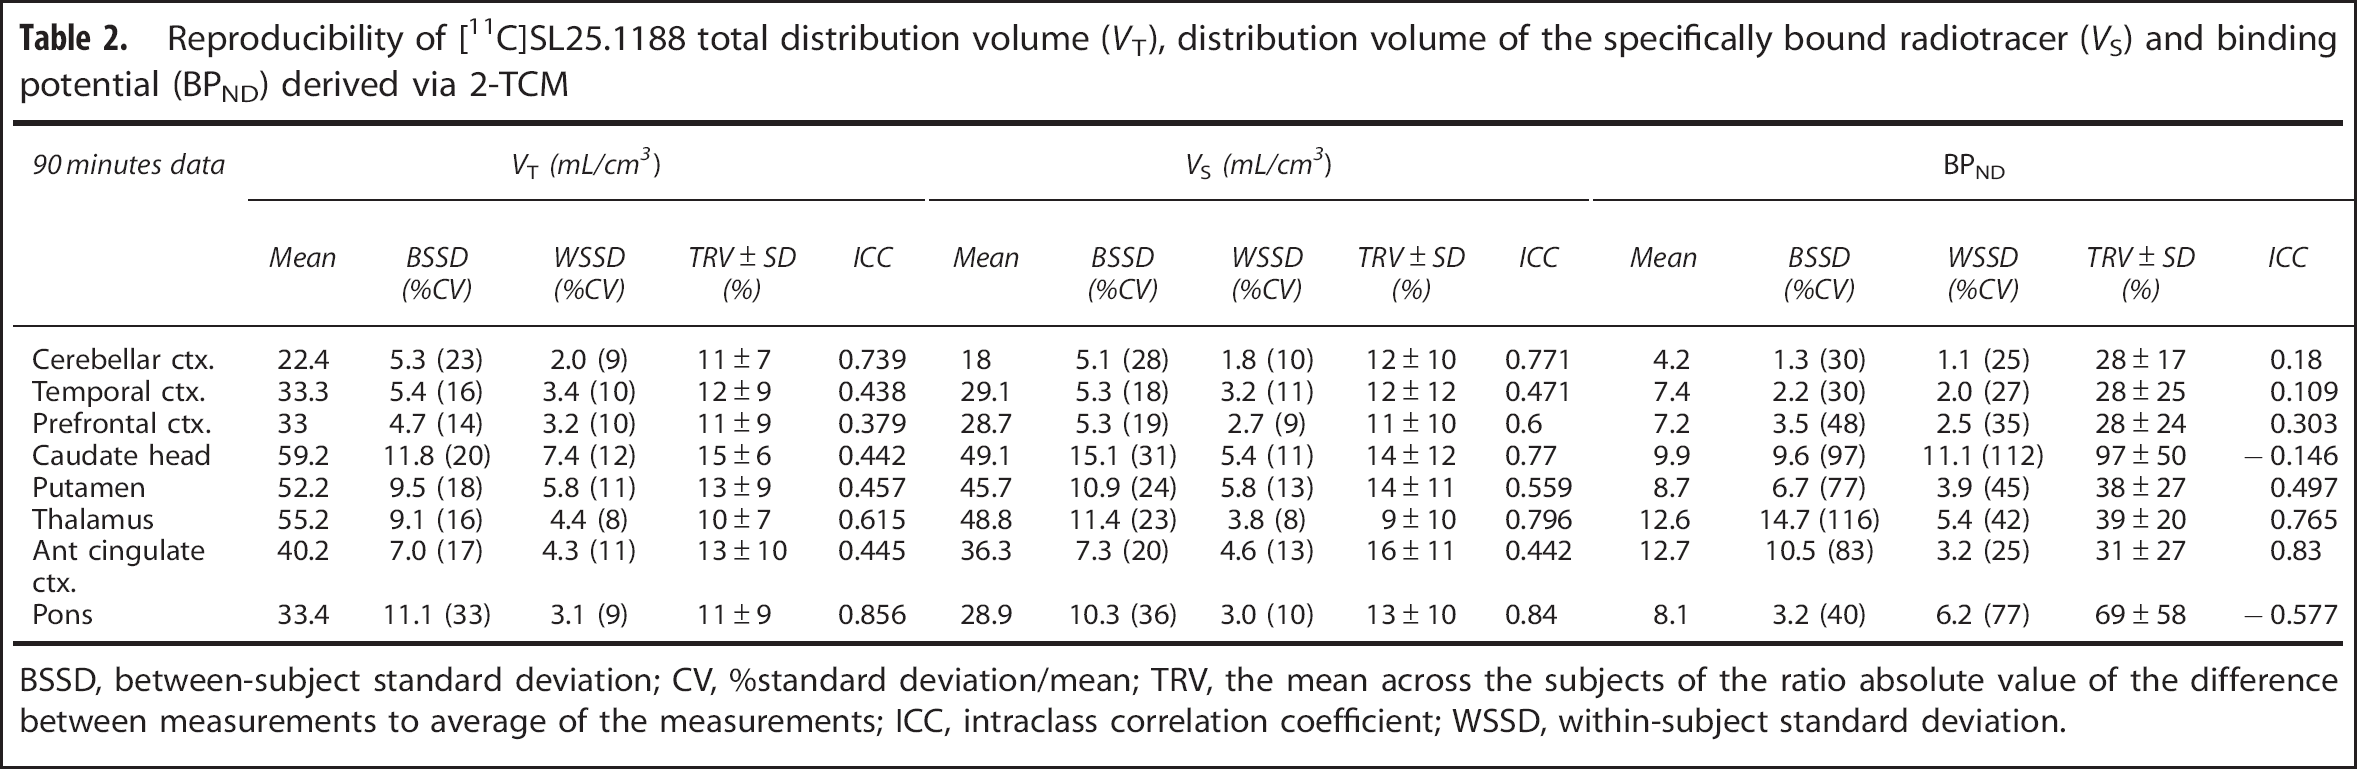
BSSD, between-subject standard deviation; CV, %standard deviation/mean; TRV, the mean across the subjects of the ratio absolute value of the difference between measurements to average of the measurements; ICC, intraclass correlation coefficient; WSSD, within-subject standard deviation.
The TRV for
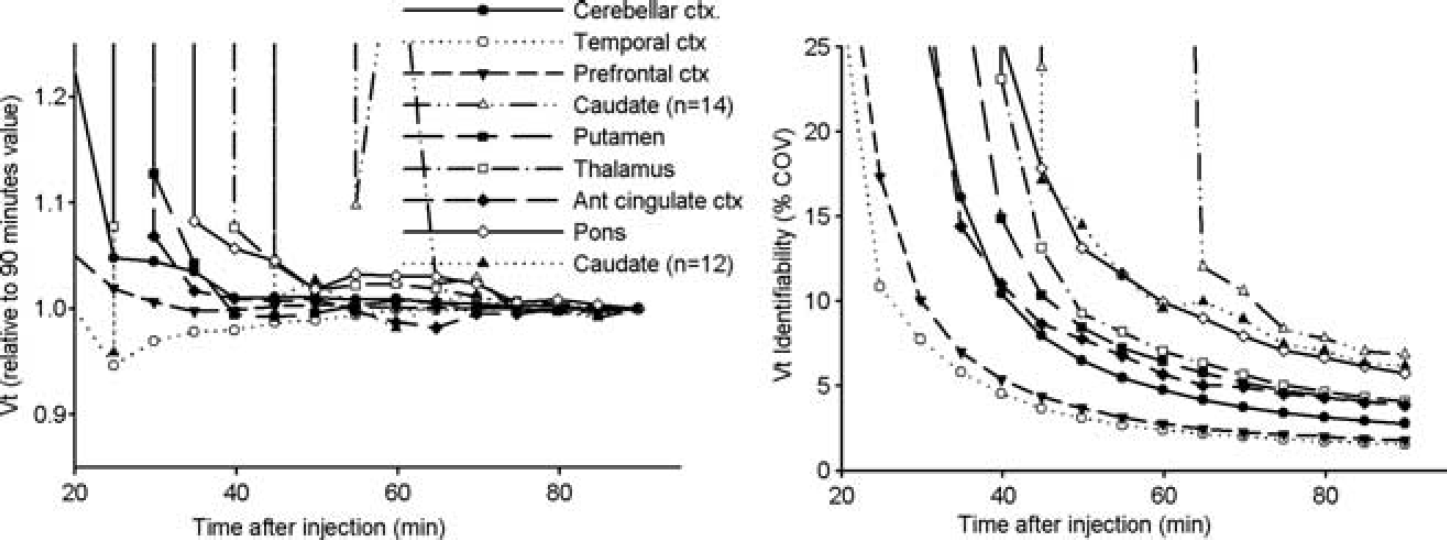
Regional average convergence of
The caudate had the highest uptake and therefore the TAC presented the slowest washout, and due to the small size of the ROI, TACs were noisy. In only one scan of two participants, 2-TCM provided an unacceptable solution (COV(
COV(
Linear Graphical Analysis
Comparison with Human Postmortem Data
Our group recently published an extensive set of ROIs data showing regional postmortem concentration of MAO-B by quantitative immunoblotting in a set of healthy subjects with a wide age range.
35
Correlations (Figure 5) between the regional magnitudes to quantify [11C]SL25.1188 in this work and the ones in the postmortem study are excellent:
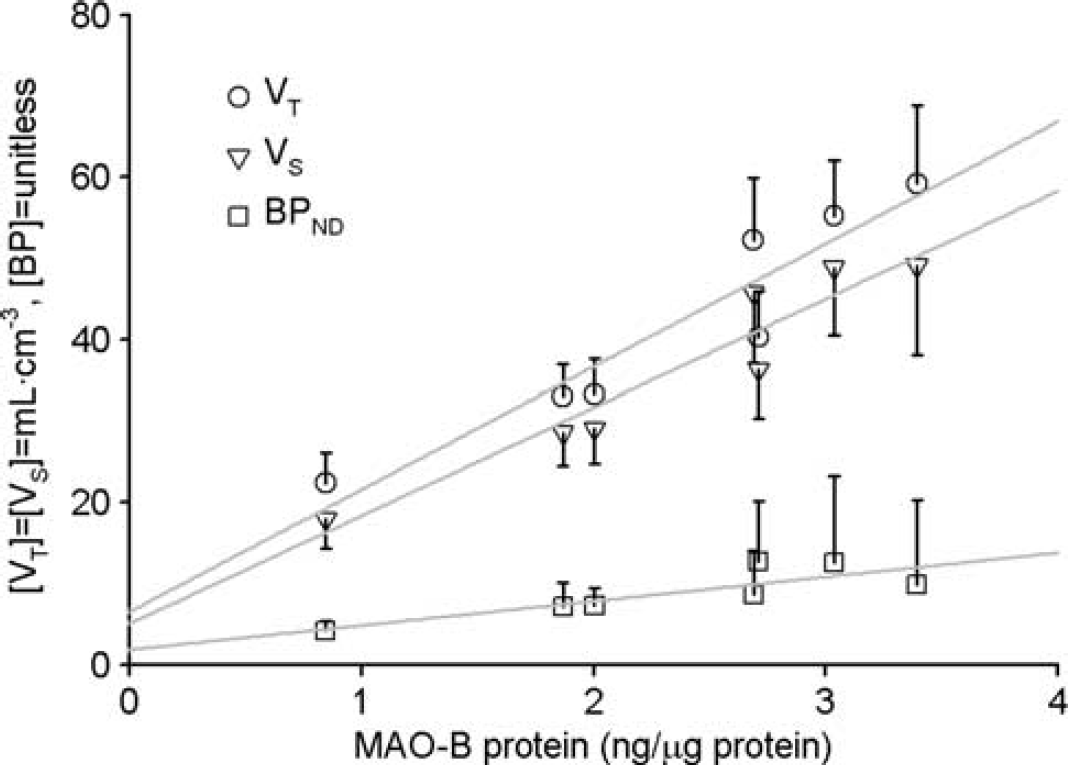
Comparison of regional average (
DISCUSSION
This work describes the first
This study did not include blocked experiments, therefore despite the good identifiability, reproducibility and correlation between
The convergence of
Logan graphical method
The ratio of whole blood to plasma was extrapolated from the first data sample at 3.5 minutes to the time of injection using a mono-exponential (Equation (1)). As this ratio was only 7% higher than 1-HCT it is apparent that the radiotracer partitions almost exclusively into the plasma or penetrates into red blood cells only slowly. The result was confirmed in an
The constant of dispersion τ =10 seconds measured for [11C]SL25.1188 with the rate pump at 350 mL/h in saline solution is higher than for other radiotracers [18F]fluoride (τ ˜ 3.5 seconds) or [11C]FLB (τ ˜ 5 seconds). We attribute that to some degree of stickiness from the radioligand to the tube of the ABSS. It has been reported 19 that stickiness to the ABSS tubing has been related to residual radioactivity during the flushing periods. We indeed observed in some cases a low residual radioactivity in the ABSS during the flushing periods. However, the residual was too low (around 1 count per second in the 1,022 keV window) for precise quantification and the amount depended strongly on the length of the flushing period. For example, in the typical experimental set-up for studying dispersion on ABSS, 37 using the ABSS pump to flush, 1 minute of flushing with the pump at 350 mL/h (6mL) removed the radioligand completely which would imply that the stickiness was weak or at least did not accumulate irreversibly. Finally analyzing the data ignoring dispersion or with τ = 5 seconds did not show significant changes in the parameters measured when the length of scan was 60 minutes or above provided the delay was adjusted properly (Equation (3)).
Despite the fact that cerebral blood volume varies in the brain, we used the fraction volume of blood in the ROI (
The ED50 of the radiotracer for occupancy of MAO-B has not been established in human subjects. The issue whether the radioligand was injected at tracer dose has not been addressed in this study. A plot between mass injected and
The average value of
The value of
CONCLUSION
[11C]SL25.1188 shows high penetration into human brain and good reversibility properties.
Footnotes
The authors declare no conflict of interest.
ACKNOWLEDGMENTS
The authors thank the staff of the PET Centre for the acquisition of data, Peter Bloomfield for PET concepts, Marco Farinati for mathematical concepts, and Junchao Tong for his expert knowledge in postmortem MAO.
References
Supplementary Material
Please find the following supplemental material available below.
For Open Access articles published under a Creative Commons License, all supplemental material carries the same license as the article it is associated with.
For non-Open Access articles published, all supplemental material carries a non-exclusive license, and permission requests for re-use of supplemental material or any part of supplemental material shall be sent directly to the copyright owner as specified in the copyright notice associated with the article.