
Abstract
This article describes the kinetic modeling of [11C]-harmine binding to monoamine oxidase A (MAO-A) binding sites in the human brain using positron emission tomography (PET). Positron emission tomography studies were performed in healthy volunteers at placebo conditions and after treatment with clinical doses of moclobemide. In either condition, a two-tissue compartment model (2CM) provided better fits to the data than a one-tissue model. Estimates of k3/k4 values from an unconstrained 2CM were highly variable. In contrast, estimates of the specifically bound radioligand distribution volume (DVB) from an unconstrained 2CM were exceptionally stable, correlated well with the known distribution of MAO-A in the brain (cerebellum <frontal cortex ≈ putamen <temporal cortex ≈ cingulate <thalamus) and thus provided reliable indices of MAO-A density. Total distribution volume (DV) values were also highly stable and not different from those estimated with the Logan approach. Fixing the DV of free and nonspecifically bound radiotracer (DVF + NS) or coupling DVF + NS between brain regions enabled more stable estimates of k3/k4 as compared with an unconstrained 2CM. Moclobemide treatment leads to a 64% to 79% MAO-A blockade across brain regions, a result that supports the specificity of [11C]-harmine binding to MAO-A. The stability and reliability of DVB values obtained from an unconstrained 2CM, together with the computational simplicity associated with this method, support the use of DVB as an appropriate outcome measure for [11C]-harmine. These results indicate the suitability of using [11C]-harmine for quantitative evaluation of MAO-A densities using PET and should enable further studies of potential MAO-A dysregulation in several psychiatric and neurologic illnesses.
Introduction
Monoamine oxidase (MAO) is a mitochondrial enzyme which catalyzes the oxidative deamination of biogenic amines. In the brain, MAO is responsible for the metabolic inactivation of dopamine, noradrenaline, and serotonin and thus plays a central role in the regulation of these neurotransmitter levels. In mammals, two isoforms of the enzyme have been identified on the basis of their biochemical properties, substrate selectivity, and gene products (Shih et al, 1999). Monoamine oxidase-A preferentially oxidizes serotonin and noradrenaline while MAO-B preferentially oxidizes the trace amine phenethylamine. Dopamine is a substrate for both isoenzymes. The physiologic roles of MAOs are related to the nature of their substrates and selective inhibition of these isoforms is used to treat a variety of pathologic conditions. Inhibition of MAO-A is useful in the treatment of depression and anxiety disorders (Livingston and Livingston, 1996) while inhibition of MAO-B is more specifically used to treat neurodegenerative disorders such as Parkinson's disease (Cohen, 1990).
The ability of MAOs to catabolize neurotransmitters has made these enzymes attractive candidates in the study of psychiatric and neurologic diseases as well as in the study of brain function. Many studies report apparent associations between abnormal platelet MAO activity and susceptibility to depression and suicidal behavior (Murphy and Weiss, 1972), schizophrenia (Lewine and Meltzer, 1984), Parkinson's disease (Jarman et al, 1993), Huntington's chorea (Mann and Chiu, 1978), alcoholism (Fowler et al, 1981), and smoking (Oreland et al, 1981). In these early studies, platelets were viewed as an accessible tissue to measure MAO activity, which was considered as an index of the enzyme activity in the brain. However, platelet MAO in human is exclusively of the MAO-B-type (Youdim, 1988) and provides no insight on the activity of the MAO-A-type.
Several lines of evidence indicate that abnormalities in brain MAO-A activity are involved in the pathogenesis of depressive illness and suicidal behavior. For instance, successful treatment of unipolar and bipolar depression is achieved using specific inhibitors of MAO-A such as clorgyline (Lipper et al, 1979) and moclobemide (Angst and Stabl, 1992). Only a few studies have aimed at measuring MAO-A activity in the brain in relation to depression and these have provided conflicting results. While a significant elevation of MAO-A activity was found in the hypothalamus of depressed suicide victims (Sherif et al, 1991), other studies showed no significant differences in MAO-A activity in any brain regions of depressed suicide victims when compared with controls (Mann and Stanley, 1984; Ordway et al, 1999). Comparison of results obtained in the post-mortem brain has however been hampered by several confounding factors such as small sample sizes, insufficient matching criteria for controls, different methodology used to measure MAO activity, comorbidity between the use of medication, alcohol, or cigarette smoking, and the disease condition.
To circumvent these problems, several radioligands have been developed for in vivo imaging of MAO-A using positron emission tomography (PET) in living humans (Ametamey et al, 1996; Bottlaender et al, 2003; Fowler et al, 1987; Ohmomo et al, 1991, 1993). Bergstrom et al (1997a) have reported on the synthesis of five different 11C-labeled MAO-A inhibitors as potential radioligands for PET imaging of the enzyme. Among them, [11C]-harmine is a β-carboline derivative, which is a competitive and reversible inhibitor of MAO-A with a Ki of 5 nmol/L (Kim et al, 1997). In vitro binding studies in rats have shown its binding is specific to MAO-A as it is inhibited by nanomolar concentrations of the selective MAO-A inhibitor clorgyline and only marginally affected by fairly selective MAO-B inhibitors such as deprenyl and pargyline (Bergstrom et al, 1997b). In vivo PET studies in monkeys and humans have already showed its potential for imaging MAO-A (Bergstrom et al, 1997b, c). In both species, [11C]-harmine showed favorable kinetics and displayed sensitivity to pretreament with selective MAO-A inhibitors such as moclobemide and esuprone. Although these earlier studies clearly suggest that [11C]-harmine may be a useful PET radioligand for the visualization and quantification of MAO-A in human, no kinetic modeling approach has ever been applied to quantify the binding of this radioligand in vivo.
The aim of the present study was to evaluate the prospect of using PET and [11C]-harmine for quantification of MAO-A binding sites in the human brain. Regional brain uptake curves of [11C]-harmine were quantified using kinetic modeling analyses based on either one- or two-tissue compartments, both at placebo condition and after treatment with moclobemide. Moclobemide is a short-acting, reversible, and selective MAO-A inhibitor that has proven to be efficacious in the treatment of major depression (Angst and Stabl, 1992). In addition, the performance of the Logan graphical approach (Logan et al, 1990) was also evaluated to determine the simplest kinetic method for quantification of [11C]-harmine binding data in routine clinical research.
Methods
Subjects
This study was approved by the Human Subjects Review Committee of the University of Toronto. Five healthy male volunteers free of neurologic or psychiatric diseases, with no past or current history of cigarette smoking, were recruited for the study. None of the subjects took central nervous system acting medication or drugs within 3 months before enrolment in the study. Subjects were asked not to drink alcohol the day before PET scanning and not to drink beverages with caffeine on the day of a PET scan. In all cases, written informed consent was obtained before participation. The age and weight of the subjects were 34 ± 11 years (range: 20 to 49 years) and 81 ±13 kg (range: 70 to 100 kg), respectively (mean ± s.d., n = 5).
Each subject was scanned with PET and [11C]-harmine on two different occasions using a double-blind, counterbalanced procedure. On one occasion, subjects were examined after 10 days treatment with oral placebo and on the other occasion, subjects were examined after 10 days treatment with moclobemide (Manerix®, Hoffmann-La Roche Limited, Mississauga, Canada). The washout period between treatment conditions (placebo versus moclobemide) was at least 8 weeks. When placed on moclobemide treatment, subjects received twice-daily dose (b.i.d.) of 150 mg moclobemide for 3 days and then 300 mg b.i.d. for 7 days. These daily doses of moclobemide are within the therapeutic dose range for moclobemide in most acute phase trials (Bonnet, 2003) and 300 mg b.i.d. is also the highest clinical dose that has a minimal risk for a hypertensive crisis. Moreover, a 10-day treatment period has been shown to be sufficient to reach steady-state plasma levels as the elimination half-life of moclomebide is approximately 2 h (Bonnet, 2003). When placed on placebo treatment, the subjects received placebo tablets twice daily for 10 consecutive days. Drug or placebo intakes took place at 8 a.m. and at 7 p.m. daily. On day 10, PET scans of [11C]-harmine binding were obtained 4 h after the last morning dose of either placebo or moclobemide. Subjects then continued to take 150 mg of moclobemide or placebo 3 days after the scan date as a taper.
Radiochemistry
[11C]-methylation of normethylharmine was performed inside an HPLC sample loop using our previously described method (Wilson et al, 2000). Briefly, precursor harmol (1-methyl-9H-pyrido[3,4-b]indol-7-ol, 1.0 mg) was dissolved in dimethylformamide (DMF) [77 μL) and treated with tetrabutylammonium hydroxide solution (1 N in MeOH, 3 μL). This solution was loaded onto an HPLC injection loop (2 mL) on a Valco HPLC injector (Houston, TX, USA) valve in the load position. [11C]-iodomethane (produced as previously described; Wilson et al, 1994) was swept into the HPLC loop coated with precursor solution by a stream of N2 gas (8 mL/min) at ambient temperature. When radioactivity peaked in the loop (3 to 4 mins), the flow of N2 was stopped and the reaction allowed to proceed for 1 min at ambient temperature. The contents of the loop were then quantitatively injected onto the HPLC purification column by changing the position of the injection valve from the load to the inject position and the reaction mixture purified by semi-prep HPLC; Phenomenex Prodigy C18 10 μ (250 × 10 mm, 30% CH3CN/70% H2O + 0.1 n NH4HCO2, pH 4, 7 mL/min). The desired fraction was collected, evaporated to dryness at 70°C, and the residue taken up in 10 mL of sterile saline. The saline solution of [11C]-harmine was passed through a sterile 0.22 μm filter into a sterile, pyrogen-free bottle containing aqueous sodium bicarbonate (1 mL, 8.4%). An aliquot (100 μL) of the formulated solution was used to establish the radiochemical purity and specific activity of the final solution by analytical HPLC; Phenomenex Prodigy C18 10 μ (250 × 4.5 mm, 30% CH3CN:70% H2O + 0.1 N NH4HCO2, pH 4, 4 mL/min).
Positron Emission Tomography System
Studies were performed on a brain PET camera system Scanditronix GEMS 2048–15B, which measured radioactivity in 15 brain sections with a thickness of 6.5 mm each (Litton et al, 1990). The intrinsic in-plane resolution of the reconstructed images is 5.5 mm full-width at half-maximum. Transmission scans were acquired with a rotating 68Ge source and used to correct the emission scans for the attenuation of the 511 keV photons through tissue and head support. Images were reconstructed by filtered back-projection using a Hanning 5 mm filter.
Positron Emission Tomography Studies
A thermoplastic mask was made for each subject and used with a head fixation system during the PET measurements. Cannulae were inserted in the radial artery for blood sampling, and in the controlateral arm antecubital vein for radioligand injection. A saline solution of 10.9 mCi (s.d. = 1.0 mCi) of [11C]-harmine at a specific radioactivity of 1,124 Ci/mmol (s.d. = 203 Ci/mmol) was injected intravenously as a bolus and immediately flushed with 10 mL saline. Radioactivity in the brain was measured in a series of sequential frames of increasing duration (from 1 to 5 mins). The total time for measurement of radioactivity in the brain was 90 mins.
An automated blood sampling system (ABSS; Scanditronix, Uppsala, Sweden) was used to measure radioactivity in arterial blood during the first 10 mins of the experiment. It consists of a 30 cm long catheter line, a scintillation crystal detector to measure the concentration of radioactivity in blood, a peristaltic pump to draw arterial blood into the catheter, and a microprocessor datalogger. The pump speed was set at 2.5 mL/min and the concentration of radioactivity in the catheter was measured and stored every 2.5 secs.
At the same time and thereafter, manual blood samples were drawn at 5, 10, 15, 20, 30, 45, 60, or 70 and 90 mins after radiotracer injection. An aliquot of each blood sample was taken to measure radioactivity concentration in total blood. The remainder of blood was centrifuged (1,500g, 5 mins) and a plasma aliquot counted together with the total blood sample using a Packard Cobra II gamma counter cross-calibrated with the PET system. The blood-to-plasma ratios determined from the manual samples were used to correct the blood radioactivity time-activity curve measured by automatic sampling and to generate the plasma radioactivity curve. The remaining volume of each manual plasma sample was used to determine unchanged radioligand and its metabolites in plasma (as described in the next section). A metabolite corrected plasma curve was generated by the product of the two curves and was used as input function (CP(t), nCi/mL) for the kinetic and graphical analyses.
Determination of Radioactive Metabolites in Plasma
Plasma analysis of [11C]-harmine was based on the column capture and switching methods developed by Luthra and Hilton (Hilton et al, 2000; Luthra et al, 1992). Arterial blood samples were withdrawn at predefined times, centrifuged, and whole unadulterated plasma (0.5 to 5 mL) injected onto a small capture column packed with the OASIS™ resin (Waters, Milford, MA, USA). Highly polar metabolites and plasma proteins were eluted with 1% CH3CN in H2O (2 mL/min) through a coincidence flow detector (Bioscan Flow-Count). Less polar metabolites and [11C]-harmine were then back-flushed onto an HPLC column (Phenomenex AquaC18, 5μ, 150 × 4.6 mm) and resolved using 30% CH3CN/70% H2O + 0.1 N ammonium formate (AF). pH 4 as eluent (2 mL/min).
Regions of Interest
Each subject had a brain magnetic resonance imaging (MRI) examination. T1-weighted and proton density images were obtained on a General Electric Medical System Signa 1.5 T MRI scanner. Both T1-weighted and proton density images were acquired with spin-echo pulse sequences. Each subject's MRI scan was coregistered to the PET scan using Rview8/mpr realignment software (Studholme et al, 1997).
Regions of interest (ROIs) for the cerebellar cortex, putamen, thalamus, prefrontal cortex, anterior temporal cortex, anterior cingulate cortex, and posterior cingulate cortex were drawn with reference to the coregistered MRI. Each ROI was drawn in two to four adjacent sections, in both hemispheres, and data from bilateral ROI were pooled to obtain the average radioactivity concentration in the volume of interest. Regional radioactivity was determined for each frame, corrected for decay, and plotted versus time.
Data Analysis
Compartmental kinetic analysis: Kinetic analysis of tissue data was performed with both a one-tissue (1CM) and a two-tissue compartment model (2CM). The 2CM includes: the radioactivity concentration of unchanged radioligand in plasma (CP); the concentration of radioligand free and nonspecifically bound in tissue (CNS + F); and the concentration of radioligand specifically bound to receptor sites (CB). The rate constants K1 (mL/gmin) and k2 (min−1) describe the influx and efflux rates, respectively, for radioligand diffusion through the blood-brain barrier. The rate constant k3 and k4 describe the radioligand transfer between the nondisplaceable compartment (i.e., CNS + F) and the specific binding compartment (CB). Model equations for the 2CM analysis of radiotracer binding to receptors are given by

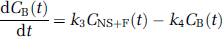
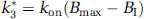
k4 (min−1) is the unimolecular receptor dissociation rate constant koff. The rate constant k3 (min−1) is the product of the bimolecular association rate constant kon and the concentration of available receptors. The number of available receptors is the total number of receptors Bmax less the number of receptor–radioligand complexes, BR, and the number of receptor–inhibitor complexes, BI. Because all experiments were performed at tracer dose and high specific radioactivity, then: BR ≪ Bmax. At such conditions and when no drug is present in the brain, it follows that:

After treatment with an unlabeled drug I, k3 is noted
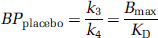
At high specific radioactivity, the radioligand binding potential (BP) corresponds to the ratio of the number of available receptors over KD and is expressed as a function of rate constants as (Mintun et al, 1984):
At placebo conditions:
After a drug treatment:
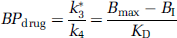
where KD, the radioligand equilibrium dissociation constant (nmol/L), equals to (koff/kon).
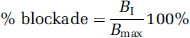
The percentage of enzyme blockade achieved by a drug treatment can be defined as
Assuming competitive inhibition of the enzyme by the drug, the percentage of enzyme blockade can also be calculated by combining equations (5) and (6) and is defined as the percentage reduction of BP obtained after drug treatment as compared with the BP obtained at placebo conditions.
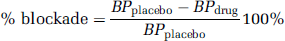
Note that calculation of % blockade using equation (8) assumes that the inhibitor-induced decrement in BP is because of a decrease in the number of available binding sites, with no change in KB. This does not exclude a parallel change in both kon and koff. Invalidation of this assumption would lead to a misestimation of % blockade. For instance, a decrease in kon with no parallel change in kon would lead to an underestimation of the % blockade as obtained with equation (8) when compared with that obtained with equation (7).
The concept of distribution volume (DV; mL g−1) is also frequently used in tracer kinetics to estimate binding site density. The total DV [DVT) has the advantage of being a more stable parameter than the individual kinetic parameters determined from compartmental analysis (Carson et al, 1993; Koeppe et al, 1991). The DVT of a radioligand in a tissue is the volume of tissue in which the radioligand would have to distribute to reach a concentration equal to that in the plasma. It is defined as:

where DVNS + F corresponds to the radioligand DV in the free and nonspecifically bound compartment and DVB to the DV in the specifically bound compartment
DVNS + F and DVB can be expressed in terms of the kinetic rate parameters as follows:

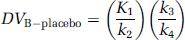
Note that after treatment with an unlabelled drug I, the term k3 in equation (11) should be replaced by the term
Assuming that DVNS + F is similar at placebo and at drug treatment conditions, the percentage of drug-induced receptor blockade can be defined as the percentage reduction of DVB obtained after drug treatment as compared with the DVB obtained at placebo conditions.
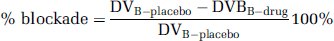
Note that, as in equation (8), calculation of % blockade using equation (12) assumes that the inhibitor-induced decrement in DVB is because of a decrease in the number of available binding sites, with no change in KD.
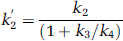
A simplification of the 2CM into a 1CM can be made by assuming that the concentrations CNS + F and CB equilibrate rapidly and are combined in one single compartment. The total distribution volume for the 1CM is noted as DV' and is given by:

with
Nonlinear least-square fitting: Nonlinear least-squares fitting (NLSF) analyses using the Marquardt algorithm (Marquardt, 1963) and based on the 1CM and the 2CM were applied to the time–activity curves for regional [11C]-harmine uptake. The contribution of fractional blood volume in the brain was fixed at 5% for all ROIs (Phelps et al, 1979). For each subject, the time delay between the plasma arterial input function and the brain time–activity data was estimated by fitting a whole-brain slice at the level of the striatum to an unconstrained 2CM using the 90 mins data set. However, it was difficult to characterize this delay with reasonable accuracy when using a 2CM, 5 parameters configuration. To estimate the delay, the delay value was thus increased gradually, using 1 sec increments, to minimize the residual sum of squares (RSS) of the whole-brain curve. The delay parameter value, which gave the least RSS on the fitted whole-brain curve, was used in the subsequent analyses where regional time–radioactivity curves were fitted.
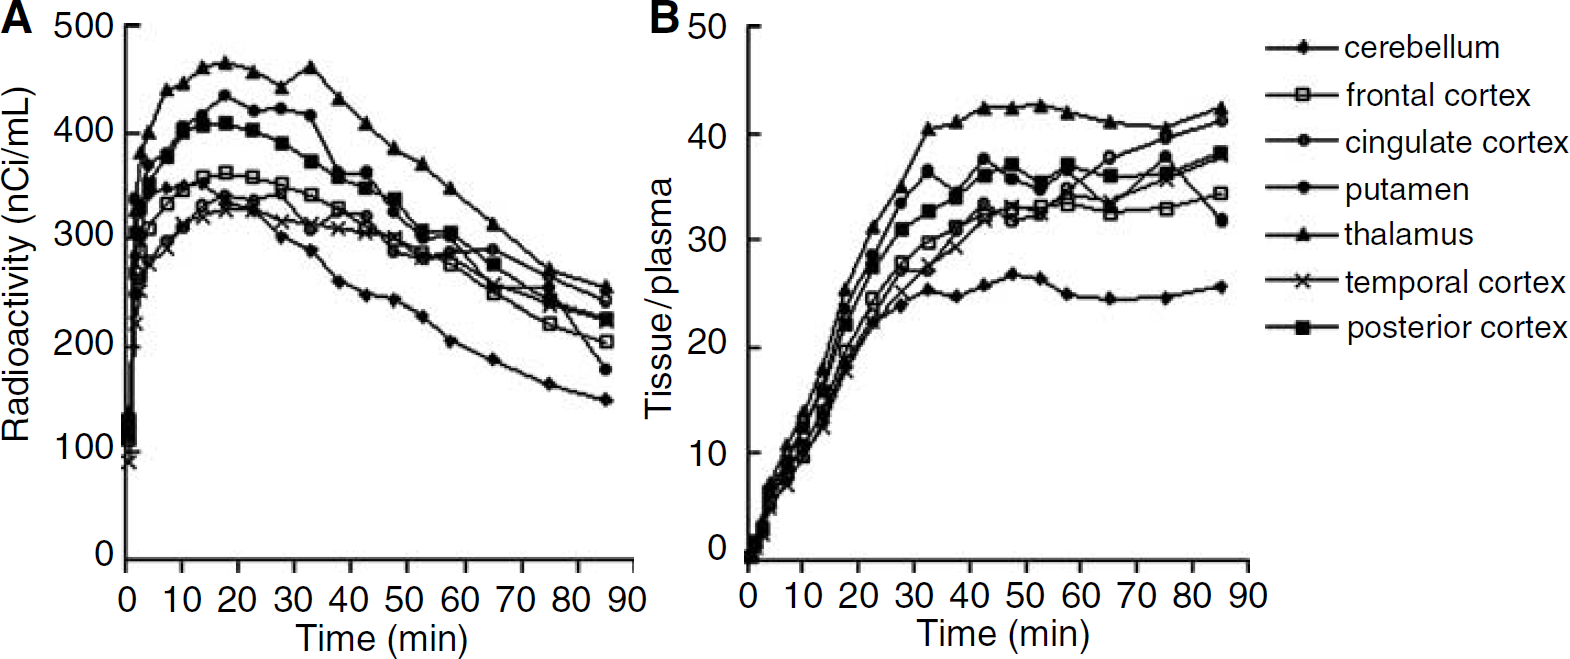
Different model configurations were used for analysis of [11C]-harmine (Table 1). Method A was based on the 1CM and NLSF analyses were performed to estimate K1, k'2, and DV'. Method B was based on the 2CM and NLSF analyses were performed to estimate the four rate constants K1, k'2, k3 (or
Fitting strategies used for kinetic modeling of [11C]-harmine
Simplified Method of Analysis
In addition to the kinetic modeling approach, [11C]-harmine binding was quantified using the linear graphical approach described by Logan et al (1990) for the analysis of reversible radioligand binding. A plasma input function corrected for the presence of labeled metabolites (CP(t)) was used. The ratio
Statistics: Goodness-of-fit was evaluated using both the Akaike Information Criterion (AIC; Akaike, 1974), the Model Selection Criterion (MSC). Higher AIC and lower MSC values were indicative of a better fit. In addition, models of higher complexity were also successively compared using an F-test to determine whether goodness-of-fits was sufficiently improved to justify the choice of a model with a higher number of parameters (Landaw and DiStefano, 1984). Statistical significance using the igtest was assumed for P values superior or equal to 0.05.
The standard error of the parameters was given by the diagonal of the covariance matrix (Carson, 1986), expressed as percentage of the parameter value (coefficient of variation, %COV), and used to assess the parameter identifiability by the NLSF procedure. Calculation of %COV was possible only for fitted parameters. For derived parameters such as k3/k4 and DVT, the s.d. of the mean (n = 5 subjects) was calculated, expressed as percentage of the mean derived parameter value, and used as an indication of the degree of intersubject variability of the parameter (%VAR = s.d. × 100%/mean).
Results
Plasma Analysis
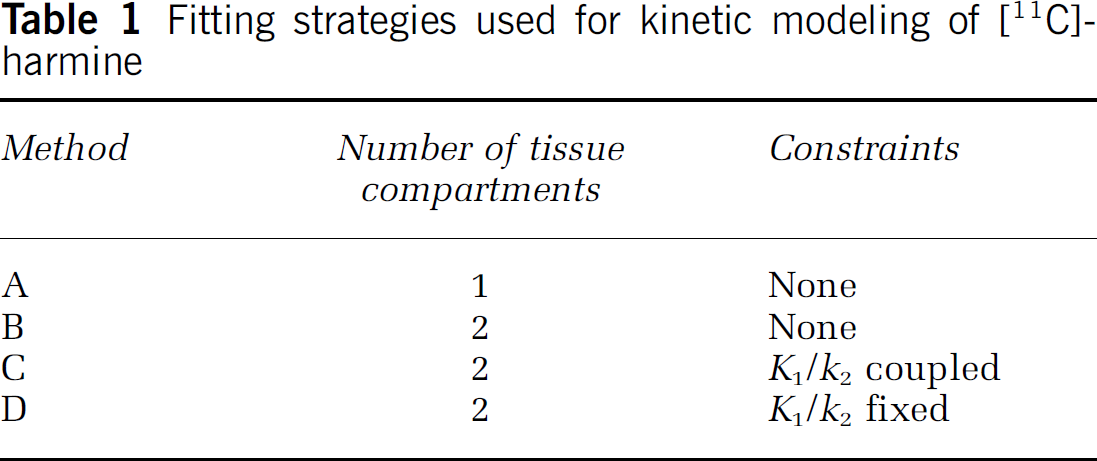
HPLC analysis of a plasma sample could be completed in less than 8 mins allowing multiple time points to be analyzed despite the short half-life of carbon-11. [11C]-harmine was rapidly metabolized with >50% of the radioactivity in the plasma attributable to polar metabolites after 20 mins. At placebo conditions, the fraction of unmetabolized [11C]-harmine in the plasma decreased throughout the time course of the study and was 90% ± 5%, 72% ± 13%, 46% ± 14%, 34 %± 12%, 22 %± 7%, 16% ± 3%, and 11% ± 5% at 5, 10, 20, 30, 45, 70, and 90 mins, respectively. After moclobemide treatment, [11C] -harmine metabolism was faster than that measured at placebo treatment, with 94% ± 4%, 71% ± 13%, 24% ± 8%, 18% ± 6%, 12% ± 4%, 9% ± 2%, and 11% ± 5% at 5, 10, 20, 30, 45, 70, and 90 mins, respectively. In both treatment conditions, all metabolites were significantly more polar than the parent compound and thus unlikely to pass the blood–brain barrier. Figure 1 shows representative curves obtained in the same subject for unmetabolized [11C]-harmine in the plasma under placebo and moclobemide treatment conditions. As shown in Figure 1, the concentration of unmetabolized [11C]-harmine in plasma peaked at higher levels after moclobemide treatment when compared with placebo conditions.
Arterial time–activity curves for the concentration of unmetabolized [11C]-harmine in plasma after a bolus injection of [11C]-harmine in a healthy human subject. Arterial measurements are shown in the same subject at placebo conditions (left panel) and during treatment with moclobemide (right panel). As shown in this figure, four of the five subjects who participated to the study showed a higher peak level of radioactivity in plasma at moclobemide treatment when compared with placebo conditions.
Kinetic Analyses
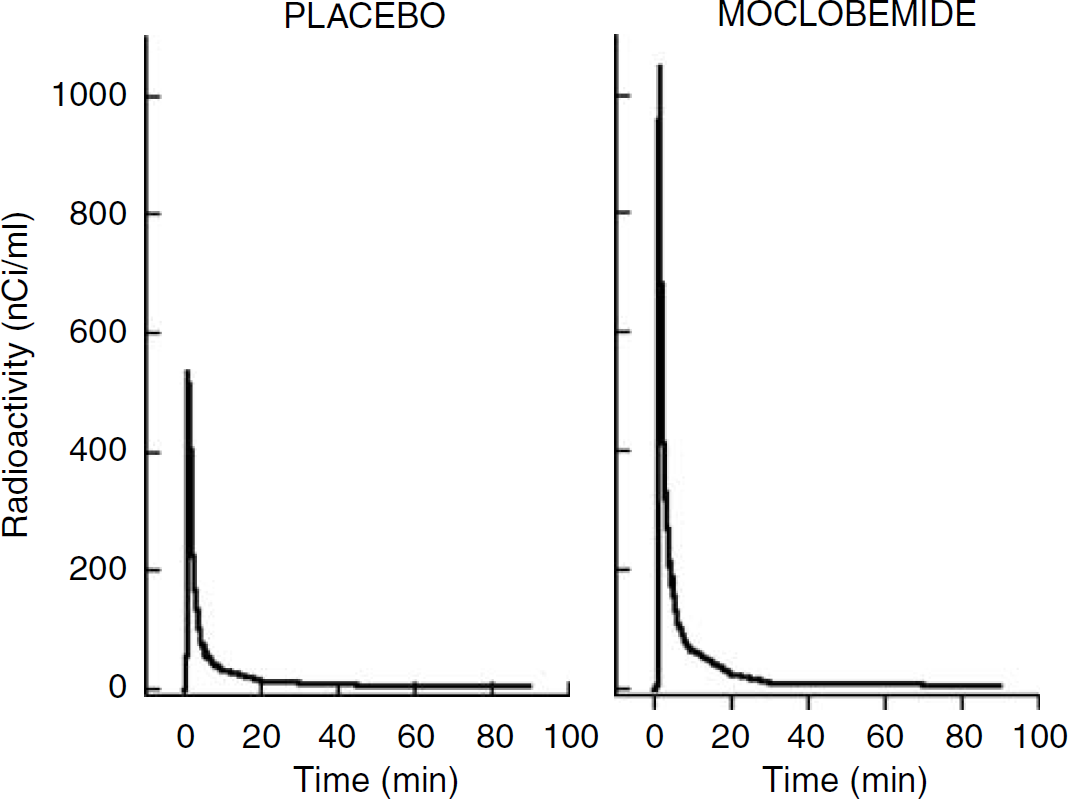
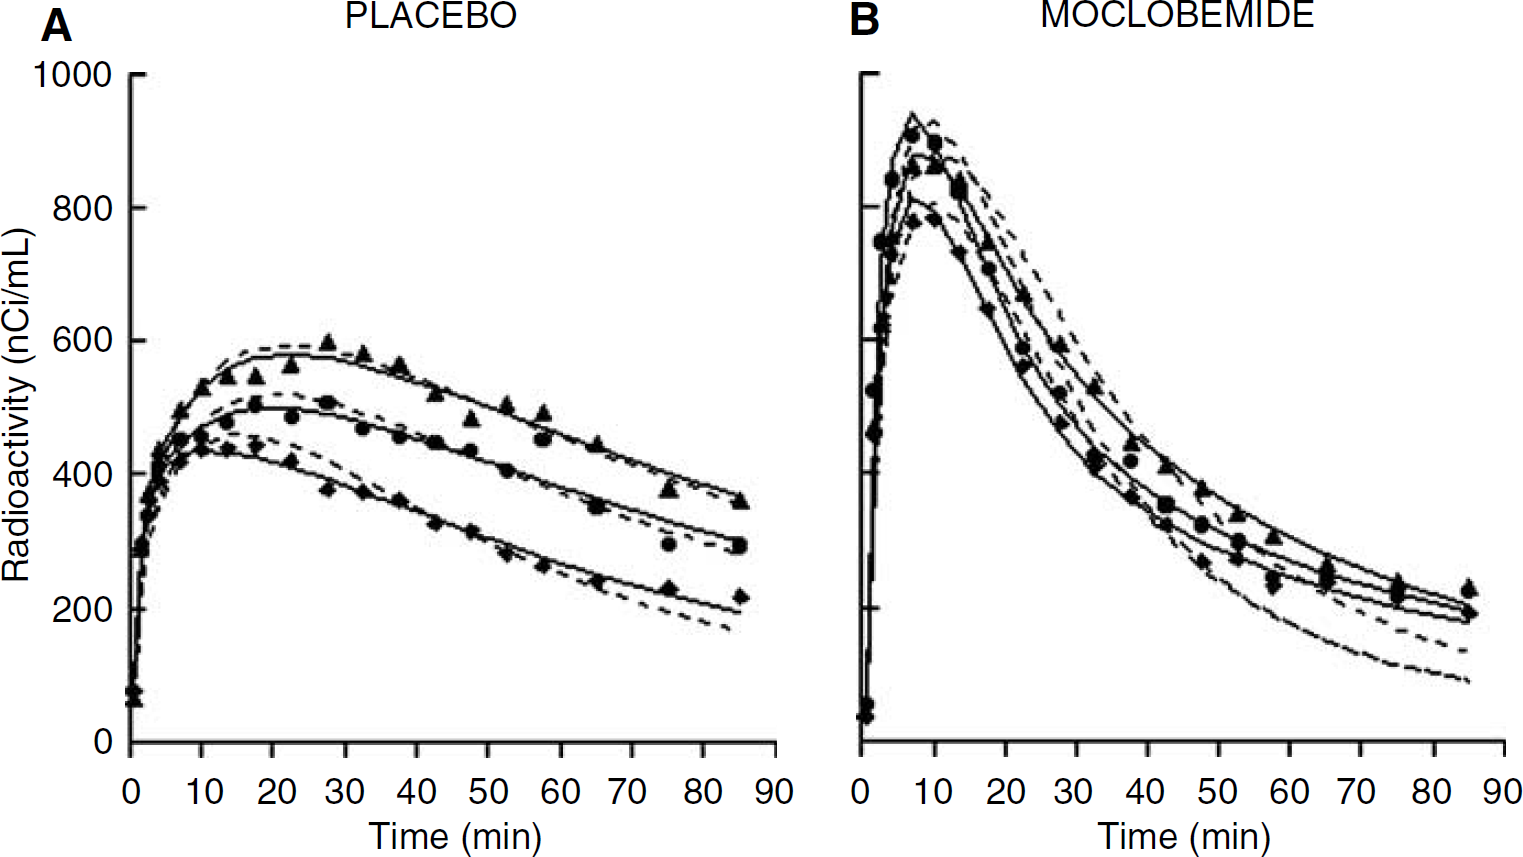
Placebo studies: Characteristic time–activity curves obtained after intravenous injection of [11C]-harmine in one subject are shown in Figure 2A. At placebo conditions, the highest radioactivity concentration was observed in the thalamus, intermediate levels were observed in striatum and cortical regions, and lowest levels of radioactivity were observed in the cerebellum. Figure 2B shows regional tissue to plasma radioactivity ratio in the corresponding subject. With few exceptions, transient equilibrium between tissue and plasma levels of radioactivity was obtained after 30 mins of data acquisition in all regions and all subjects.
Representative [11C]-harmine time–activity curves obtained at placebo conditions for (
As illustrated on Figure 3A, a 1CM configuration failed to describe the [11C]-harmine time–activity data. Adding a second tissue compartment (Method B) significantly improved the fits in all regions and all subjects when compared with the 1CM as assessed with AIC and MSC values (Table 2) as well as F-statistics. F-statistics for each ROI time–activity curve and each subject were in the range of F = 5.7 to 200.4 and F2,15 was significant at P ≤ 0.05 for F ≥ 3.68. Despite this, DVT values obtained with a 1CM or a 2CM configuration were close (Figure 4A): a 1CM provided DVT values that were, on average, approximately 5% lower than those obtained with a 2CM. This difference was observed in all brain regions examined.
Statistical evaluation of fits obtained using Methods A–D as explained in
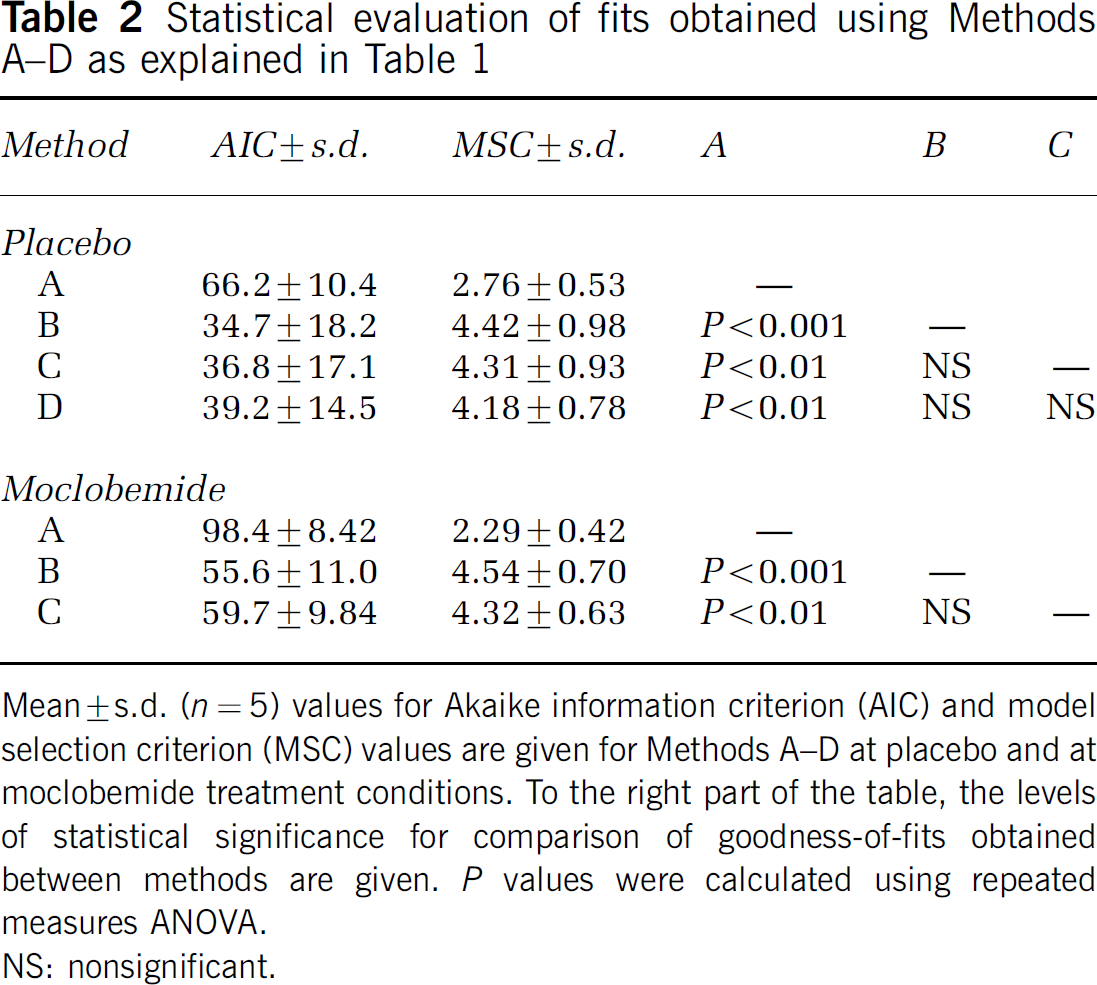
Mean ± s.d. (n = 5) values for Akaike information criterion (AIC) and model selection criterion (MSC) values are given for Methods A–D at placebo and at moclobemide treatment conditions. To the right part of the table, the levels of statistical significance for comparison of good ness-of-fits obtained between methods are given. P values were calculated using repeated measures AN OVA.
NS: nonsignificant.
3 Nonlinear least-squares fits of [11C]-harmine time–activity data obtained at placebo conditions (
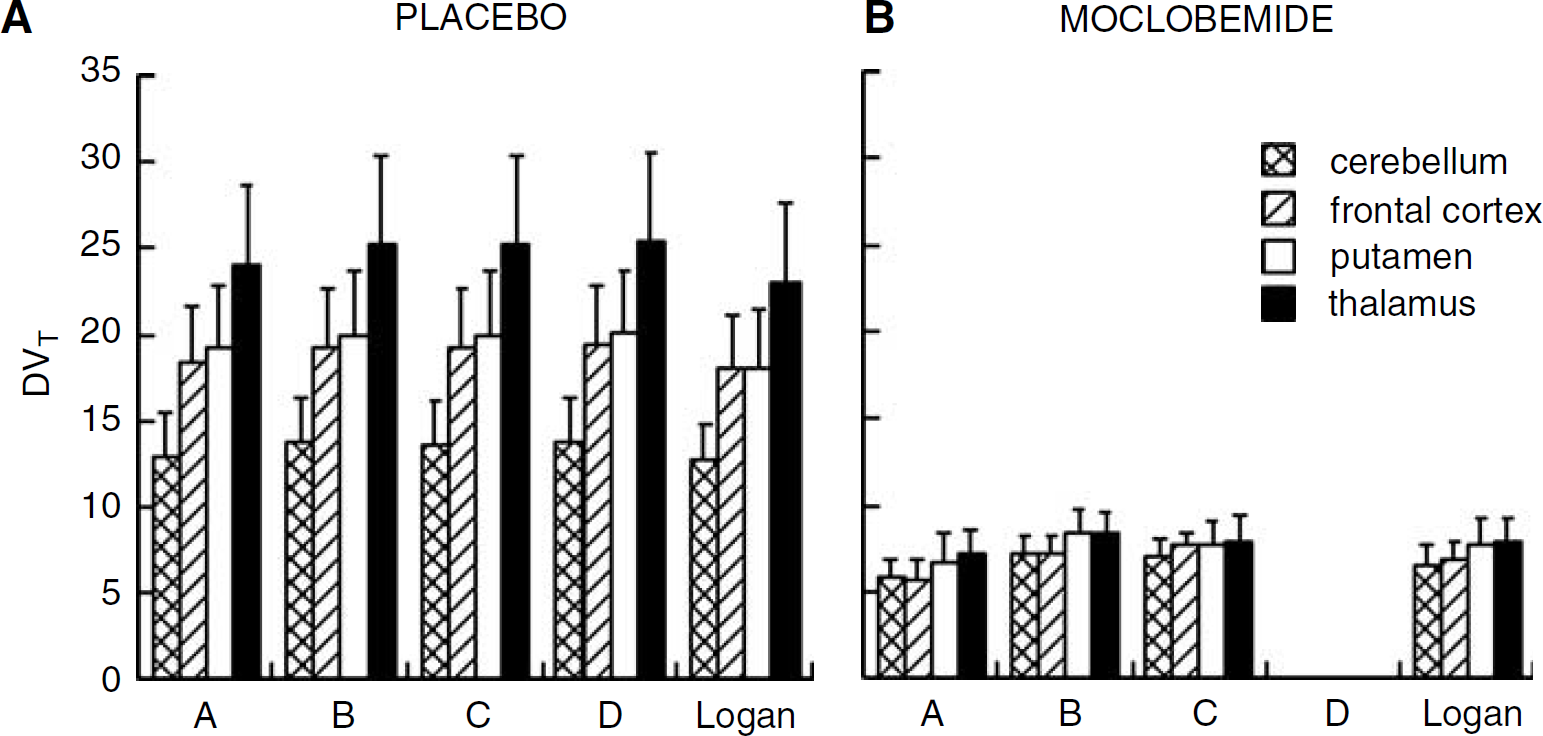
4 Comparison of DVT values obtained using a 1CM (Method A), a 2CM (Methods B–D) and the Logan graphical approach at placebo (
An unconstrained 2CM (Method B) provided reasonable identification of K1 and k4 with mean %COVs of 6.2% and 13.7%, respectively, but provided poor identification of k2 and k3, as exhibited by the large standard errors in parameter estimates (Table 3). As a consequence, the k3/k4 ratios were highly variable between subjects (Table 3) and the rank order of regional k3/k4 did not correlated with the known concentration of MAO-A in brain as measured by in vitro autoradiography (cerebellum < frontal cortex-≈ putamen < temporal cortex ≈ cingulate < thalamus; Saura et al, 1992, 1996a). In contrast, the rank order of DVB values was in accordance with the known distribution of MAO-A in the brain, with mean regional values ranging from 10.5 in the cerebellum to 22.2 in the thalamus, with putamen and cerebral cortices showing intermediate values (Table 3). DVB values were estimated with high precision, as attested by a mean %COV of 4.4% (range: 1% to 7%). DVT values were also estimated with high precision (mean %COV = 2%; range: 1% to 5%) and the rank order of DVT values also paralleled the rank order of MAO-A density in brain. This could be expected as a major proportion (86% ± 6% in average across regions; range: 82% to 92%) of DVT was accounted for by specific binding.
Average kinetic parameter estimates obtained using Method B at placebo conditions and after treatment with moclobemide
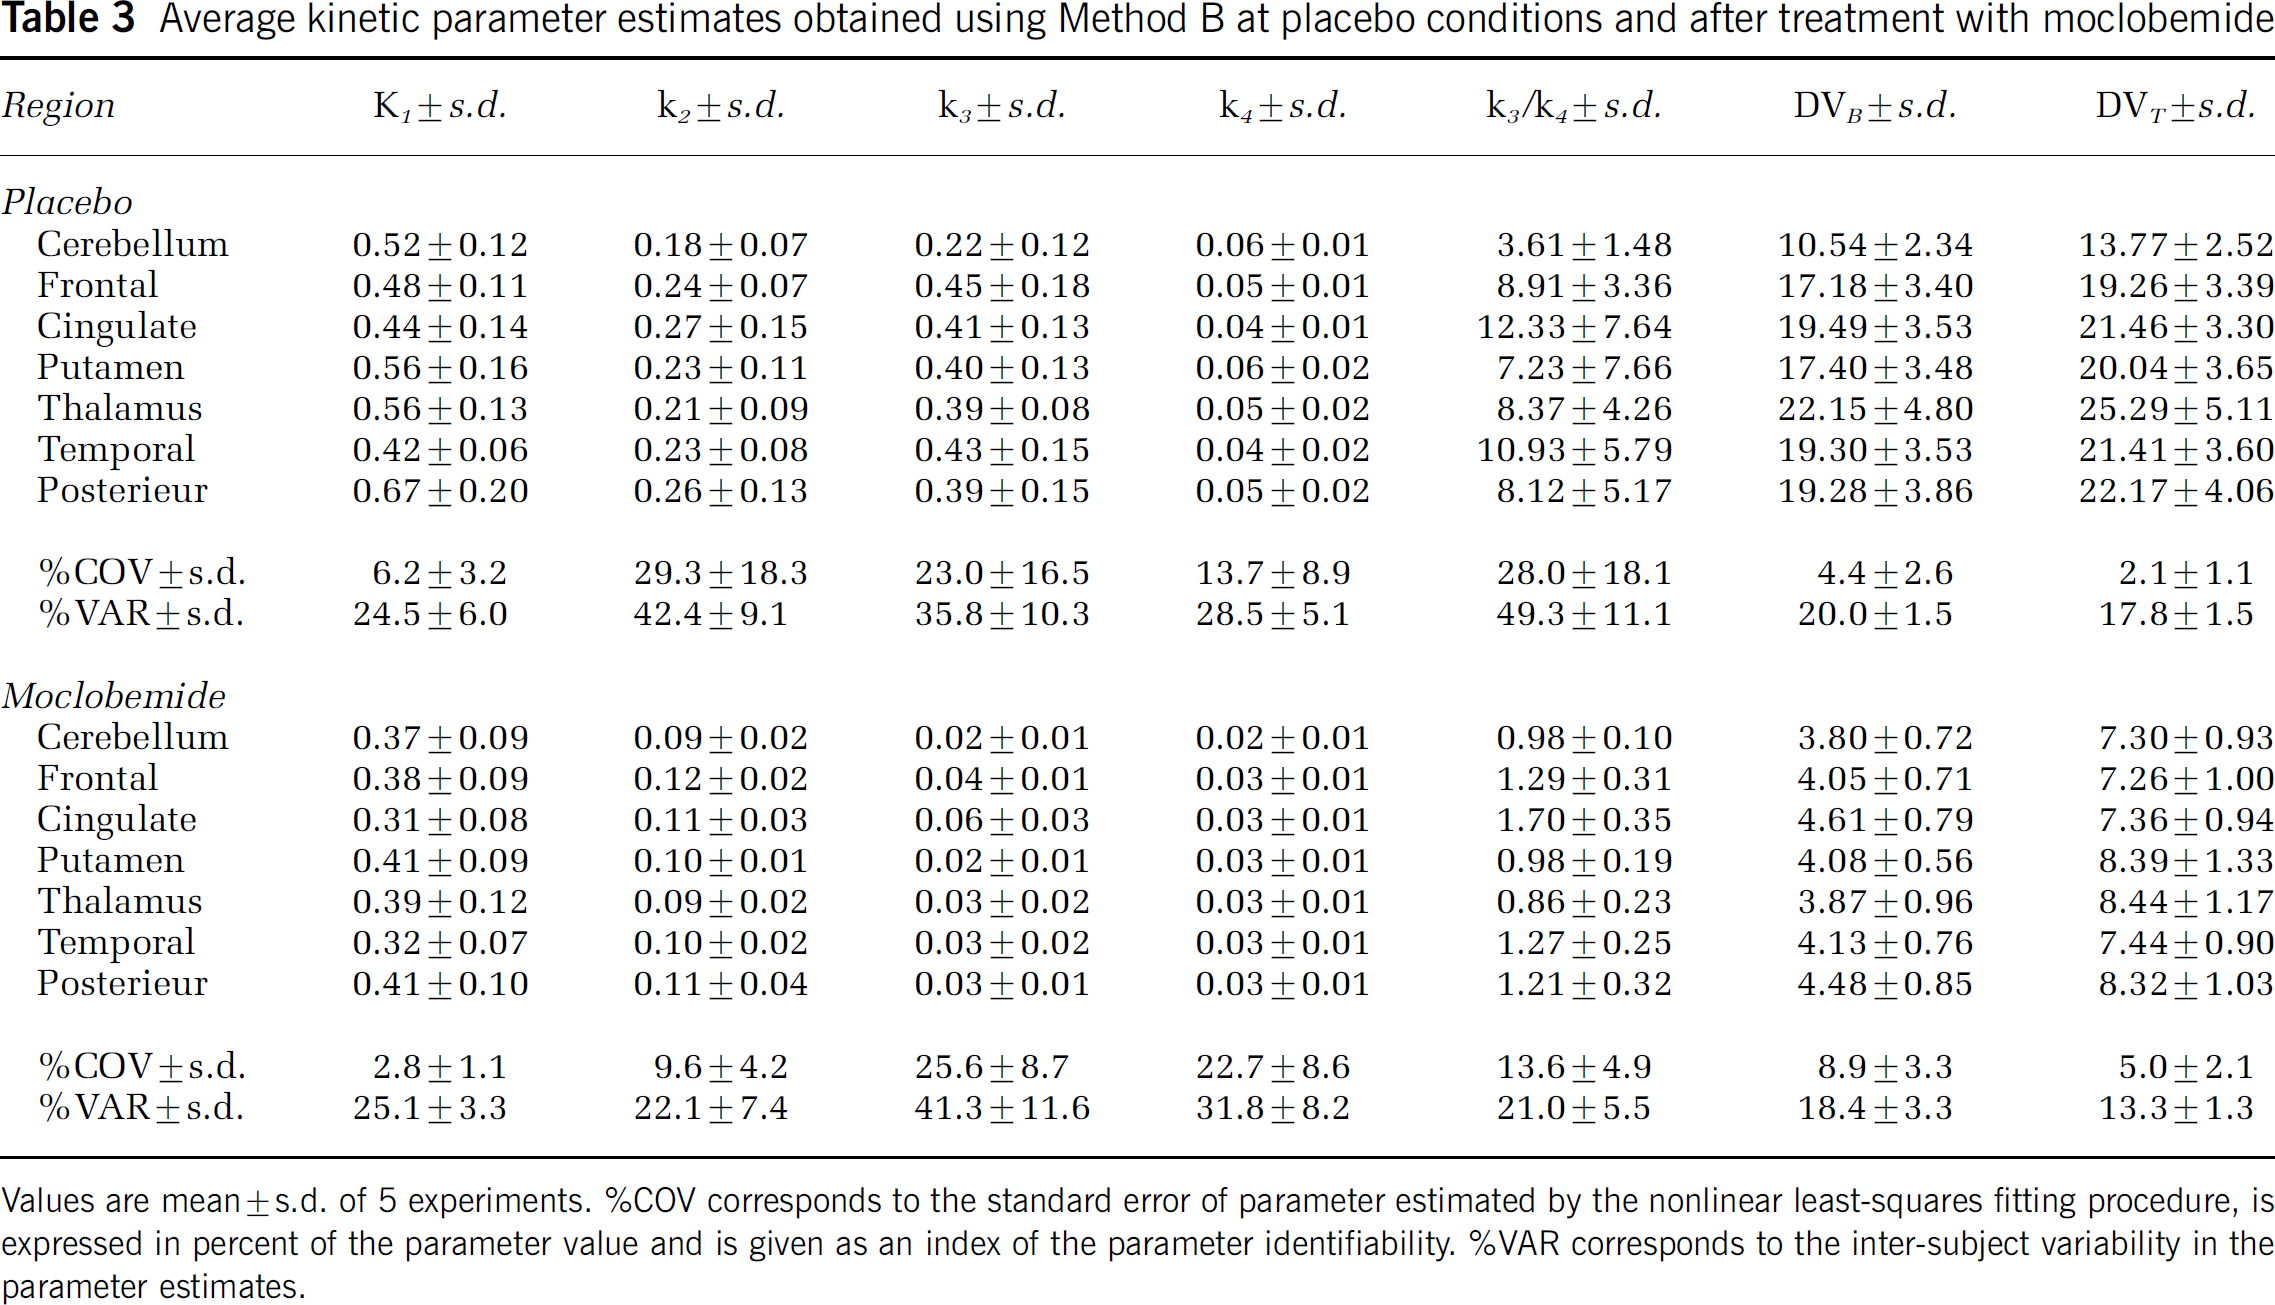
Values are mean ± s.d. of 5 experiments. %C0V corresponds to the standard error of parameter estimated by the nonlinear least-squares fitting procedure, is expressed in percent of the parameter value and is given as an index of the parameter identifiability. %VAR corresponds to the inter-subject variability in the parameter estimates.
Methods C and D significantly improved the identifiability of k3 and k4 estimates (Table 4) when compared with Method B (Table 3) as shown by the lower %COV obtained with the two former methods. Despite this, goodness-of-fits was not statistically improved by using Method C or D when compared with Method B as assessed with AIC and MSC (Table 2). F-statistics indicated that Methods C and D slightly worsened goodness-of-fits when compared with Method B but this was not statistically significant for most fits.
Average kinetic parameter estimates obtained using Methods C–D at placebo and moclobemide conditions
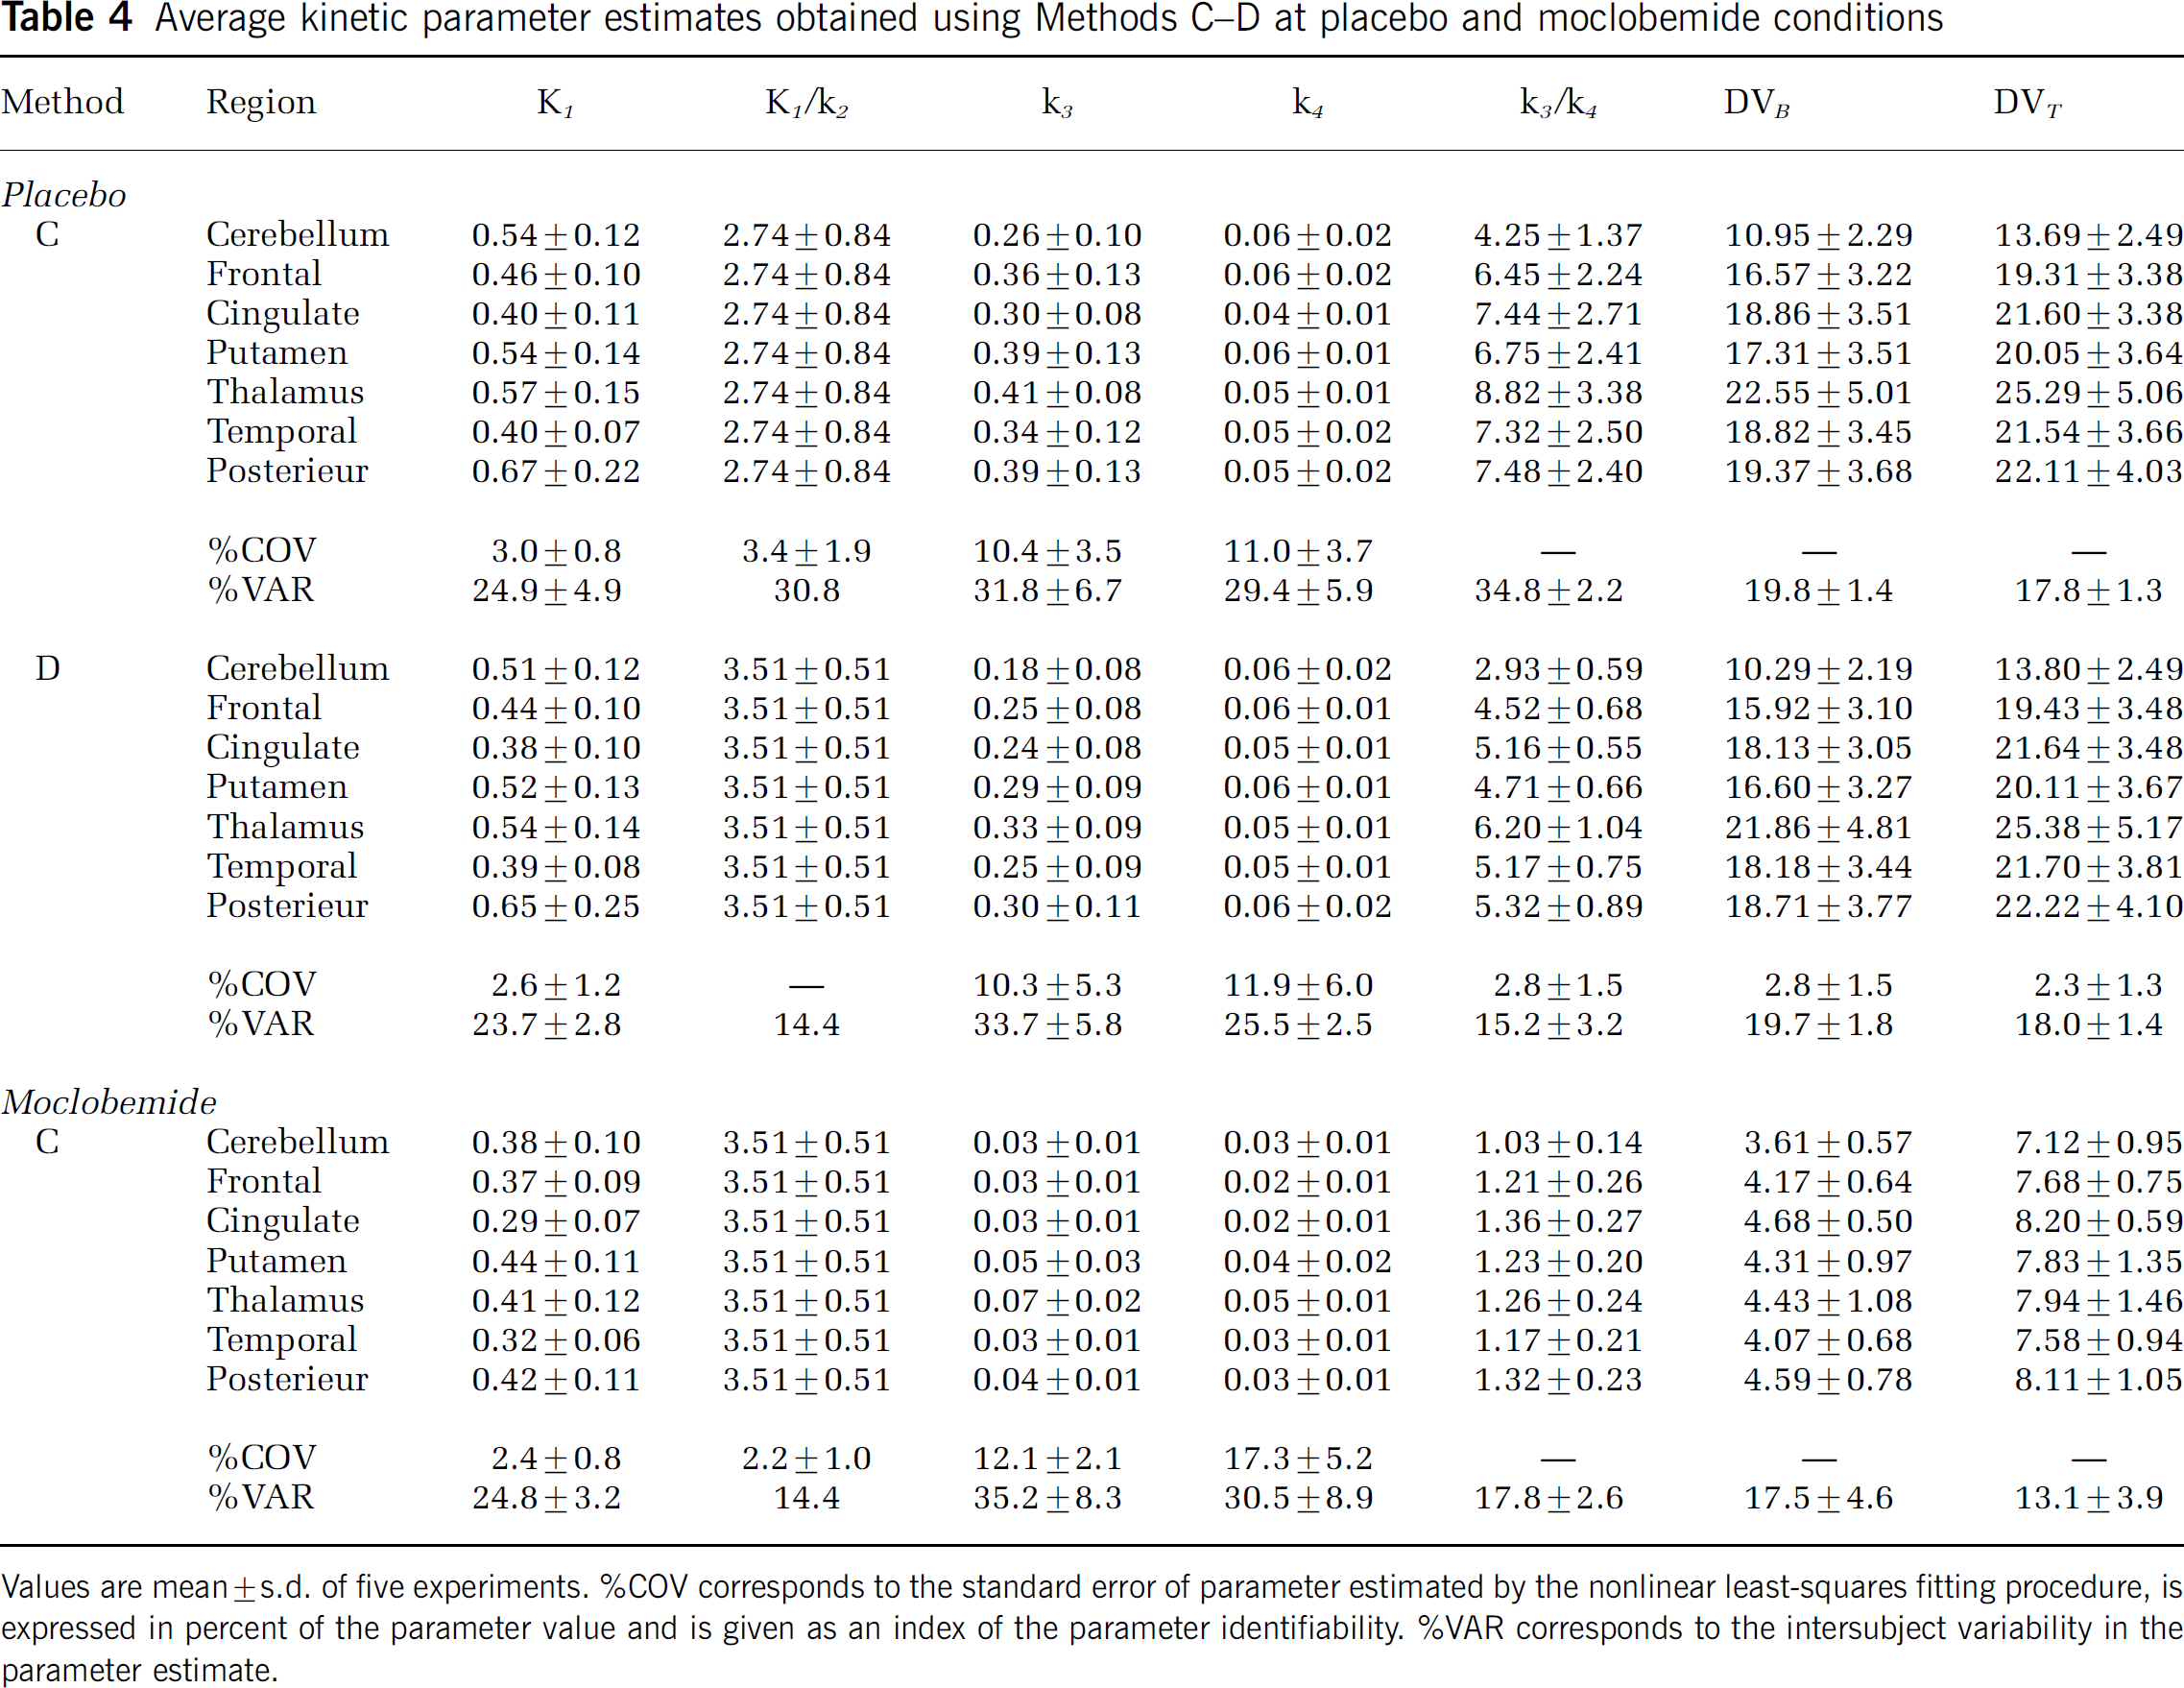
Values are mean ± s.d. of five experiments. %C0V corresponds to the standard error of parameter estimated by the nonlinear least-squares fitting procedure, is expressed in percent of the parameter value and is given as an index of the parameter identifiability. %VAR corresponds to the intersubject variability in the parameter estimate.
At placebo conditions, Method C provided k3/k4 values in accordance with the known regional densities of MAO-A in the brain but data were affected by a large intersubject variability (mean % VAR = 34.8 ± 2.2; Table 4). DVB and DVT values estimated with Method C were similar and not significantly different than those estimated with Method B.
Method D provided excellent estimations of k3/k4 values with a %COV of 2.8 ± 1.5 and a %VAR of 15.2 ± 3.2 (Table 4). Despite this superiority in determining BPs, the mean DVT and DVB values obtained with Method D were very close to those estimated with Methods B and C (see Tables 3 and 4). In addition, DVT values obtained using the three methods (B, C, and D) were not significantly different than those derived from the Logan approach (Figure 4A). DVT values obtained with each 2CM method (irrespective of whether it was constrained on unconstrained) significantly correlated with DV values obtained with the Logan approach and this is illustrated in Figure 5 with Method B as an example (slope = 1.05; R = 0.98; Student's t-test: P < 0.001).
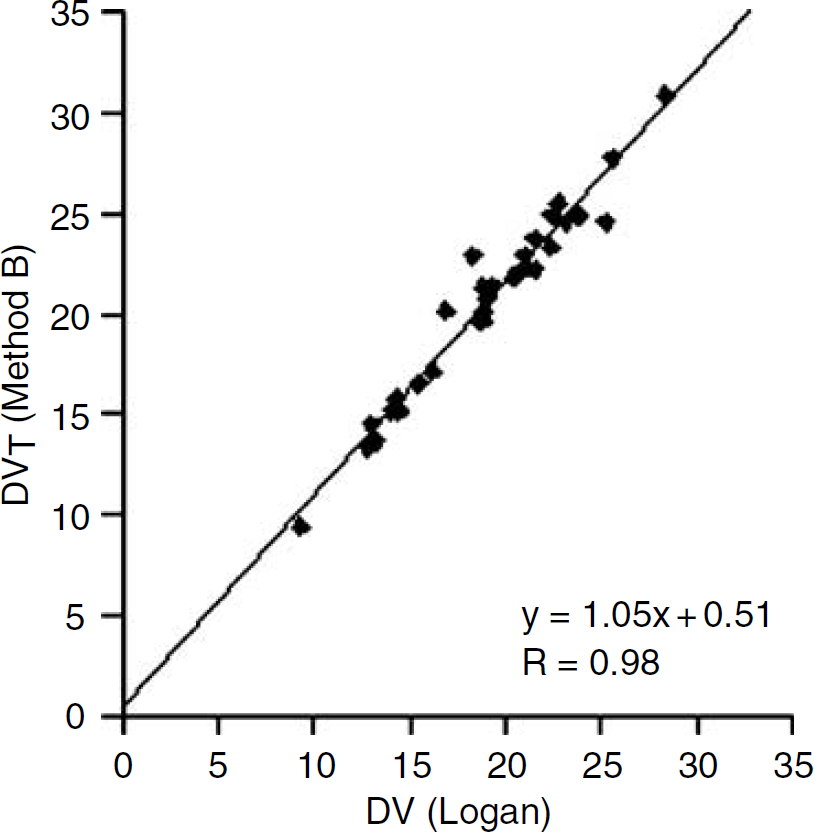
Correlation between DVT values obtained using Method B and the Logan graphical approach. The linear regression line was calculated using individual regional values obtained among the five subjects at placebo conditions. Note that similar correlations with Logan-derived DVT values were obtained with all 2CM configurations. R = Pearson's correlation coefficient.
A comparison between the mean regional DVB values as measured in our experimental conditions using [11C]-harmine and Method D and the mean [3H]Ro 41–1049 specific binding values reported in vitro in corresponding regions of the rat brain is shown in Figure 6. Positron emission tomography measures of [11C]-harmine DVB in the cerebellum, frontal cortex, cingulate, putamen, and thalamus were significantly correlated with in vitro measures of MAO-A binding sites densities reported in these regions by Saura et al (1992; Figure 6: R = 0.95; Student's t-test: P < 0.01). Similarly, a high correlation was observed between [11C]-harmine BP values and [3H]Ro 41-1049 Bmax across these brain regions (R = 0.95; Student's t-test: P < 0.05; data not shown).
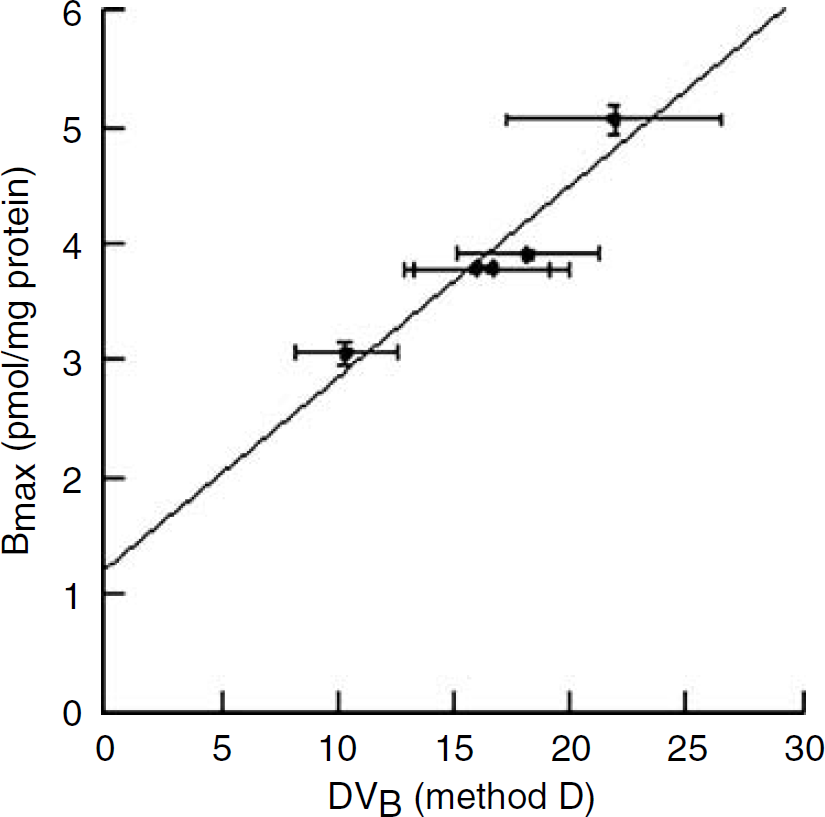
Correlations between [11C]-harmine DVB values in various brain regions as determined using Method D and the density of [3H]Ro 41-1049 binding sites reported reported in vitro in corresponding regions of the rat brain by Saura et al (1992).
Moclobemide studies: As observed at placebo conditions, a 2CM produced better fits to the data than a 1CM configuration (Figure 3B; Table 2). F-tests also indicated that a 2CM significantly better fit the data than a 1CM for 31 of the 35 regional binding curves. DVT values obtained with a 1CM were, in average, 19% lower than those obtained with a 2CM (Figure 4B).
A 2CM (Method B) allowed reasonable identification of K1 and k2 but both
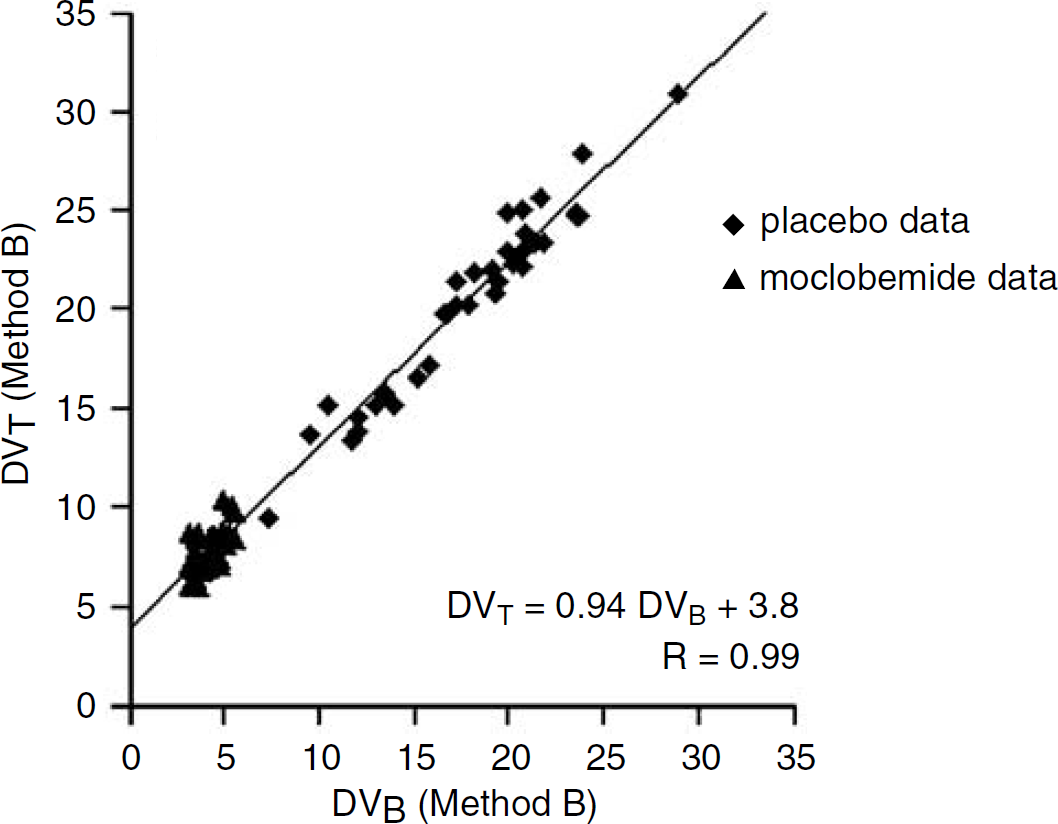
Correlations between [11C]-harmine DVB and DVT values obtained with Method B. The plot contains data obtained at placebo and after moclobemide treatment in each of the five subjects and for all ROIs. Linear regression of the data yielded a y intercept of 3.8 mL/g, a value that can be used as an overall estimate of DVNS + F.
Methods C fits did not statistically modify goodness-of-fits when compared with Method B as assessed using AIC and MSC (Table 2). F-tests also indicated that Method C was not statistically different from Method B in most fits. K1 values estimated using Method C at moclobemide conditions were significantly lower than those obtained at placebo (repeated measures ANOVA: F1,34 = 22.9; P < 0.001; Table 4). However, DVNS + F values were not significantly different between the two conditions (2.74 ± 0.84 and 3.51 ± 0.51 at placebo and moclobemide conditions, respectively; Student's t-test: P > 0.05; Table 4), suggesting that free and nonspecific binding were similar at placebo and moclobemide conditions. This was the main rationale for using K1/k2 values obtained in the moclobemide studies to fit the placebo data (i.e., Method D). When compared with k3 values obtained with Method D at placebo conditions, there were significant reductions in the values of
The percentage blockade of MAO-A calculated using DVB and BP values were identical (calculations were performed using Methods D and C in the placebo and moclobemide studies, respectively) and ranged from 64% ± 7% in the cerebellum to 79% ± 4% in the thalamus. This could have been predicted as Methods D and C assumes that K1/k2 values are similar between brain regions at placebo and moclobemide conditions. Similarly, the percentage blockade of MAO-A calculated using DVB values obtained with an unconstrained 2CM gave values that were, in average, only 2.2% lower (range: −4.1% to + 1.4%) than those estimated with BP values (Figure 8; repeated measures ANOVA: F1,34 = 47.2; P > 0.05).
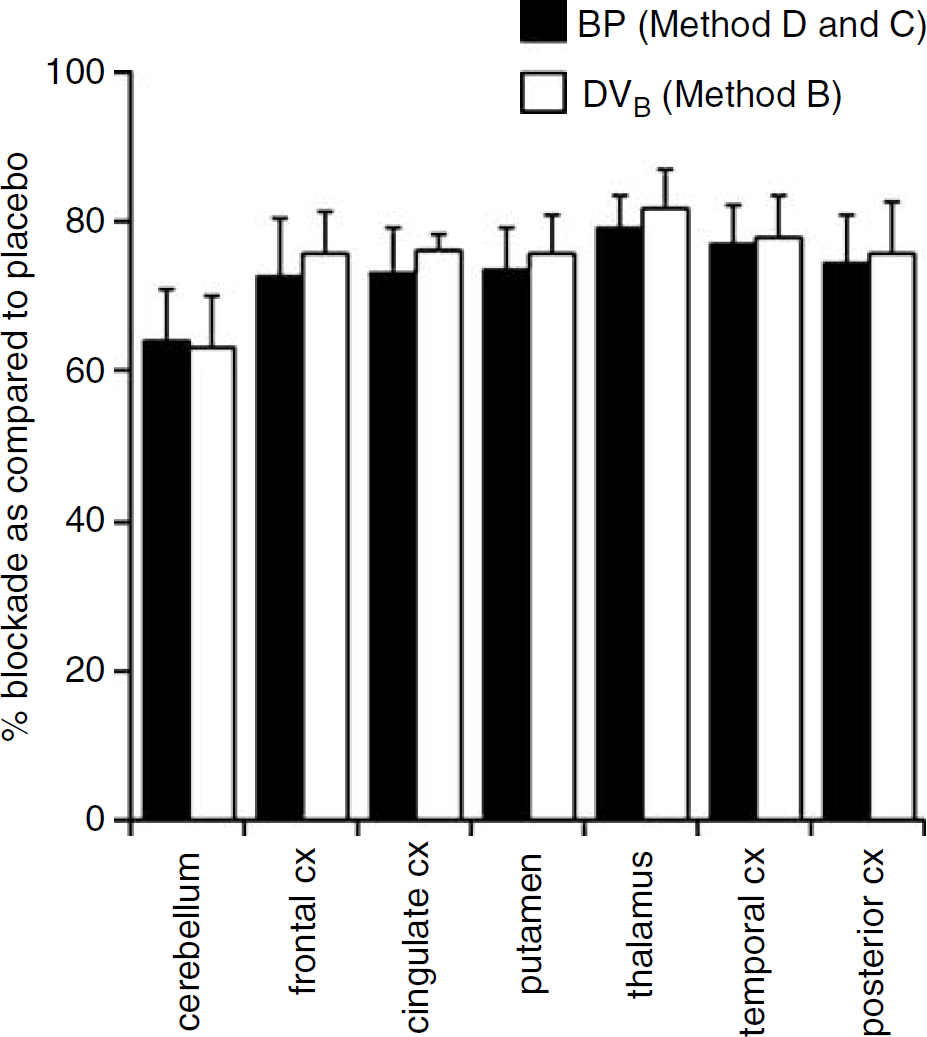
Percentage of monoamine oxidase (MAO)-A blockade induced by a 10 days pretreatment with clinical doses of moclobemide (see Materials and Methods) in healthy human subjects. Monoamine oxidase -A blockade was calculated in two different ways: either by using DVB values obtained with Method B or by using BP values obtained with Methods D and C at placebo and at moclobemide conditions, respectively. The percentages of MAO-A blockade calculated using either way were not statistically different (repeated measures AN OVA; P > 0.05). Values are mean ± s.d (n = 5).
Discussion
The primary goal of this study was to evaluate methods to obtain reliable estimates of MAO-A density from the analysis of [11C]-harmine brain uptake curves in humans using PET. At placebo conditions, the regional distribution of [11C]-harmine uptake was concordant with the known densities of MAO-A sites in the brain. The highest levels of radioactivity were observed in the thalamus, intermediate levels were observed in the striatum and cortical regions, whereas lowest levels of radioactivity were observed in cerebellum. At moclobemide conditions, the relative regional differences in [11C]-harmine uptake levels were markedly reduced, indicating a substantial blockade of the MAO-A sites. However, the peak levels of radioactivity in the brain as well as in the plasma were higher at moclobemide than at placebo conditions. Monoamine oxidase-A is abundant in peripheral organs such as the liver, kidneys, heart, lungs, and duodenum in humans (Fowler et al, 2003; Saura et al, 1996b). Moclobemide-induced inhibition at these peripheral sites likely explains the increased bioavailability of [11C]-harmine in the plasma and, therefore, the increased net amount of radioactivity that enters the brain when compared with placebo conditions.
Kinetic analyses of [11C]-harmine brain uptake data showed that a 2CM configuration provided significantly better fits than a 1CM configuration. This was true both at placebo and moclobemide treatment conditions and for all criteria (AIC, MSC, and F-statistics). Despite this statistical superiority of a 2CM in describing [11C]-harmine time–activity data, the difference in DVT values obtained between a 1CM and a 2CM was small, especially at placebo conditions. This likely indicated a poor separation of the free and nonspecifically bound and specifically bound compartments. This view was supported by the poor identification of k3 and k4 using an unconstrained 2CM. However, the statistically better fits obtained with all 2CM configurations as compared with the 1CM indicate that, although the differences were small, DVT values should be more accurately determined with inclusion of a second tissue compartment.
A 2CM configuration provided good identification of K1 at both treatment conditions. However, K1 values were significantly reduced at moclobemide conditions when compared with placebo, a result suggesting a decreased cerebral blood flow (CBF) during moclobemide treatment. There is a large body of evidence showing that serotonin and norepinephrine, the two major MAO-A substrates that are known to be elevated during moclobemide treatment (Nair et al, 1993), are potent cerebral vasoconstrictors and reduce CBF (Grome and Harper, 1983; Szabo et al, 1983). Stimulations of the dorsal raphe nucleus, from which 90% of the serotonin innervation of the brain originates, have also been shown to decrease CBF in a large number of brain structures (Bonvento et al, 1989). Finally, studies in MAO-A-deficient mice, which show chronic elevation of serotonin and norepinephrine in the brain, also showed decreased blood flow in several brain regions when compared with their wild-type counterparts (Holschneider et al, 2000). In light of these data, it can be postulated that the decreased K1 values observed during moclobemide treatment reflect vasoconstrictor-induced decreases in CBF resulting from increased brain levels of serotonin and norepinephrine.
An unconstrained 2CM yielded individual parameter values for k2, k3, and
The difficulty in deriving reliable individual estimates for k3,
All three 2CM-based methods (Methods B, C, and D) gave similar estimates for DVT and DVB and both parameters were estimated with high reliability. In addition, DVT values estimated with the three methods were highly correlated and not significantly different from those estimated with the Logan approach. Thus, DVT and DVB appear to be valuable outcome measures for clinical studies as they are determined with high level of precision and are not biased by potential subject differences in blood flow or peripheral clearance. Moreover, the high correlation between DVT and DVB values obtained at both placebo and moclobemide conditions suggests that nonspecific binding of [11C]-harmine was similar not only across brain regions but also between conditions. As MAO-A blockade increased, DVT and DVB decreased, increasingly approaching DVNS + F values. As predicted by equation (9), which describes DVT as a linear function of DVB, the plot of DVT as a function of DVB should have a slope equal to unity and a y intercept of DVNS + F. Linear regression across all subjects, all regions, and across both treatment conditions yielded values of 3.8 mL/g for DVNS + F. This value is in close agreement with the value obtained at moclobemide conditions using Method C, which yielded a mean DVNS + F value of 3.5 ± 0.5 mL/g (Table 4). When linear regression was performed using all subjects and all regions but only data acquired at placebo conditions, it yielded a DVNS + F value of 3.1 mL/g (data not shown). Here again, this indirect way of deriving DVNS + F estimate using an unconstrained 2CM (i.e., Method B) yielded a DVNS + F value that was close to that determined by Method C at placebo conditions (2.74 ± 0.84; Table 4). The consistencies between the DVNS + F values extrapolated from the regression data obtained with Method B and describing DVT as a function of DVB and those directly estimated by the model by Method C thus support the model simplifications made in this latter method and further strengthen the case for its use in clinical studies.
Treatment with moclobemide induced substantial reductions in k3, DVB, and DVT values when compared with placebo. Nonspecific binding was relatively unaffected by the pharmacological treatment as shown by the similar DVNS + F values obtained using Method C at placebo and moclobemide conditions. In contrast, the dissociation rate constant kA for [11C]-harmine was substantially decreased after moclobemide treatment when compared with placebo. Such a decrease was unexpected as k4, which equals koff, is usually considered not to vary between experimental conditions. Investigations where a compartmental modeling approach has been applied to obtain the in vivo kinetic parameter estimates of a radioligand both at drug-free and at drug-treatment conditions are scarce. While the assumption of a constant k4 is reasonable when comparing different brain regions in a same subject and at similar experimental conditions, k4 may vary with pharmacological treatment. Two explanations can be proposed for a decreased k4 under moclobemide treament. One explanation is the existence of a nonspecific binding compartment that turns over relatively slowly because of nonspecific interactions with proteins, lipids or other receptor compartment. Because a major proportion of the specific binding compartment is blocked under moclobemide conditions, this slow kinetic nonspecific binding compartment would become more prominent in the moclobemide than in the placebo studies, and this would be reflected in an apparent decrease in k4. Another possibility is that the effect of moclobemide on k4 is indicative of an allosteric modulation of MAO-A by the drug. Negative allosteric modulators are known not only to decrease radioligand association on the orthosteric site but also to decrease their dissociation rate (Holzgrabe and Mohr, 1998). Although the mechanism of MAO-A inhibition by moclobemide is not fully clear yet, several studies suggest that moclobemide may act through mixed competitive and noncompetitive inhibition of the enzyme (Da Prada et al, 1989; Waldmeier, 1985). The decrease in k4 obtained after moclobemide treatment could reflect this noncompetitive interaction. Assuming that this decrease in k4 (i.e., koff) was accompanied by a similar decrease in kon (and that Kn was thus unaffected; see assumptions for equations (8) and (12)), the percentage of MAO-A blockade induced by clinical doses of moclobemide was substantial, ranging from 64% in the cerebellum to 79% in the thalamus. Because our data cannot rule out the possibility of a decrease in k4 with no parallel change in kon, it is thus possible that the percentage of MAO-A blockade achieved by moclobemide is somewhat even higher than 64% to 79%. This substantial level of MAO-A blockade induced by moclobemide further supports the specificity and suitability of [11C]-harmine for quantifying MAO-A binding sites in vivo using PET.
In summary, kinetic analyses showed that a 2CM best describes [11C]-harmine kinetics, although it showed poor identifiability of BP values. However, it provided stable and reliable estimates for [11C]-harmine regional DVB and DVT that were consistent with the known distribution of MAO-A densities in the human brain. Reduction in the complexity of the 2CM, either by fixing or by coupling DVNS + F value during the fits, allowed the derivation of more stable estimates for BPs but neither improved goodness-of-fits nor improved reliability in DVT and DVB estimates when compared with an unconstrained 2CM. Under ideal conditions, measures of BP should be preferred as index of binding density because they vary directly with Bmax. However, as these measures are estimated with uncertainty for [11C]-harmine, we would recommend using DVB as index of binding site density. Because the variability and identifiability of DVB values estimated with all 2CM methods were similar, an unconstrained 2CM configuration should be selected for determination of this parameter as outcome measure as this method has the advantage of computational simplicity. As an alternative, DVT could also be selected as outcome measure. Indeed, DVT values estimated with all 2CM configurations were remarkably stable, highly correlated, and not significantly different from those estimated with the Logan method. This latter method of analysis is even simpler as it only involves a simple linear regression of the data.
The results of the present study thus support the suitability of using [11C]-harmine for the quantitative evaluation of MAO-A densities in human using PET. The stability and reliability of DVB values obtained for an unconstrained 2CM, together with the computational simplicity associated with this method, support the use of DVB as an appropriate outcome measure for [11C]-harmine.
Footnotes
Acknowledgements
The assistance of Alvina Ng during the PET experiments, Kernjit Singh for the metabolite analysis, and Armando Garcia and Alexandra Chestakova for radiochemistry support is gratefully acknowledged.