
Abstract
The kinetic modeling of [11C]-(+)-PHNO binding to the dopamine D2/3 receptors in six human volunteers using positron emission tomography (PET) is described. [11C]-(+)-PHNO is the first agonist radioligand for the D2/3 in humans and as expected showed high uptake in caudate, putamen, globus pallidus (GP) and ventral striatum, and low uptake in cerebellum. A two-tissue compartment model (2CM) with four parameters was necessary to adequately fit time—activity data in all regions. Although a 2CM provided an excellent estimation of total distribution volumes, which were highly correlated with those obtained with the invasive Logan approach, it provided a poor identification of the k3/k4 ratios. Coupling K1/k2 between brain regions (Method C) or fixing K1/k2 to the value obtained in cerebellum (Method D) enabled more stable estimates of k3/k4 as compared with an unconstrained 2CM. The k3/k4 obtained with Method D ranged from 0.12 ± 0.03 in cerebellum to 3.93 ± 0.77 in GP and were similar to those obtained when coupling K1/k2. Binding potentials (BPs) obtained using the simplified reference tissue model (BPSRTM) ranged from 2.08 ± 0.34 in caudate to 3.55 ± 0.78 in GP and were highly correlated with k3/k4 estimates obtained with Method D (r = 0.98). However, BPSRTM were 11% ± 5% lower than values obtained with Method D. BPs derived using the noninvasive Logan approach were slightly lower but not significantly different than BPSRTM. This study demonstrates that [11C]-(+)-PHNO can be used for the quantitative measurement of D2/3 densities and should enable further studies of potential D2/3 dysregulation in several important psychiatric and neurologic illnesses.
Introduction
The neurotransmitter dopamine (DA) plays a central role in the regulation of learning, emotion, reward, and movement. Dysregulations of DA neurotransmission is implicated in multiple disease states, including Schizophrenia, Parkinson's disease, and drug abuse. DA exerts its action through five subtypes of receptors, which are classified into two superfamilies: the D1- and D2-like. The D2-like superfamily contains the D2, D3, and D4 subtypes, which differ about their brain distribution and binding profile (Strange, 1993). Further, the D2 receptor indeed exists in two interconvertible affinity states: a state of high affinity (noted D2high) and a state of low affinity (noted D2low) for DA, the D2high being the functionally active form of the receptor (Sibley et al, 1982). Within the D2-like superfamily, the D2-receptor subtype has received considerable attention in clinical neuroscience and a number of in vivo studies have examined the role of these receptors in schizophrenia, depression, Huntington's and Parkinson's Diseases, and addiction (review in Verhoeff, 1999). However, all of these studies have used antagonist radioligands that label both the D2high and D2low without distinction.
The investigation of the D2high in vivo in human has been hampered by the lack of a suitable agonist radioligand for this particular subset of D2 receptors. We recently developed [11C]-(+)-PHNO as an agonist D2/3 radioligand for the in vivo determination of the D2high using positron emission tomography (PET). (+)-PHNO [(+)-4-propyl-3,4,4a,5,6,10b-hexahydro-2H-naphtho[1,2-b][1,4]oxazin-9-ol] is indeed a remarkably potent and selective D2-agonist in vitro, which displayed high affinity and selectivity for the D2 receptor. The specificity of [11C]-(+)-PHNO binding was demonstrated in preclinical studies that included ex vivo and in vivo studies in rodents and cats (Galineau et al, 2006; Ginovart et al, 2006a; Wilson et al, 2005). The high signal-to-noise ratio and high sensitivity of [11C]-(+)-PHNO to amphetamine challenge made this radioligand a very promising tool for probing the D2high in vivo. The first evaluation of [11C]-(+)-PHNO binding distribution in the human brain was recently reported by Willeit et al (2006) and showed high uptake in brain structures known to contain D2/3 receptors.
The aim of the present study was to evaluate the prospect of using PET and [11C]-(+)-PHNO for quantification of the DA D2/3 receptors in the human brain. Regional brain uptake curves of [11C]-(+)-PHNO were quantified using kinetic modeling analyses based on either one or two tissue compartments. For routine use of [11C]-(+)-PHNO, simplified methods using the cerebellum as a reference region to estimate nonspecific binding were also evaluated.
Materials and methods
Subjects
This study was approved by the Human Subjects Review Committee of the University of Toronto. Six control volunteers (5 males; 1 female) free of neurologic or psychiatric diseases were recruited for the study. In all cases, written informed consent was obtained before participation. The age and weight of the subjects were 40 ± 4 years (range: 33 to 45 years) and 73 ± 14 kg (range: 58 to 91kg), respectively (mean ± s.d., n = 6).
Radiochemistry
The radiosynthesis of [11C]-(+)-PHNO has been described in detail elsewhere (Wilson et al, 2005). Purification by high-performance liquid chromatography and formulation gives radiochemically pure (+)-[11C]-(+)-PHNO as a sterile, pyrogen-free solution suitable for human studies.
Positron Emission Tomography Image Acquisition and Reconstruction
Studies were performed using a high-resolution neuro-PET camera system, CPS-HRRT (Siemens Medical Imaging, Knoxville, TN, USA), which measures radioactivity in 207 brain sections with a thickness of 1.2 mm each. This camera system consists of eight panel detectors, each panel being composed of 117 phoswich detectors. The phoswich detector is composed of a lutetium oxyorthosilicate crystal and a lutetium yttrium oxyorthosilicate crystal, each crystal having a dimension of 2 × 2 × 10 mm3. The in-plane resolution of the scanner is approximately 2.8 mm full-width at half-maximum.
Transmission scans, both blank and with the subject in the tomograph field of view, were acquired in 64-bit list mode, using a single photon point source, 137Cs (T1/2 = 30.2 years, Eg = 662 keV). The acquired data were sorted into sinograms, and an attenuation image calculated from the ratio of these two scans (Knoess et al, 2003). A further correction was applied to account for the difference in the photon energy between transmission (Eγ = 662 keV) and emission (Eγ = 511 keV) acquisitions. A 511 keV attenuation image was generated by linearly rescaling the 662 keV attenuation image before forward projection of the scaled 511 keV attenuation image to produce the attenuation correction. This re-scaling process also accounted globally for the scatter contamination in transmission data (Knoess et al, 2003).
After the transmission, a 32-bit list mode emission acquisition, of approximately 95 mins duration, was initiated. Radioligand injection was started a few seconds after the start of the emission acquisition. On completion the emission acquisition, both the transmission and emission data were transferred to an off-line data processing system for image reconstruction. The emission data were re-binned into a series of 3D sinograms. The first frame was of variable length to account for the time between the start of the acquisition and the arrival of radioactivity in the tomograph field of view. The following 30 frames were defined as 15 × 60 secs and 15 × 5 mins frames. For each 3D sinogram, gaps were filled (Karp et al, 1988) and corrections for photon attenuation and detector normalization were applied. The gap-filled sinograms were scatter-corrected (Watson et al, 1997) before applying Fourier rebinning to convert the 3D sinograms into 2D sinograms (Defrise et al, 1997). The 2D sinograms were then reconstructed into image space using a 2D filtered back projection algorithm, with a Hann filter at Nyquist cutoff frequency and the images calibrated to nCi/mL.
Positron Emission Tomography Studies
Participants were scanned in supine position using a custom-made thermoplastic facemask together with a head-fixation system (Tru-Scan Imaging, Annapolis, USA). Cannulae were inserted in the radial artery for blood sampling, and in the controlateral arm antecubital vein for radioligand injection. A saline solution of 9.89 ± 0.68 mCi of [11C]-(+)-PHNO at a specific radioactivity of 1386 ± 283 Ci/mmol was injected intravenously as a bolus. The mass of (+)-PHNO injected was 1.67 ± 0.34 μg.
An automatic blood sampling system (Scanditronix, Uppsala, Sweden) was used to measure radioactivity in arterial blood during the first 10 mins postinjection. Manual blood samples were drawn at 1, 3, 6, 15, 20, 30, 50, and 75 mins postradioligand injection. An aliquot of each blood sample was taken to measure radioactivity concentration in total blood. The remaining blood was centrifuged (1500g, 5 mins) and a plasma aliquot counted together with the blood sample using a Packard Cobra II gamma counter crosscalibrated with the PET system. The blood-to-plasma ratios determined from the manual samples were used to correct the blood radioactivity data measured by automatic sampling and to generate the plasma radioactivity curve. The remaining volume of each plasma sample was used to determine unchanged radioligand and its metabolites (as described below). A metabolite corrected plasma curve was generated by the product of the two curves and used as input function (CP(t), nCi/mL) for the kinetic and graphical analyses.
Determination of Radioactive Metabolites in Plasma
Plasma analysis of [11C]-(+)-PHNO was performed as described previously (Wilson et al, 2005). Briefly, arterial blood samples were centrifuged, and whole unadulterated plasma (0.5 to 5 mL) injected onto a small capture column packed with OASIS™ resin. Highly polar metabolites and plasma proteins were eluted with 1% CH3CN in H2O (2 mL/min) through a coincidence flow detector (Bioscan Flow-Count). Less polar metabolites and [11C]-(+)-PHNO were then back-flushed onto an HPLC column (Phenomenex LunaC18, 10μ, 250 × 4.6 mm) and resolved using 20% CH3CN/80% H2O + 0.1 N AF pH 4 as eluent (2 mL/min).
Regions of Interest
Each subject had a brain magnetic resonance imaging (MRI) examination. Standard spin echo proton density weighted images (TE = 17, TR = 6000, field of view = 22 cm 2D, 256 × 256, slice thickness = 2 mm, NEX = 2) were obtained on a General Electric Medical System Signa 1.5 T MRI scanner.
Regions of interest (ROIs) for the cerebellar cortex (hereafter referred to as cerebellum), dorsal caudate, dorsal putamen, globus pallidus (GP), and ventral striatum (VST) were generated using in-house software developed by Rusjan et al (2006), allowing a semiautomated delineation of ROIs and generation of time—activity curves (TACs). This software utilizes computer vision techniques based on the probabilities of gray matter to fit a standard template of ROIs to an individual high-resolution MRI scan. The individual MRI is then registered to the PET images so that the individual refined ROI template is transformed to the PET image space to allow ROI TAC generation. Since humans do not show clear anatomic distinctions between the nucleus accumbens and the ventral portions of caudate and putamen, subdivision of striatal ROIs followed the method described by Mawlawi et al (2001). This method divides the striatum into VST, dorsal caudate and dorsal putamen, with the VST being a ROI combining the nucleus accumbens and the ventral-most portions of caudate and putamen. The standard ROI template was created by manually drawing ROIs on a T1-weighted MRI scan normalized to the MNI/ICBM space (
Region of interests were defined on all planes where the structures were visible. Dorsal caudate, dorsal putamen, VST, and GP were defined on 16 to 18, 14 to 16, 12 to 14, and 12 to 14 consecutive axial slices, respectively, and in both hemispheres. Cortical cerebellum was delineated on 19 to 21 consecutive axial slices. For each brain structure, adjacent ROIs were pooled to form a volume of interest. Each volume of interest was then applied to the dynamic PET images and the corresponding TAC was generated with regional activity (nCi/mL) calculated for each frame, corrected for decay, and plotted versus time. For bilateral structures, a mean TAC was calculated by averaging the TACs obtained in the right and left hemispheres.
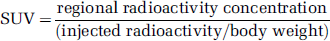
For display purpose, TACs were expressed as standardized uptake value (SUV) according to the following equation:
Data Analysis
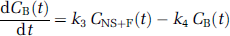
Kinetic analysis: Kinetic analysis of tissue data was performed with both a one-tissue (1CM) and a two-tissue compartment model (2CM). The 2CM includes the radioactivity concentration of unchanged radioligand in plasma (CP); the concentration of radioligand free and nonspecifically bound in tissue (CNS+F); and the concentration of radioligand specifically bound to receptor sites (CB). The rate constants K1 (mLg−1min−1) and k2 (min−1) describe the influx and efflux rates, respectively, for radioligand diffusion through the blood—brain barrier. The rate constant k3 (min−1) and k4 (min−1) describe the radioligand transfer between the nondisplaceable compartment (i.e., CNS+F) and the specific binding compartment (CB). Model equations for the 2CM analysis of radiotracer binding to receptors are given by

The ratio k3/k4 corresponds to the ratio of the number of available receptors (Bmax; pmol/mL) to the radioligand equilibrium dissociation constant (KD; pmol/mL), which is referred to as the binding potential (BP). Binding potential calculated directly from the k3/k4 ratio is referred to as BPDIRECT.
[11C]-(+)-PHNO binding was also expressed using the concept of the total volume of distribution, DVT, which is defined as

Apart from the direct estimation of BP using k3 and k4, an indirect estimation of BP, referred to as BPINDIRECT, was calculated using the DVT obtained in a reference region to approximate nonspecific binding. In this approach, BPINDIRECT in a target region was calculated as (Lammertsma et al, 1996):

where DVT—tissue is the DVT obtained in a target tissue and DVT—ref is that obtained in the reference region. In equation (4), it is assumed that nonspecific binding is the same in the target tissue and in the reference region. In the present work, cerebellum was chosen as the reference region (see Discussion).
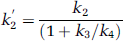
A simplification of the 2CM into a 1CM can be made by assuming that the concentrations CNS+F and CB equilibrate rapidly and are combined in one single compartment. The outcome measure for the 1CM was the total distribution volume, noted as DV′, and is given as

with
Nonlinear least-square fitting: Nonlinear least-squares fitting (NLSF) analyses using the Marquardt algorithm and based on the 1CM and 2CM were applied to the TACs for regional [11C]-(+)-PHNO uptake. The contribution of fractional blood volume in brain was fixed at 5% for all ROIs. For each subject, the time delay between the arterial input function and the TACs was estimated by fitting a whole brain slice taken from a single midbrain level to an unconstrained 2CM. Because of the difficulty in deriving the delay with a 2CM, five parameters configuration, the delay value was increased gradually, using 1 sec increments, to minimize the residual sum of squares of the whole brain curve. The delay value which gave the least residual sum of squares on the fitted whole-brain curve was used in all subsequent fits made for the subject.
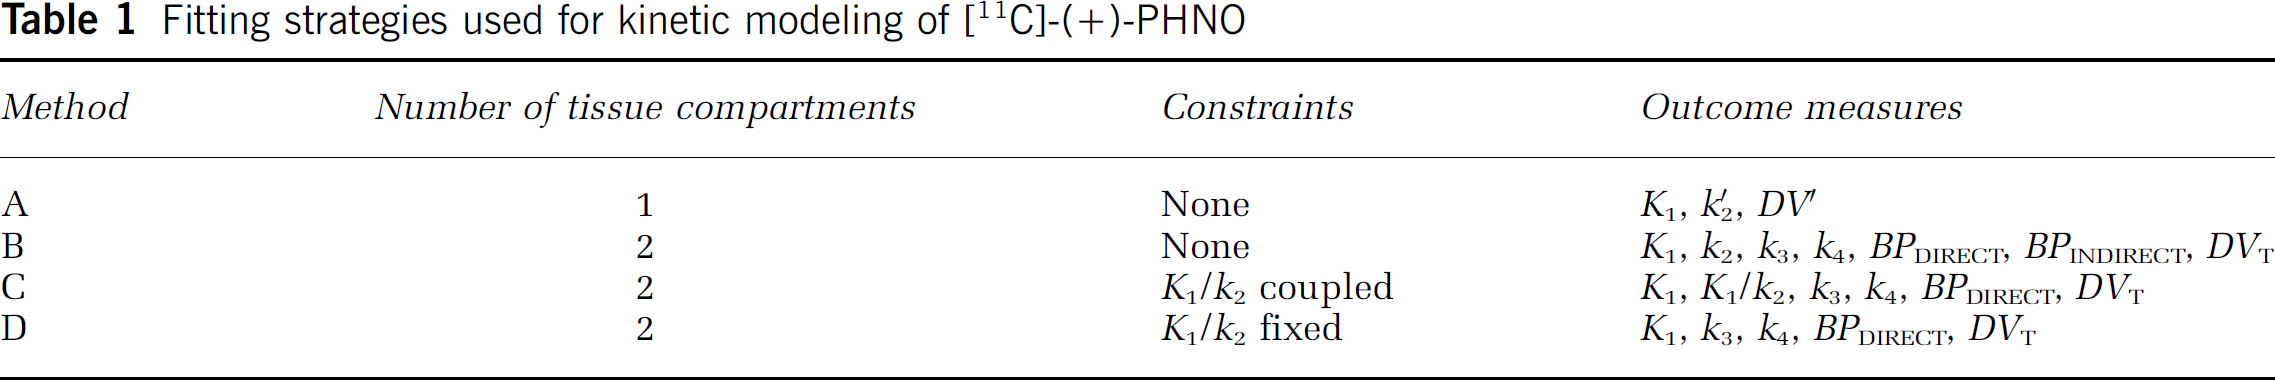
Different model configurations were used for analysis of [11C]-(+)-PHNO (Table 1). Method A was based on the 1CM and NLSF analyses were performed to estimate K1, k′2 and DV′. Methods B was based on the 2CM and NLSF analyses were performed to estimate the four rate constants K1, k2, k3 and k4. To improve the stability of the fits, two other fitting strategies were tested, both based on the assumption that K1/k2 is similar across brain regions. Method C consisted of fitting simultaneously data from all regions with the constraint of finding a K1/k2 value common to all regions. Method D consisted to fit all regions by fixing the K1/k2 ratio to the value obtained in cerebellum using method B.
Fitting strategies used for kinetic modeling of [11C]-(+)-PHNO
Nonlinear least-squares fitting analyses were performed using the dedicated software PMOD V2.5 (PMOD Technologies Ltd, Zurich, Switzerland).
Statistics: Goodness-of-fit was evaluated using the Akaike Information Criterion (AIC). Lower AIC values were indicative of a better fit. Statistical differences between AIC values obtained with different model configurations were tested using repeated measures analysis of variance (RM ANOVA). Models of higher complexity were also compared using F-test to determine whether goodness-of-fits was sufficiently improved to justify the choice of a model with a higher number of parameters.
The standard error of the parameters was given by the diagonal of the covariance matrix, expressed as percentage of the parameter value (coefficient of variation, %COV), and used to assess the parameter identifiability by the NLSF procedure. In addition, for derived parameters such as k3/k4 and DVT, the s.d. of the mean was calculated, expressed as percentage of the mean parameter value, and used as an indication of inter-subject variability of the parameter (%VAR = s.d. × 100%/mean).
Simplified Method of Analysis
In these methods, the TAC measured in a region devoid of specific binding sites, CNS+F (t), is used as an indirect input function. For [11C]-(+)-PHNO, the cerebellum was used as the reference region assuming that no D2/3 receptor sites are present in this region. Evaluation of the reliability of the simplified methods to estimate BP or DVT was based on both the comparison with the corresponding value(s) obtained from the kinetic approaches and the degree of inter-subject variability (%VAR) of the parameter estimate. The following simplified approaches were evaluated:
Linear graphical analysis with plasma arterial input—BPLogan—I: The graphical approach described by Logan et al (1990) for the analysis of reversible radioligand binding was applied to the quantification of [11C]-(+)-PHNO. A plasma input function corrected for the presence of labeled metabolites (CP(t)) was used. The ratio ∫0 t ROI(t)dt/ROI(t) was plotted versus ∫0 t CP(t)dt/ROI(t) with ROI(t) describing radioactivity in a target tissue as a function of time. The DV of the radioligand in that ROI was determined from the linear portion of the plot obtained. The ratio of the DV in a ROI to that obtained in cerebellum is related to BP by

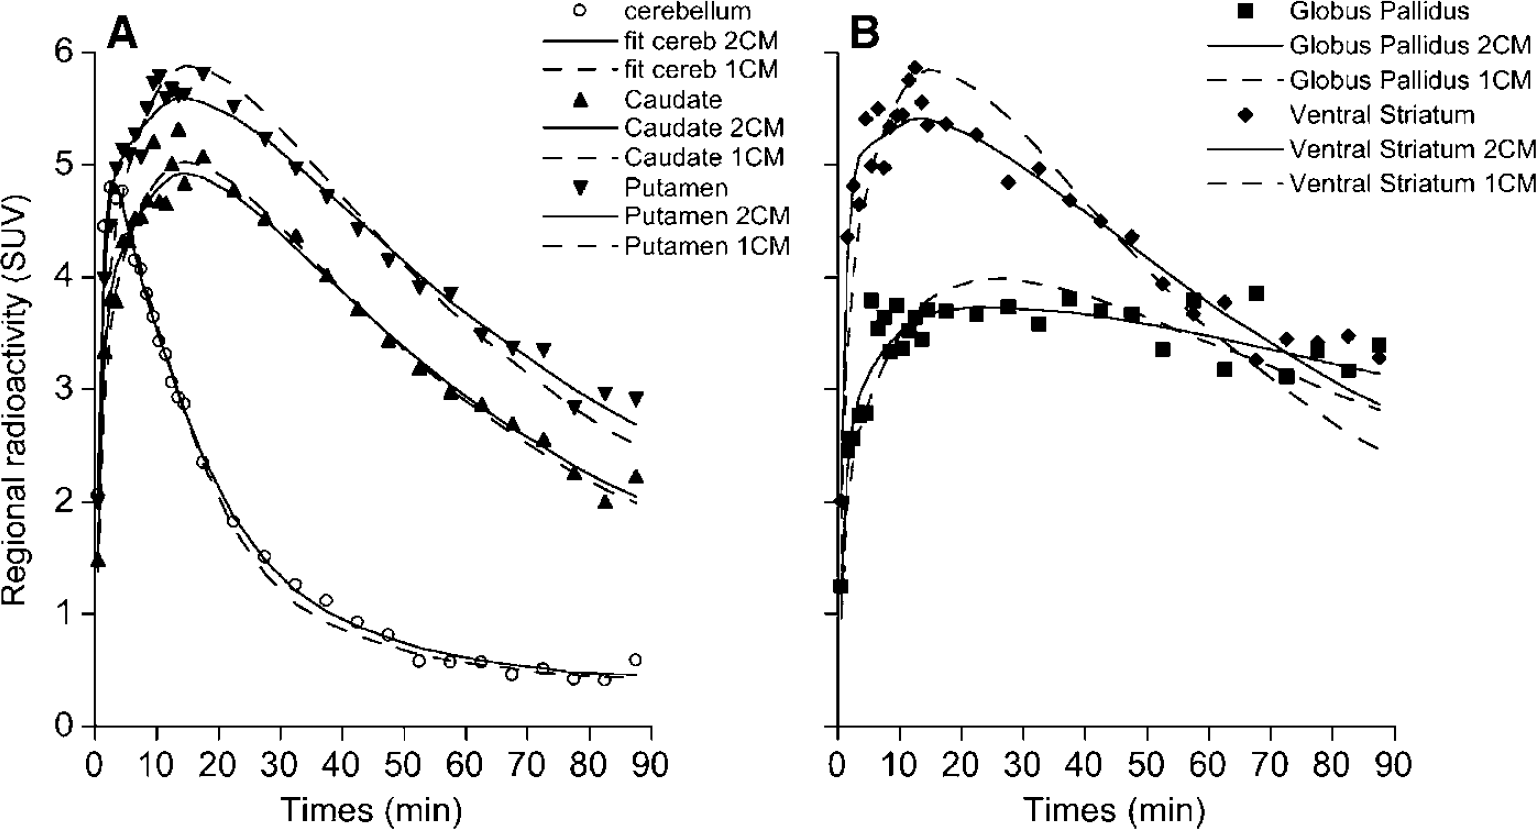
Linear graphical analysis with cerebellum input—BPLogan-NI: To avoid arterial sampling, Logan et al (1996) have developed a modified, noninvasive, graphical approach that uses a reference region as the input function and allows estimation of a distribution volume ratio, DVR. The DVR can be estimated from the slope of the linear portion of the plot of ∫0 t ROI(t)dt/ROI(t) versus ∫0 t Cref(t)dt/ROI(t) where Cref describes radioactivity in the reference region. The BP is calculated as
Simplified reference tissue model—BPSRTM: The major assumptions of this approach are that the level of nondisplaceable binding in the reference and the target regions is similar, and that the exchange rates between the nondisplaceable and specific compartments are so fast that they are combined in a single compartment (Lammertsma and Hume, 1996). An expression including BP can be derived, which relates radioligand concentration in a target region to the radioligand concentration in the reference region. From the TACs measured in the reference and in the target regions, BP can be obtained using NLSF analysis. The BP calculated with this approach is referred as BPSRTM.
Effect of Study Duration on Parameter Estimates
The effect of study duration on parameter stability was estimated by shortening the fitting interval. Study durations ranging from 40 to 90 mins after [11C]-(+)-PHNO injection were evaluated. The identifiability of BPSRTM was evaluated in each region. For each region and duration, each parameter was expressed as the percentage of the value obtained when 90 mins of scanning data was considered. The s.d. of the mean of each parameter value was used as an indication of the stability of the parameter estimate.
Simulation Studies
Simulation studies were performed to estimate the error introduced by the presence of a second compartment in cerebellum on the determination of BPSRTM in target tissues. Simulated TACs for CNS+F were generated in the cerebellum of each subject according to equation (1), using the individual rate constants as given by Method D. The simulated cerebellar TACs obtained, which included one tissue compartment only, were then used to estimate BP using the SRTM; these simulated BP were noted BPSRTM—simul. For each subject and each ROI, BPSRTM—simul were compared with the BPSRTM values obtained when using the original total cerebellar TACs.
Another simulation study was performed to estimate the error introduced by the presence of a second binding compartment in cerebellum on BPSRTM in putamen-like and in GP-like brain regions. The reason for testing these two type of regions in the simulations is that [11C]-(+)-PHNO binding kinetics differed markedly between both regions, with GP showing significantly lower K1 and k4 values than those measured in putamen, caudate and VST (see Results). Tissue TACs obtained in putamen and in GP of one specific subject were fitted according to method D. The kinetic parameters derived from the fitted curve were K1 = 0.81 mL g−1 min−1; K1/k2 = 4.88 mL g−1 k3 = 0.19 min−1 k4 = 0.06 min−1 for putamen and K1 = 0.43 mL g−1 min−1; K1/k2 = 4.88 mL g−1 k3 = 0.11 min−1 k4 = 0.03 min−1 for GP. For each brain region, simulated TACs were generated with the K1, K1/k2 and k4 values fixed to the aforementioned values, and with k3 values ranging from 0.015 to 0.42 min−1 in putamen and from 0.007 to 0.19 min−1 in GP, which corresponded to k3/k4 values (BPTRUE) ranging from 0.25 to 7 in both regions. BPSRTM were then calculated using those simulated TACs and the original total curve obtained for this subject in cerebellum. The simulated BPSRTM was then expressed as the percentage of BPTRUE and the percentage difference between the two values calculated and plotted versus BPTRUE
Results
Plasma Analysis and Tissue Data
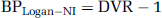
[11C]-(+)-PHNO was rapidly metabolized with approximately 70% of the radioactivity in plasma attributable to polar metabolites after 15 mins. The fraction of unmetabolized [11C]-(+)-PHNO in plasma decreased more slowly thereafter, being 25% ± 2%, 19% ± 2%, 13% ± 2%, and 11% ± 3% at 20, 30, 50, and 75 mins postinjection, respectively (Figure 1A). All metabolites were more polar than the parent compound and thus unlikely to pass the blood—brain barrier. Figure 1B shows typical curves obtained in one subject for total concentration of radioactivity in blood and for unmetabolised [11C]-(+)-PHNO in plasma.
(
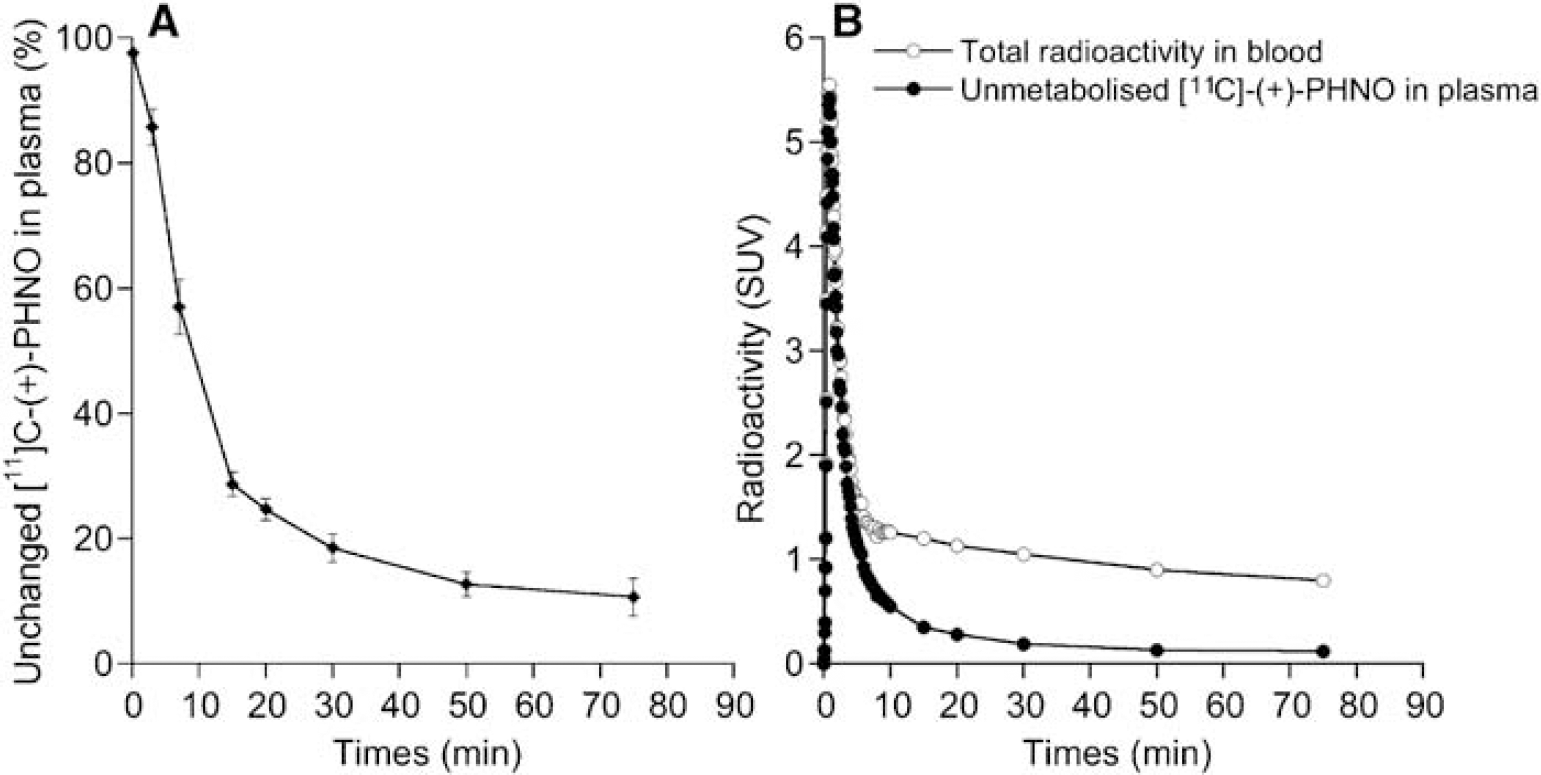
After injection of [11CH]-(+)-PHNO, high concentrations of radioactivity were observed in caudate, putamen, GP and VST whereas low levels of radioactivity were found in cerebellum and white matter (Figures 2A and 2B). It was noticeable that slightly higher accumulation of radioactivity was observed in white matter than in cerebellum. In all regions, radioactivity concentrations peaked within the first 30 mins of PET measurement. The washout of radioactivity was however different between regions, being the fastest in cerebellum, intermediate in caudate, putamen and VST, and the slowest in GP. Figures 2C and 2D show that transient equilibrium between levels of radioactivity in tissue and levels of unmetabolised [11C]-(+)-PHNO in plasma was obtained within 60 mins of data acquisition in all regions.
Mean (±s.d.; n = 6) TACs obtained after injection of [11C]-(+)-PHNO to healthy control volunteers (n = 6) in (
Compartmental Kinetic Analyses
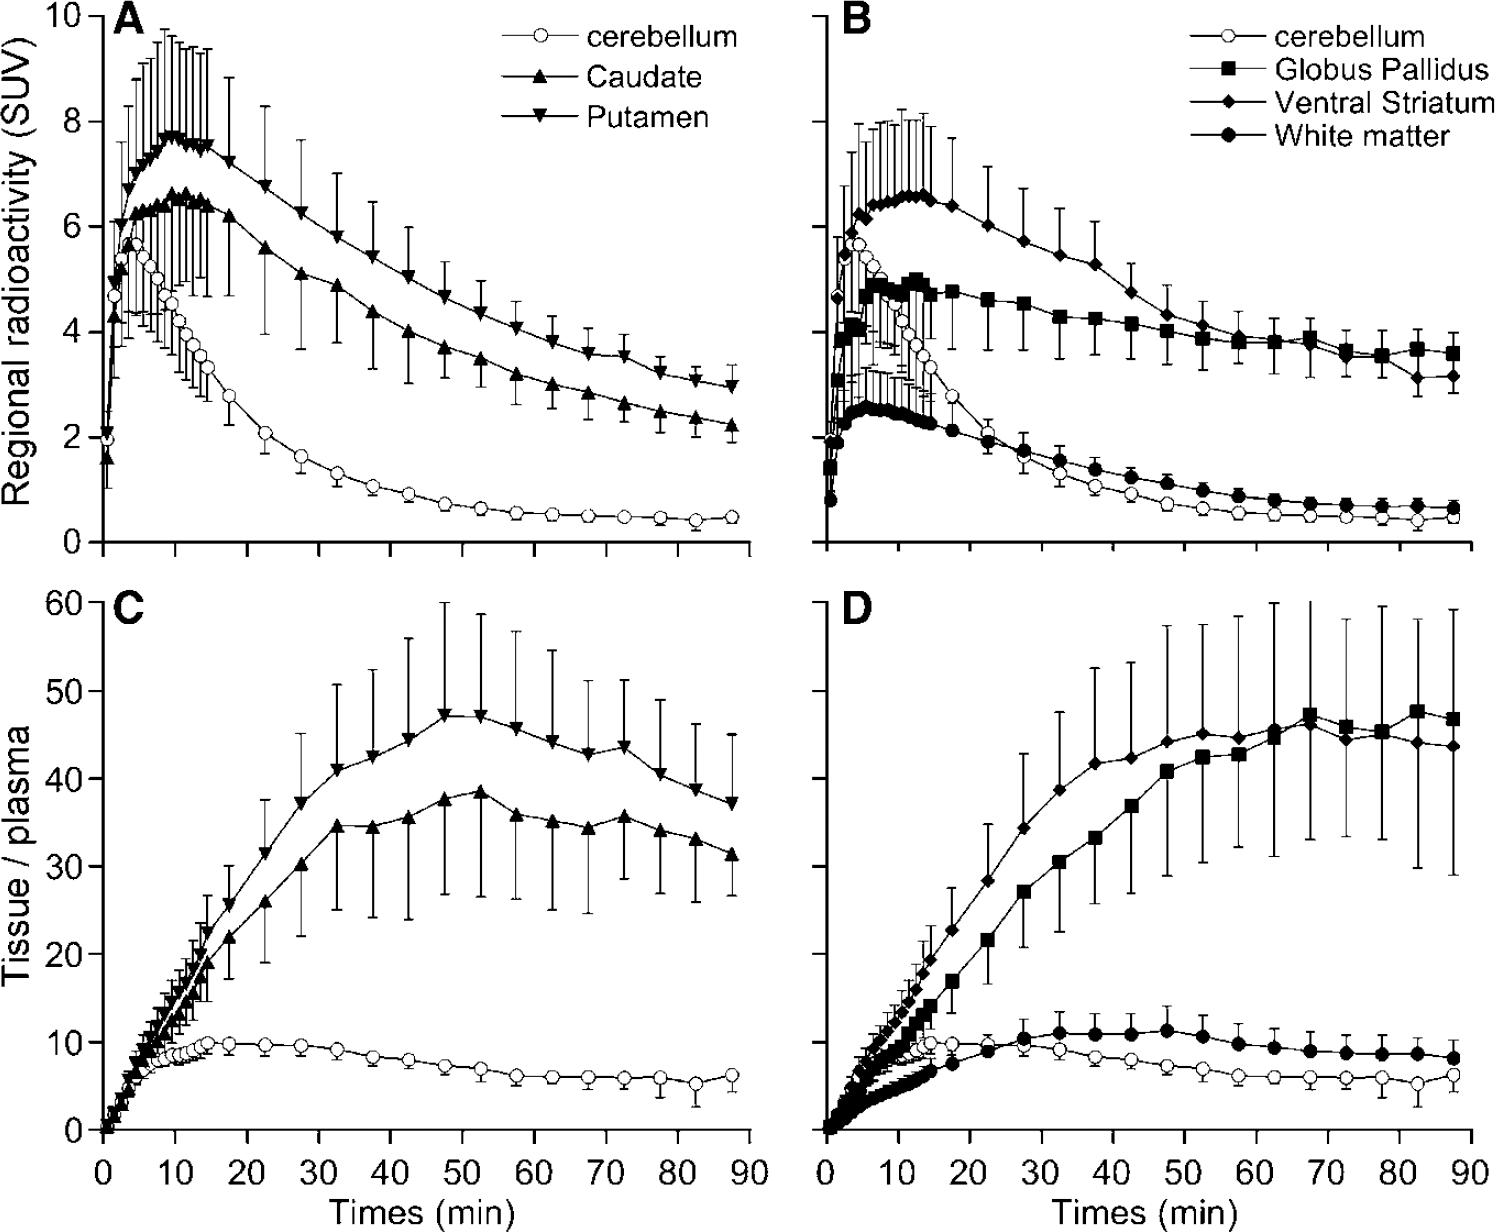
A 1CM was consistently inadequate to describe [11C]-(+)-PHNO kinetics in brain with a general overestimation of the peak radioactivity concentrations and underestimation of data at later times (Figures 3A and 3B). Adding a second tissue compartment (Method B) significantly improved 29 out of the 30 curve fits when compared with the 1CM as assessed with AIC values and F-statistics. On average, the 2CM configuration yielded AIC values in cerebellum, caudate, putamen, GP and VST that were 11%, 34%, 53%, 33%, and 35% lower, respectively, than those obtained with the 1CM (RM ANOVA, P < 0.001 across regions and across subjects). F-statistics for each TAC and each subject were in the range of F = 0.7 to 167 and F2,26 was significant at P ≤ 0.05 for F ≥ 3.37.
Nonlinear least-squares fits of [11C]-(+)-PHNO time—activity data in one healthy subject. For each brain region, the symbols correspond to the experimental measured values, the dashed line corresponds to the fitted curve obtained according to a 1CM and the solid line corresponds to the fitted curve obtained according to an unconstrained 2CM. The goodness of fits indicates that, for all regions including cerebellum, a 2CM was necessary to describe the in vivo kinetics of [11C]-(+)-PHNO.
An unconstrained 2CM (Method B) provided an excellent identification of K1 with %COVs ranging from 2.5% to 4.7% (Table 2). While K1 values were relatively uniform across caudate, putamen, and VST, K1 estimated in GP were significantly lower than those obtained in all other regions (Student's t-test: P < 0.001). Values for K1/k2 were estimated with reasonable precision in cerebellum (mean %COV = 8%), but with less precision in the other brain regions (mean %COV = 15%; Table 2). The k3 values were obtained with high %COV in all regions. The k4 values were not uniform across brain regions, with the highest value in cerebellum and lowest values in GP; their COV% were however lower than those of k3. Thus, the unconstrained 2CM fit provided good identification of K1, reasonable to mediocre identification of K1k2 and k4 and poor identification of k3. In consequence, the k3/k4 ratios were highly variable between subjects with a mean %VAR of 38% ± 9% across subjects and across regions (Table 2). In contrast, DVT values were estimated with high precision, as attested by a mean %COV of 3.1% (range: 1–10%) and a mean %VAR of 16% (range: 11–21%) across subjects and across brain regions (Table 3). The rank order of DVT values (cerebellum < caudate < putamen < VST < GP) matched that of k3/k4 values and the correlation between both outcome measures was significant (slope = 5.20; r = 0.83; Student's t-test: P < 0.001; Figure 4A).
Average kinetic parameter estimates obtained using Methods B to D
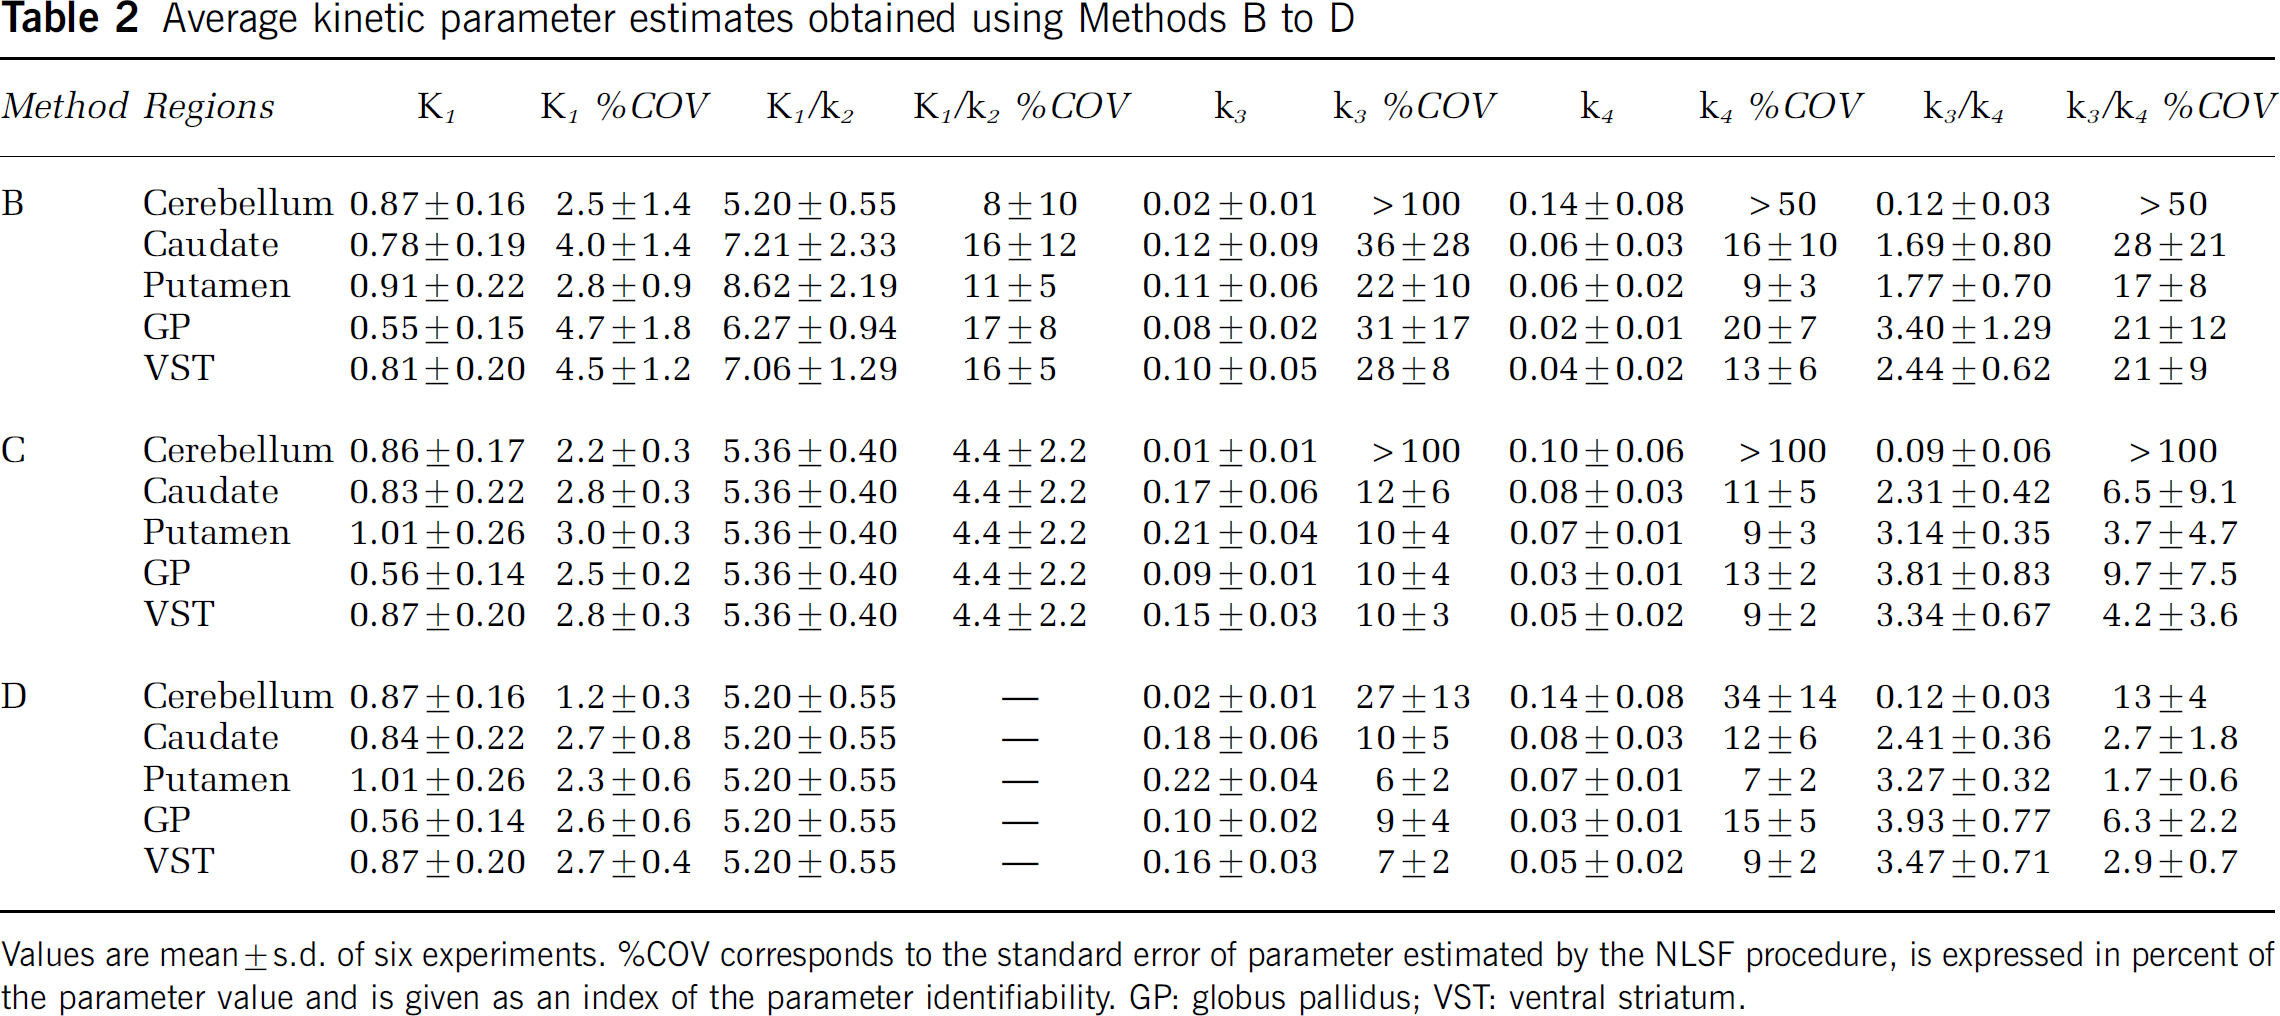
Values are mean ± s.d. of six experiments. %COV corresponds to the standard error of parameter estimated by the NLSF procedure, is expressed in percent of the parameter value and is given as an index of the parameter identifiability. GP: globus pallidus; VST: ventral striatum.
Comparison of total distribution volume values obtained between methods
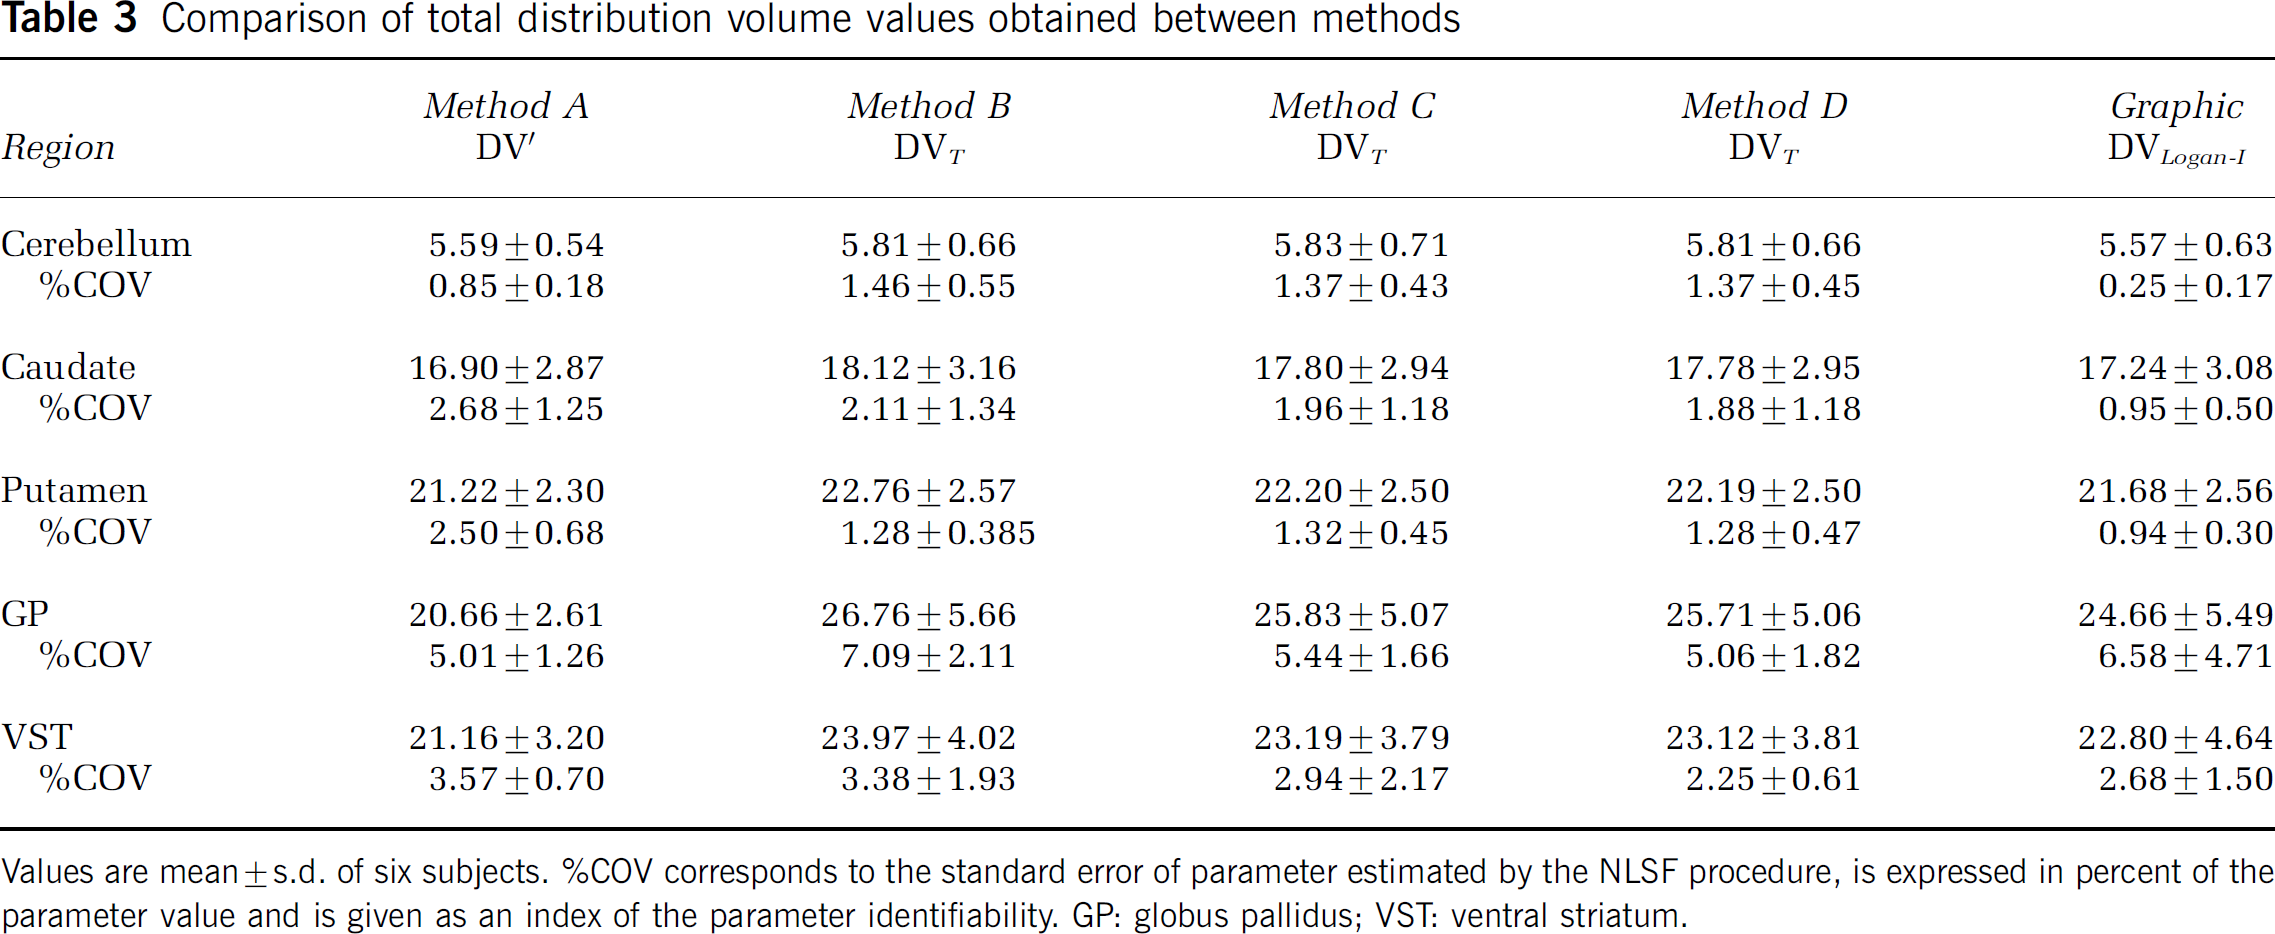
Values are mean ± s.d. of six subjects. %COV corresponds to the standard error of parameter estimated by the NLSF procedure, is expressed in percent of the parameter value and is given as an index of the parameter identifiability. GP: globus pallidus; VST: ventral striatum.
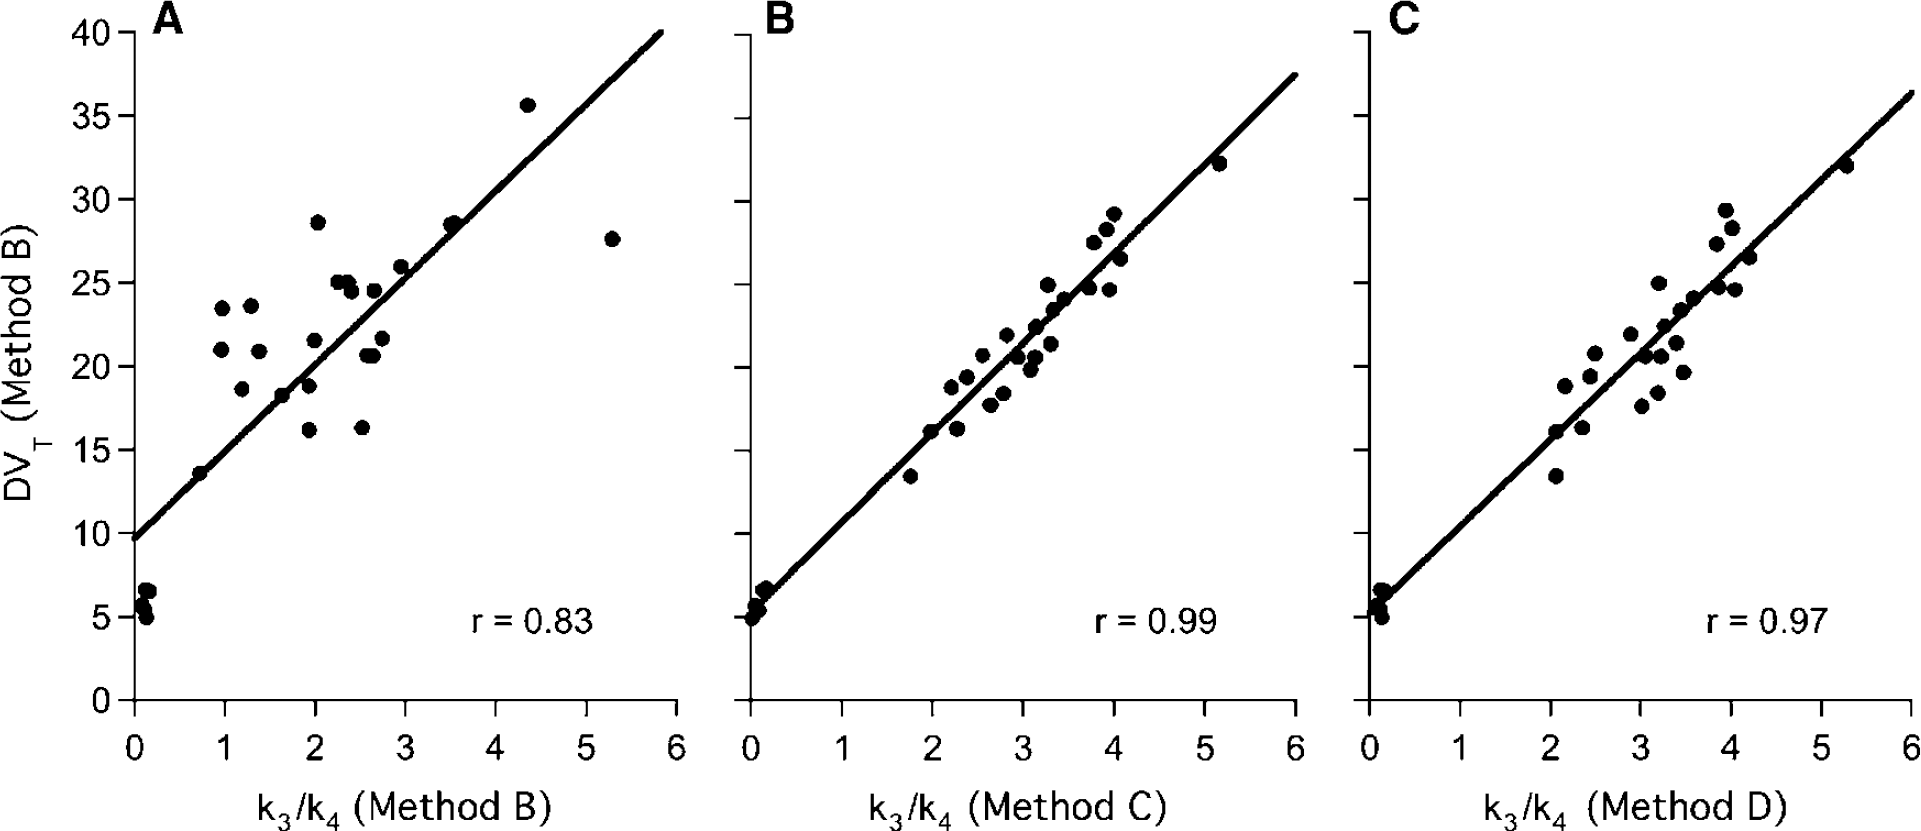
Correlation between DVT values obtained using the unconstrained 2CM (Method B) and k3/k4 values obtained using: (
Coupling K1/k2 (Method C) between regions during the fit or constraining the K1/k2 ratio in brain regions to the value obtained in cerebellum (Method D) significantly improved the identifiability of parameter estimates when compared with method B (Table 2). Moreover, the K1/k2 ratios generated by Method C in cerebellum were not statistically different (P < 0.05; Student's t-test) from those used in Method D, a result lending support to the model simplification used in Method D. Goodness-of-fits were not statistically modified by using either Method C or D when compared with Method B as assessed with AIC. In average, AIC values were increased by only 6% and 4% with Method C and D, respectively, when compared with Method B and these differences were not significant (RM ANOVA, P > 0.05 across regions and across subjects for both Methods). F-statistics however indicated that Methods C and D slightly worsened goodness-of-fits in five out of 30 and six out of 30 fits, respectively, when compared with Method B.
Methods C and D provided parameter estimates that had lower %COV and lower %VAR than Method B (Table 2). For instance, the mean %COV for k3 across all regions except cerebellum was reduced to 8.5% ± 3.6% (range: 4% to 15%) with Method D when compared with Method B (mean %COV = 29.6% ± 17.3%; range: 14%–72%). The uncertainty in k4 estimates was also reduced in all regions except cerebellum with Method D (mean %COV = 10.7% ± 4.6%; range: 5% to 18%) when compared with Method B (mean %COV = 14.5% ± 8.0%; range: 5% to 29%). It was noticeable that k4 values greatly varied across brain regions. K4 values obtained in GP were, on average, more than 50% lower than those obtained in caudate and putamen (Student's t-test: P < 0.002).
Methods C and D provided a good to excellent estimations of k3/k4 values in all brain regions except for cerebellum (Table 2). This was especially true for Method D, which produced a mean %COV of 5.4% ± 4.7% for k3/k4 across all regions and all subjects. Both methods also gave significantly lower inter-individual differences in regional k3/k4 values than did Method B with a mean % VAR of 18% ± 5% both for Method C (excluding cerebellum) and Method D. Despite their superiority in determining k3/k4 values, the two constrained 2CM methods did not provide values for DVT that were significantly different than those estimated with Method B (RM ANOVA, P > 0.05; Table 3). The k3/k4 values obtained with Methods C and D were highly correlated with DVT values obtained with Method B (slope = 5.67 and r = 0.99 for Method C; slope = 5.50 and r = 0.97 for Method D; Student's t-test: P < 0.001 for both methods; Figures 4B and 4C). Comparisons of the correlation coefficients obtained in Figures 4A—C using the Fisher's r-to-z transformation revealed that the correlations generated using k3/k4 values obtained with Method C and D were both significantly stronger (P < 0.001) than the correlation generated with k3/k4 values obtained with Method B.
Simplified Methods of Analyses
Total DV values derived from the invasive Logan approach were slightly lower (range: +2% to −13%; mean: −5%) but not statistically different (RM ANOVA, P > 0.05) from those obtained using the unconstrained 2CM (Table 3). The two measures were highly correlated (slope = 0.94; r = 0.99; Student's t-test: P < 0.001).
The average BP values obtained by the different methods are given in Figure 5. Note that for Method B two BP values are given, one obtained directly from the k3 and k4 rate constants (i.e., BPDIRECT), the other (BPINDIRECT) obtained indirectly from DVT estimates (see equation (4)). BPDIRECT obtained by Method B were significantly lower (P < 0.05) than BPs obtained with all other methods. However, all applied methods correlated statistically significantly with each other. Figure 6 shows correlations between BPSRTM and BPs obtained with the different kinetic approaches. Although significant (slope = 0.45; r = 0.62; Student's t-test: P < 0.01), the correlation between BPSRTM and BPDIRECT obtained with Method B was significantly weaker than those obtained with Methods C and D (Figure 6). The highest coefficients of correlation were observed between BPSRTM and BPINDIRECT obtained with Method B as well as between BPSRTM and BPDIRECT obtained with Method D (r = 0.98). When compared with the SRTM, the Logan noninvasive approach tended to show weaker correlations with the indirect Method B as well as with the direct Methods C and D (with correlation coefficients around 0.95).
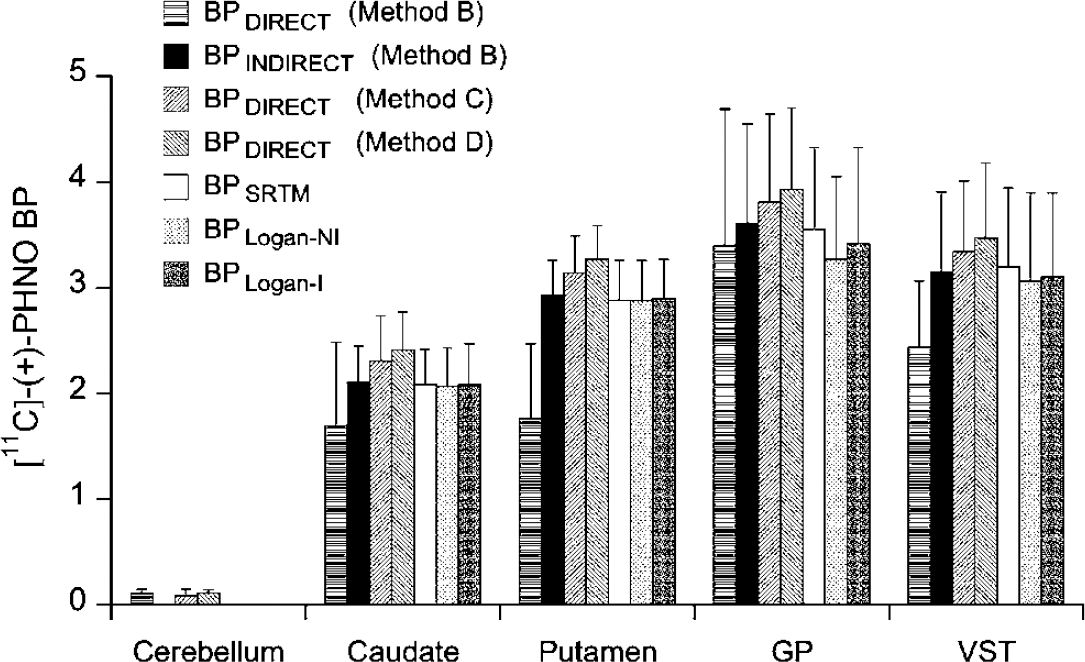
Comparison of the mean ± s.d. BP values obtained using different methods in cerebellum, caudate, putamen, GP, and VST after injection of [11C]-(+)-PHNO.
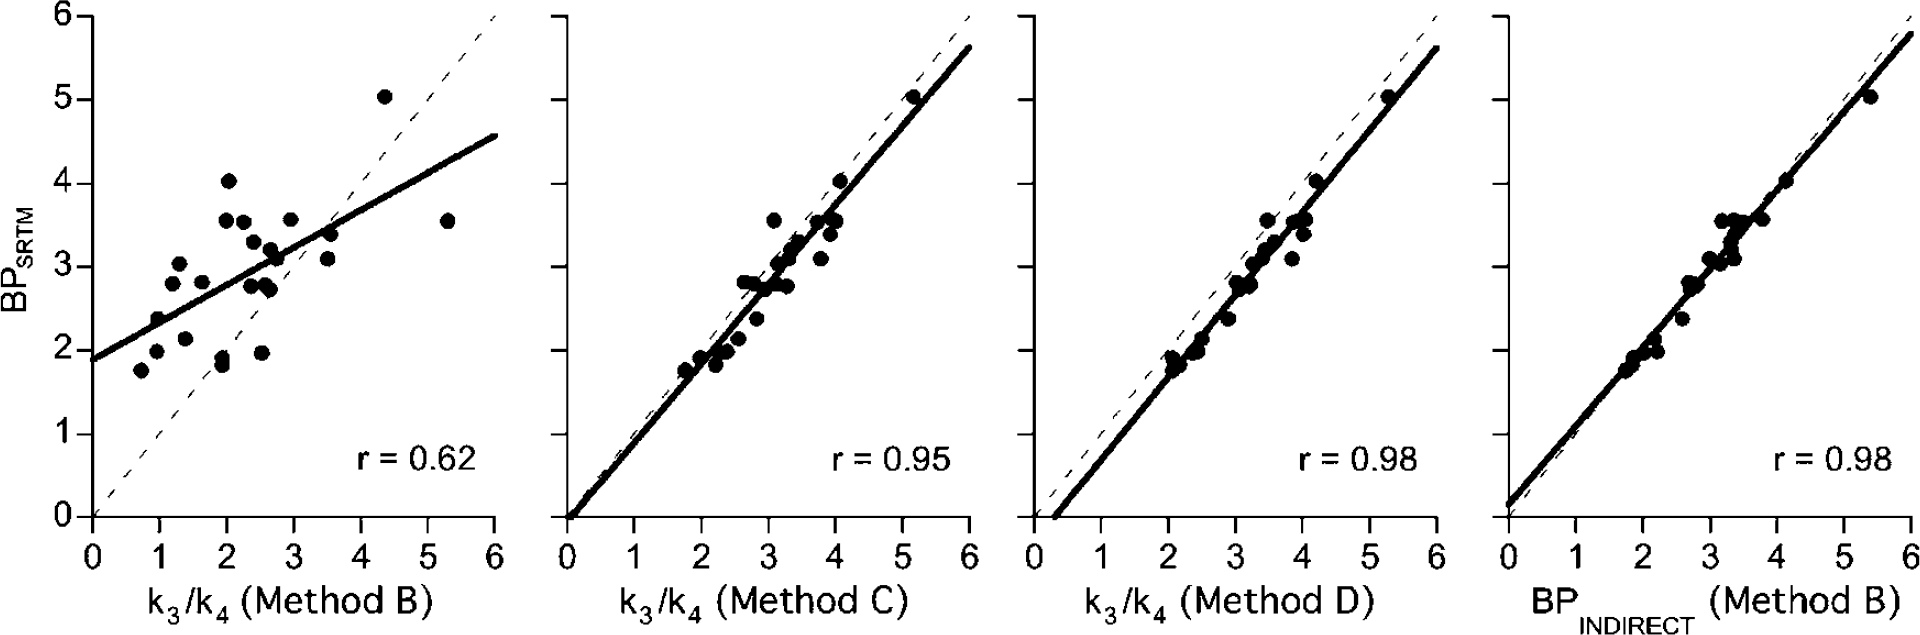
Correlation between BPSRTM and k3/k4 values obtained using the different approaches. The linear regression line was calculated using individual regional values obtained among the six subjects.
Although highly correlated, all simplified approaches (indirect kinetic Method B, SRTM, Logan invasive and noninvasive approaches) underestimated k3/k4 values as obtained with Method D (RM ANOVA, 0.001 < P < 0.04) with the smallest underestimation given by the indirect kinetic Method B (10% ± 5% on average; RM ANOVA, P > 0.05) and the SRTM (11% ± 5% on average; RM ANOVA, P > 0.05) and the highest given by the invasive and noninvasive Logan (13% ± 4% and 14% ± 6% on average, respectively; RM ANOVA, P < 0.05). However, none of these simplified methods gave BP values that were significantly different from k3/k4 values obtained with Method C (RM ANOVA, 0.07 < P < 0.16).
The SRTM gave slightly lower interindividual differences (19%+ 5%) than those given with the Logan invasive and noninvasive approaches (21% ± 6% for both methods).
Stability of BPSRTM Versus Study Duration
To define the minimum PET data acquisition time required to derive stable BPSRTM values, all regional TACs were fitted for various periods of time ranging from 40 to 90 mins in 10-mins increments (Figure 7). In caudate and putamen, BPSRTM values for 60-mins of study duration and up were within 5% of the value obtained with 90 mins. With only 40 to 50 mins of data included, BPSRTM were still within 90% of the 90 mins value. In GP and VST, stable values for BPSRTM were reached for study duration equal to or greater than 70 and 80 mins, respectively (Figure 7).
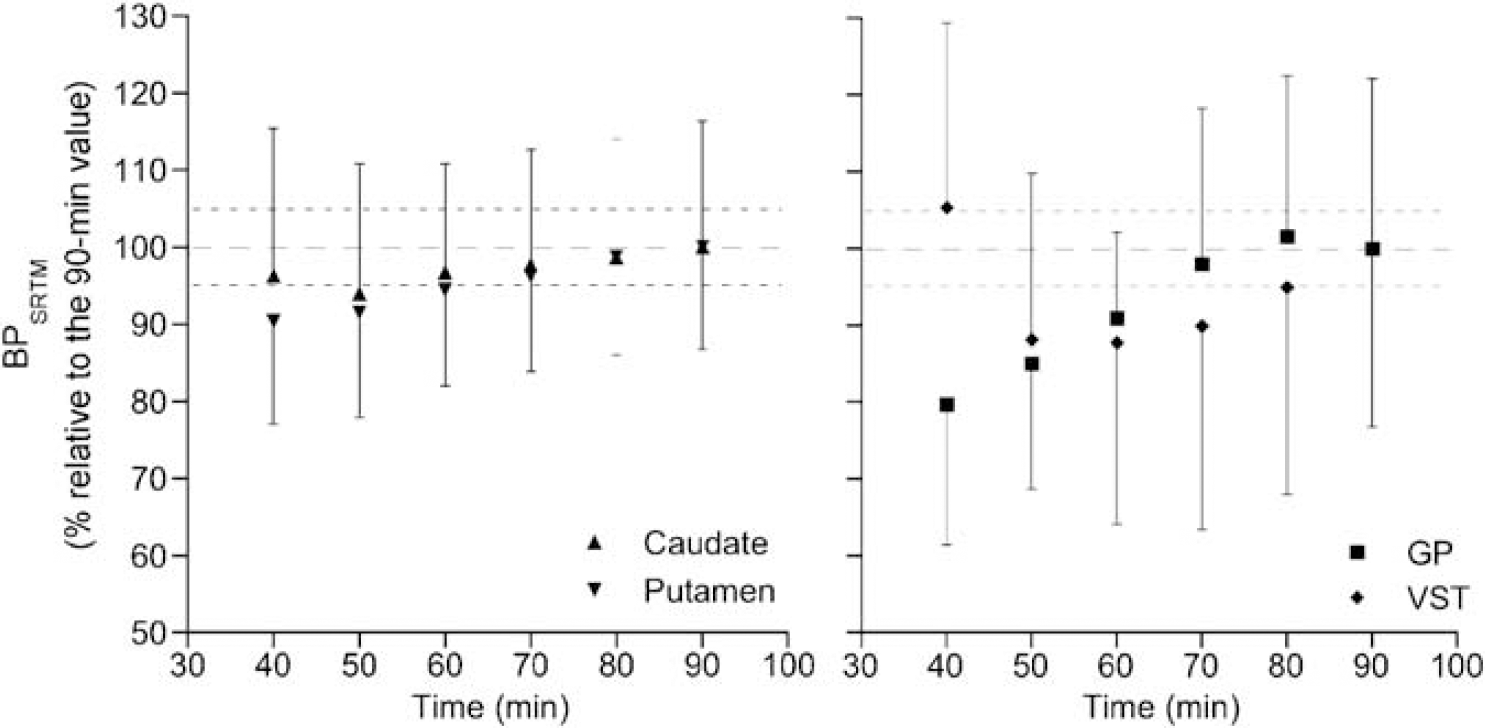
Effect of scan duration on the stability of BPSRTM in the different brain regions. Below 90 mins of study duration, BPSRTM was expressed as the mean ± s.d. (n = 6) percentage of the value obtained when 90 mins of data acquisition was considered.
Simulations
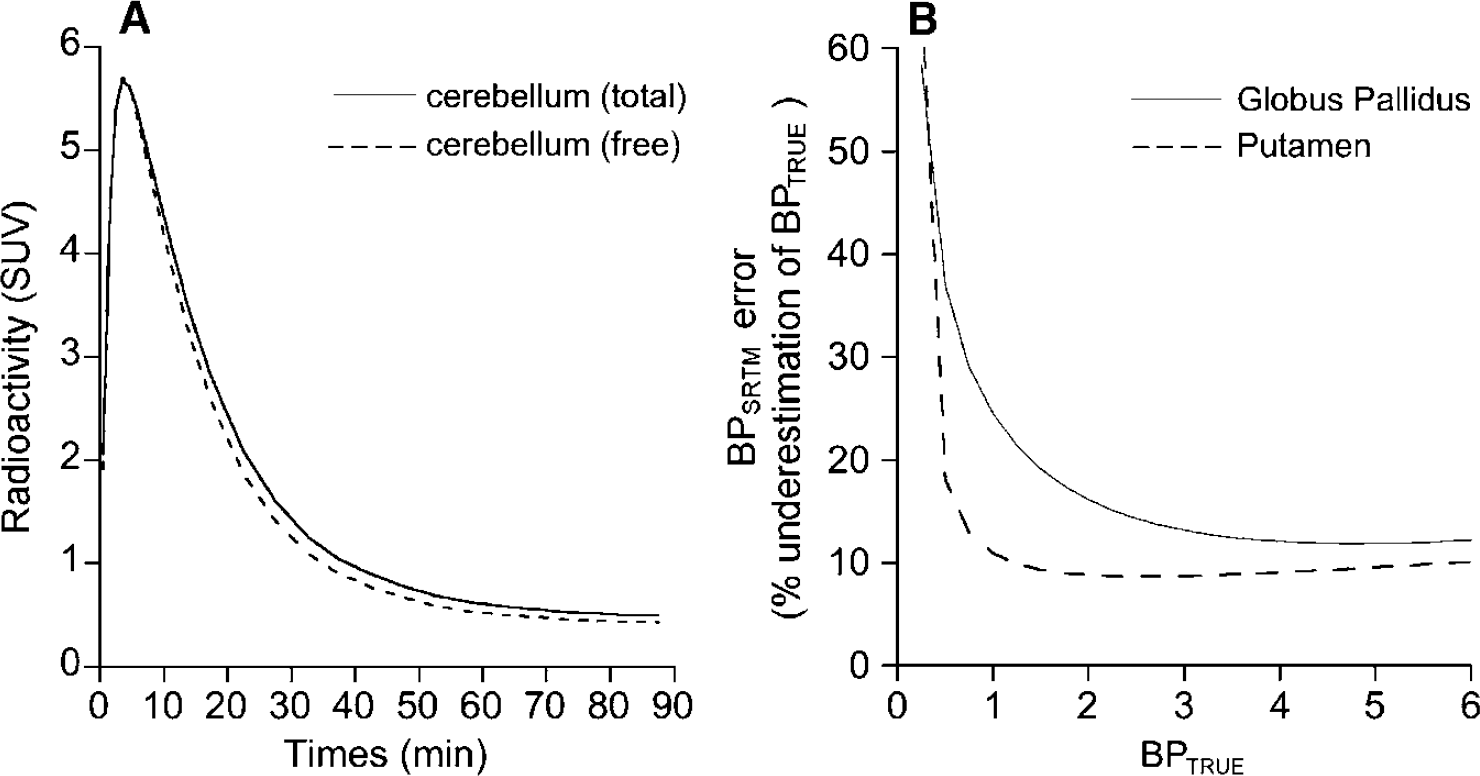
By using the K1, K1/k2, k3 and k4 parameters obtained with Method D, the TACs for the free and nonspecific radioligand in cerebellum (TACNS+F) were simulated for each subject. Figure 8A shows a comparison of the mean TACNS+F and the mean original total cerebellar curve. It was calculated that 93% ± 2% of the area under the curve of the total radioactivity in cerebellum represents free and nonspecific radioligand. Simulations showed that the BPSRTM obtained using the total original curve for cerebellum were, on average, 10% ± 5% lower than the BPSRTM—simul obtained using the TACNS+F, indicating that the bias introduced by the kinetically distinguishable second compartment in cerebellum is acceptable.
(
The error introduced by a second binding compartment in cerebellum on BPSRTM in target ROIs showing [11C]-(+)-PHNO binding parameters representative of those encountered in putamen and GP is presented in Figure 8B. In both type of regions, the error in BPSRTM was highest for lowest BPTRUE values. In putamen-like regions, BPSRTM underestimated BPTRUE by more than 15% for BPTRUE lower than 0.5. For BPTRUE higher than 1, the underestimation ranged between 9% and 11% (Figure 8B). In GP-like regions, BPSRTM underestimated BPTRUE by more than 15% for BPTRUE values lower than 2.3. Underestimation progressively declined with increasing BPTRUE values and ranged from 12% to 13% for BPTRUE values ranging from 3.3 to 7 (Figure 8B). Despite these small biaises, BPSRTM were highly correlated with BPTRUE values with r > 0.99 in both putamen-like and GP-like regions.
Discussion
This work describes the first quantitative kinetic modelling evaluation of the novel PET imaging agonist radiotracer, [11C]-(+)-PHNO, for the in vivo estimation of D2/3-receptor density in the human brain. Kinetic analyses of [11C]-(+)-PHNO kinetics showed that a 2CM configuration provided significantly better fits to the data than a 1CM configuration in all regions. While this was predictable in D2-like receptor-rich regions of the basal ganglia, that a 2CM provided better fits in cerebellum was unexpected. Simulations showed that a major portion (i.e., 93% ± 2%) of the area under the curve of the total radioactivity in cerebellum represents free and nonspecific radioligand. One concern would be that the remaining 7% may represent specific binding to D2/3 receptors. However, several observations make this unlikely. First, a number of post-mortem human studies have shown that cerebellum cortex contains negligible concentrations of DA D2- (Camps et al, 1989; De Keyser et al, 1988) and D3 receptors (Hall et al, 1996; Levant, 1998). Consistent with the assumption that cerebellar radioactivity represents free and nonspecifically bound [11C]-(+)-PHNO, preliminary data obtained in human showed no detectable change in cerebellar radioactivity accumulation after haloperidol blockade (Willeit et al, 2006). We also confirmed in a series of preclinical studies performed in cats (Ginovart et al, 2006a) and rodents (Galineau et al, 2006; Wilson et al, 2005) that cortical cerebellum is devoid of [11C]-(+)-PHNO specific binding sites, thereby lending support for the use of cerebellum as a reference region for [11C]-(+)-PHNO binding quantification. In a receptor-free region, it is assumed that the free and nonspecific binding compartments are in rapid equilibrium so that both compartments can be combined into a single, nondisplaceable compartment. In such a case, the parameters k5 and k6, which describe the exchange of radiotracer between free and nonspecific binding in tissue, are lumped into rate constant k2 (noted k′2, Koeppe et al, 1991). It is probable that, in the case of [11C]-(+)-PHNO, equilibrium between the free and nonspecific compartments is not fast enough and this leads to the identification of a kinetically distinguishable NSB compartment in cerebellum. Such a kinetically distinguishable NSB compartment has already been identified in cerebellum with [11C]raclopride (Farde et al, 1989; Lammertsma et al, 1996). The intermixture of white and gray matter might explain the identification of such a compartment for [11C]-(+)-PHNO in cerebellum as pure white matter showed higher retention of the radioligand than the sampled cerebellum itself.
A 2CM, four-parameters configuration (Method B), provided an excellent estimation of K1. Noticeably, K1 estimated in GP were significantly lower than those obtained in all other regions, a result consistent with the significantly lower cerebral blood flow measured in GP when compared with other brain structures including caudate and putamen (Haku et al, 2000). Method B yielded k3/k4 ratios that were too highly variable to be used as reliable measures of [11C]-(+)-PHNO binding site density. In contrast, DVT values were estimated with high precision and provided reliable indexes of D2-like receptor densities. The difficulty in deriving reliable individual estimates for k3/k4 from a 2CM four parameters configuration while obtaining stable DVT has already been reported for other radioligands (Ginovart et al, 2006b; Koeppe et al, 1996). DVT values obtained with Method B were strongly correlated with those obtained with the invasive Logan approach, a result lending support to the 2CM configuration to describe [11C]-(+)-PHNO binding data. The Logan approach however resulted in a systematic underestimation of [11C]-(+)-PHNO DVs. This underestimation was more pronounced in GP, the region with highest DVT, an effect that has been related to the presence of statistical noise in the TAC data (Slifstein and Laruelle, 2000).
Reduction in the complexity of the 2CM allowed the derivation of more stable estimates for k3, k4, and k3/k4. This was performed by assuming that the levels of free and nonspecific binding are similar across all grey matter structures in brain (Method C) or by fixing them to the levels measured in cerebellum (Method D). Both constrained methods substantially improved the reliability and inter-subject variability of k3/k4 estimates when compared with the unconstrained 2CM configuration. For instance, the k3/k4 intersubject variability in caudate—putamen decreased from 44% with the unconstrained 2CM to 15% and 12% with Method C and D, respectively. These latter values are consistent with the 14% variability in the specific to nonspecific binding ratio reported in caudate—putamen with [11C]raclopride (Farde et al, 1995).
Although Methods C and D improved reliability of BP estimates when compared with Method B, all three methods gave similar estimates for DVT. Both constrained kinetic methods thus provided high accuracy and low inter-individual variability in k3/k4 estimates as well as strong correlations between k3/k4 and DVT values. Since Method D has the advantage of computational simplicity, we consider it to be the method of choice for derivation of [11C]-(+)-PHNO BPs.
The rank order of [11C](+)-PHNO BP values (cerebellum < caudate < putamen < VST < GP) conforms to the densities of D2 receptors reported in the post-mortem human brain. Detailed autoradiography studies of the anatomic distribution of D2 receptors in human, using [123I]epidepride and [3H]spiperone, have demonstrated that the caudate, putamen, and nucleus accumbens contain the highest densities of D2 receptors (Camps et al, 1989; De Keyser et al, 1988; Gurevich and Joyce, 1999; Kessler et al, 1993; Murray et al, 1994). Lower but still significant D2-receptor densities were detected in GP, which represented 5% to 20% of that measured in caudate-putamen, while the thalamus, hypothalamus, amygdala, and cerebral cortex showed the lowest densities, representing 5% to 20% of that measured in caudate—putamen. It is however noteworthy that most studies on the brain distribution of D2 receptors have used radioligands, which not only have high affinity for the D2 but also for the D3 receptors. For example, [123I]epidepride and [3H]spiperone both have picomolar affinities for both receptor subtypes (Sokoloff et al, 1990; Vile et al, 1995), suggesting that autoradiography data obtained with these radioligands actually reflect the mixed distribution of both D2 and D3-receptor subtypes in brain. One striking observation of our study was the conspicuously high level of [11C]-(+)-PHNO binding in GP, a region that does not stand out as having a particularly high D2-receptor density in vitro and that has been scarcely studied using PET or SPECT. Radioligands such as [11C]raclopride and [123I]IBZM, which display nanomolar affinity for the D2/3 receptors, may not have a sufficiently high affinity to detect the relatively modest D2-receptor concentrations in GP. Most studies using radioligands such as [11C]FLB457, [18F]Fallypride, or [123I]epidepride, which display picomolar affinities for both the D2 and D3 receptors, have enabled the identification of regions with low density of D2 receptors such as amygdala, neocortex, and thalamus (Farde et al, 1997; Fujita et al, 1999; Mukherjee et al, 2002) but did not report on the visualization of GP in vivo. Only one PET study, using [11C]FLB457 in human, clearly identified GP as a region with high D2/3 binding, with a binding only slightly less than that measured in caudate—putamen (Okubo et al, 1999).
Several lines of evidence suggest that the idiosyncratic binding of [11C]-(+)-PHNO in GP may correspond to D3 receptors. First, in vitro competition studies have shown that D2-like receptors expressed in human membranes of the GP have high affinity for DA and are all guanine-nucleotide-insensitive (De Keyser et al, 1989). This finding suggests that these receptors actually correspond to D3- rather than to D2high receptors, as those two properties are characteristic of the D3 receptor (Sokoloff et al, 1990). Second, in vitro studies using immunocytochemistry and D3 antiserum as well as autoradiography studies using D3-preferring compounds such as [3H]PD 128907 and [3H]7-OH-DPAT have shown that this particular DA receptor subtype shows dense labeling in nucleus accumbens, ventral putamen, and in the Islands of Calleja; intermediate labeling in GP; and minimal labeling in dorsal striatum (Gurevich and Joyce, 1999; Hall et al, 1996; Murray et al, 1994). It thus appears that while the anatomic distributions of D3 and D2 receptors largely overlap in the basal ganglia, their quantitative ratios (i.e., D3/D2 ratios) differ between structures, being highest in nucleus accumbens, ventral putamen, Islands of Calleja and GP, and lowest in dorsal striatum (Gurevich and Joyce, 1999; Murray et al, 1994). As a consequence, the use of D2/3 radioligands with a preferential affinity for either one or the other of these two receptor subtypes may reveal subtle differences in the patterns of D2-like receptor distribution in basal ganglia, with D3-preferring ligands showing preferential binding in GP and VST and D2-preferring ligands showing preferential binding in dorsal striatum. Current evidences show that, in addition to being a potent D2-receptors agonist, (+)-PHNO binds with high affinity to the human cloned D3 receptor and shows a 30 to 50-fold higher selectivity for the D3 over the D2 subtype (Freedman et al, 1994; van Vliet et al, 2000), a finding concordant with the dense [3H]-(+)-PHNO labeling of the Islands of Calleja in vitro (Nobrega and Seeman, 1994). Recent data have demonstrated that (+)-PHNO has a five-fold higher affinity for the cloned human D3 over the D2high and a 61-fold higher affinity for the D2high over the D2low (Kis of 0.02, 0.10, and 6.10 nmol/L at the D3, D2high, and D2low, respectively; Abbot International; personal communication). Based on these in vitro data, it is thus possible that in vivo [11C]-(+)-PHNO binding reflects two components of specific binding in vivo, namely a D2 and a D3 component. Our kinetic analysis showed that the dissociation rate constant (i.e., k4) for [11C]-(+)-PHNO was substantially lower in GP when compared with that obtained in caudate—putamen, a result that is consonant with the presence of two populations of specific binding sites exhibiting different affinities toward the radioligand in these different subregions of the basal ganglia. Based on all the aforementioned in vitro and in vivo data, we propose that a significant proportion of [11C]-(+)-PHNO binding in GP corresponds to D3 receptors while binding in dorsal striatum corresponds almost exclusively to D2 receptors. Since D2- and D3 receptors are both expressed to high levels in VST, it is likely that [11C]-(+)-PHNO binding in this structure represents binding to mixed populations of D2 and D3 receptors. This proposition deserves further comment. Indeed if [11C]-(+)-PHNO binds to two populations of receptor subtypes with different affinities, this implies that the rank order of regional [11C]-(+)-PHNO BPs does not necessarily correlate with the total number of both receptor subtypes between brain regions as BP is both related to Bmax and to the radioligand affinity (i.e., 1/KD). The consequence of such a heterogeneity of binding to D2- and D3 receptors have thus to be considered when conclusions from [11C]-(+)-PHNO studies are drawn. Definitive establishment of the D2/3 contributions to [11C]-(+)-PHNO binding will require the development of highly selective D2 or D3 compounds.
In addition to using methods based on the use of an arterial input function, two simplified methods, the SRTM and the Logan noninvasive approach, based on the use of cerebellum as a reference, were used to calculate [11C]-(+)-PHNO BPs in brain. With no exception, all estimates of BP correlated with each other. However, quantitative differences were observed between methods, with the BPs estimated from the direct kinetic Method D being statistically higher than those estimated with the other methods (i.e., indirect kinetic Method D, SRTM, Logan invasive and noninvasive approaches). One probable explanation for this difference is the presence of a kinetically distinguishable second compartment in cerebellum. Simulations showed that such a second tissue compartment in cerebellum, whether it is specific or nonspecific, will induce an underestimation of true BP values by the SRTM, which will be around 10% in regions such as putamen and around 13% in regions such as GP. This latter result is consistent with simulation studies (Millet et al, 2002) showing that the presence of a second compartment in the reference region leads to an underestimation of true BP values with the SRTM and that this underestimation is higher in brain regions with higher BPs. Our data however indicate that the biases introduced by the presence of a second compartment in cerebellum is acceptable as they are within the experimental error of about 10% to 13% demonstrated by a pilot test re-test analysis of [11C]-(+)-PHNO BP in healthy volunteers (Willeit et al, 2006).
Comparison of BPs obtained with the SRTM and with the direct kinetic Method D yielded a high coefficient of correlation (r = 0.98). The SRTM also gave a inter-individual variability in BP estimates (19% ± 5%) similar to that obtained with the direct kinetic Method D. Based on these observations and since the SRTM do not required arterial sampling, we conclude that the SRTM is the best method for BP analysis of DA D2/3 receptors using [11C]-(+)-PHNO. Moreover, our data showed that no longer than 80 mins of data acquisition are required to derive stable BPSRTM estimates in all regions, a scan duration compatible with the half-life of carbon-11.
Two of the six subjects included in the present study reported slight nausea within a few minutes after radiotracer injection; nausea lasted for approximately 2 to 3 mins and then resolved spontaneously. The occurrence of such a side effect has already been reported after injection of [11C]-(+)-PHNO in humans (Willeit et al, 2006). These two subjects (1 male and 1 female) were injected with a mass of (+)-PHNO (1.73 and 1.89 μg), which was well within the range of that injected in the four other subjects (range: 1.10 to 1.99 μg). This was true even when the mass of (+)-PHNO injected was normalized to the subject's body weight as 30 and 26 ng/kg of (+)-PHNO was injected in the two subjects who experienced nausea, while 15 to 32 ng/kg of (+)-PHNO was injected in the four subjects who did. Moreover, there was no detectable difference in BPSRTM and DVT values in any brain regions between subjects who experienced nausea and those who did not. Although no definitive conclusion can be drawn from the limited number of subjects included in this study, it however seems that the occurrence of nausea after [11C]-(+)-PHNO injection was not related to the mass of compound injected and that it did not relate to detectable differences in BPSRTM and DVT.
In summary, [11C]-(+)-PHNO can be used to quantify D2-like receptor density in the human brain. The distribution of radiotracer accumulation is consistent with the known distribution of both D2- and D3 receptors in brain and suggests that, in contrast to what is observed with current D2/3 PET and SPECT radioligands, [11C]-(+)-PHNO binds to D3 receptors to a significant extent in vivo. A 2CM, four parameters configuration was found to provide significantly better fits to the data than a 1CM in all regions. However, estimates of the ratio k3/k4 from the 2CM configuration were too highly variable to be used as reliable measures of binding density. In contrast, estimates of DVT were very stable and provided reliable indexes of D2/3 receptor density. A 2CM, three parameters configuration did provide reliable estimates of both BP and DVT. Thus, calculation of BP from a 2CM (3 parameters) or an estimation of DVT from a 2CM, four parameters is the two alternatives for estimating D2-like densities using [11C]-(+)-PHNO. Because there was no strong support for specific binding in the cerebellum, simplified quantitative methods, using cerebellum as a reference, were evaluated. The SRTM and the Logan noninvasive approach gave BP values that were slightly lower but highly correlated with those obtained using the kinetic approaches. The SRTM was chosen as the most suitable simplified method of analysis because it gave the lowest underestimation of kinetic BP values and lowest interindividual variability in BPs.
In conclusion, the suitability of [11C]-(+)-PHNO for quantitative examination of D2/3 receptors in vivo using PET is thus supported by the observations that tissue data can be described using a kinetic analysis and that simplified quantitative methods, using the cerebellum as a reference region, provide meaningful indexes of D2-like binding parameters.
Footnotes
Acknowledgements
The authors thank Doug Hussey, Irina Vitcu, Armando Garcia, Winston Stableford, Alvina Ng, Anna Carella, Terry Bell, and Ted Harris-Brandts for their excellent technical assistance. The authors also wish to thank Siemens Medical Imaging for their continued support of the CPS-HRRT system. SK was supported by a CRC Chair in Schizophrenia and Therapeutic Neuroscience. The authors also wish to thank Dr Philippe Millet from the University Hospitals of Geneva for fruitful discussions during the preparation of this manuscript.