
Abstract
The contributions of calpain and caspase-3 to apoptosis and necrosis after central nervous system (CNS) trauma are relatively unexplored. No study has examined concurrent activation of calpain and caspase-3 in necrotic or apoptotic cell death after any CNS insult. Experiments used a model of oxygen–glucose deprivation (OGD) in primary septo-hippocampal cultures and assessed cell viability, occurrence of apoptotic and necrotic cell death phenotypes, and protease activation. Immunoblots using an antibody detecting calpain and caspase-3 proteolysis of α-spectrin showed greater accumulation of calpain-mediated breakdown products (BDPs) compared with caspase-3–mediated BDPs. Administration of calpain and caspase-3 inhibitors confirmed that activation of these proteases contributed to cell death, as inferred by lactate dehydrogenase release. Oxygen–glucose deprivation resulted in expression of apoptotic and necrotic cell death phenotypes, especially in neurons. Immunocytochemical studies of calpain and caspase-3 activation in apoptotic cells indicated that these proteases are almost always concurrently activated during apoptosis. These data demonstrate that calpain and caspase-3 activation is associated with expression of apoptotic cell death phenotypes after OGD, and that calpain activation, in combination with caspase-3 activation, could contribute to the expression of apoptotic cell death by assisting in the degradation of important cellular proteins.
Increased activation of calpain and caspase-3 occurs in many central nervous system (CNS) injuries and diseases. Caspase-3 is considered a key executioner in the apoptotic cell death cascade and shares numerous substrates with the Ca2+ -dependent protease calpain, including the cytoskeletal protein α-spectrin (Wang, 2000). Studies examining animal models of ischemia have reported increased calpain (Bartus et al., 1995; Roberts-Lewis et al., 1994; Yokota et al., 1995; Rami et al., 2000) or caspase-3 (Chen et al., 1998; Namura et al., 1998) activation after injury. Furthermore, inhibition of calpain (Hong et al., 1994; Markgraf et al., 1998) or caspase-3 (Fink et al., 1998; Himi et al., 1998) reduced infarct volume, substrate proteolysis, DNA fragmentation, and hippocampal cell death after focal and global ischemia. Activation of these proteases also has been observed in animal models of traumatic brain injury (TBI) (Newcomb et al., 1997; Pike et al., 1998a; Saatman et al., 1996; Yakovlev et al., 1997; Clark et al., 2000; Beer et al., 2000; Buki et al., 2000). Inhibition of calpain (Postmantur et al., 1997) or caspase-3 (Yakovlev et al., 1997) is protective in these models, although conflicting data has been reported (Clark et al., 2000; Saatman et al., 2000). However, few investigations have examined concurrent activation of calpain and caspase-3 after CNS injury or disease (Buki et al., 2000; Nath et al., 1998; Pike et al., 1998a).
Although apoptosis and necrosis occur after ischemia (Linnik et al., 1993) and TBI (Colicos and Dash, 1996; Newcomb et al., 1999; Rink et al., 1995), the relation between protease activation and the expression of apoptotic and necrotic cell death phenotypes is relatively unexplored. Traditionally, calpain activation has been associated with necrosis, and caspase-3 activation with apoptosis. Although caspase-3 activation has not been detected in models of necrosis (Wang et al., 1996; Zhao et al., 1999), calpain activation has been implicated in various models of apoptosis (Nath et al., 1996; Pike et al., 1998b; Squier et al., 1994; Vanags et al., 1996). However, inconsistencies in criteria associated with cell death phenotypes have complicated data interpretation (Charriaut-Marlangue and Ben-Ari, 1995).
Oxygen–glucose deprivation (OGD) is a widely used in vitro model of ischemia, which produces apoptotic (Kalda et al., 1998) and necrotic (Gwag et al., 1995; Goldberg and Choi, 1993) cell death phenotypes and increased calpain and caspase-3 activity (Nath et al., 1998). Currently, no study has investigated the concurrent activation of calpain and caspase-3 in archetypal necrotic and apoptotic cell death phenotypes after any CNS insult. The current study sought to determine the contributions of these proteases to apoptotic and necrotic cell death after OGD. The current findings demonstrate that coactivation of calpain and caspase-3 is usually associated with the expression of apoptotic cell death phenotypes after OGD.
MATERIALS AND METHODS
Primary septo-hippocampal cultures
Septi and hippocampi were dissected from 18-day-old rat fetuses, dissociated by trituration, and the dissociated cells were plated on poly- l -lysine coated 24-well culture plates, 6-well culture plates or 12-mm German Glass (Erie Scientific, Portsmouth, NH, U.S.A.) at a density of 4.36 × 10⁵ cells/mL. Cultures were maintained in Delbecco's modified Eagle's medium (DMEM) with 10% fetal bovine serum in a humidified incubator in an atmosphere of 5% CO2 at 37°C. After 5 days in culture, the media was changed to DMEM with 5% horse serum. Subsequent media changes were performed three times a week. Experiments were performed on days 10 to 11 in vitro when astroglia had formed a confluent monolayer beneath morphologically mature neurons. All animal studies conformed to the guidelines outlined in Guide for the Care and Use of Laboratory Animals from the National Institutes of Health and were approved by the University of Florida and the University of Texas-Houston Health Science Center Animal Welfare Committee.
Oxygen–glucose deprivation
To achieve oxygen–glucose deprivation (OGD), a technique similar to that described by Copin et al. (1998) was used. Normal media was replaced with low glucose media (Hank's balanced salt solution containing 1.8 mmol/L Ca2+, 0.8 mmol/L Mg2+, and 0.2 g/L d-glucose) and culture plates were placed in an airtight chamber (Billups-Rothenberg, Del Mar, CA, U.S.A.). The chamber was flushed with 95% N2/5% CO2 for 3 minutes, sealed, and placed in a 37°C incubator for the appropriate duration. Initial experiments that manipulated the amount of time (1 to 10 minutes) the chamber was flushed with 95% N2/5% CO2 confirmed that 3 minutes of flushing combined with the low glucose media produced an environment severe enough to result in a consistent model of cell injury. After the insult, low glucose media was replaced with DMEM (serum-free) and cultures were returned to a normoxic environment. Initial experiments deprived cells of oxygen and glucose for various durations (1 to 12 hours) and samples were collected 24 hours after the cultures had returned to a normal environment. These data suggested that 10 hours of OGD resulted in substantial cell death and protease activation. To examine the effects of altering the length of reperfusion (that is, duration of normoxia after OGD) samples were collected at various times (immediately through 48 hours) after 10 hours of OGD. Subsequent experiments focused on 10 hours of OGD combined with 24 hours of reperfusion, unless stated otherwise.
Chemical inducers of apoptotic or necrotic cell death phenotypes
To provide comparisons of OGD with classic apoptotic and necrotic profiles, cultures were treated with staurosporine, a general protein kinase inhibitor, or maitotoxin, a potent marine toxin that activates both voltage-sensitive and receptor-operated calcium channels (Wang et al., 1996). Cultures were challenged with 0.5 μmol/L staurosporine for 24 hours, a dose and duration that produces apoptotic but not necrotic neuronal cell death in this in vitro system (Pike et al., 1998b). Separate cultures were treated with maitotoxin (0.1 nmol/L) for 1 hour, a dose and duration that produces an exclusively necrotic cell death profile in neurons and glia and is associated with calpain, but not caspase-3 activation (Zhao et al., 1999).
Pharmacologic inhibition of calpain and caspase activation
Cultures were pretreated 1 hour before and were cotreated during OGD, with various doses of calpain inhibitor-3 (CI-3, [MDL28170], 1 to 300 μmol/L; CalBiochem, San Diego, CA, U.S.A.), the pan-caspase inhibitor (Z-D-DCB, 50 to 200 μmol/L; Bachem, Philadelphia, PA, U.S.A.) or the specific caspase-3 inhibitor (z-DEVD-fmk, 50 to 200 μmol/L; CalBiochem). Stock solutions (50 mmol/L) of CI-3 (in dimethyl sulfoxide), Z-D-DCB (in EtOH), and z-DEVD-fmk (in dimethyl sulfoxide) were added directly to the low glucose media for the 1-hour pretreatment, and then cells were deprived of oxygen. Initial experiments confirmed that incubating cells with low glucose media for 1 hour had no effect on control cells or injury magnitude in cells later exposed to OGD (data not shown). After OGD, low glucose media was replaced with DMEM (serum-free) containing fresh inhibitor. Samples were collected 12 or 24 hours after OGD for lactate dehydrogenase (LDH) release and immunoblot analyses. Western blot analyses confirmed whether the drugs and doses used inhibited activation of calpain and caspase-3–like proteases inferred by α-spectrin proteolysis.
Determination of lactate dehydrogenase activity
Lactate dehydrogenase activity assessed cell viability (Koh and Choi, 1987) in experiments examining the effects of OGD and protease inhibition. Lactate dehydrogenase released from damaged cells was measured by standard kinetic assay for pyruvate (Hoffmann-LaRoche Ltd., Basel, Switzerland). Briefly, culture medium was removed from each well and centrifuged at 5,000 g for 5 minutes. One hundred microliters of supernatant was transferred to each well of 96-well flat bottom plate and 100 μL of detection reagent was added. After incubation, the absorbance of samples was measured at 490 nm using Bio-Rad model 450 microplate reader (Hercules, CA, U.S.A.).
Annexin V and propidium iodide staining
Control cells and cells exposed to OGD, staurosporine, or maitotoxin were simultaneously stained with Annexin V and propidium iodide (PI) to differentiate apoptotic and necrotic cell death phenotypes. Cells were rinsed with phosphate-buffered saline (PBS) and incubated in staining solution consisting of HEPES buffer, Annexin V fluorescein labeling reagent (Molecular Probes; Eugene, OR, U.S.A.), and PI (Molecular Probes) for 15 minutes in the dark. Stained cells were examined with a Zeiss Axiovert 135 fluorescence microscope (Oberkochen, Germany) fitted with a filter combination that allowed green and red fluorescing cells to be seen simultaneously. The number of apoptotic and necrotic cells was calculated (10 sequential 320× fields were counted and averaged per well) for n = 3 wells per condition.
DNA gel electrophoresis
DNA gel electrophoresis was performed as previously described (Zhao et al., 2000; Gong et al., 1994). At the appropriate time after injury, cells were collected by centrifugation, fixed in 70% cold ethanol, and stored in fixative at −20°C for 24 to 72 hours. After subsequent centrifugation and removal of ethanol, cell pellets were resuspended in phosphate-citrate buffer at room temperature for 1 hour, centrifuged, and the supernatant was concentrated by vacuum in a SpeedVac concentrator (ThermoSavant, Holbrook, NY, U.S.A.). The pellet was incubated in Nonidet NP-40 and DNase-free RNase followed by proteinase K. After the incubation, 6× loading buffer was added and the contents of the tube were transferred to a 1.5% agarose gel. Electrophoresis was performed in 1× 0.1 mol/L Tris, 0.09 mol/L boric acid, 1 mmol/L EDTA, pH 8.4 at 40 V for 2 hours. DNA was visualized and photographed under UV light after staining with 5 μg/mL ethidium bromide.
DNA fragmentation ELISA
Apoptotic cell death also was examined with an assay that allowed specific determination of mono- and oligonucleosomes in the cytoplasmic fraction of cell lysates (Cell Death Detection ELISA Plus; Hoffman-LaRoche Ltd., Basel, Switzerland). At the appropriate time after injury, cells were collected by centrifugation and 2 mL lysis buffer was mixed with the pellet. The solution was incubated for 30 minutes at room temperature and stored at −20°C for 24 to 72 hours. After thawing, diluted samples (5 μL sample + 15 μL lysis buffer) were added to each well of a streptavidin-coated, 96-well microtiter plate (separate studies confirmed that this dilution resulted in a suitable cell concentration, data not shown). Eighty microliters of reagent solution containing incubation buffer, anti–histone-biotin, and anti–DNA-POD was added to each well and incubated with the sample on a shaker for 2 hours. The solution was removed and wells were rinsed with incubation buffer to remove unbound antibody. The amount of POD retained in the immunocomplex—and thus the amount of DNA fragments—was determined colorimetrically with the substrate ABTS using a microplate reader (Bio-Rad Model 450) at 405 nm with a reference filter of 490 nm. Absorbance values were calculated and reported as percent of control.
Assessment of caspase-3 and calpain activity
The cytoskeletal protein α-spectrin contains sequence motifs preferred by calpain and caspase-3 proteases; thus, activation of these proteases can be assessed concurrently by immunoblot identification of calpain and/or caspase-3 signature cleavage products. Although calpains and caspases produce initial fragments of nearly identical size (150 kDa), calpains further process α-spectrin into a distinctive breakdown product (BDP) of 145 kDa (Harris et al., 1988; Nath et al., 1996), whereas caspase-3 produces a unique 120-kDa BDP (Wang et al., 1998b). Notably, the initial 150-kDa fragment produced by calpain differs from that produced by the caspases. Immunocytochemistry using antibodies specific for this calpain-mediated fragment (SBDP 150) or the 120-kDa fragment produced by caspase-3 (SBDP 120) allows detection of calpain- and/or caspase-3–mediated proteolysis of α-spectrin in individual cells. Caspase-3 activation also can be inferred by the appearance of BDPs to the proenzyme, because activation occurs when caspase-3 is proteolyzed into smaller subunits.
Sodium dodecyl sulfate-polyacrylamide gel electrophoresis and immunoblotting.
Gel electrophoresis and immunoblotting were performed as described previously (Pike et al., 2000). At the appropriate time after injury, media was removed and cells were collected from each well with lysis buffer and sheared with a 25-gauge needle. Protein content was assayed by the Micro BCA method (Pierce, Rockford, IL, U.S.A.). For protein electrophoresis, equal amounts of total protein (25 μg) were prepared in 4× loading buffer and heated at 95°C for 10 minutes. For analysis of α-spectrin proteolysis, samples were resolved in a vertical electrophoresis chamber using a 4% stacking gel over a 6.5% acrylamide resolving gel. Separated proteins were laterally transferred to a nitrocellulose membrane (0.45 μm). For analysis of caspase-3 proteolysis, samples were resolved using a 4% to 20% gradient acrylamide gel or a Tris-Tricine gel (16.5% + 4% stacking). Separated proteins were laterally transferred to a nitrocellulose membrane (0.2 μm). Nitrocellulose membranes were stained with Panceau red (Sigma, St. Louis, MO, U.S.A.) to ensure even transfer of all samples to the membranes and to confirm that equal amounts of protein were loaded in each lane. Blots were blocked overnight in 5% nonfat milk in 20 mmol/L Tris, 0.15 mol/L NaCl, and 0.005% Tween-20 at 4°C.
Immunoblots were probed with an anti–α-spectrin monoclonal antibody (Affiniti Research Products, U.K.) that detects intact α-spectrin (MWr = 240 kDa) and 150-, 145-, and 120-kDa BDP, as described previously (Pike et al., 2000). Separate blots were probed with a caspase-3 polyclonal antibody (1:500; Santa Cruz Biotechnology, Santa Cruz, CA, U.S.A.) that detects the caspase-3 proenzyme (32 kDa) and proteolytic fragments. After incubation in primary antibody for 2 hours at room temperature, blots were incubated in peroxidase-conjugated goat anti-rabbit IgG (1:3000) for 1 hour. Enhanced chemiluminescence reagents (ECL; Amersham, Buckinghamshire, U.K.) were used to visualize immunolabeling on Hyperfilm (Hyperfilm ECL; Amersham).
Semiquantitative evaluation of protein levels detected by immunoblotting was performed through computer-assisted, one-dimensional densitometric scanning (AlphaImager 2000 Digital Imaging System; San Leandro, CA, U.S.A.). Data were acquired as integrated densitometric values and transformed to percentages of the densitometric values obtained from control samples. Data from multiple Western blots (n = 4) were combined and analyzed statistically.
Calpain- and caspase-3–mediated α-spectrin BDPs in individual cells.
Cells were cultured on German Glass for immunocytochemistry protocols. Control cultures or cells exposed to OGD, staurosporine, or maitotoxin were fixed in 4% paraformaldehyde for 5 minutes and rinsed in PBS. Cells were blocked in 10% normal goat serum in PBS for 30 minutes at 37°C and incubated simultaneously in primary antibodies specific for SBDP 150 (1:100, polyclonal, made in rabbit; gift from T.C. Saido, Japan, (Saido et al., 1993) and SBDP 120 (1:100, polyclonal, made in chicken; gift from Kevin Wang, Parke-Davis, Ann Arbor, MI (Buki et al., 2000)) for 30 minutes at 37°C. After rinsing in PBS/0.05% Tween 20, cells were incubated in secondary antibodies linked to Alexa Fluor 488 (1:50, goat α-chicken; Molecular Probes, Eugene, OR, U.S.A.) or Alexa Fluor 568 (1:50, goat α-rabbit; Molecular Probes) for 30 minutes at 37°C. To assess nuclear morphology (that is, characteristics of necrotic or apoptotic alterations) cells were counterstained with the DNA dye, 4′ 6-diamidino-2-phenylindole, dihydrochloride (DAPI, 1:500; Molecular Probes). German Glass were mounted onto glass slides with Fluoromount-G (Southern Biotechnology Associates; Birmingham, AL, U.S.A.).
Cells were examined under oil immersion at 1000× magnification with a Zeiss Axiovert 135 fluorescence microscope equipped as described above. DAPI staining was viewed with a UV2A filter (Zeiss). Nuclear morphology was assessed in cells immunoreactive for SBDP 150, or SBDP 120, or both, and cells were categorized (blind to treatment condition) as healthy, apoptotic, or necrotic. Nuclei of healthy cells can be identified by a homogenous and diffuse fluorescent chromatin, whereas cells classified as apoptotic fluoresce intensely and are characterized by highly condensed chromatin, visibly shrunken and often irregular shaped nuclei, margination of chromatin along the periphery of the nuclear envelope, or by the separation of the nucleus into discrete nuclear fragments (apoptotic bodies). In contrast, necrotic cells fluoresce brightly with pyknotic chromatin where nuclei have maintained their basic morphology or have become rounded or swollen in appearance. These cells also fail to exhibit apoptotic morphology (Schmechel, 1999; Purnanam and Boustany, 1999). Using these criteria, the number of healthy, apoptotic, and necrotic SBDP 150 and SBDP 120 immunoreactive cells were quantified in control and OGD cultures.
Analysis of cell types
Control cells or cells exposed to OGD were prepared for immunocytochemistry as described above. Cells were labeled with both neuronal nuclear marker (NeuN) and microtubule-associated protein (MAP)2 or GFAP (glial fibrillary acidic protein) to evaluate neuronal and astroglial morphology, respectively. Using both NeuN and MAP2 allowed clear visualization of the neuronal cell body and processes. All cells were blocked in 10% normal goat serum in PBS and were incubated in primary antibodies specific for NeuN (1:1000, monoclonal; Chemicon, Temecula, CA, U.S.A.) and MAP2 (1:1000, monoclonal; Sternberger Monoclonals, Lutherville, MD, U.S.A.) or GFAP (1:1000, monoclonal; Sigma). After rinsing in PBS/0.05% Tween 20, cells were incubated in secondary antibody linked to Alexa Fluor 488 (1:50, goat α-mouse; Molecular Probes). Cells were counterstained with DAPI and mounted onto glass slides with Fluoromount-G.
Samples immunolabeled with NeuN and MAP2 were examined under low magnification to assess neuronal loss after OGD (10 sequential 320× fields were counted and added per sample, n = 6). Samples immunolabeled with GFAP also were examined under low magnification, however quantitative data on loss of GFAP-positive cells could not be obtained because of the high density of these cells and the inability to differentiate individual glia. Under high magnification (1000×), DAPI staining was examined in NeuN- and/or MAP2-positive cells and GFAP-positive cells (50 random immunoreactive cells per sample) to assess the nuclear morphology of neurons and astroglia, respectively. Values for healthy, apoptotic, and necrotic neurons and astroglia were calculated for control and OGD cells using the criteria described above.
Statistical analysis
Data were evaluated by one-way analysis of variance and post hoc least significant difference t test. Values are given as mean ± SD. Differences were considered significant at P ≤ 0.05.
RESULTS
Effects of oxygen–glucose deprivation on primary mixed septo-hippocampal cultures
Effects of oxygen–glucose deprivation duration and reperfusion.
An initial set of experiments (data not shown) was conducted to evaluate duration of OGD on cell viability. Primary mixed septo-hippocampal cultures were deprived of oxygen and glucose for 1, 6, 8, 10, or 12 hours and media was collected 24 hours after cultures were returned to normal conditions for analysis of LDH release. Reported as percent of control, significant increases in LDH release (P < 0.01) occurred after 6 (204% ± 18.1%), 8 (233% ± 30.1%), 10 (895% ± 43.1%), and 12 (725% ± 70.5%) hours of OGD. Subsequent experiments (data not shown) investigated the effect of reperfusion length on cell viability. Samples were subjected to OGD for 10 hours and media were collected immediately or after 3, 12, 24, or 48 hours of reperfusion for analysis of LDH release. Significant increases in LDH release were evident immediately after injury (172% ± 15.2%, P < 0.05) compared with control cultures. Moreover, increasing the length of reperfusion resulted in a time-dependent and significant increase in LDH release (P < 0.001) at all later times tested—3 (367% ± 51.7%), 12 (561% ± 5.6%), 24 (674% ± 14.7%), and 48 (784% ± 5.6%) hours after injury, compared with control samples.
Characterization of cell death phenotypes after oxygen-glucose deprivation.
To distinguish apoptotic and necrotic cell death, control cells and cells subjected to OGD (10 hours + 24 hours of reperfusion) were stained with Annexin V and PI (data not shown). Staurosporine- (0.5 mmol/L for 24 hours) and maitotoxin- (0.1 nmol/L for 1 hour) treated cells were used as positive controls of apoptosis and necrosis, respectively. Values are reported as total apoptotic or necrotic cells per well (10, 320× fields). Uninjured control cultures contained few apoptotic (78.0 ± 40.0) or necrotic (8.3 ± 2.1) cells. Cultures subjected to OGD contained significantly (P < 0.001) more apoptotic (356.3 ± 32.0) and necrotic (180.7 ± 37.4) cells compared with control cultures. In comparison, staurosporine treatment produced a significant increase (P < 0.001) in apoptotic cells (389.3 ± 37.5) with fewer necrotic cells (38.3 ± 14.4), whereas maitotoxin treatment resulted in a significant increase (P < 0.001) in necrotic cells (597.0 ± 73.4) with fewer apoptotic cells (13.7 ± 3.8) compared with control cultures.
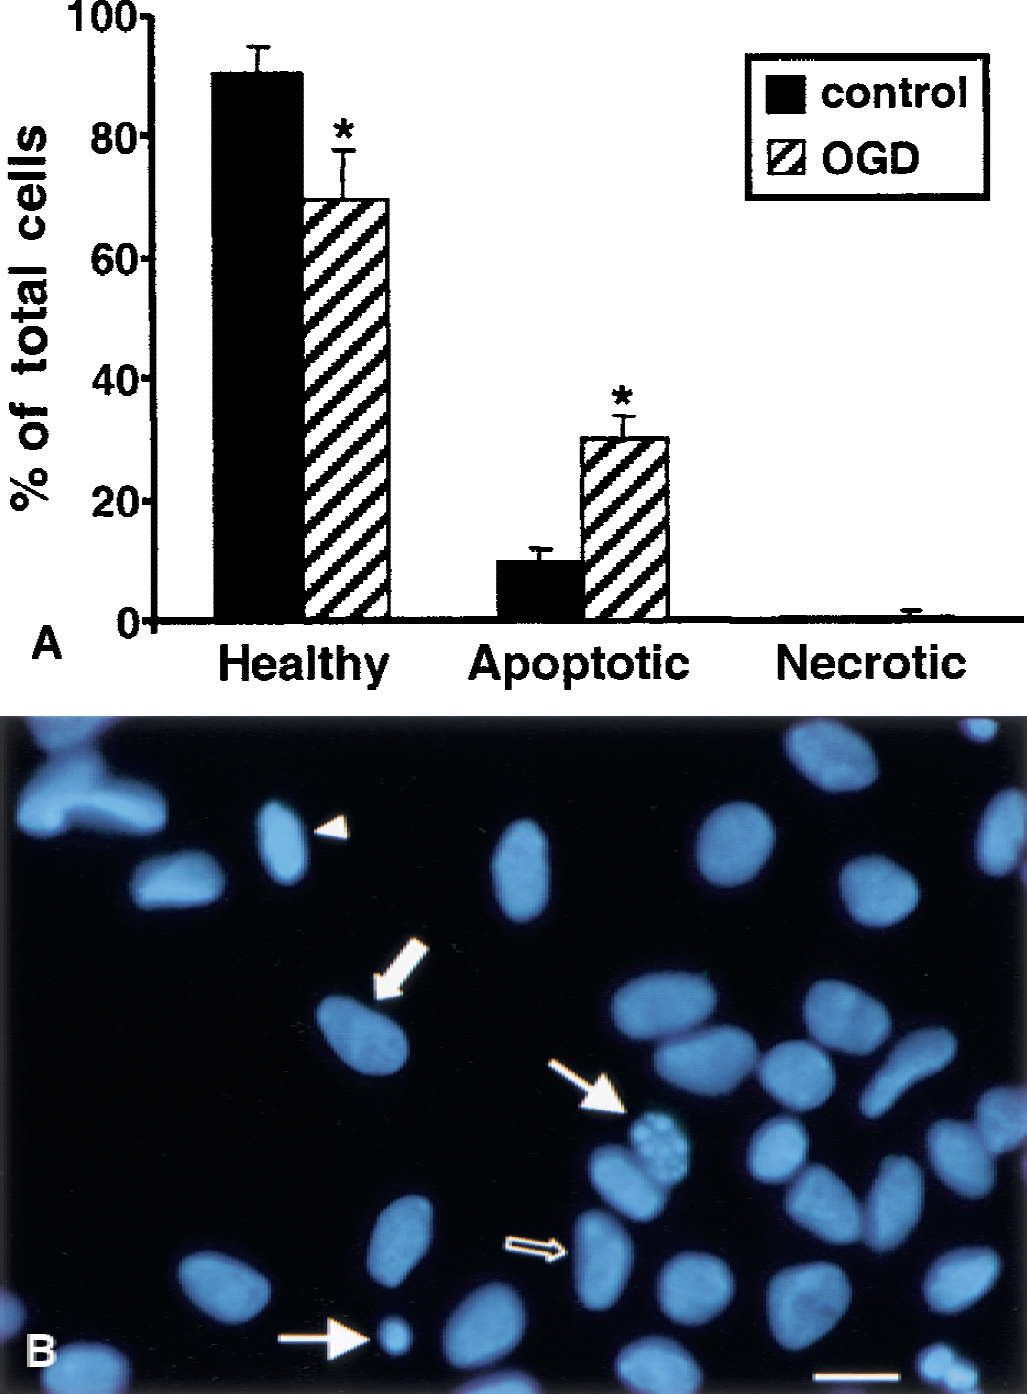
Examination of DAPI staining (10, 1000× fields) revealed morphologic changes in chromatin staining that were clearly distinguishable from the classic necrotic phenotype (Fig. 1A and 1B). These nonnecrotic changes showed different evolutionary stages of chromatin margination, condensation, and formation of apoptotic bodies. Thus, these nuclear profiles were termed apoptoticlike. Most stained nuclei in control cultures were healthy; however, some apoptoticlike nuclei were observed and were probably because of spontaneous apoptosis (Fig. 1A). Compared with control cultures, OGD cultures contained significantly less healthy nuclei (P < 0.001) and significantly more apoptoticlike nuclei (P < 0.001). Necrotic nuclei were rarely observed in either control or OGD cultures. Figure 1B shows a representation of the typical distribution of cell death phenotypes after OGD in this culture system. Nuclei exhibiting apoptoticlike morphology were frequently detected after OGD, as well as cells with healthy nuclei. Surprisingly, examination of DAPI staining in OGD cultures failed to reveal a substantial number of necrotic cells, in contrast with data collected with Annexin V and PI staining. This reduction in necrotic cells may be caused by the frequent rinses and incubations performed during the immunocytochemistry and DAPI staining protocol that may have caused many necrotic cells to detach and go undetected by DAPI in the culture system. However, quite similar data were obtained using these separate techniques to calculate the number of apoptoticlike cells per sample. If values are adjusted to reflect the different field magnifications (320× for Annexin and 1000× for DAPI), the average number of apoptoticlike cells per sample is similar for Annexin (356.3 cells per sample) and DAPI (332.8 cells per sample, data not shown). These data stress the reliability of the authors' assessments of the contribution of apoptosis to cell death in the culture system.
Analysis of nuclear morphology after oxygen–glucose deprivation (OGD).
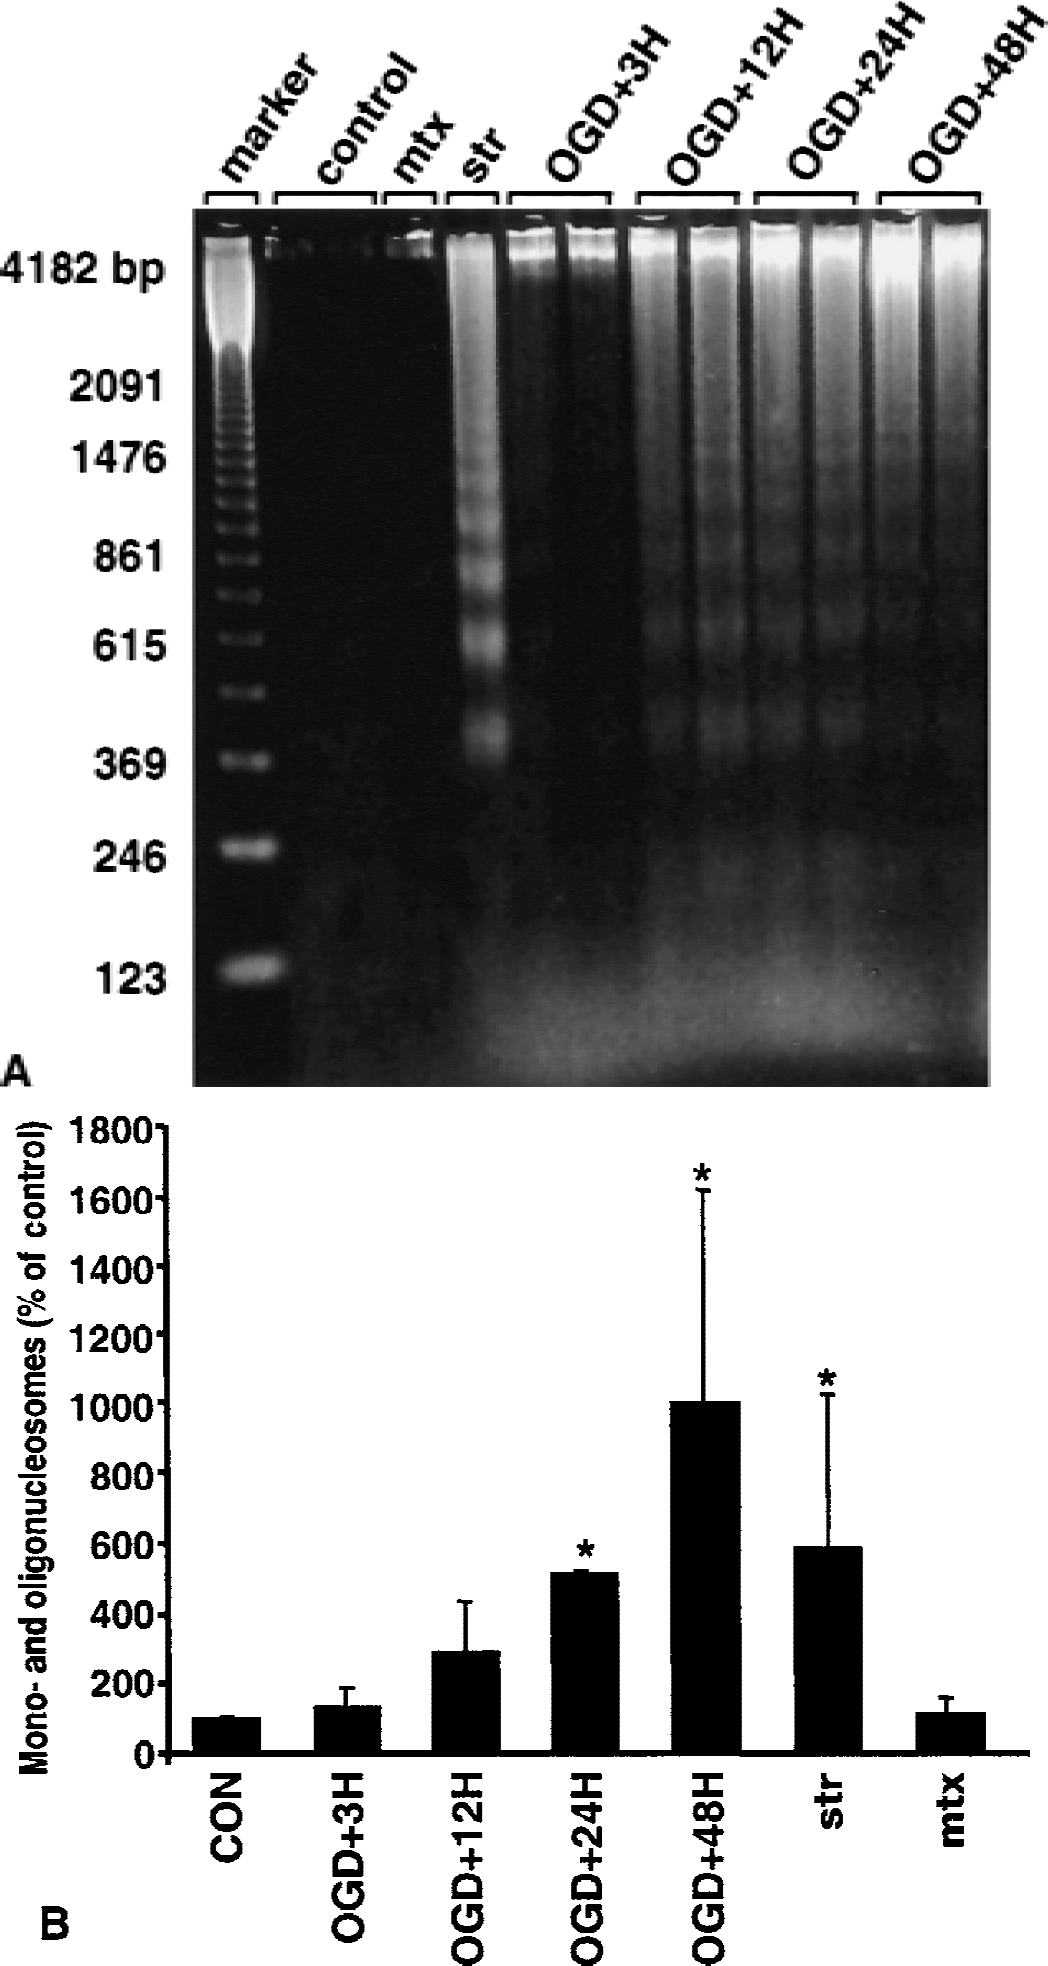
Condensation and aggregation of chromatin, as shown with DAPI staining (Fig. 1B), may occur independently of endonuclease activation (Oberhammer et al., 1993). Therefore, two separate techniques were used to qualitatively (Fig. 2A) and quantitatively (Fig. 2B) assess internucleosomal DNA fragmentation, and thus endonuclease activation, after OGD. DNA electrophoresis (Fig. 2A) revealed a robust ladder pattern, characteristic of internucleosomal DNA fragmentation, after 10 hours of OGD with 12, 24, and 48 hours of reperfusion. Faint bands also were detected after 3 hours of reperfusion. Staurosporine treatment produced a characteristic DNA ladder pattern, whereas control samples and cells subjected to maitotoxin failed to show any internucleosomal fragments.
Assessment of internucleosomal DNA fragmentation after oxygen–glucose deprivation (OGD).
As an additional indicator of internucleosomal fragmentation, the amount of mono- and oligonucleosomes in the cytoplasmic fraction of cell lysates was quantitatively assessed (Fig. 2B). Control cultures showed little DNA fragmentation, whereas cells deprived of oxygen and glucose for 10 hours contained significantly more mono- and oligonucleosomes after 24 (P < 0.001) and 48 (P < 0.001) hours of reperfusion, but not after 3 or 12 hours of reperfusion. In comparison, staurosporine treatment resulted in a significant increase (P < 0.001) in mono- and oligonucleosomes, whereas samples exposed to maitotoxin were not statistically different from control samples.
Induction of cell death by oxygen–glucose deprivation in neurons and glia.
To identify the type of cell (that is, neuron vs. astroglia) affected by OGD, primary mixed septo-hippocampal cultures were stained with NeuN and MAP2 (for neurons) or GFAP (for astroglial) and counterstained with DAPI (Fig. 3). Low magnification examination of NeuN and MAP2 staining in OGD cultures revealed a significant loss (68% ± 9.3% of control values, P < 0.001) of immunoreactive (IR) neurons (data not shown). Examination of GFAP staining in cells subjected to OGD showed that OGD had a modest effect on astroglia that was not readily apparent under low magnification.
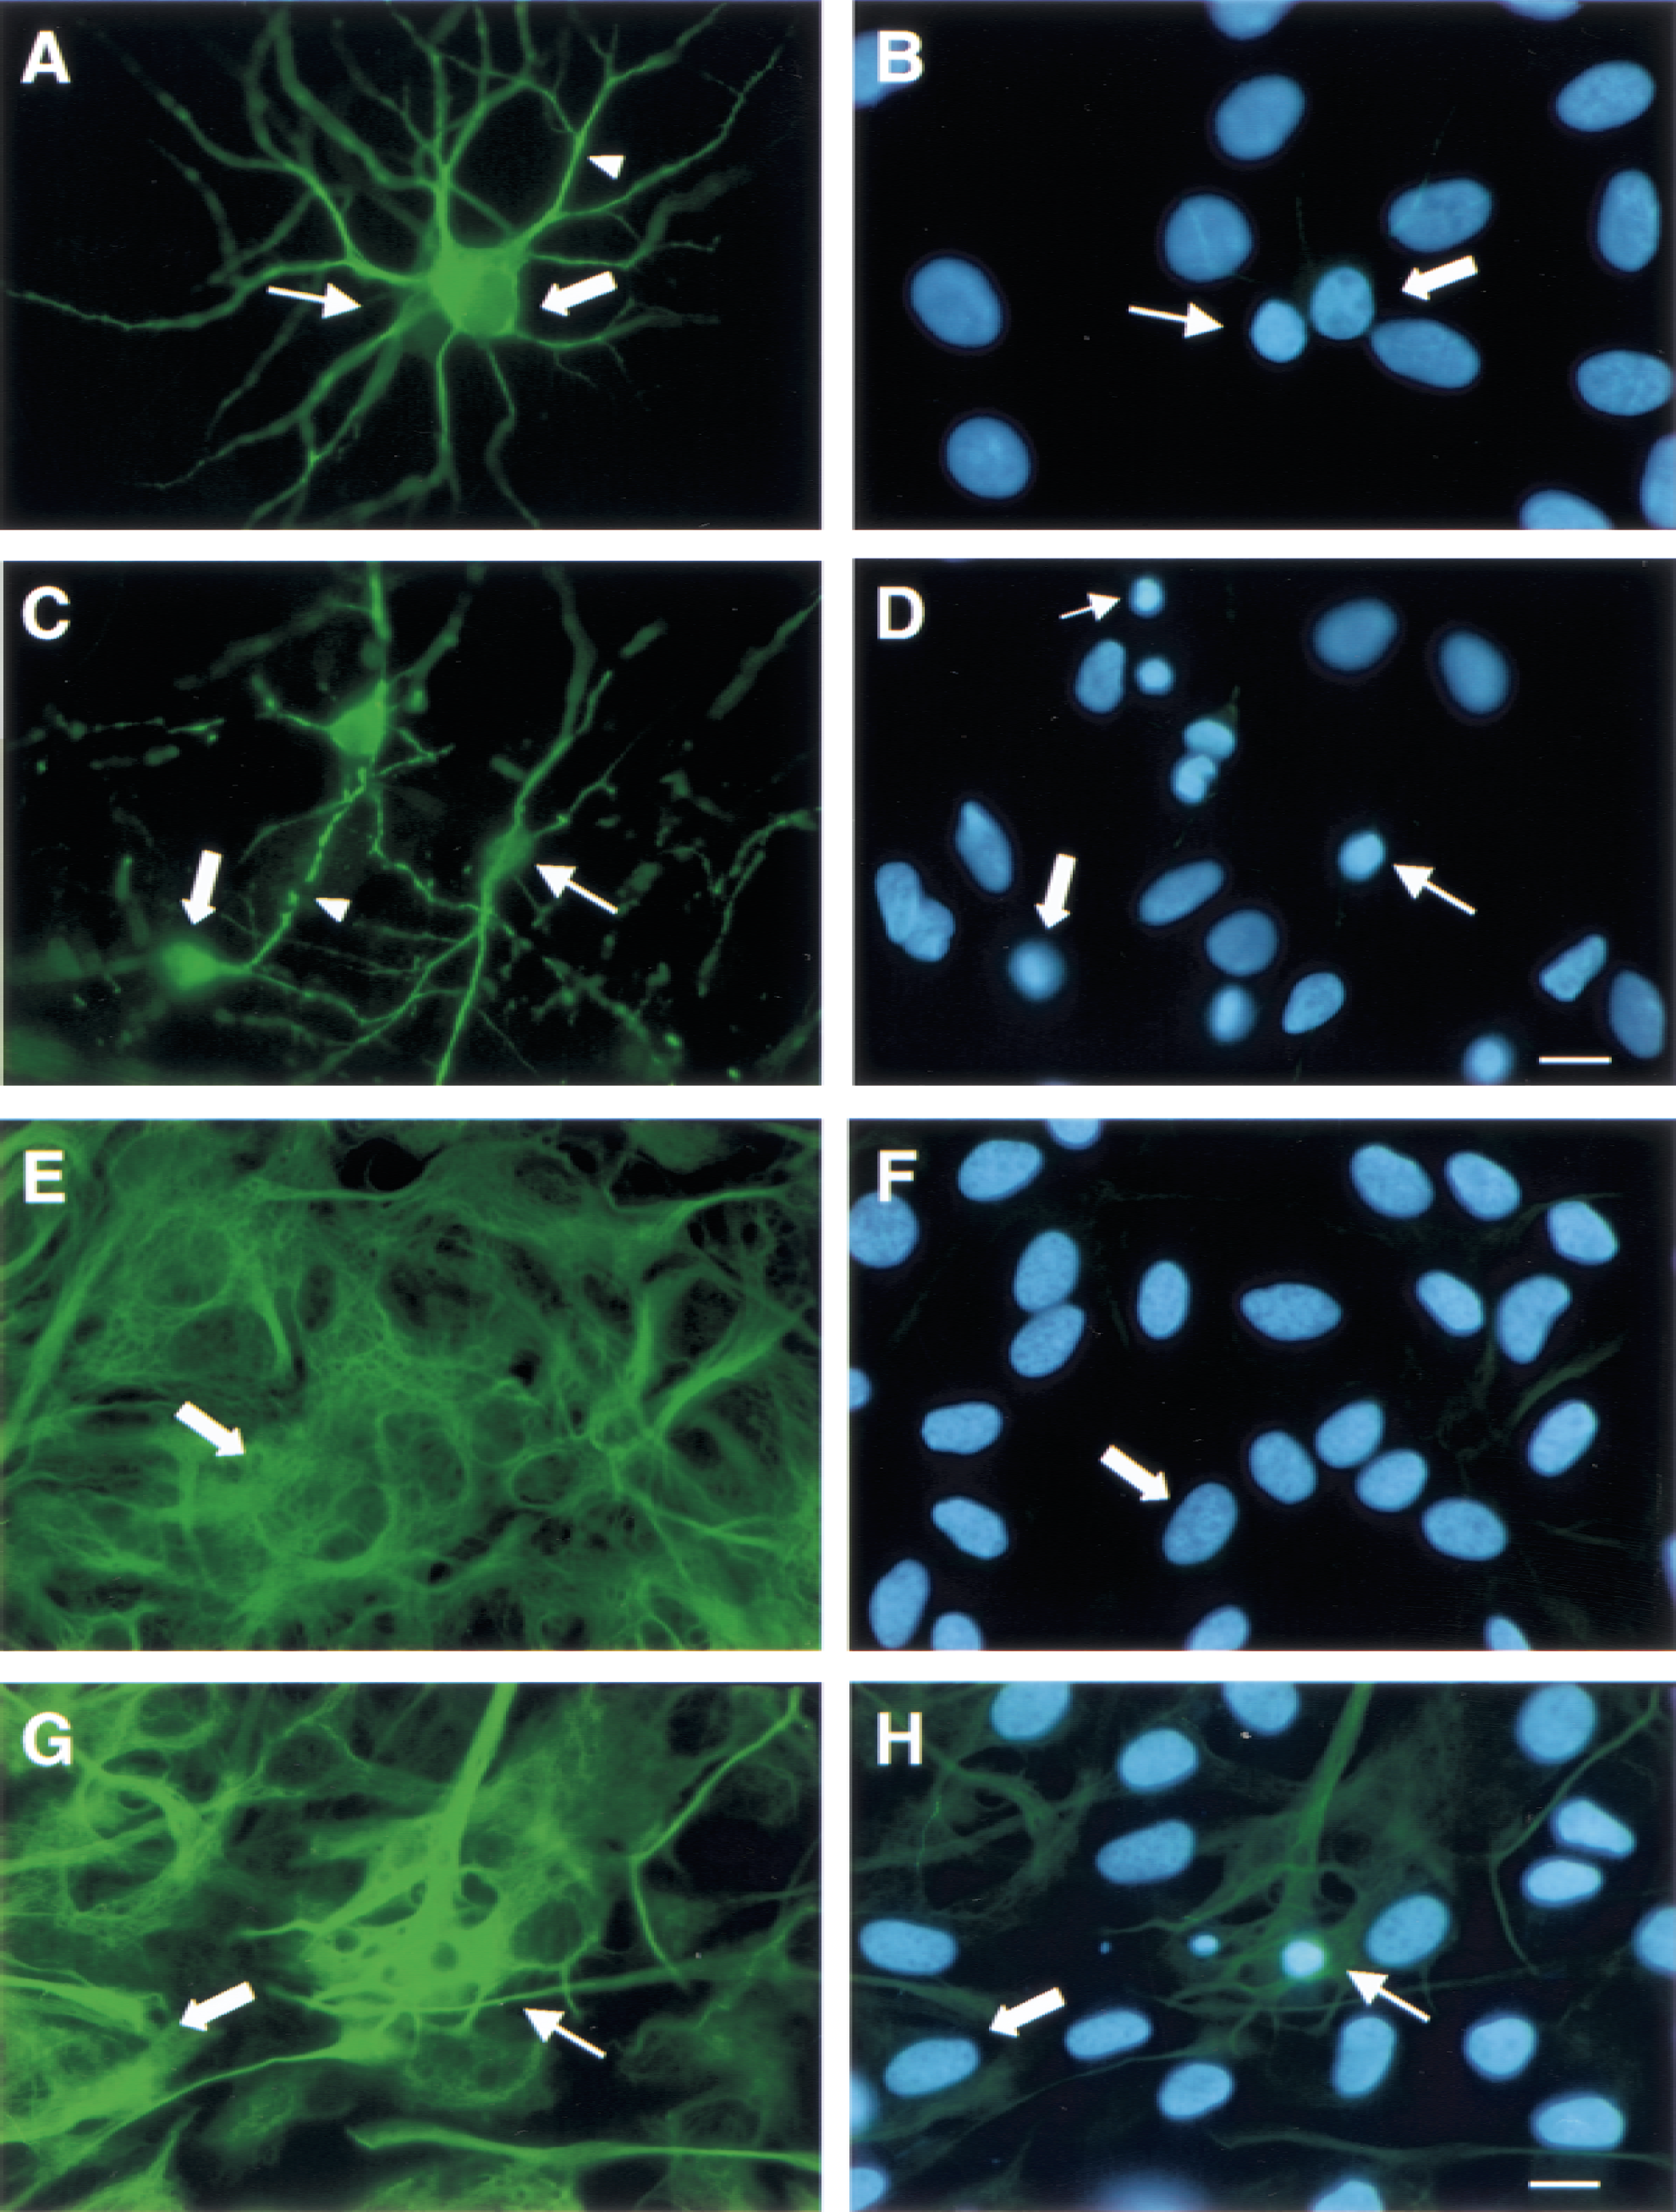
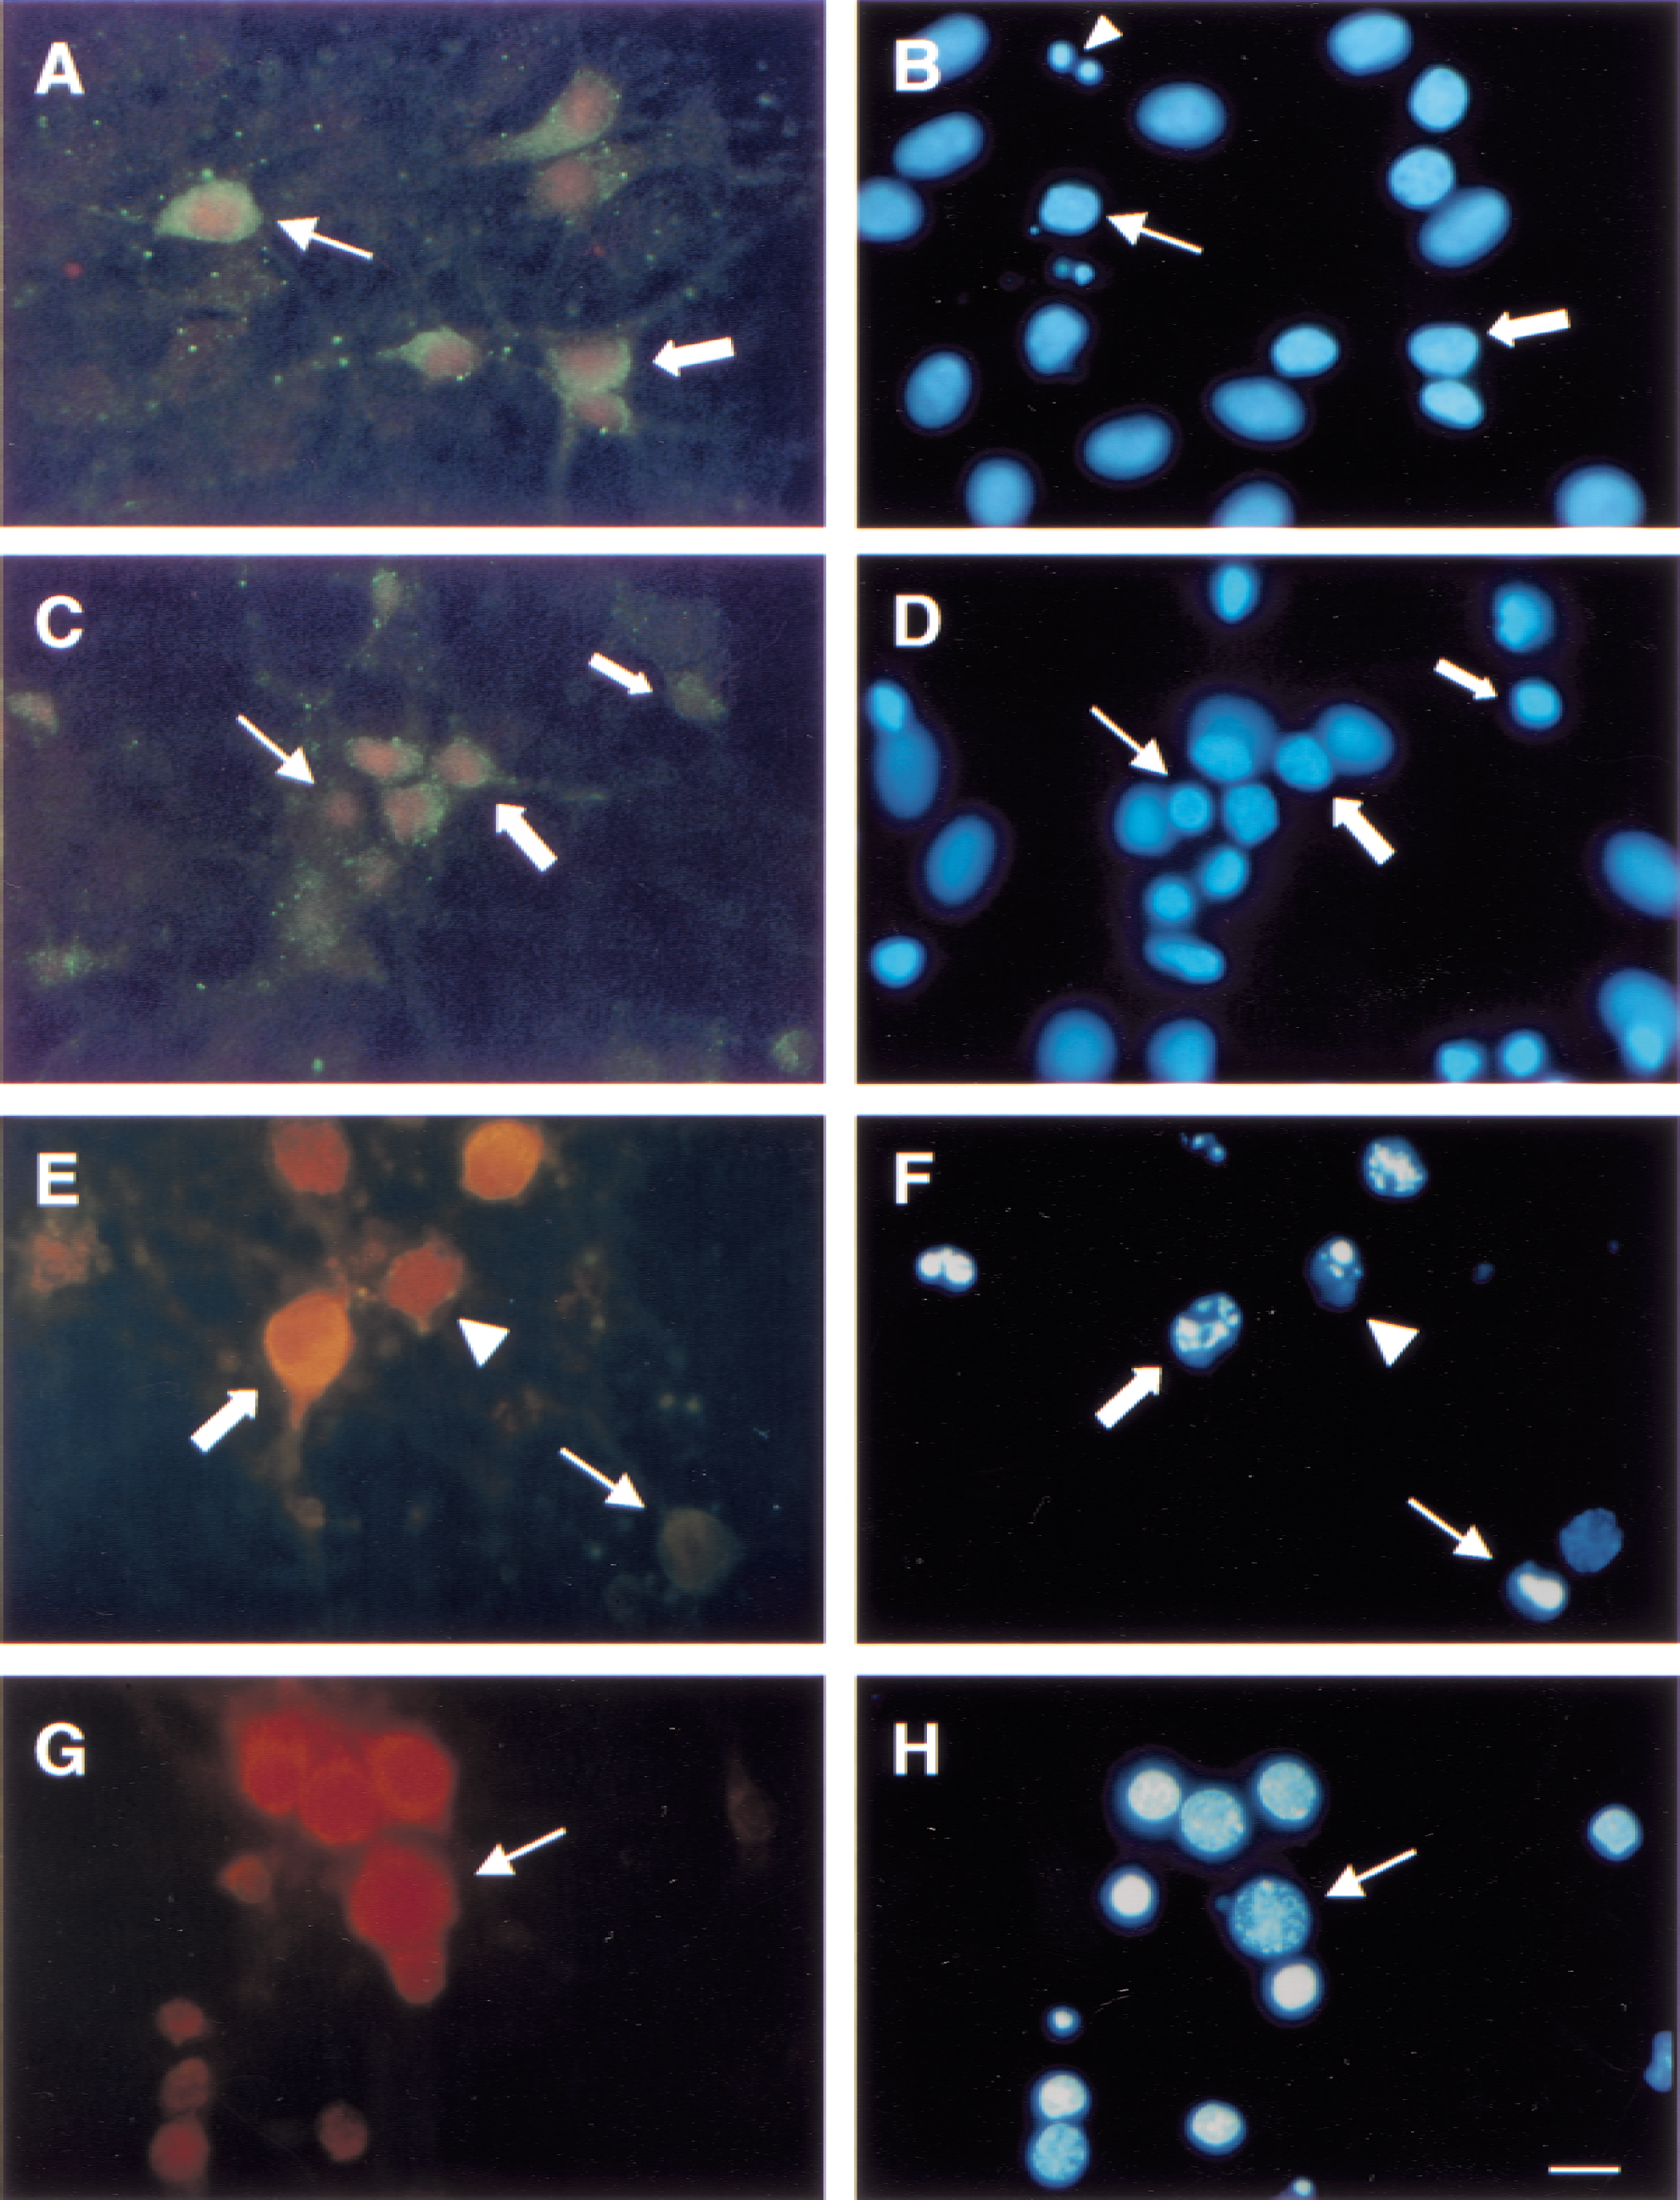
Neuronal and glial morphology after oxygen–glucose deprivation (OGD). Cultures were immunolabeled with NeuN and MAP2 or GFAP (glial fibrillary acidic protein) and were counterstained with DAPI to assess morphologic and nuclear changes after OGD (10 hours + 24 hours of reperfusion). Cells were examined under high magnification (1000×).
High magnification (1000×) examination of NeuN, or MAP2 IR cells, or both (Fig. 3), showed that the majority of positive cells in control cultures possessed large cell bodies and several intact processes that were intensely labeled for both neuronal markers (Fig. 3A). These cells contained healthy, oval-shaped nuclei with diffuse chromatin distribution (Fig. 3B). In contrast, NeuN and MAP2 staining of OGD cultures showed a substantial number of neurons with shrunken cell bodies and fragmented processes (Fig. 3C). Nuclei of these neurons were shrunken, irregularly shaped, and possessed highly condensed chromatin (Fig. 3D). Apoptoticlike nuclei that were not IR for NeuN or MAP2 also were observed (Fig. 3D). These cells may have been apoptotic astroglia, or more likely, neurons in an advanced stage of apoptosis in which the phenotype is most apparent and degeneration of cellular proteins may compromise the retention of epitopes necessary for cell type identification. Quantitative analysis of DAPI staining in NeuN, or MAP2 IR cells, or both (50 random IR cells per sample), demonstrated that the majority of positive cells in control cultures exhibited healthy nuclear morphology (83.3% ± 4.4%). Although cells with apoptoticlike nuclei (16.7% ± 1.8%) were occasionally observed, neurons with necrotic nuclei were not detected in this set of control cultures. Analysis of DAPI staining in OGD cultures revealed a significantly lower percentage of healthy nuclei (57.3% ± 9.3%, P < 0.001) and significantly higher percentage of apoptoticlike nuclei (40.3% ± 8.6%, P < 0.001), compared with control cultures. Although OGD cultures also contained more necrotic nuclei (2.3% ± 1.5%) than control cultures, necrotic cells were rarely observed.
Examination of GFAP staining in control and OGD cultures showed that most GFAP-positive cells were healthy astroglia with large cell bodies, extensive processes, and diffuse and even immunoreactivity (Fig. 3E and 3G, respectively). Astroglial nuclei were large and oval-shaped with even chromatin distribution (Fig. 3F and 3H). Although most IR cells in OGD cultures appeared healthy, cells with shrunken cell bodies, broken processes, and aggregated GFAP immunoreactivity also were observed (Fig. 3G).
These cells possessed shrunken nuclei with highly condensed chromatin and apoptotic bodies (Fig. 3H). Quantitative assessment of DAPI staining in GFAP IR cells (50 random IR cells per sample) showed that most GFAP-positive cells in control (98.3% ± 12.7%) and OGD (91.4% ± 27.2%) cultures possessed healthy nuclei. DAPI staining revealed some effects of OGD, including a decreased percentage of healthy nuclei and an increased percentage of apoptoticlike nuclei (8.4% ± 2.0%), compared with control cells (1.6% ± 1.5%), but these differences were not statistically significant. Necrotic nuclei were rarely observed in either control (0.2% ± 0.5%) or OGD (0.2% ± 0.5%) cultures.
Calpain and caspase-3 proteolysis of α-spectrin after oxygen–glucose deprivation
Western blots.
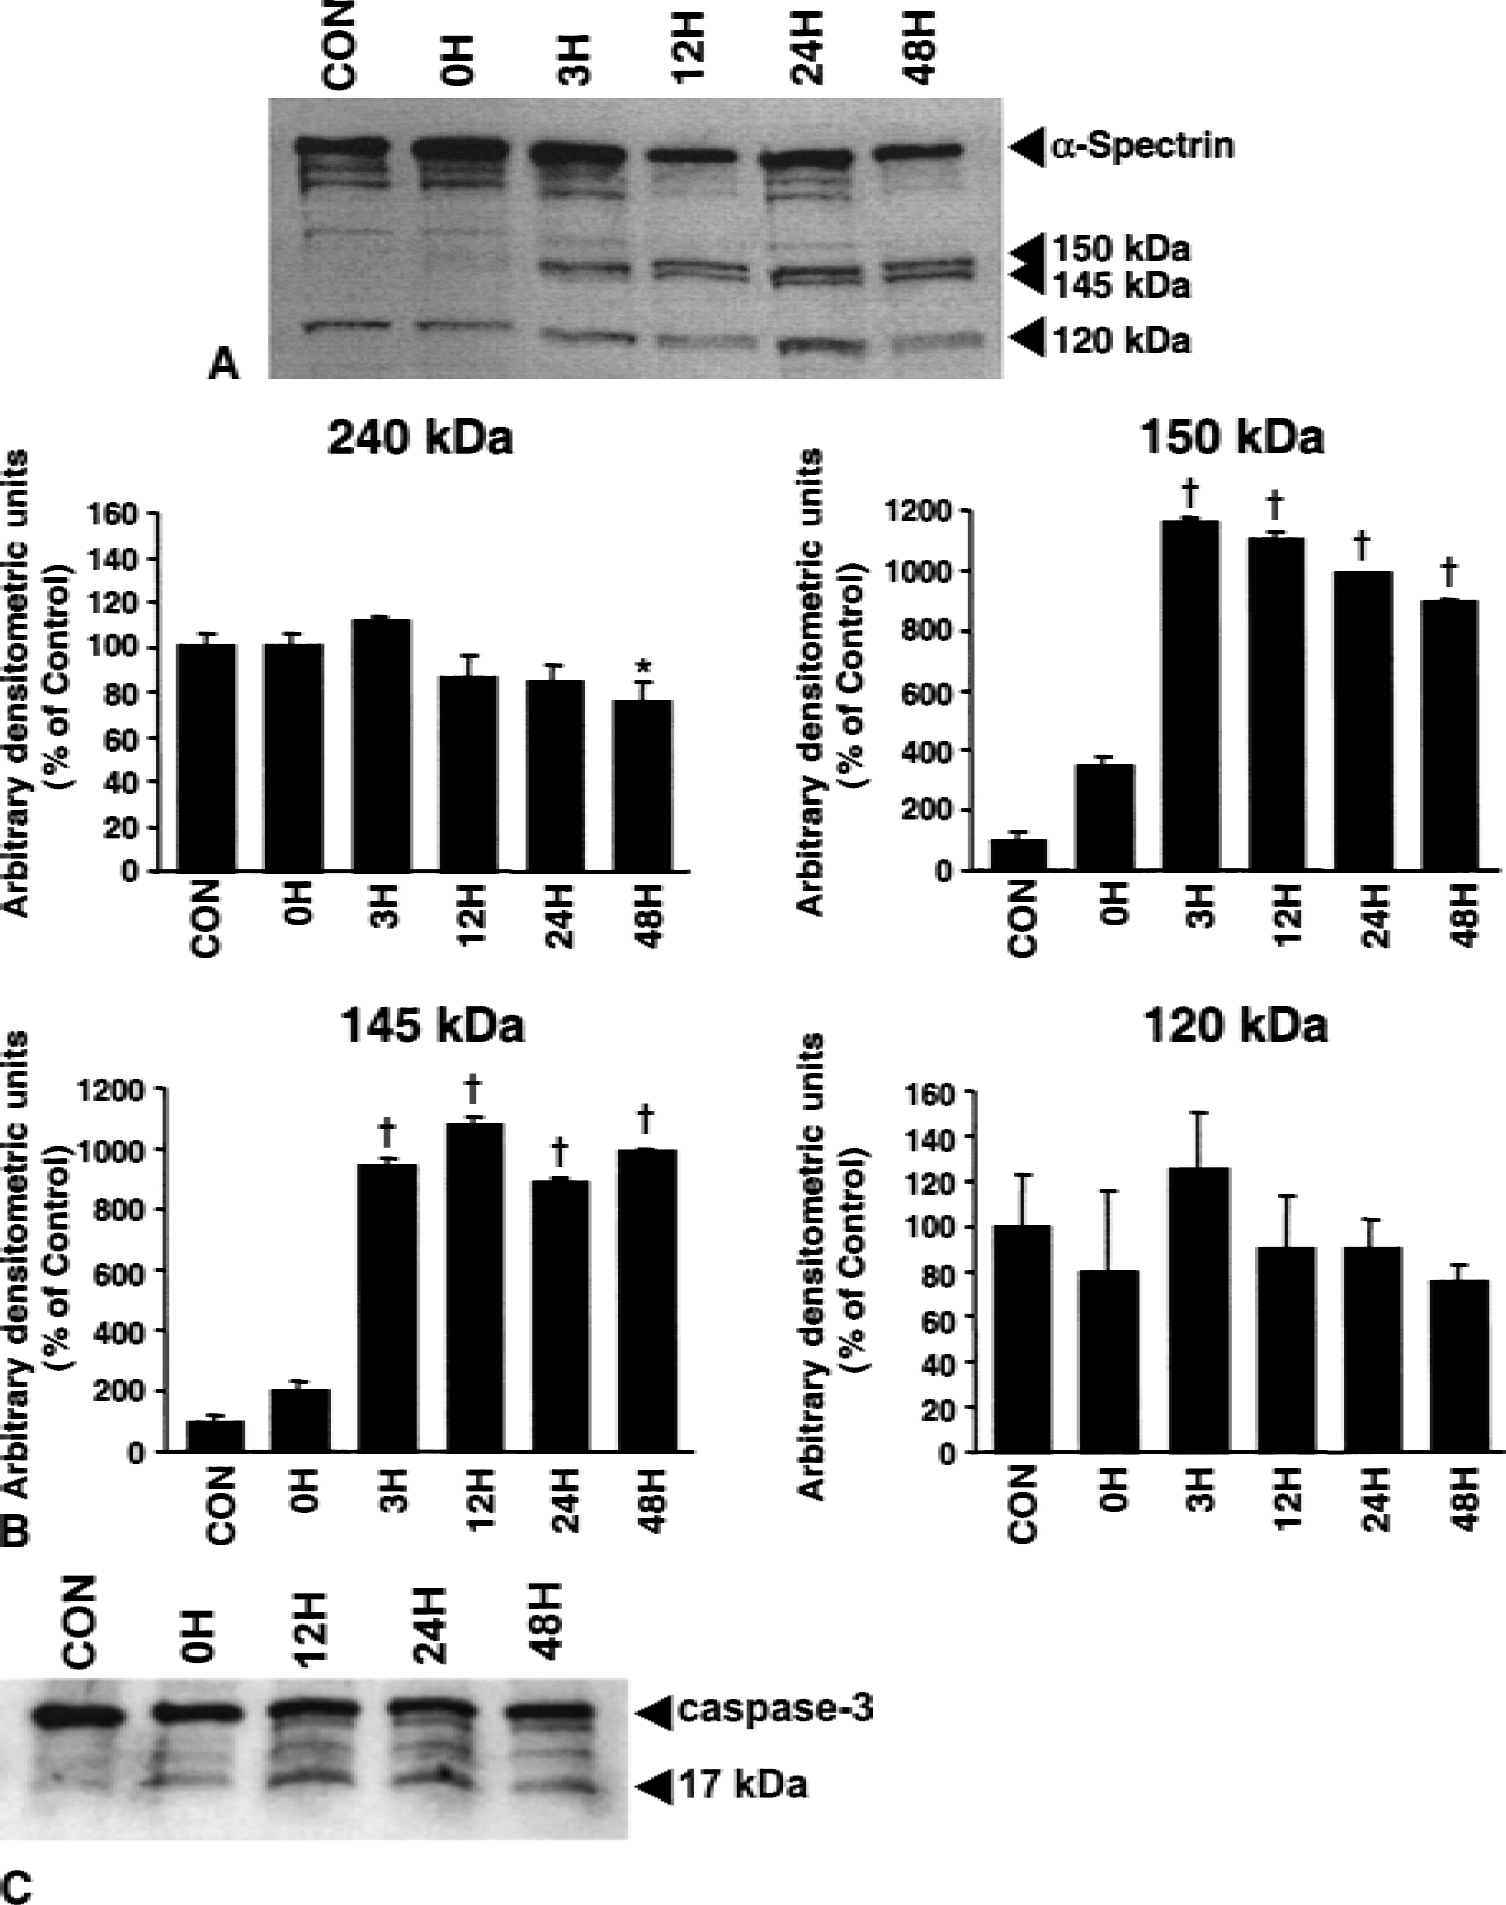
Activation of calpain and caspase-3 after OGD was assessed with Western blots examining proteolysis of α-spectrin (Fig. 4A and 4B). After 10 hours of OGD, samples were collected immediately (0 hour), 3, 12, 24, or 48 hours after cultures were returned to a normal environment. Control samples and samples deprived of oxygen and glucose for 10 hours and collected immediately after injury showed no evidence of calpain-mediated proteolysis of α-spectrin. However, 3 hours after reperfusion, proteolysis of α-spectrin into 150-kDa and calpain-mediated 145-kDa BDPs was significantly increased over control values (P < 0.001). Degradation of α-spectrin continued and proteolysis into the 145-kDa BDP also was increased after 12, 24, and 48 hours of reperfusion (P < 0.001). Modest degradation of native α-spectrin was observed after 48 hours of reperfusion (P < 0.01). Slight increases in caspase-3–mediated proteolysis were detected after injury, but formation of the 120-kDa BDP was variable and did not differ significantly from control. However, immunoblots detected proteolysis of the caspase-3 proenzyme to the activated isoform (Fig. 4C), suggesting that analyses of autolytic activation of the caspase-3 proenzyme may be more sensitive than analyses of processing of cytoskeletal protein substrates.
Calpain- and caspase-3–mediated proteolysis of α-spectrin after oxygen–glucose deprivation (OGD).
Immunocytochemistry.
Primary mixed septo-hippocampal cultures were double-labeled with antibodies specific for calpain (SBDP 150) and caspase-3 (SBDP 120) mediated α-spectrin proteolytic fragments and were counterstained with DAPI (Fig. 5). Across all treatment conditions, cells with evidence of nuclear damage exhibited strong immunoreactivity, whereas most healthy cells showed faint or no immunoreactivity. Cultures deprived of oxygen and glucose had significantly increased cellular colocalization of SBDP 150 and SBDP 120 (93.5 ± 16.7 cells per sample, P < 0.001), compared with control cultures (23 ± 8.6 cells per sample). Although OGD cultures contained substantially more IR cells than control cultures, examination of immunocytochemistry showed a similar distribution of protease activation, regardless of treatment condition (Fig. 5A and 5C). Virtually all IR cells in control and OGD cultures showed concurrent calpain and caspase-3 proteolysis in varying magnitudes (Fig. 5A and 5C). Immunolabeling in control (Fig. 5A) and OGD (Fig. 5C) cultures resulted in subcellular localization of BDPs unique from staurosporine (Fig. 5E) or maitotoxin cultures (Fig. 5G). In control and OGD cells, SBDP 150 was localized exclusively within the cell body, that is, near the nuclear membrane. Conversely, SBDP 120 immunoreactivity was detected throughout the entire cell body, specifically along the outer boundary of the cell membrane, and in the proximal processes (Fig. 5A and 5C). The nuclei of IR cells were shrunken, irregularly shaped, possessed condensed chromatin, and were considered apoptoticlike (Fig. 5B and 5D). Staurosporine injured cells were immunoreactive for both SBDP 120 and SBDP 150 in cells exhibiting apoptoticlike nuclear morphology (Fig. 5E and 5F). Notably, different relative magnitudes of caspase-3 and calpain activation were evident in individual cells, but distinct localization of BDPs was not as apparent as the immunoreactivity in control and OGD cells. Maitotoxin-injured cells showed predominantly calpain-mediated BDPs in cells exhibiting the classic necrotic nuclear morphology of rounded, brightly fluoresced nuclei with pyknotic chromatin (Fig. 5G and 5H).
Calpain and caspase-3 proteolysis of α-spectrin in individual cells following oxygen–glucose deprivation (OGD). Primary mixed septo-hippocampal cultures were immunolabeled with antibodies specific for calpain- (SBDP 150, red fluorescence) and caspase-3 (SBDP 120, green fluorescence)–mediated α-spectrin fragments, and counterstained with DAPI.
Quantitative analysis of DAPI staining in cells immunoreactive for SBDP 150 or SBDP 120 (data not shown) revealed that the majority of IR cells possessed apoptoticlike nuclei in control (95.7% ± 38.7%) and OGD (97.9% ± 17.2%) cultures. Few IR cells exhibiting a necrotic cell death phenotype were observed in control (1.4% ± 3.7%) or OGD (1.4% ± 1.5%) cultures. Occasionally, IR cells with healthy nuclei were present in control (2.9% ± 3.2%) and OGD (0.7% ± 1.0%) cultures. However, these cells may have been in the initial stages of cell death in which nuclear changes were not yet apparent.
Effects of calpain and caspase inhibitors
Preliminary experiments using protease inhibitors in cultures subjected to 10 hours of OGD and 24 hours of reperfusion data failed to show protection against cell death when LDH release was assayed (data not shown). These data suggested that 24 hours of reperfusion was too long a period to allow the inhibitors to be effective, or that the inhibitors became toxic after such long periods. Moreover, the current data demonstrated robust cell death, DNA fragmentation (Fig. 2), and protease activation (Fig. 4) with 10 hours of OGD and 12 hours of reperfusion. In an attempt to show protection and therefore involvement of calpain and caspase-3, cells were subjected to 10 hours of OGD with 12 hours of reperfusion in the presence of protease inhibitors. Lactate dehydrogenase analysis (Fig. 6A) showed significant decreases in release with CI-3 (100 μmol/L;P < 0.001) compared with vehicle-treated cultures. The specific caspase-3 inhibitor, DEVD-fmk (100 μmol/L, P < 0.05), also inhibited LDH release; however, decreases were not statistically significant compared with vehicle-treated cultures. The pan-caspase inhibitor, Z-D-DCB (100 μmol/L), had no effect on LDH release. Dimethyl sulfoxide also decreased LDH release, but this effect was not significantly different from the OGD and media cultures.
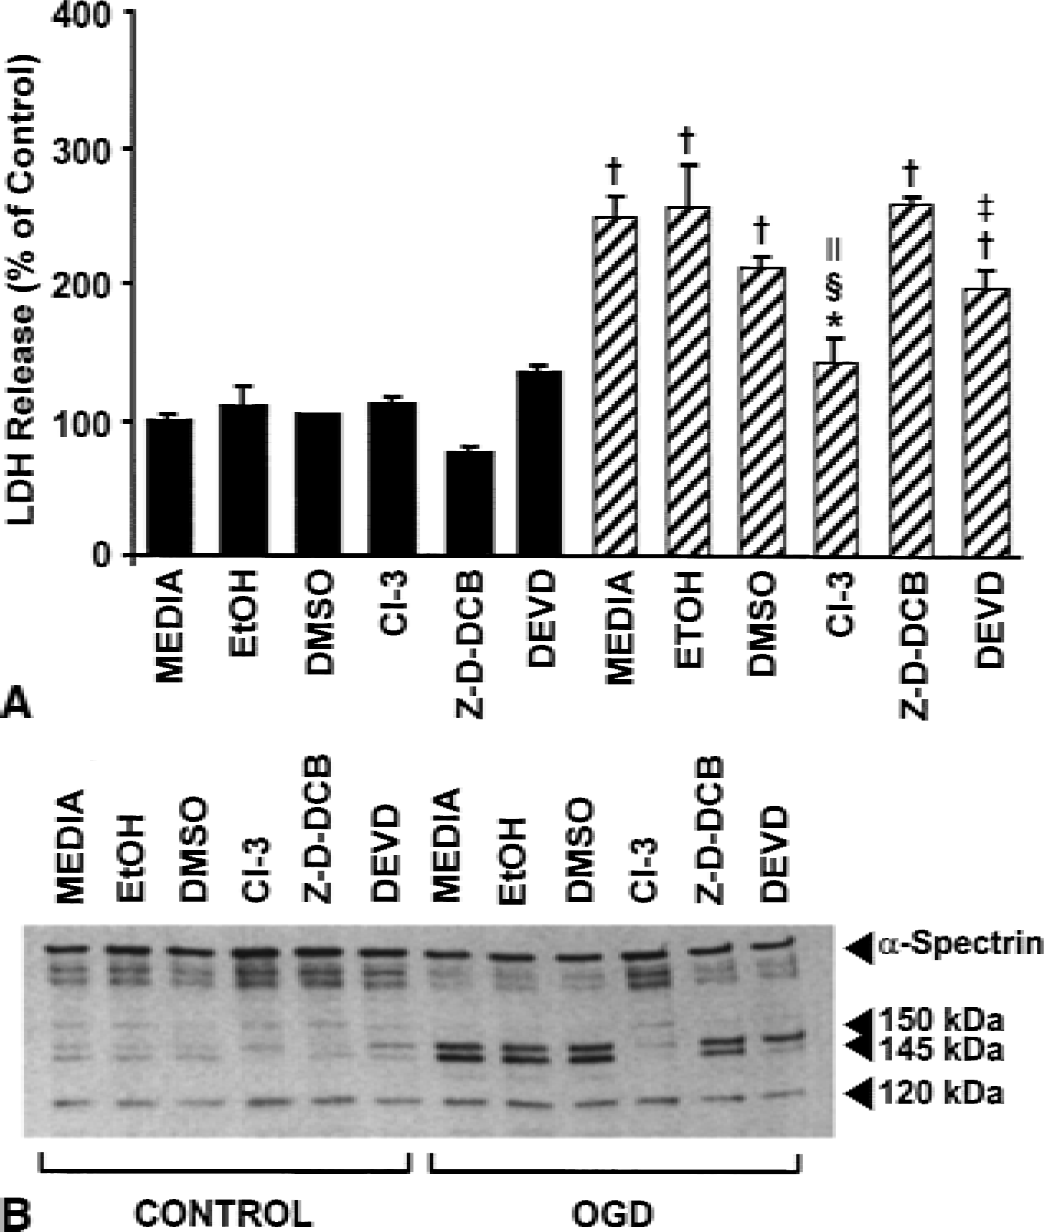
Consistent with the LDH data, Western blot analyses of these samples (Fig. 6B) showed that CI-3 decreased proteolysis of native 240 kDa α-spectrin and almost completely blocked the formation of the 150/145 kDa doublet. Z-D-DCB also inhibited formation of the 145 kDa BDP to a small extent, but had only a minor effect on the caspase-3–mediated BDP (120 kDa). Surprisingly, DEVD-fmk dramatically reduced the calpain-mediated BDP, but only had a modest effect on the 120 kDa band. Subsequent experiments investigating combined inhibition using CI-3 and DEVD-fmk failed to show a synergistic mechanism. Future experiments should examine more extensive dosing protocols.
DISCUSSION
Although numerous studies have investigated calpain and caspase-3 activation after acute CNS trauma, no study has examined the relation between protease activation and expression of cell death phenotypes. In the current study, the authors detected prominent expression of apoptoticlike cell death phenotypes following a model of OGD, especially in neurons. Moreover, coactivation of calpain and caspase-3 was almost always detected in cells exhibiting apoptoticlike cell death phenotypes.
Oxygen–glucose deprivation resulted in both apoptosis and necrosis in this culture system. Although apoptotic and necrotic cell death have been observed in some models of in vitro ischemia (Kalda et al., 1998), other models do not observe apoptosis unless glutamate receptor antagonists are used (Gottron et al., 1997; Gwag et al., 1995; Lobner and Choi, 1996). Variations in cell culture methodology, including culture age at time of injury and glial density, may be responsible for these discrepancies. Consistent with the prominent role of apoptosis in development, younger cultures, such as those used in this study, are more susceptible to apoptosis after cyclosporine or staurosporine treatment (McDonald et al., 1997), whereas older neurons are more vulnerable to N-methyl-d-aspartate toxicity (McDonald et al., 1997) and hypoxia (Di Loreto and Balestrino, 1997). In contrast to this article, studies that detected only necrosis after OGD used neuronally enhanced cell cultures (Goldberg and Choi, 1993; Gottron et al., 1997; Lobner and Choi, 1996). Increased sensitivity to glutamate toxicity and OGD has been observed in neuronally enhanced cultures (Zhao et al., 2000; Dugan et al., 1995), suggesting that the absence of glia may intensify a neuron's response to injury. It is conceivable that higher glial concentrations in the current model of OGD blunted the effects of deprivation and resulted in a slower and milder injury. Notably, in vitro studies have shown that the same insult can produce apoptosis or necrosis depending on its severity (Bonfoco et al., 1995).
Cell death after OGD was associated with concurrent activation of calpain and caspase-3. Although immunocytochemical experiments revealed robust caspase-3–mediated proteolysis of α-spectrin (120 kDa), Western blots failed to detect consistent increases in this proteolytic fragment. Use of different primary antibodies (monoclonal versus polyclonal) and methods of detection (enhanced chemiluminescence reagents versus fluorescence) may be responsible for these inconsistencies. Western blots using an antibody to the activated caspase-3 17-kDa subunit did provide evidence of caspase-3 activation, confirming immunohistochemical observations of caspase-3 activation and suggesting that Western blot assessments of proenzyme processing may be more sensitive than measures of substrate degradation in some model systems.
Cells phenotypically showing apoptoticlike nuclear profiles exhibited prominent expression of calpain and caspase-3, suggesting that there may be as yet undefined interactions between these two proteases in the expression of the apoptotic phenotype. Calpain and caspase-3 share a variety of substrates that are proteolyzed during apoptosis (Wang, 2000). In addition, these proteases cleave proteins important to each other's regulation—that is, caspase-3–mediated proteolysis of calpastatin, calpain-mediated proteolysis of pro-caspase-3 and pro-caspase-9 (Wang et al., 1998a; McGinnis et al., 1999; Wolf et al., 1999). Furthermore, calpains, but not caspases, promote apoptoticlike events during platelet activation (Wolf et al., 1999). Additional evidence for calpain's involvement in apoptotic cell death in CNS injury is provided by recent studies examining in vivo TBI and ischemia. Calpain-mediated breakdown products have been detected in the injured cortex after TBI (Beer et al., 2000; Pike et al., 1998a), a site associated with prominent apoptotic cell death (Beer et al., 2000; Newcomb et al., 1999), although evidence of caspase-3 activation in this region has yielded conflicting data (Beer et al., 2000; Pike et al., 1998a). These discrepancies may be attributable to differences in injury magnitude, animal age, or species; these issues currently are being addressed in both laboratories. After in vivo ischemia, approximately 50% of TUNEL-positive cells failed to show caspase-3 activation (Namura et al., 1998), suggesting that other proteases, such as calpain, are involved in the apoptotic changes observed after injury.
Inhibition of calpain substantially decreased LDH release after OGD with 12 hours of reperfusion, suggesting that calpain activation contributes to cell death in this model. Inhibition of caspase-3 with DEVD-fmk also reduced LDH release, although this drug also showed marked inhibition against calpain activation. Thus, the current study did not allow for comparisons of the relative contribution of these two proteases to cell death in this model. It is unclear why DEVD-fmk showed substantial calpain inhibition and only modest caspase-3 inhibition, but these data suggest that this agent is not a specific inhibitor of caspase-3 activation, at least in this model system. Although not directly addressed in this study, future experiments must more rigorously investigate the relative contribution of calpain and caspase-3 to the expression of apoptotic cell death phenotypes.
Although the current study relied in part on morphologic characteristics of cell death phenotypes, a number of observations suggest that biochemical markers ultimately may be more useful indicators of cell death, especially in acute neurologic insults characterized by heterogeneous or ambiguous cell death phenotypes. In this study, appearance of necrotic cell death depended on method of detection. Using chromatin dyes to distinguish necrotic and apoptotic nuclear morphology is problematic because nuclei may exhibit characteristics either of both types (Colicos and Dash, 1996) or neither type (Zhao et al., 2000) of cell death. In fact, most techniques used to differentiate apoptosis also have been reported to label necrosis, perhaps because late events are similar in both types of cell death (Choi, 1996). Some investigators have argued that necrosis and apoptosis may not be phenotypically distinct events, but rather represent a morphologic continuum (Bonfoco et al., 1995; Portera-Cailliau et al., 1997). This issue is further complicated by evidence showing that the same insult can cause apoptosis and necrosis in different cell populations (Sloviter et al., 1996) or can result in an acute necrotic death with a delayed apoptotic death (Ankarcrona et al., 1995; Pang and Geddes, 1997).
In summary, the current data demonstrate that coactivation of calpain and caspase-3 is a reliable characteristic of apoptotic cell death in the current model system. These observations strongly suggest that calpain activation, in combination with caspase-3 activation, could contribute to the expression of apoptotic cell death by assisting in the proteolytic degradation of important cellular proteins (Wang, 2000). Finally, interactions between these two cysteine proteases could be important determinants of cell death.