
Abstract
Changes in apparent diffusion coefficients (ADC) were compared with alterations of adenosine triphosphate (ATP) concentration and pH in different phases of transient focal cerebral ischemia to study the ADC threshold for breakdown of energy metabolism and tissue acidosis during ischemia and reperfusion. Male Wistar rats underwent 1 hour of middle cerebral artery occlusion without recirculation (n = 3) or with 1 hour (n = 4) or 10 hours of reperfusion (n = 5) inside the magnet, using a remotely controlled thread occlusion model. ADC maps were calculated from diffusion-weighted images and normalized to the preischemic value to obtain relative ADC maps. Hemispheric lesion volume (HLV) was determined on the last relative ADC maps at different relative ADC thresholds and was compared to the HLV measured by ATP depletion and by tissue acidosis. The HLVs, defined by ATP depletion and tissue acidosis, were 26.0% ± 10.6% and 38.1% ± 6.5% at the end of ischemia, 3.3% ± 2.4% and 4.8% ± 3.5% after 1 hour of reperfusion, and 11.2% ± 4.7% and 10.9% ± 5.2% after 10 hours of recirculation, respectively. The relative ADC thresholds for energy failure were consistently approximately 77% of the control value in the three different groups. The threshold for tissue acidosis was higher at the end of ischemia (86% of control) but was similar to the results obtained for ATP depletion after 1 hour (78% of control) and 10 hours (76% of control) of recirculation. These results indicate that the described relative ADC threshold of approximately 77% of control provides a good estimate for the breakdown of energy metabolism not only during middle cerebral artery occlusion but also at the early phase of reperfusion, when recovery of energy metabolism is expected to occur, or some hours later, when development of secondary energy failure was described.
Keywords
The reduction in the apparent diffusion coefficient (ADC) of water in brain tissue during cerebral ischemia has led to a wide application of diffusion-weighted magnetic resonance imaging for the early detection and characterization of ischemic damage in patients with stroke, as well as in animal experiments. Although the exact mechanisms behind these changes of water diffusion are still not clear, it is generally accepted that the ADC changes are caused by a net shift of water from the extracellular to the intracellular space during ischemia, as a result of anoxic cell membrane depolarization due to energy failure (Moseley et al., 1990). However, because gradual but significant ADC changes occur earlier than the beginning of anoxic depolarization (Harris et al., 2000) and also in the region with preserved adenosine triphosphate (ATP) (Hoehn-Berlage et al., 1995a), other mechanisms, such as developing acidosis or change of membrane permeability, may also play a role. In a previous study that compared ADC and metabolic changes in a rat model of 2 hours of permanent focal ischemia, ATP depletion was shown to correspond to an ADC reduction of at least 23% from baseline; however, tissue acidosis was found to occur at a higher threshold of only 10% ADC reduction (Hoehn-Berlage et al., 1995a). This means that the quantification of ADC in the ischemic territory allows estimation of the core region with breakdown of energy failure, and a rim with normal energy balance but tissue acidosis.
Recent studies have shown recovery of either the ADC (Li et al., 2000; Olah et al., 2000; van Lookeren Campagne et al., 1999) or the ATP (Folbergrova et al., 1995; Hata et al., 2000) content at the early phase of reperfusion after a short period of cerebral ischemia in rodents. However, both a secondary decline of ADC and a secondary energy failure were observed some hours after recirculation. Despite the described similar changes of ADC and energy level of the tissue, only few studies reported that the ADC changes may reflect the energy metabolism during permanent (Back et al., 1994; Hoehn-Berlage et al., 1995a; Moseley et al., 1990) or transient ischemia (Fischer et al., 1995; Hossmann et al., 1994). Although the relation was investigated between these parameters during irreversible middle cerebral artery occlusion (MCAO; Hoehn-Berlage et al., 1995a), there is no investigation at present in a transient ischemia model.
Our aim was to examine whether the improvement or recovery of ADC at the early reperfusion phase reflects the improvement or recovery of ATP content in the corresponding region, and whether the secondary deterioration of ADC at the later phase of reperfusion indicates secondary energy failure. For this purpose, three groups of rats underwent 1 hour of MCAO inside the magnet, without recirculation or with 1 hour or 10 hours of reperfusion and were frozen at the end of the experiment. During the observation time, perfusion- and diffusion-weighted images were repeated sequentially, and the calculated ADC maps, recorded at the end of the experiment after different reperfusion times (directly before freezing), were compared with the ATP and pH images using substrate-specific bioluminescence and fluorescence imaging, respectively. ADC thresholds were calculated for correspondence with energy failure (ATP depletion) and tissue acidosis in the different groups.
MATERIALS AND METHODS
Animal model
Experiments were performed in accordance with the NIH animal protection guidelines and were approved by the governmental authorities.
Fourteen male Wistar rats (body weight 300 to 350 g) were anesthetized with 1.5% halothane in a 70/30 mixture of N2O/O2. Rectal temperature was monitored throughout the experiment and kept close to 37†C using a feedback-controlled heating pad. Animals were tracheotomized, mechanically ventilated, and immobilized with pancuronium bromide (0.3 mg/kg/ hr). Once mechanical ventilation had begun, the halothane concentration was reduced to 1.0%. Arterial and venous catheters were inserted into the femoral vessels for injection of drugs, monitoring of systemic blood pressure, and blood sampling. Blood gases were measured repeatedly and kept within physiologic limits by appropriate settings of the respirator. The animals were placed in a nonmagnetic stereotaxic head-holder for accurate positioning in the magnet.
Focal ischemia was produced inside the magnet by intraluminal suture occlusion of the right MCA, using a previously described, remotely controlled occluding device (Kohno et al., 1995), as described recently in detail (Olah et al., 2000). This arrangement permitted the manipulation of the thread position from outside the magnet to allow measurements during control and MCAO and after retraction of the thread, without the need to reposition the animal. The success of the occlusion was confirmed by the decrease in perfusion signal intensity in perfusion-weighted images.
Three groups of rats were defined: group 1 had no recirculation (n = 4), group 2 had 1 hour of recirculation (n = 5), and group 3 had 10 hours of recirculation (n = 5). Animals in group 1 underwent 1 hour of permanent MCAO. In the animals in groups 2 and 3, 1 hour and 10 hours of reperfusion were induced, respectively, by retraction of the thread after 1 hour of MCAO. At the end of the experiment, animals were frozen in liquid N2. One animal each was excluded from groups 1 and group 2 because subarachnoidal hemorrhage was observed on brain removal.
Magnetic resonance imaging
Nuclear magnetic resonance measurements were performed at 200 MHz using a Bruker Biospec system (Bruker Medical, Ettlingen, Germany) with a 4.7-T magnet of 30-cm clear bore. The system was equipped with actively shielded gradient coils (maximum gradient strength 100 mT/m, gradient rise time <250 microseconds). A 12-cm-diameter Helmholz coil was used for radiofrequency transmission, and a 16-mm-diameter surface coil with inductive coupling was placed over the skull of the animal for signal reception. Sagittal scout scans using a gradient-echo MR imaging sequence (echo time [TE] 8.3 milliseconds, repetition time [TR] 300 milliseconds) were performed for correct positioning of the head.
Diffusion-weighted MR imaging was carried out using a multislice Stejskal-Tanner-type spin-echo sequence (Stejskal and Tanner, 1965). The sequence parameters were TE 35.2 milliseconds, TR 2,325 milliseconds, and matrix 128 × 128. Six coronal slices with a thickness of 1.21 mm and a 0.54-mm interslice gap were recorded with a field of view of 4 × 4 cm2. The diffusion encoding gradient was always aligned along the read gradient. As the change of ADC relative to the preischemic condition was monitored, the results were independent of the absolute ADC (Hoehn-Berlage et al., 1999) and therefore independent of the alignment of the diffusion encoding gradient, as shown earlier (Hoehn-Berlage et al., 1995b).
For the quantitative determination of the ADC, diffusion-weighted images with different gradient strengths of the diffusion encoding gradient (b factor: 30, 1,500 s/mm2) were recorded. Extensive data postprocessing was performed, as described in detail elsewhere (Eis and Hoehn-Berlage, 1995). ADC was calculated pixelwise by solving the monoexponential intravoxel incoherent motion model of Le Bihan (1988) using the MEMRIS software package. Single-slice perfusion-weighted images through the center of the MCA territory (at the level of the caudate putamen) were obtained with the arterial spin-tagging technique followed by snapshot fast low-angle shot (FLASH) imaging (TE 3.9 milliseconds, TR 7.4 milliseconds, field of view 4 × 4 cm2, slice thickness 2 mm, matrix 128 × 64) (Kerskens et al., 1995). Eight subtraction images were averaged to improve the signal-to-noise ratio, resulting in a total scan time of 56 seconds for each perfusion-weighted image. Perfusion-weighted images were normalized to the control snapshot FLASH images without arterial spin labeling to compensate for signal loss in regions more distal to the receiver surface coil.
Measurement protocol
An ADC multislice set and a perfusion-weighted image at the level of the caudate putamen were obtained before MCAO (control), every 15 minutes during MCAO, and during the first hour of reperfusion. Later, diffusion- and perfusion-weighted images were recorded after every hour.
Image analysis
Quantitative ADC and normalized perfusion-weighted images were transferred to a Macintosh Power PC 7200/66 (Apple, Cupertino, CA, U.S.A.). Image analysis was carried out using the image processing software IMAGE (NIH, Bethesda, MD, U.S.A.). Data analysis was performed in individual voxels. ADC and perfusion signal intensity maps during ischemia and at different time points of reperfusion were normalized pixelwise by division with the corresponding preischemic control images. Thus, the relative values were expressed in each pixel as a percentage of the preischemic control value. The lesion area was measured in the six calculated, relative ADC slices at different relative ADC thresholds, with thresholds chosen in 2% increments starting at 60% of control. The hemispheric lesion volume (HLV) was calculated by dividing the lesion volume (the sum of the lesion areas for all slices multiplied by the slice-slice distance) by the volume of the ipsilateral hemisphere (the sum of the ipsilateral hemispheric areas for all slices multiplied by the slice-slice distance). HLVs were determined at the end of the ischemic period in all groups, at the end of 1 hour of reperfusion in groups 2 and group 3, and at the end of 10 hours of reperfusion in group 3.
Biochemical imaging
Brains were removed from the skull in a cold box at −20†C and sliced at the same temperature into 20-μm thin sections using a cryostat microtome. Coronal sections at the corresponding six levels of ADC slices were processed for the regional distribution of ATP and glucose by evoking substrate-specific bioluminescence (Kogure and Alonso, 1978; Paschen et al., 1981). Regional tissue pH was measured in coronal sections adjacent to those used for ATP images, using the umbelliferone fluorescence technique of Csiba et al. (1983). In the ATP images, impaired metabolism was defined as a decrease of 30% below the value of the contralateral hemisphere. Tissue acidosis was defined as a pH value of less than 6.7. These thresholds corresponded to two standard deviations below the mean pixel values of the opposite, nonischemic hemisphere. HLVs, defined by ATP depletion and tissue acidosis, were also calculated, by dividing the lesion volume (the sum of the lesion areas for all slices multiplied by the slice-slice distance) by the volume of the ipsilateral hemisphere (the sum of the ipsilateral hemispheric areas for all slices multiplied by the slice-slice distance).
Regional comparison of ADC with metabolic parameters
The different slice thicknesses and the slight differences in the spatial orientation of the nuclear magnetic resonance images and the cryostat sections precluded a pixelwise analysis of ADC thresholds. Therefore, the ADC thresholds were estimated by insertion of the HLV of abnormal biochemical parameters into the HLV–relative ADC relationships, as shown below.
Whereas pixelwise analysis of ADC thresholds was impossible in this study, incidence maps of ATP depletion and ADC decline were constructed to compare the spatial distribution of the lesion area, defined by these parameters. The areas of ATP depletion and relative ADC less than 77% of control (see below) were outlined on representative brain sections of each individual experiment and superimposed at the level of the caudate putamen. Using the image analysis software, the incidence of the ATP depletion and ADC decline was calculated for each pixel and expressed as a percentage of the number of animals per group.
Statistical analysis
All data are expressed as means ± SD. The differences in the HLVs between the three groups were tested by analysis of variance, followed by Scheffe post hoc test. The unpaired t-test was used to compare the glucose concentration in the ATP-depleted tissue on the ipsilateral side with the corresponding contralateral region. Relative perfusion signal intensity was compared during MCAO and at different time points after reperfusion with the preischemic control value, using the paired t-test.
RESULTS
Physiologic variables
Table 1 summarizes the physiologic parameters measured in the three groups at different phases of the experiments. During the observation period, all variables were in the normal range and did not change significantly. Figure 1 shows MR and metabolic images from animals in the three groups. The comparison of the last ADC images and the corresponding ATP images suggests a close spatial relationship between these parameters.
Physiologic parameters in the different groups before MCAO (control), at the end of 1 hour of MCAO, and after 1 and 10 hours reperfusion
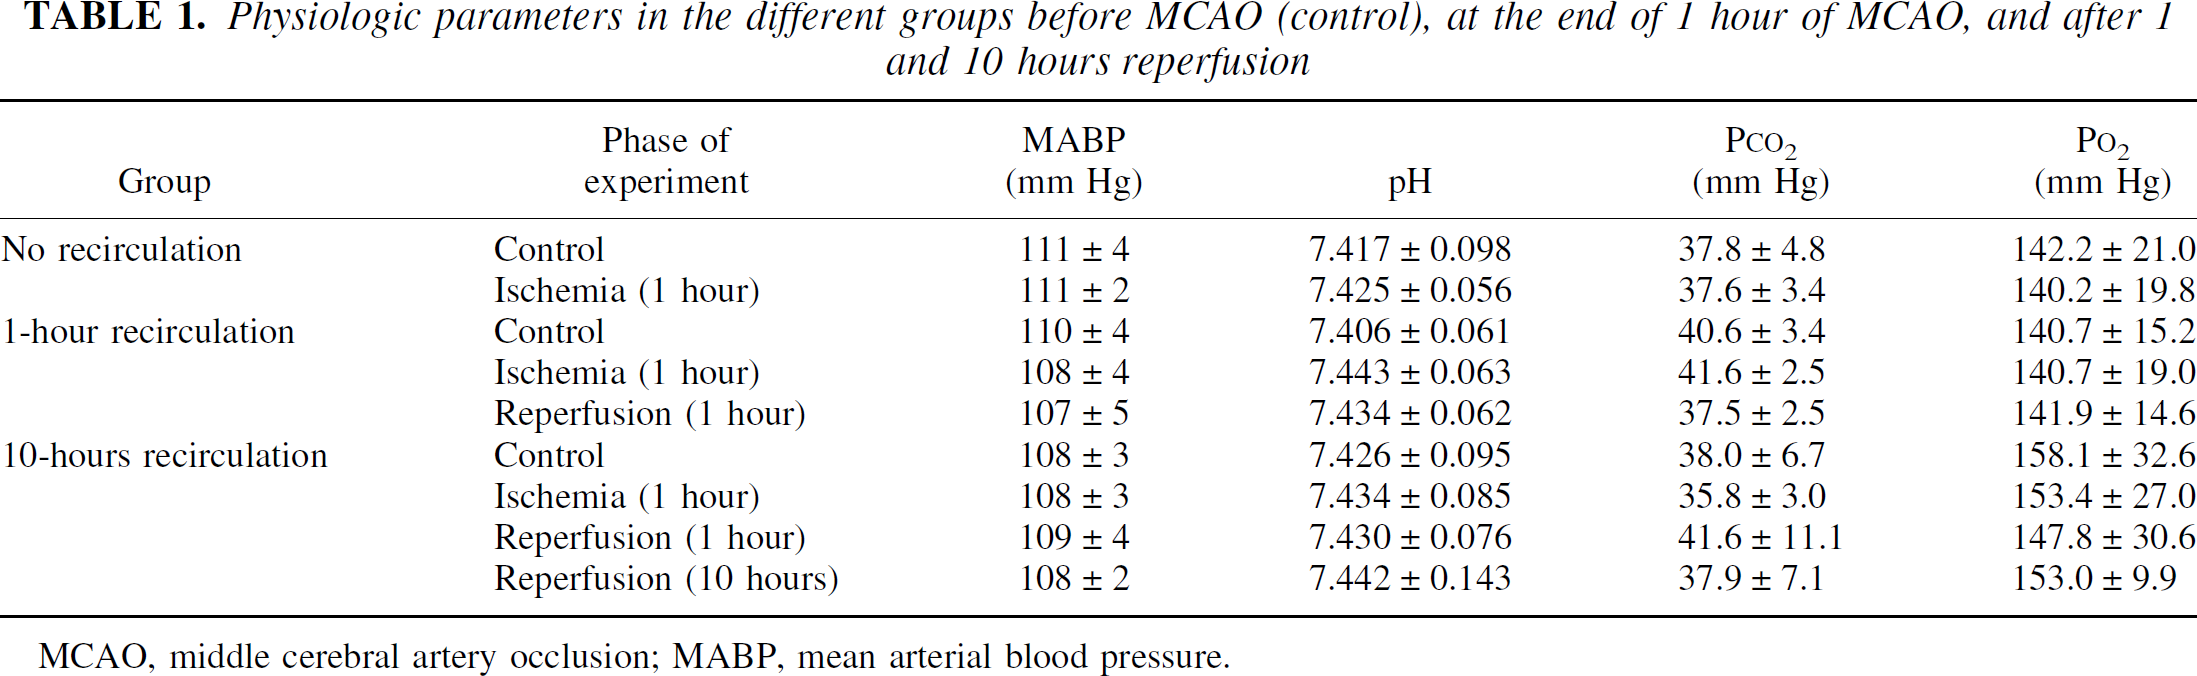
MCAO, middle cerebral artery occlusion; MABP, mean arterial blood pressure.
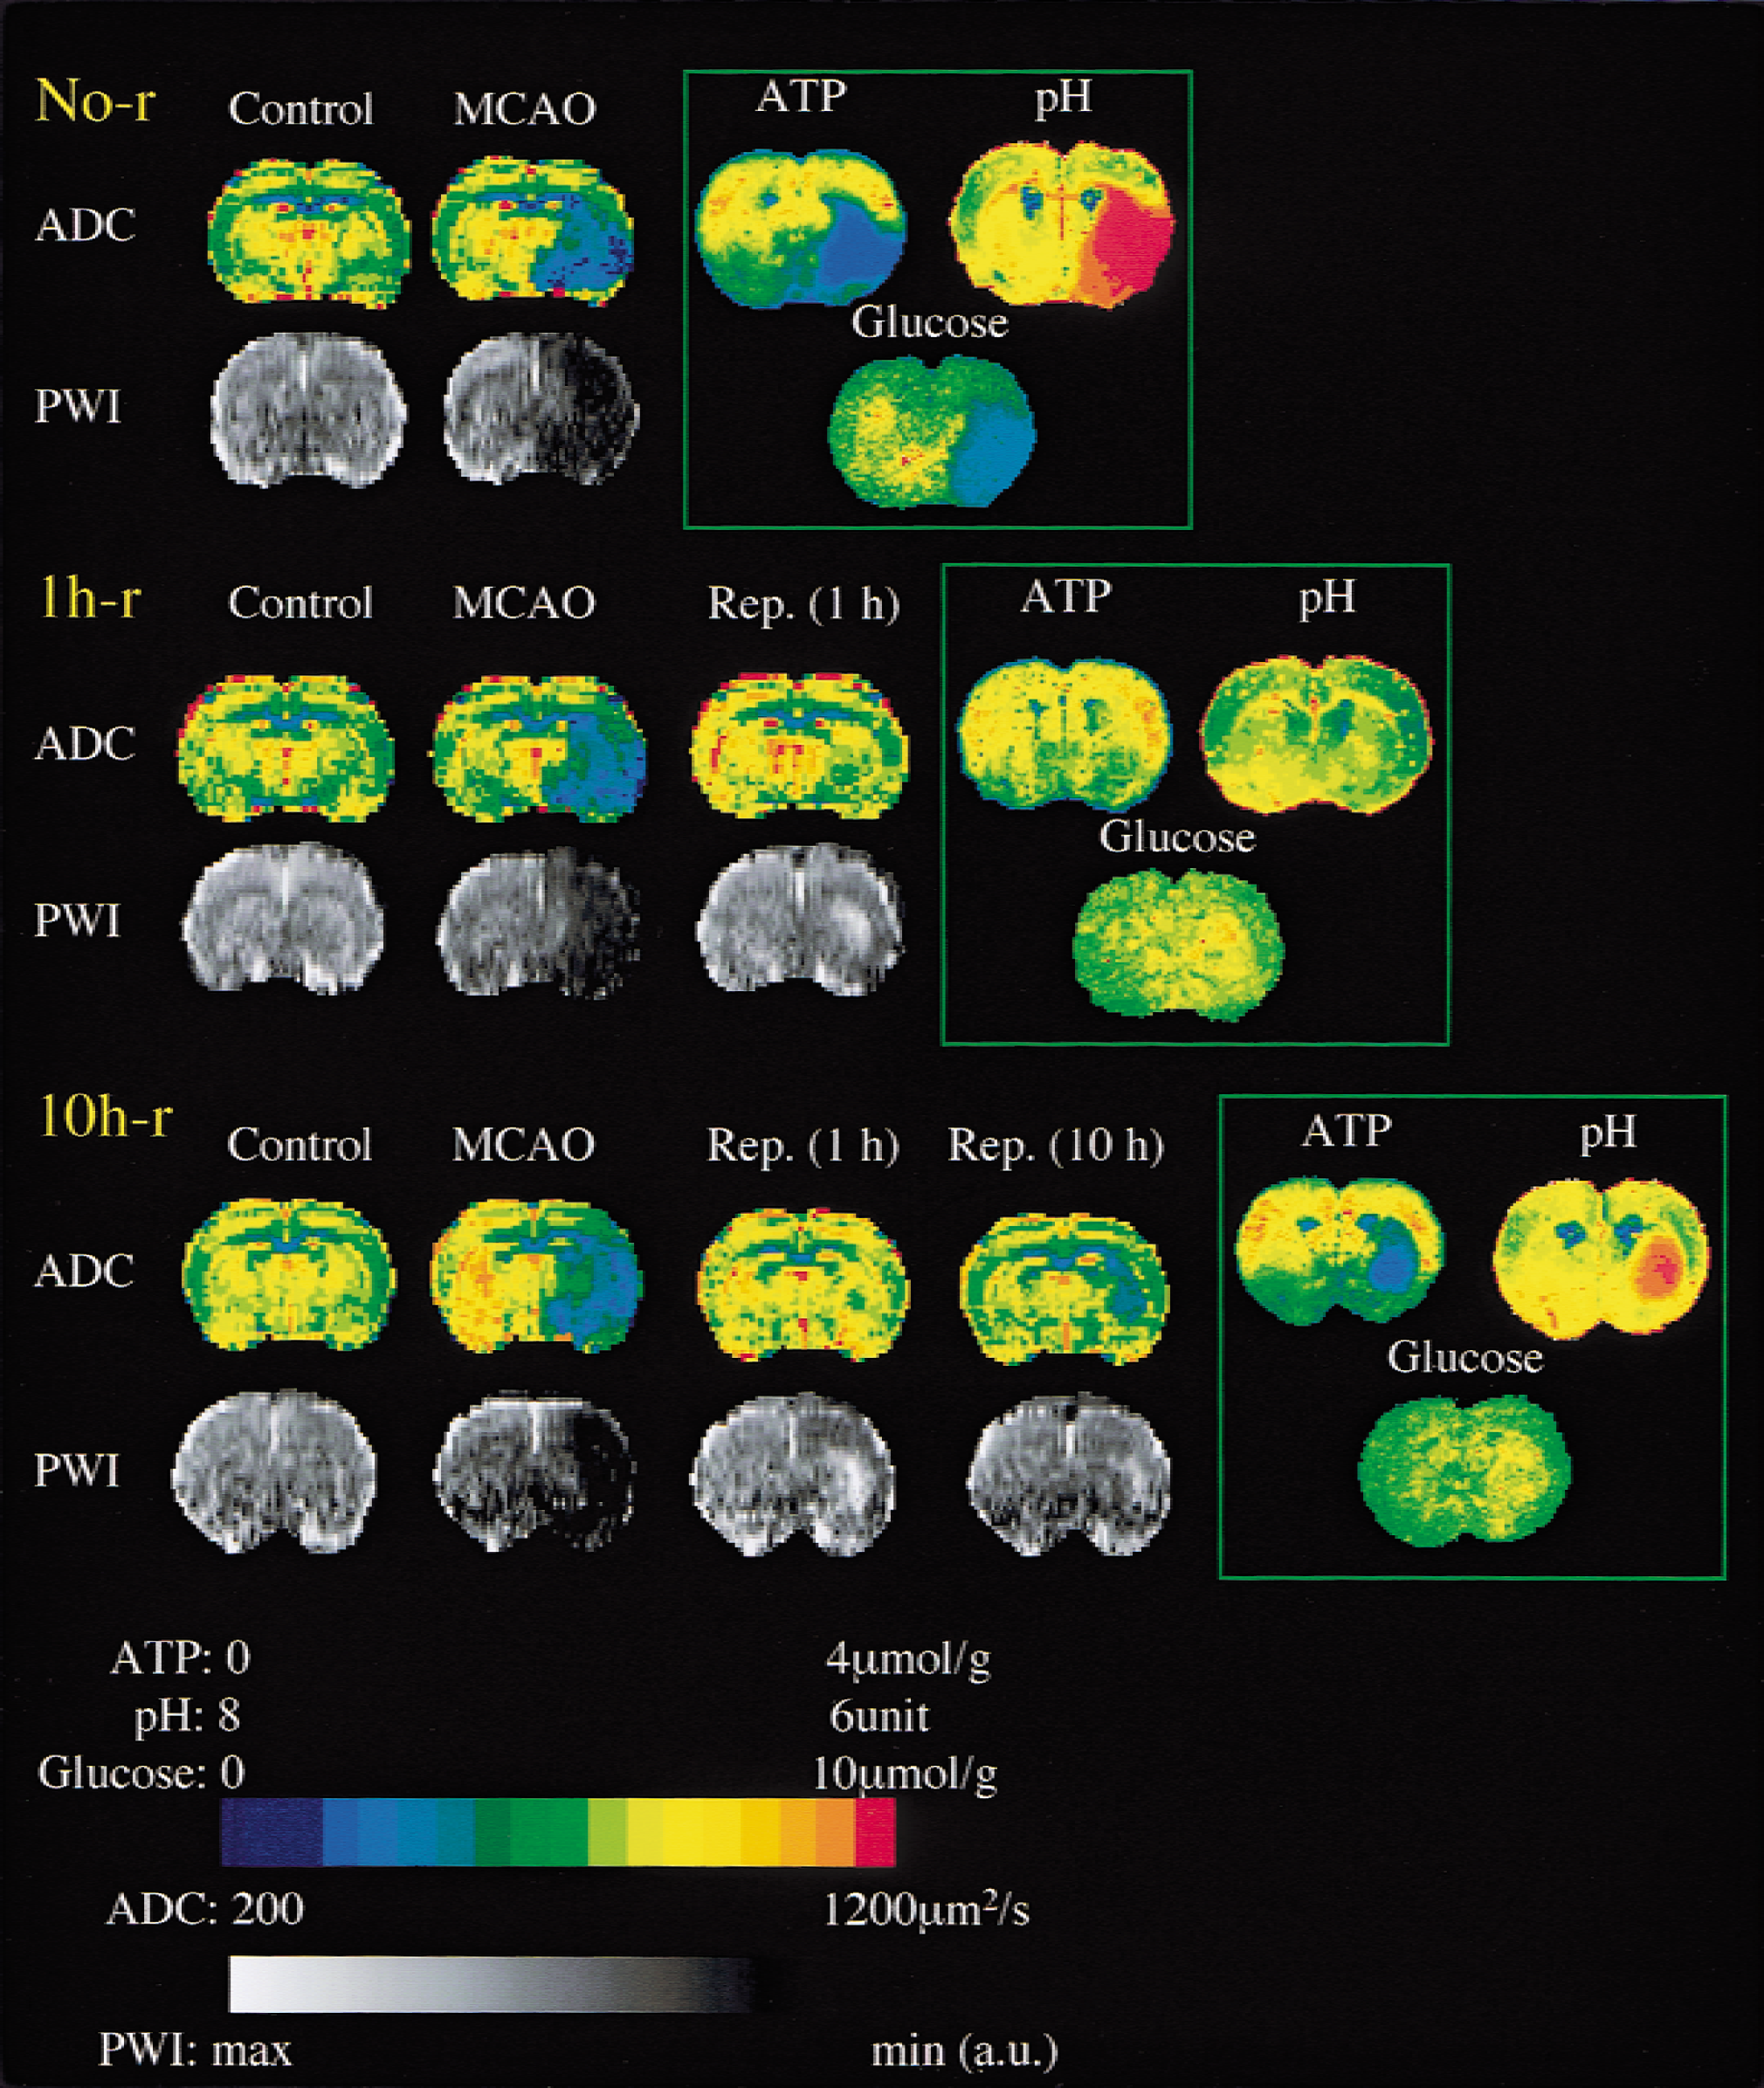
Coronal images of the rat brain for comparison of metabolic parameters, apparent diffusion coefficient (ADC), and perfusion-weighted images (PWI) at the level of the caudate-putamen at different survival times after 1 hour of focal cerebral ischemia. Magnetic resonance images were recorded before (Control) and at the end of ischemia (middle cerebral artery occlusion (MCAO)) in the first animal (No-r). Additional images are presented at the end of 1 hour of reperfusion in the second animal (1h-r), and at the end of 1 hour and 10 hours of recirculation in the third animal (10h-r). ATP, pH, and glucose images at the corresponding level are shown for comparison of the metabolic parameters and the last ADC image. Note the improvement of ADC in the second and third animal during the early reperfusion phase, and the secondary deterioration of ADC 10 hours after recirculation. The comparison of the metabolic and magnetic resonance imaging parameters at the end of the experiments suggests a close spatial relation between the lesion area on the last ADC maps and on the ATP images.
Perfusion-weighted imaging, ADC
After MCAO, the relative perfusion signal intensity decreased significantly in the ipsilateral hemisphere (Table 2). After 1 hour of MCAO, reperfusion was induced by retraction of the thread in groups 2 and 3, resulting in an increase in perfusion signal intensity. Slight hyperperfusion was observed in the caudate putamen in the early reperfusion phase in both recirculation groups, and although the perfusion level decreased to less than the preischemic value later, significant hypoperfusion was not observed in the supplying area of the MCA during 10 hours of recirculation.
Relative perfusion signal intensity in the different experimental groups, measured at the level of caudate putamen, at different phases of the experiment
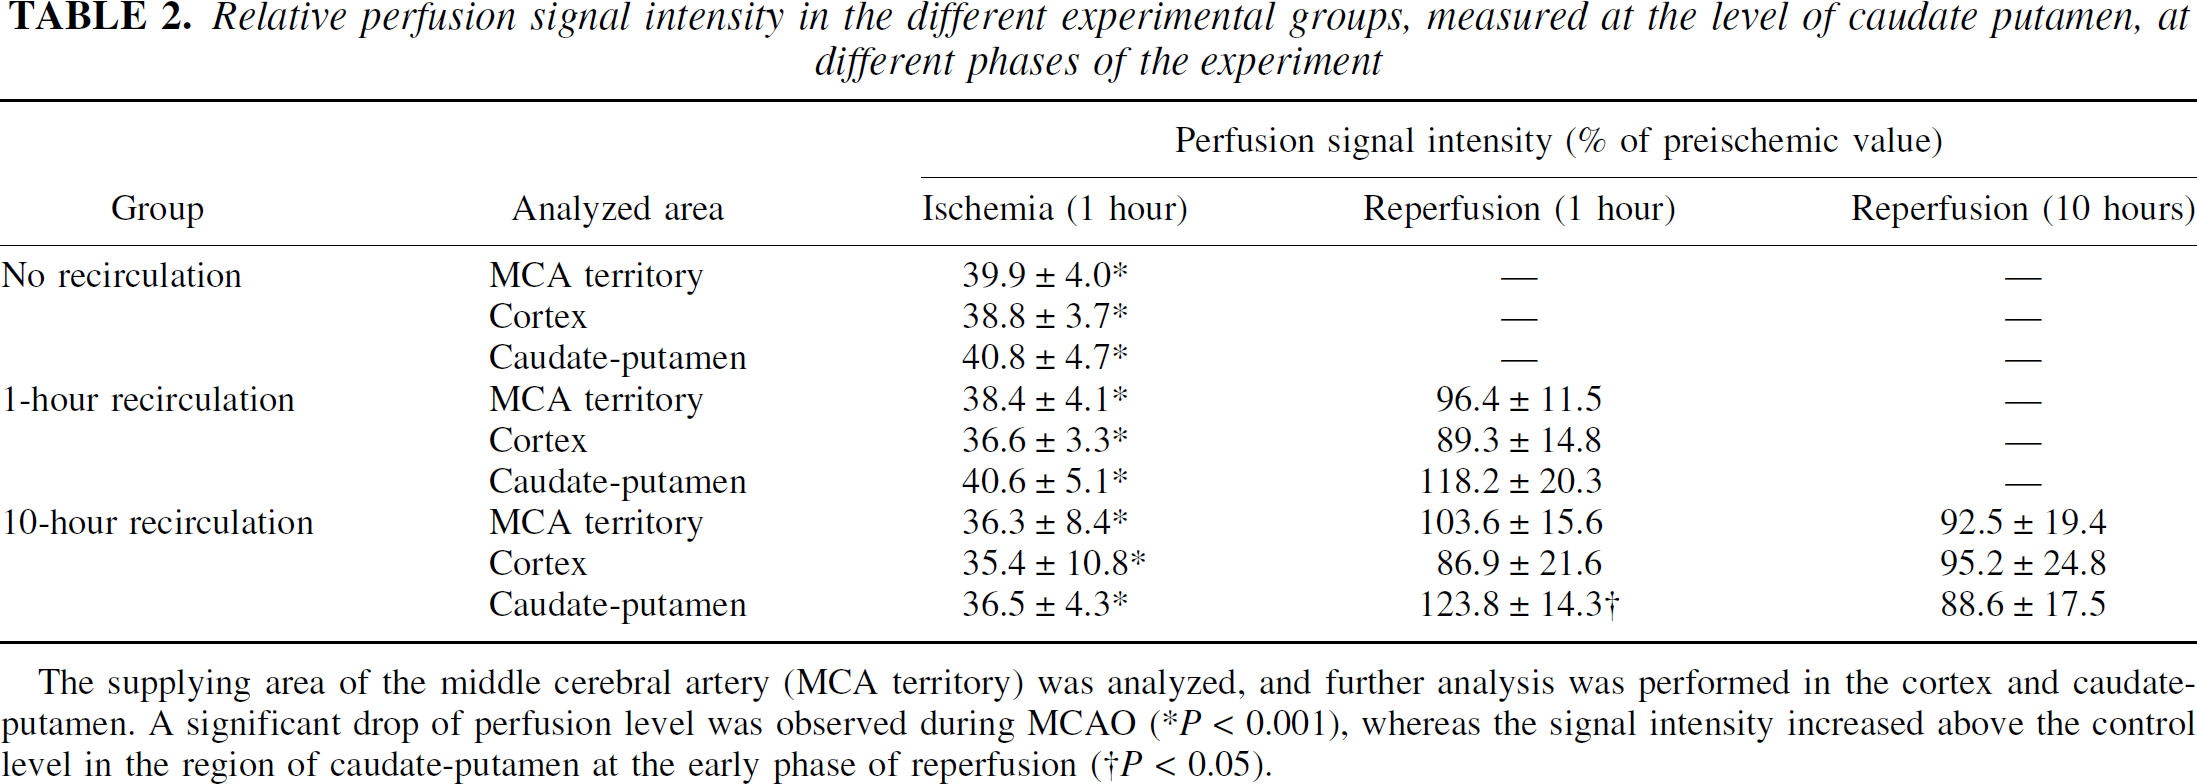
The supplying area of the middle cerebral artery (MCA territory) was analyzed, and further analysis was performed in the cortex and caudate-putamen. A significant drop of perfusion level was observed during MCAO (*P < 0.001), whereas the signal intensity increased above the control level in the region of caudate-putamen at the early phase of reperfusion (†P < 0.05).
At the end of 1 hour of MCAO, ADC decreased significantly within the MCA territory but improved partially 1 hour after reperfusion; it showed a secondary decline 10 hours after recirculation. The ADC reduction was not homogeneous, but ADC gradually declined from the periphery to the center of the lesion in all groups. Because of this gradual change of ADC, the HLV defined by relative ADC thresholds increased with increasing threshold value (Fig. 2).
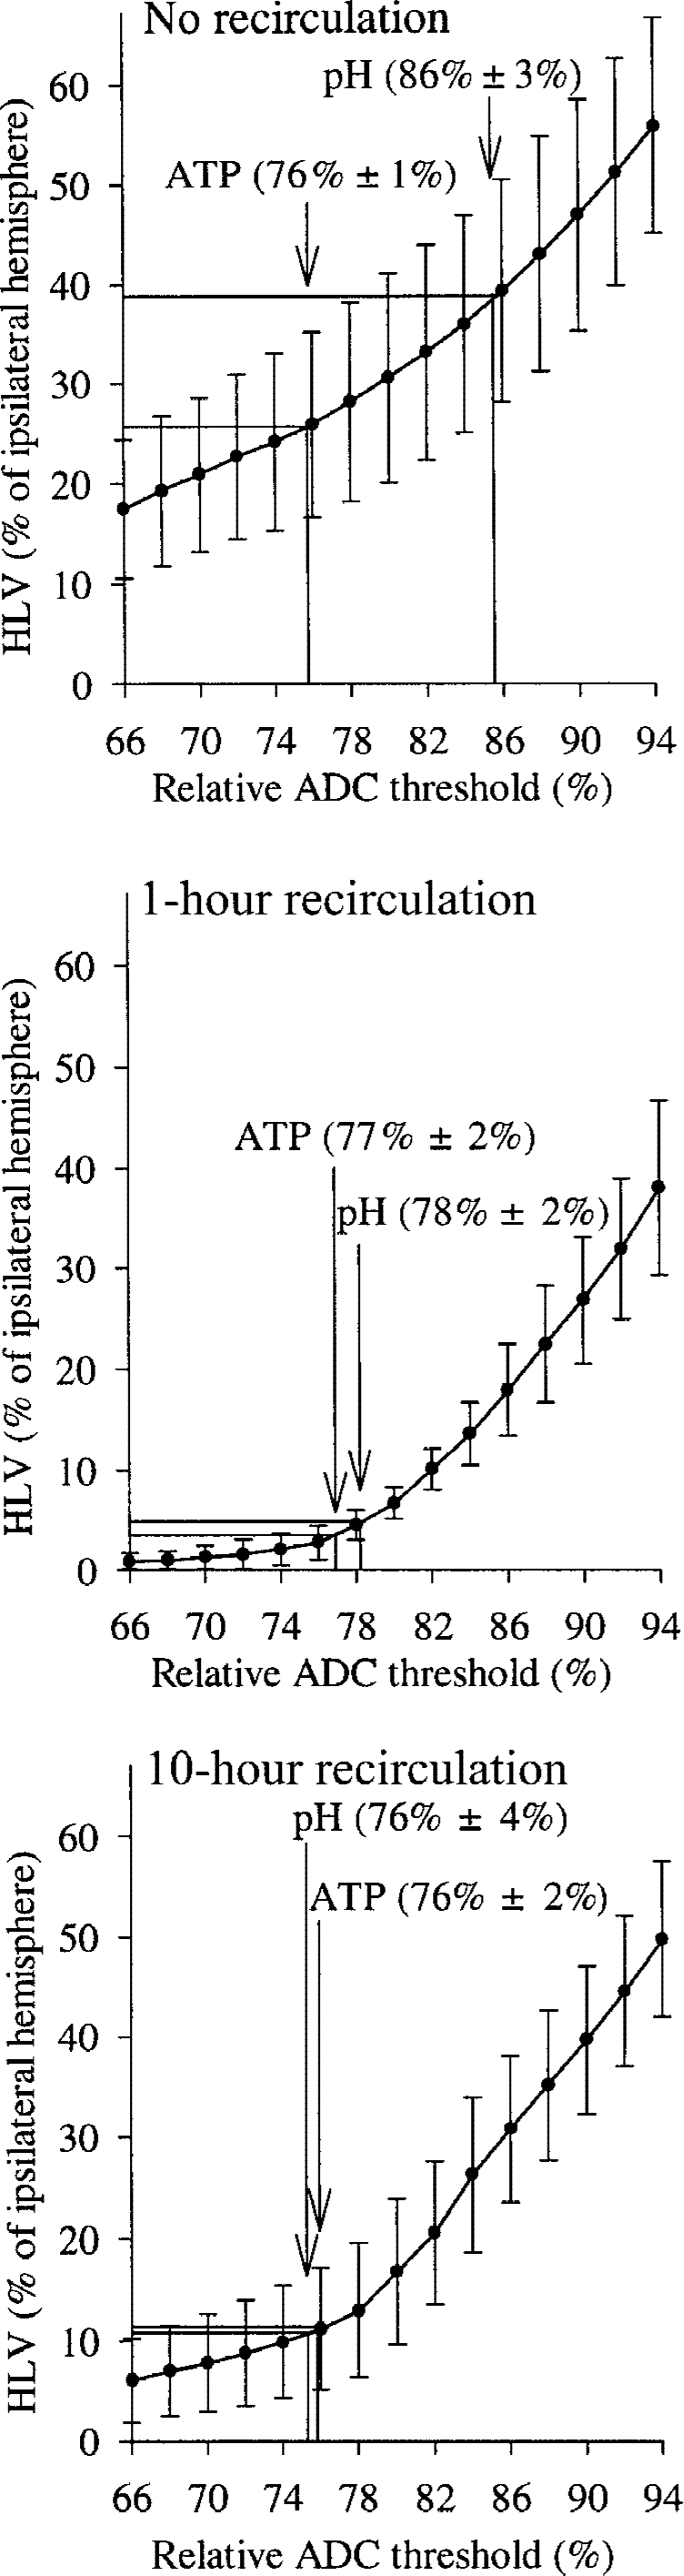
Relation between the hemispheric lesion volumes (HLVs) defined by different relative apparent diffusion coefficient (ADC) thresholds and by ATP depletion and tissue acidosis. This relation is depicted for group 1 (no recirculation), group 2 (1-hour recirculation), and group 3 (10-hour recirculation). These relations were used to determine the thresholds of relative ADC from the HLV values of ATP depletion and tissue acidosis.
Hemispheric lesion volume, measured by ADC decline, ATP depletion, and tissue acidosis
Hemispheric lesion volume was calculated in the three groups using the last relative ADC maps before freezing and is plotted in Fig. 2 for different relative ADC thresholds. Because of the improvement of the ADC in the first hour after restoration of blood flow, the HLV became smaller at the different ADC thresholds, so that the curve was shifted downward in group 2 compared with group 1. However, the curve was shifted upward again 10 hours after restoration of blood flow compared with group 2, indicating a secondary decrease in ADC, which resulted in an increase in lesion volume at different ADC thresholds. To determine the relative ADC thresholds for energy failure and tissue acidosis in the different groups, the obtained HLV values for ATP depletion and acidic pH were inserted into the corresponding relative ADC threshold–HLV graphs. The lesion volume, defined by ATP depletion, was 26.0% ± 10.6% of the ipsilateral hemisphere in group 1, 3.3% ± 2.4% in group 2, and 11.2% ± 4.7% in group 3. These data, much like the ADC data, indicate a partial but significant decrease of the lesion volume defined by breakdown of energy metabolism after 1 hour of recirculation (P < 0.001 vs. group 1) but also show a secondary increase of the lesion volume with ATP depletion 10 hours after recirculation (P < 0.05 vs. group 2). When the relative ADC threshold for the energy failure is read from the corresponding graphs, it shows a consistent value of approximately 77% of control in the different groups and in the different experimental phases.
To compare the regional distribution of the lesion area, defined by energy failure and by the described ADC decline, incidence maps of ATP depletion and of relative ADC less than 77% were constructed in every group. These maps (Fig. 3) show a good spatial relationship between the lesion areas determined by the two examined parameters, but they also suggest a difference between the cortex and the caudate putamen, indicating the poorer outcome during ischemia and reperfusion in the caudate putamen than in the cortex.
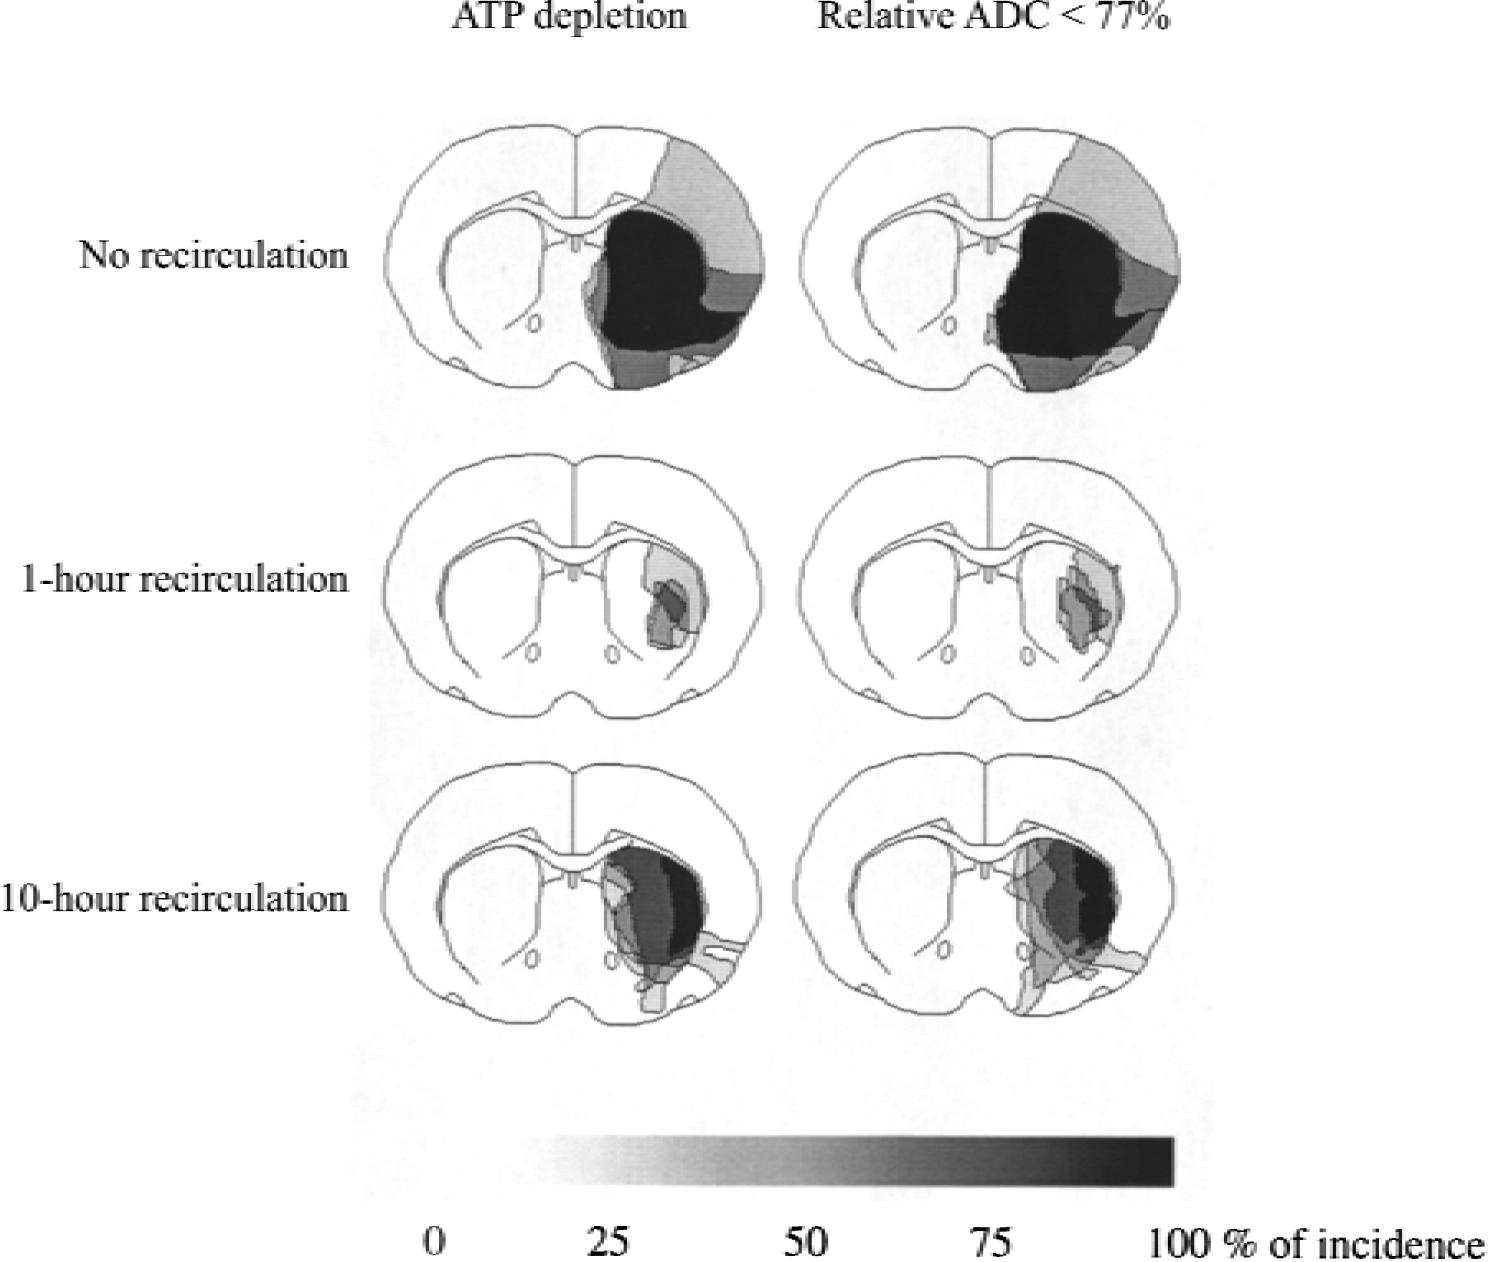
Incidence maps of relative apparent diffusion coefficient (ADC) < 77% of control and ATP depletion on coronal sections of the rat brain at the level of the caudate putamen in the 3 groups. The incidence maps show a good spatial agreement of region with ATP depletion and relative ADC < 77% in all 3 groups, with different reperfusion times. Note transient improvement of ATP and ADC in the early phase of reperfusion, followed by secondary deterioration.
The HLV with tissue acidosis was 38.1% ± 6.5% in group 1, 4.8% ± 3.5% in group 2, and 10.9% ± 5.2% in group 3. This value was larger than the HLV defined by ATP depletion in all animals in group 1 but was comparable with the lesion size of breakdown of energy metabolism in the two recirculation groups. This results in a substantially higher relative ADC threshold for tissue acidosis than for the energy failure in group 1 but comparable thresholds for the two metabolic parameters in both recirculation groups.
Glucose concentration was also measured in the region with ATP depletion and was compared with the value obtained in the corresponding region of the contralateral hemisphere. These data revealed lower glucose concentration in the ATP-depleted tissue during ischemia (0.9 ± 0.4 μmol/g) than in the corresponding region of the contralateral, healthy hemisphere (5.1 ± 0.5 μmol/g, P < 0.001). However, the glucose content was comparable after 1 hour of reperfusion in the ATP-depleted region (5.0 ± 0.8 μmol/g) and in the contralateral hemisphere (4.1 ± 1.4 μmol/g), and it was even higher after 10 hours of recirculation in the ATP-depleted tissue than on the other side (4.7 ± 0.6 and 3.9 ± 0.6 μmol/g, respectively; P < 0.05).
DISCUSSION
Our data indicate partial recovery of the end-ischemic lesion volume 1 hour after recirculation, as defined by ATP content, pH, and ADC. However, secondary deterioration of these parameters was observed 10 hours after restoration of blood flow, despite quick normalization of the perfusion status during the recirculation period. Interestingly, the relative ADC threshold for ATP depletion was approximately 77% of control value during MCAO and at 1 hour and 10 hours after reperfusion, suggesting a stable threshold independent of the experimental phase. In contrast, the relative ADC threshold for tissue acidosis was greater during MCAO (86% of control value) but decreased after reperfusion and approached that for energy failure.
Different relative ADC thresholds for energy failure and tissue acidosis during ischemia
Similar to our previous findings after 2 hours of MCAO (Hoehn-Berlage et al., 1995), these results revealed a larger lesion size with acidic pH than with ATP depletion after 1 hour of focal ischemia, resulting in a higher relative ADC threshold for tissue acidosis than for energy failure. This finding indicates a severe ADC decline in the tissue with energy failure, which can be explained by anoxic depolarization during MCAO, leading to intracellular Na+ accumulation and water shift from the extracellular to the intracellular space (cytotoxic edema). However, the fact that a less severe but significant ADC decrease also occurs in the tissue with acidosis but without energy failure, or before beginning of anoxic depolarization (Harris et al., 2000), suggests that mechanisms other than breakdown of energy metabolism must be responsible for the ADC decline during ischemia. A cerebral blood flow decrease above the threshold of the breakdown of energy metabolism (Hoehn-Berlage et al., 1995a) but low enough to reduce the oxygen availability may shift the tissue into anaerobic glycolysis (Hossmann, 1994). This results in lactate accumulation and may lead to osmotically obliged slight cell swelling without anoxic depolarization. Moreover, the acidosis may activate the Na+/H+ antiport system, leading to increased intracellular Na+ concentration and cell swelling (Harris et al., 2000; Kempski et al., 1988). As discussed in a previous report (Hoehn-Berlage et al., 1995a), the difference of relative ADC threshold for energy failure and tissue acidosis may allow differentiation between the core (defined by ATP depletion) and penumbra regions (defined by the difference of area with tissue acidosis and ATP depletion) during ischemia.
The relative ADC threshold for breakdown of energy metabolism after 1 hour of permanent ischemia found in the present study is in full agreement with the threshold observed at 2 hours of focal ischemia (Hoehn-Berlage et al., 1995a), indicating a stable threshold despite the different duration of MCAO.
Relative ADC threshold for energy failure during reperfusion
The main finding of this study is that the relative ADC threshold for breakdown of energy metabolism is approximately 77% of control not only during ischemia but also at different time points after reperfusion, suggesting that the main mechanism for the ADC change is closely related to the energy level of the tissue also after recirculation. According to the hypothesis that ADC changes reflect the alterations of extra- and intracellular volumes, the parallel increase of ADC and ATP after 1 hour of reperfusion can be explained by activation of Na+/K+ ATPase, leading to elimination of sodium and osmotically obliged water and resulting in restoration of cell volume and an increase in extracellular space. However, significant water influx from the vessels to the brain tissue (Kristian et al., 1998; Mellergard et al., 1989) may also contribute to the restoration of the extracellular space during reperfusion (Hossmann et al., 1988). Sevick et al. (1992) reported that selective intracellular water accumulation causes relatively small ADC change, suggesting that the ADC change is influenced not only by the alterations of the intracellular fluid volume but probably also by the extracellular one. Taking these findings together, one could speculate that the water influx from the vessels to the brain tissue may increase the extracellular volume, leading to normalization of ADC independent of ATP content. However, if ATP depletion persisted, the intracellular Na+ concentration would not be restored, leading to redistribution of the excess water from the extracellular compartment to the intracellular one. Indeed, in the first minutes of recirculation, a further increase in the intracellular volume (Williams et al., 1991) and a decrease in the extracellular space (Hossmann, 1971) were shown, probably happening before resynthesis of ATP. Moreover, if the water influx during reperfusion played a major role in restoration of ADC, it would be difficult to explain the secondary decline of ADC 10 hours after reperfusion, at a time when the more pronounced increase of T2 value (Olah et al., 2000) indicates even stronger water influx into the brain. The fact that the ADC remained low in the region where the ATP failed to recover after 1 hour of recirculation also supports the relation between the energy metabolism and ADC, but not between the water influx and ADC. Our results are in line with the data of Harris et al. (2000), who described the change of the direct current potential toward normalization after reperfusion, followed by ADC improvement. Similar to the present findings, a previous study from our laboratory (Hossmann et al., 1994) also reported a relation between recovery of energy metabolism and normalization of ADC and extracellular space during the recirculation phase after 1 hour of complete ischemia. However, the increase in ADC from its ischemic value alone is not a reliable indicator of recovery, because such ADC “pseudonormalization” has been observed in the chronic stage of tissue necrosis (Knight et al., 1994).
The secondary decline in ADC is simply explained by the secondary breakdown of energy metabolism, because Na+-K+ ATPase cannot eliminate the inflowing Na+ in the absence of high-energy phosphates, leading to intracellular Na+ accumulation and cell swelling. Because acidosis was observed in the region with ATP depletion, activation of the Na+/H+ antiport system could result in a further increase in the intracellular Na+ concentration, and this mechanism may contribute to increase the intracellular volume.
Relative ADC thresholds for tissue acidosis during reperfusion
In contrast with the end-ischemic data, the HLVs defined by tissue acidosis and ATP depletion were similar in both recirculation groups. This observation suggests that acidosis disappears if blood flow and energy metabolism recover after reperfusion, but deteriorates if the ATP content declines secondarily. Restoration of cerebral blood flow can induce postischemic recovery of acidosis in the penumbral region because it leads to restoration of oxidative metabolism and results in washout of acidic metabolites. Recovery of the energy metabolism also promotes restoration of pH homeostasis because the restitution of a sodium gradient by the energy-dependent Na+-K+ ATPase creates the driving force for the Na+/H+ antiport system. Finally, resynthesis of ATP contributes to reversal of acidosis because ATP synthesis requires H+ (Siesjö, 1985). Our data are in accordance with the results of Saito et al. (1992), who reported that the reversal of acidic pH depends on the restoration of ATP content. Others also showed recovery of ATP and pH in the early phase of recirculation (Allen et al., 1988; Behar et al., 1989; Siesjö, 1985), and the rate of recovery of these parameters was shown to be influenced by the duration of the ischemic period (Nishijima et al., 1989).
Limitations
The main finding of this investigation is that the relative ADC threshold of approximately 77% of control provides a good estimate for the alterations of energy metabolism in the different phases of the transient MCAO model. However, this threshold may be altered at the very beginning of reperfusion, when rapid changes in water homeostasis, ATP resynthesis, and restoration of intracellular Na+ content are expected to occur. However, these processes are fast and are completed within the first 15 to 45 minutes after recirculation (Allen et al., 1988; Nishijima et al., 1989), depending on the duration of ischemia. Dissociation of ATP content and ADC values also occurs in the chronic stage of transient or permanent ischemia as a result of the so-called pseudonormalization of ADC (Helpern et al., 1993; Knight et al., 1994; Li et al., 2000; Schlaug et al., 1997). This expression reflects a seeming normalization of ADC days after ischemia without improvement of T2 values, indicating beginning necrosis with cell membrane disruption. However, the observation time periods used in the current investigation (10 hours and 1 hour after reperfusion) were safely before the pseudonormalization of ADC and apparently after the critical very early reperfusion period.
Possible mechanisms of secondary energy failure
The mechanisms of the delayed postischemic damage, indicated by secondary energy failure and ADC decline, are still poorly understood, and several reasons for this phenomenon can be proposed, including mitochondrial dysfunction (Siesjö et al., 1999), the long-lasting inhibition of protein synthesis (Abe et al., 1988; Hata et al., 2000), and delayed hypoperfusion or development of relative hypoxia (Behar et al., 1989; Levy et al., 1979; Nemoto et al., 1975) during reperfusion. Although we have no direct evidence for or against any of these possibilities, the most likely cause of the observed secondary energy failure appears to be secondary mitochondrial dysfunction, which leads to disturbed oxidative phosphorylation. The presence of normal glucose content in our data is in support of this interpretation, indicating that substrate deficiency (glucose) is not the reason for the lack of ATP production. The similar temporal relation of the changes of mitochondrial respiratory function (Canevari et al., 1997; Folbergrova et al., 1995; Kuroda et al., 1996) and the ADC changes observed in our former study (Olah et al., 2000) also supports this hypothesis. Delayed hypoperfusion as a candidate for the secondary deterioration can safely be excluded in the absence of a significant perfusion deficit after reperfusion. However, relative hypoxia could develop even at a normal perfusion level, if the oxygen requirement and consumption are increased during the reperfusion phase and if blood flow is not coupled to such an increased oxygen metabolism (Behar et al., 1989; Nemoto et al., 1975). However, in this case the glucose should also be utilized together with the oxygen, resulting in a lower tissue glucose concentration, which was not observed in the current study.
Regardless of the reasons for the secondary energy failure, our results show that the ADC threshold for ATP depletion was also approximately 77% of the control value during the phase of secondary deterioration of energy metabolism, similar to the ischemic or early reperfusion phase. Taking into consideration these limitations, our results suggest that the quantitative ADC images obtained at different time points during reversible MCAO can be used to follow the alterations of the energy metabolism of the brain tissue longitudinally during the acute phase.
Footnotes
Acknowledgments:
The authors thank Mrs. C. Stratmann for technical assistance with the bioluminescence imaging of ATP and glucose and fluorescence imaging of tissue pH, and Mrs. U. Uhlenküken for assistance during the nuclear magnetic resonance measurements.