
Abstract
Spontaneous episodes of transient cell membrane depolarization (spreading depression [SD]) occur in the surroundings of experimental stroke lesions and are believed to contribute to infarct growth. Diffusion-weighted imaging (DWI) is capable of detecting the water shifts from extracellular to intracellular space associated with SD waves and ischemia, and can make in vivo measurements of these two features on a pixel-by-pixel basis with good temporal resolution. Using continuous high speed DWI with a temporal resolution of 12 seconds over a period of 3 hours, the in vivo contribution of spontaneous SDs to the development of ischemic tissue injury was examined in 8 rats using a thromboembolic stroke model. During the observation period, the initial lesion volume increased in 4 animals, remained unchanged in 1 animal, and decreased in 3 animals (most likely because of spontaneous clot lysis). Irrespective of the lesion evolution patterns, animals demonstrated 6.5 ± 2.1 spontaneous SDs outside of the ischemic core. A time-to-peak analysis of apparent diffusion coefficient (ADC) changes for each SD wave demonstrated multidirectional propagation patterns from variable initiation sites. Maps of the time constants of ADC recovery, reflecting the local energy supply and cerebral blood flow, revealed prolonged recovery times in areas close to the ischemic core. However, repetitive SD episodes in the periinfarct tissue did not eventually lead to permanent ADC reductions. These results suggest that spontaneous SD waves do not necessarily contribute to the expansion of the ischemic lesion volume in this model.
Keywords
Spreading cortical depression (SD) is a transient depression of cortical activity that propagates across the cerebral cortex at a rate of approximately 3 mm/min (Leao, 1944). It can be evoked by several types of stimuli, such as intense neuronal activity, trauma, raised extracellular potassium, and ischemia (Hossmann, 1996). Although the existence of SD in humans is still a matter of speculation, these phenomena may contribute to the pathophysiology of trauma, migraine, or stroke (Mayevsky and Weiss, 1991; Cao et al., 1999). Using intracortical microelectrodes for the recording of direct current (DC) potentials, spreading depression—like transient periinfarct depolarizations were first described by Nedergaard in 1986 (Nedergaard and Astrup, 1986). Since then this observation has been corroborated by many studies in different laboratory animals (Hossmann, 1996). Spreading depression episodes are accompanied by marked changes in local cerebral blood flow, oxygen consumption, metabolic rate of glucose, protein synthesis, and interstitial ion concentrations, with Na+ CL− and water flowing into the cells resulting in shrinkage of extracellular space and cellular swelling (Hossmann, 1996; Kocher, 1990; Mayevsky and Weiss, 1991; Nedergaard and Hansen, 1993). These changes associated with SDs can be monitored with a variety of invasive and noninvasive techniques, including DC potential measurements (Hossmann, 1996), functional magnetic resonance (MR) (Gardner-Medwin et al., 1994), magnetoencephalography (Chen et al., 1992), near infrared spectroscopy (Wolf et al., 1997), and diffusion-weighted magnetic resonance imaging (MRI) (de Crespigny et al., 1998; Els et al., 1997; Hasegawa et al., 1995; Rother et al., 1996a,b; Takano et al., 1996). Diffusion-weighted imaging (DWI) detects the water shifts from extracellular to intracellular space associated with SD episodes and a good temporal agreement between transient changes of the apparent diffusion coefficient (ADC) and DC potentials has been reported (de Crespigny et al., 1998). In addition, DWI can delineate changes of the ADC within minutes after onset of cerebral ischemia, reflecting shifts of water towards the intracellular compartment as a result of acute energy failure (Moseley et al., 1990). Thus, DWI is able to monitor changes of the ADC that are related to SD and ischemia simultaneously, and can make measurements of these two features on a pixel-by-pixel basis with good temporal resolution (de Crespigny et al., 1998; Mayevsky et al., 1996; Rother et al., 1996a,b; Takano et al., 1996).
In the intact animal brain, repetitive generation of SD is coupled to an adequate increase in blood flow and does not cause neuronal injury (Nedergaard and Hansen, 1988). In contrast, several studies indicate that spreading depression—like episodes occurring in the periinfarct region possibly contribute to the expansion of ischemic brain injury (Back et al., 1996; Busch et al., 1996; Chen et al., 1993; Gill et al., 1992; Iijima et al., 1992; Mies et al., 1993; Takano et al., 1996). Using DWI to map the in vivo lesion growth over time in rodents, it was shown previously that externally induced SDs cause an expansion of the ischemic lesion (Busch et al., 1996; Takano et al., 1996). However, externally evoked SDs in focal models of ischemia constitute an additional stress to the already ischemic tissue and may distort the natural course of infarct evolution. Although a relation between the number of spontaneous periinfarct SDs and infarct size has been reported (Chen et al., 1993; Iijima et al., 1992; Mies et al., 1993; Takano et al., 1996; Tatlisumak et al., 1998), this finding could simply be an epiphenomenon as larger infarcts may produce more SDs. In addition, results obtained with the most widely used intraluminal suture model might not be directly applicable to the human situation in which thromboembolism is the major cause of stroke. To overcome this limitation thromboembolic stroke models in animals have been proposed recently (Busch et al., 1997; Zhang et al., 1997).
The aim of the current study was to examine the in vivo contribution of spontaneous SDs to the development of focal brain ischemia using continuous high speed diffusion MRI over a period of 3 hours after thromboembolic stroke in rats. A preliminary report of this research has been presented previously (de Crespigny et al., 1999).
MATERIALS AND METHODS
Animal preparation and experimental protocol
All procedures were approved by the Administrative Panel on Laboratory Animal Care of the authors' institution. Focal cerebral ischemia was introduced in 9 adult male Sprague-Dawley rats weighing 260 to 280 g. All animals were initially anesthetized with 3% halothane in a mixture of air (80%) supplemented with oxygen (20%) through a passive flow face mask. Anesthesia was maintained with 0.75% to 1.5% halothane throughout surgery and imaging. Heart rate and SaO2 were continuously monitored by a pulse oxymeter. Body temperature was maintained at 37°C ± 0.5°C by means of a warm air circulation system and measured using a rectal probe. The right femoral vessels were cannulated with PE-50 tubing for continuous blood pressure monitoring, to obtain arterial samples for blood gas analysis, and for fluid substitution. Blood pressure was recorded continuously by a Macintosh computer data acquisition system (MacLab, CB Sciences, Dover, NH, U.S.A.).
In all animals, thromboembolic stroke was induced by intra-carotid injection of fibrin-rich autologous clots as described in detail previously (Busch et al., 1997, 1998). Briefly, all branches of the right common carotid and external carotid artery were isolated and ligated. The internal carotid artery then was isolated and its extracranial branch, the pterygopalatine artery, was ligated close to its origin. A 1-m-long PE 50 tube containing 12 to 14 autologous blood clots was introduced into the transected lumen of the internal carotid artery and embolization was performed inside the magnet.
Fibrin-rich autologous blood clots were prepared 4 hours before the experiments by injecting 0.6 mL arterial blood with 0.15 mL thrombin (1 mg/mL) into PE 50 tubes. After approximately 1 hour, the clots were removed from the tubes and rinsed thoroughly with saline. Under the operating microscope, fibrin-rich segments were chosen and cut into clots 1.5 mm in length. Subsequently, 12 to 14 of these clots were suspended in a solution of albumin and phosphate-buffered saline (1 mg/mL) and injected onto a 1-m-long PE 50 tube.
Magnetic resonance imaging
Magnetic resonance experiments were performed on a 2.0 T GE CSI system (Bruker, Fremont, CA, U.S.A.) using a spin echo echoplanar imaging technique with the following parameters: echo time (TE) = 50 milliseconds, repetition time (TR) = 3 seconds, field of view = 40 mm, 2 mm slice thickness, 64 × 64 matrix. Rats were immobilized in a stereotactic holder that was positioned in an animal cradle. For all studies, a homemade transmit and receive surface coil 2.5 cm in diameter was used. Three contiguous axial slices (parallel to the surface coil) covered the rat brain, with the pulse flip angle optimized separately for each slice. For each slice, three spin echo diffusion-weighted images were acquired (δ = 10 milliseconds, Δ = 13 milliseconds, with b-values of 0 s/mm2 and 1300 s/mm2 repeated twice) followed by a gradient echo (GE) image (TE = 40 milliseconds). This sequence of 4 images for each slice was repeated continuously before and for 3 hours after embolization. In 1 animal, images were acquired up to 6 hours after embolization. Magnetic resonance protocol began with a high-resolution spin echo diffusion examination to screen for animals with preocclusion ischemia. Blood clots were injected approximately 15 minutes after the start of the serial diffusion-weighted imaging.
Data analysis
Data were transferred to an off-line Sun Ultra 10 workstation (Sun Microsystems, Mountain View, CA, U.S.A.) for postprocessing with the use of MRVision image display software (MR Vision, Menlo Park, CA, U.S.A.). Diffusion-weighted data were processed to generate 900 ADC maps for each slice with a temporal resolution of 12 seconds (Latour et al., 1994). To determine the lesion volume of the ADC maps for each slice on a pixel-by-pixel basis, data were interpolated to 128 × 128 pixels and the ADC values normalized to the preembolization baseline value. Two thresholds were chosen for the purpose of defining the region of ADC decrease. A threshold of 75% of baseline was chosen to delineate critically ischemic areas, because this is approximately the ADC change shown to correspond to severe tissue acidosis (Hoehn-Berlage et al., 1995a,b) and the 2,3,5-triphenyltetrazolium chloride staining (TTC) defined lesion extent (Dardzinski et al., 1993). A higher threshold of 85% of baseline was selected to give greater sensitivity to small ADC changes, especially SDs (although transient ADC changes close to the lesion were of comparable size to the ADC drop in the core, transients far from the core and at the edge of the brain were smaller, possibly because of partial volume effects). For each threshold value, the area of ADC decrease was calculated on each slice and at each of the 900 time points using an automated region-growing algorithm that was built into the display software. Lesion volumes were calculated by multiplying the areas by the slice thickness and summing over three slices.
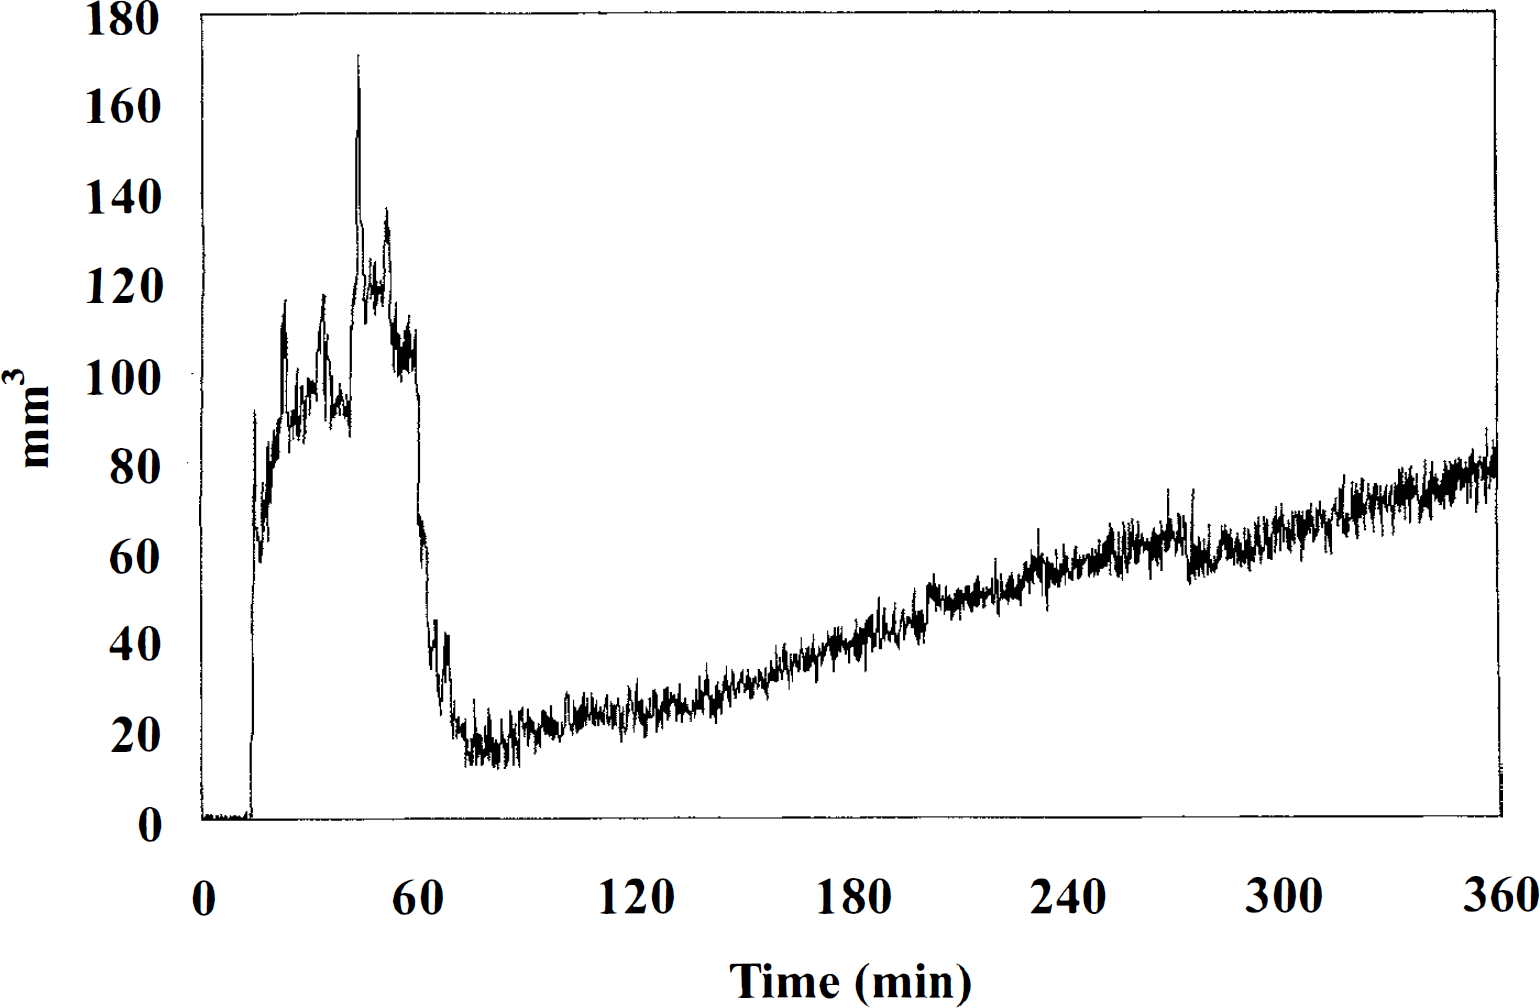
To visualize the characteristics of the periinfarct SD waves, a model function describing the shape of the transient was fitted to the ADC time course for each SD episode. The model chosen was a simple mathematical description of the observed ADC transients during SD and consisted of the back-to-back exponential function described below:
where TTP is the time point of the greatest ADC change (that is, the time-to-peak), Tdec and Trec are the time exponential time constants for the decay and recovery part of the transient, and c is a constant. This function was fitted to the serial ADC maps for each SD episode using a nonlinear least squares minimization algorithm, and parametric maps of the time-to-peak (TTP) and the rate of ADC recovery (Trec) were generated for each slice. Time-to-peak maps give a graphical representation of how each SD wave propagates in three dimensions over the brain and can be used to determine the initiation site of each wave. The ADC recovery rate is directly related to the rate of repolarization after SD and is thus dependent upon the local energy supply and cerebral blood flow (Mies, 1997; Rother et al., 1996b).
In a separate analysis of the transient ADC waveforms, a series of 5 to 6 square nonoverlapping regions of interest (ROI) (2 × 2 pixels) were manually defined, ranging from the ischemic core towards the periphery on a representative slice for each animal. The ischemic core was defined as the area showing an ADC decrease without recovery after the initial SD episode. For each ROI, the ADC changes were plotted as a function of time and mean, and SD values of the total depolarization time (defined as the sum of the decay and recovery time of the transient ADC wave) for each SD episode was determined.
Gradient echo data were processed by normalizing signal changes to the preembolization baseline and plotting the relative signal change for core and periinfarct ROIs over the time course. Signal loss in GE images occurs during ischemia (de Crespigny et al., 1992) because of increased deoxyhemoglobin concentration (the blood oxygen level-dependent [BOLD] effect). A transient signal increase in GE images occurs during SD in normal brain as a result of a transient cerebral blood flow (CBF) increase (Gardner-Medwin et al., 1994).
Data are given as means ± SD. Changes in lesion volumes were tested using a paired t-test statistic. Linear regression analysis was used to correlate the lesion volumes of the ADC maps with the total number of spontaneous SDs. P < 0.05 was accepted as significant.
RESULTS
Physiology
Physiologic parameters remained within the normal physiologic range throughout the experiments: mean arterial blood pressure, 97 ± 8; pH, 7.37 ± 0.07; Pa
Evolution of apparent diffusion coefficient—defined lesions
Because of technical problems with the MRI data acquisition, one rat was excluded from further analysis. Immediately after clot injection, all animals showed areas with variable ADC declines and the extent of the initial lesion on the ADC maps varied from 99 mm3 to 237 mm3. Over the observation period of 3 hours, the initial lesion volume increased from 172 ± 69 mm3 to 238 ± 64 mm3 in 4 animals (P < 0.05), decreased from 103 ± 26 mm3 to 19 ± 18 mm3 in 3 animals (P = 0.06), and remained unchanged in 1 animal (107 mm3). The decreasing lesion sizes in three animals most likely reflects spontaneous clot lysis.
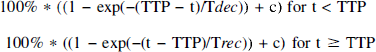
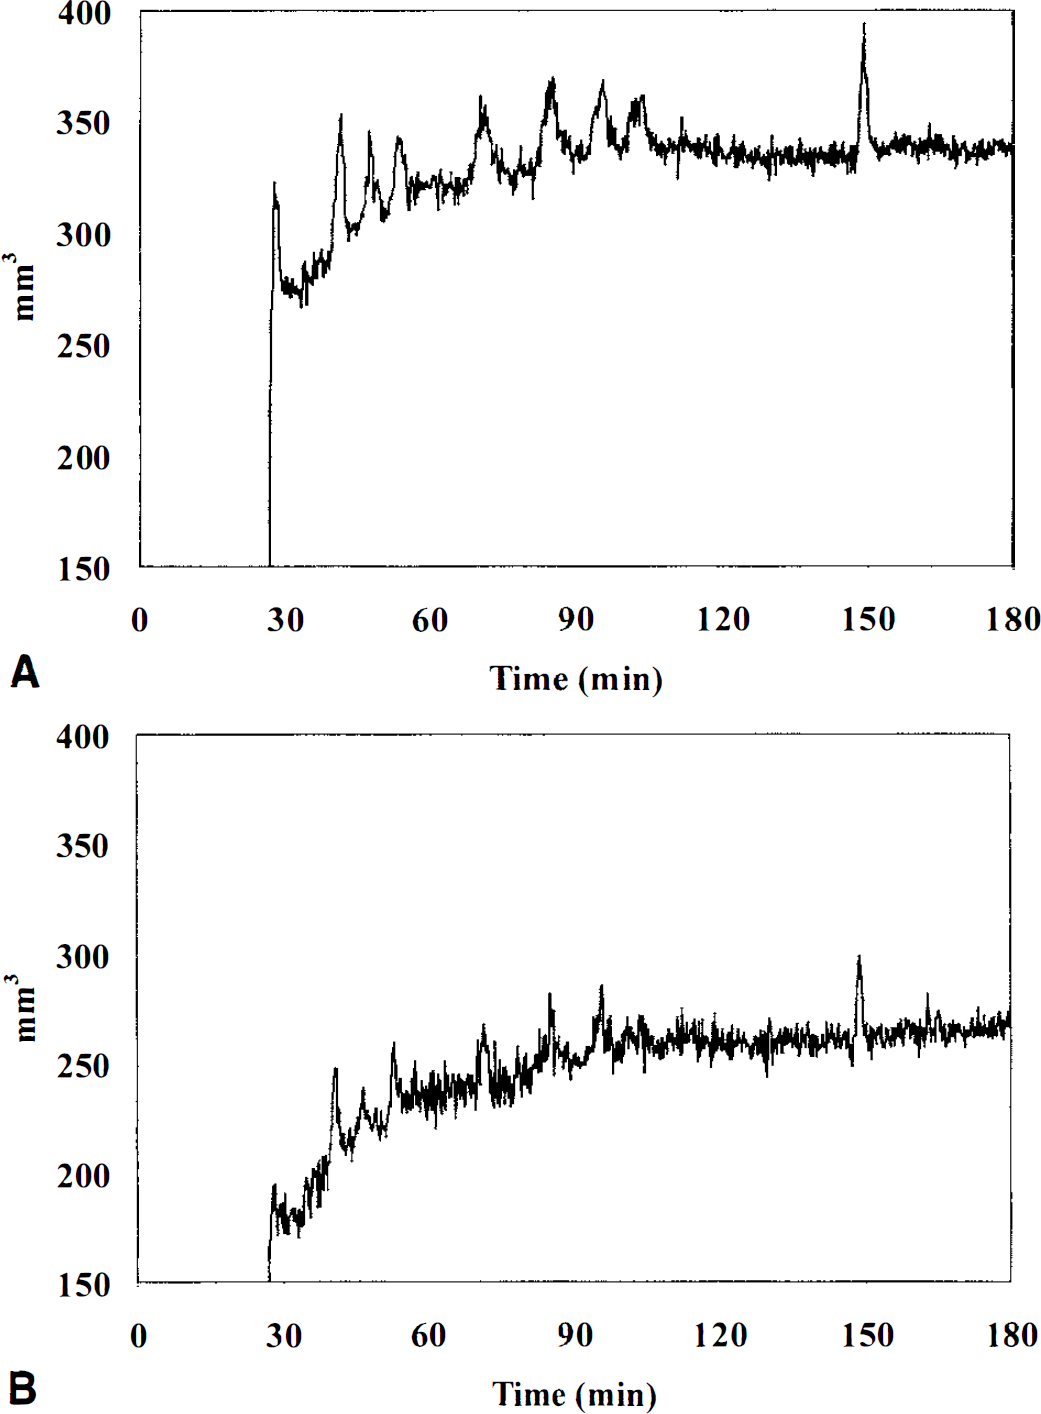
A representative example of the quantitative evolution of the ADC-defined lesion in one rat with permanent ischemia is shown in Fig. 1. Using the more sensitive high ADC threshold of 85% of control, nine spontaneous SD waves can be clearly detected by the transient increase in the lesion size (Fig. 1A). Using an ADC threshold of 75% of control, the initial ischemic lesion increased from 180 mm3 to 268 mm3 within the observation period of 2.5 hours after injection of the clots (Fig 1B). Serial changes of the ADC-defined lesion in one animal with transient ischemia is illustrated in Fig. 2. Initial ADC changes recovered almost completely after 1 hour and despite decreasing lesion, 6 SDs (some of which have merged together) can be seen.
Evolution of the ischemic injury for all three axial slices (mm3) over time. Plots show a typical example of one animal with a permanent lesion.
Evolution of the ischemic injury for all three axial slices (mm3) over time. Plots show a typical example of one animal with a transient lesion.
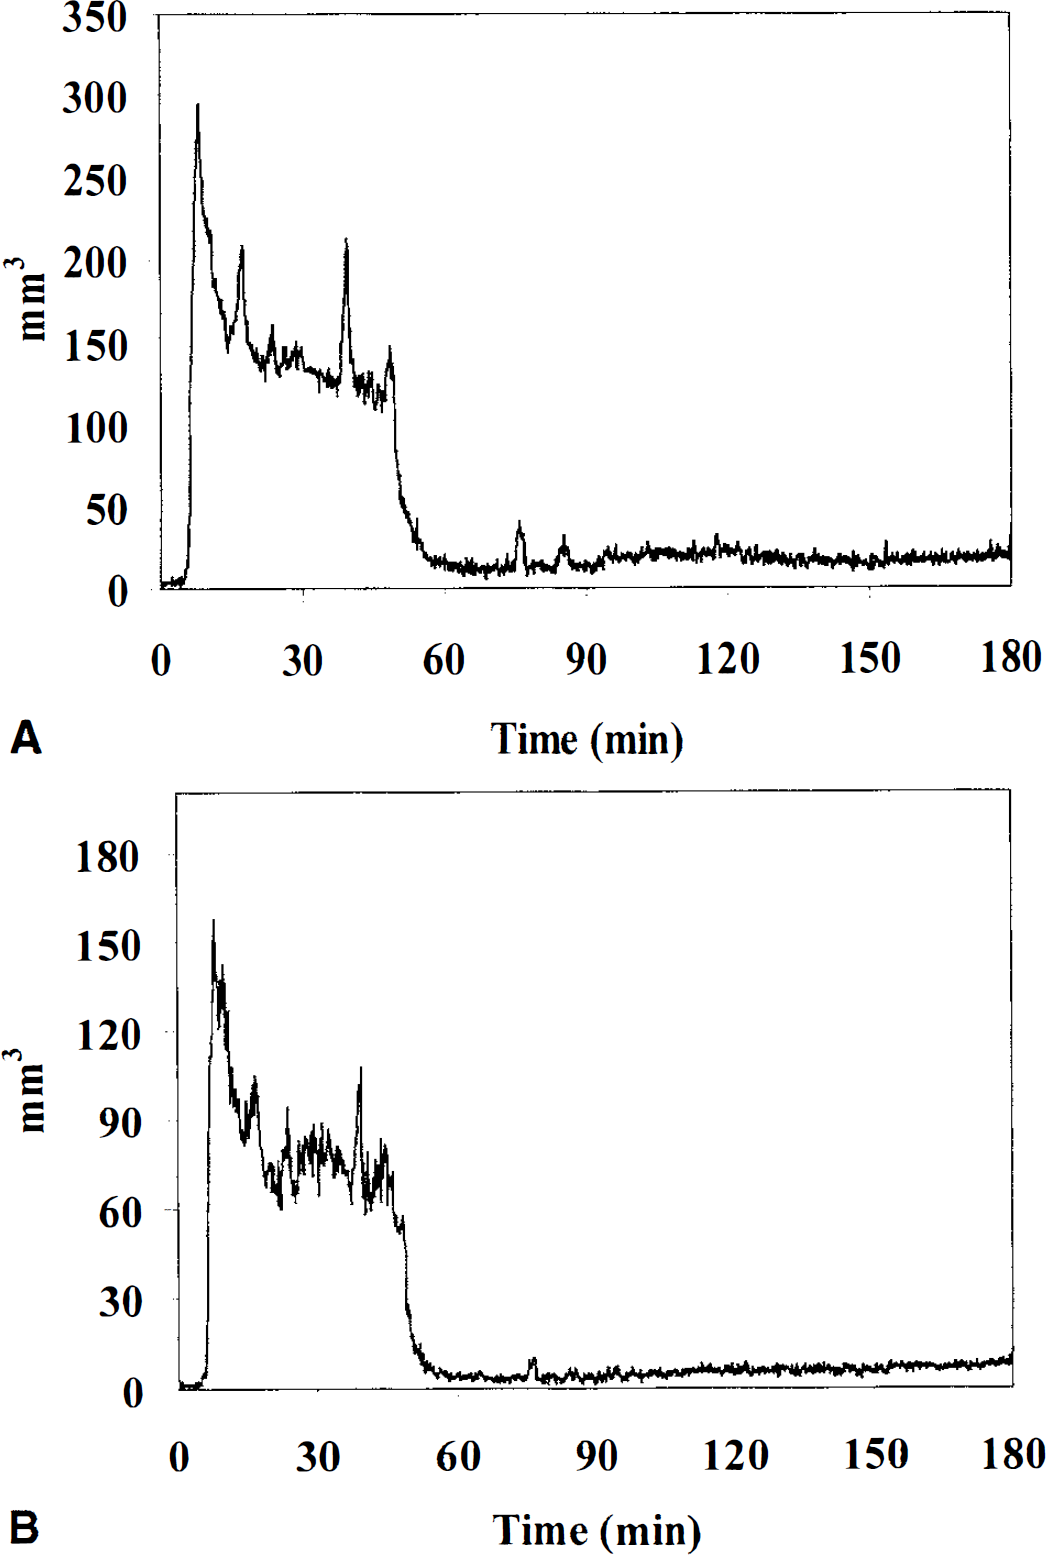
In one rat, the evolution of the ischemic lesion and the occurrence of spontaneous SDs were monitored for 6 hours after embolization (Fig. 3). In this animal, 6 SD episodes occurred after embolization and the infarct size suddenly decreased after approximately 1 hour. However, there was a renewed and steady increase of the ischemic lesion after 2 hours, almost reaching the initial size after 6 hours.
Evolution of the ischemic injury for all three axial slices (mm3) in one animal over an observation period of 6 hours. This animal had 6 spreading depression episodes after embolization and the lesion size suddenly decreased after approximately 1 hour. A renewed and steady increase in lesion size can be seen after 2 hours, almost reaching the initial ischemic lesion volume after 6 hours.
Periinfarct depolarizations
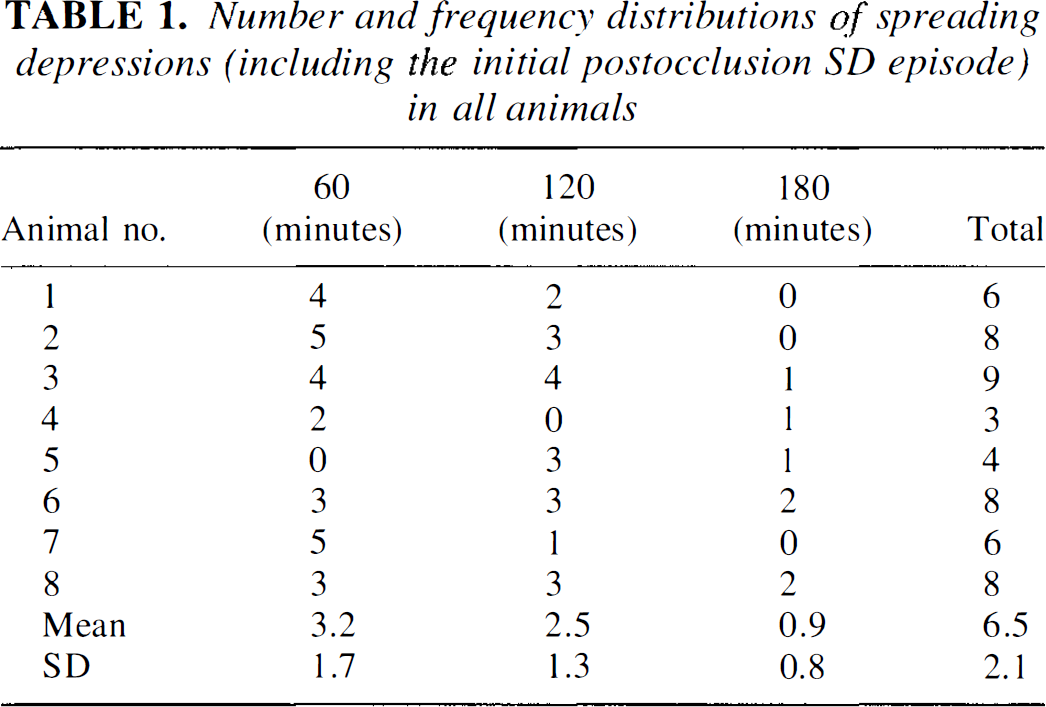
No SDs were observed before induction of thromboembolic stroke and an initial SD could be seen in all animals within minutes after injection of the clots. All animals showed transient spreading ADC declines outside of the ischemic core, which were strictly confined to the ipsilateral hemisphere and limited to the cortex. Waves of decreased ADC originated at the border of the core and traveled towards the normal surrounding tissue. The number and frequency of distributions of these spontaneous SDs (including the initial postocclusion SD episode) for all rats is summarized in Table 1. The total number of SDs was variable across animals, ranging from 3 to 9 over the 3-hour observation period. Frequency of the spontaneous SDs was greatest in the first hour after thromboembolism and decreased with time thereafter. For all animals, the number of SDs was neither correlated with the extent of the initial ADC-defined lesion volume (r = 0.1; P = 0.8), nor with the lesion volume after 3 hours (r = 0.1; P = 0.8). A subanalysis of the four animals with increasing lesion sizes revealed similar results.
Number and frequency distributions of spreading depressions (including the initial postocclusion SD episode) in all animals
Analysis of spreading depression characteristics
Maps of the time-to-peak (TTP) ADC declines were used to delineate the origin site (with short TTP) and propagation pattern (with increasing TTP) of SD waves. In Fig. 4 (same animal as in Fig. 1), TTP maps demonstrate the propagation pattern of nine consecutive SDs in a rat with permanent ischemia away from the initiation sites. In this animal, the SD waves originated from two different parts of the infarct (arrows on the highest and lowest slices) and spread multidirectionally into the surrounding periinfarct tissue. Notably, the ischemic lesion primarily increased in areas showing no transient ADC changes (double arrows in Fig. 1).
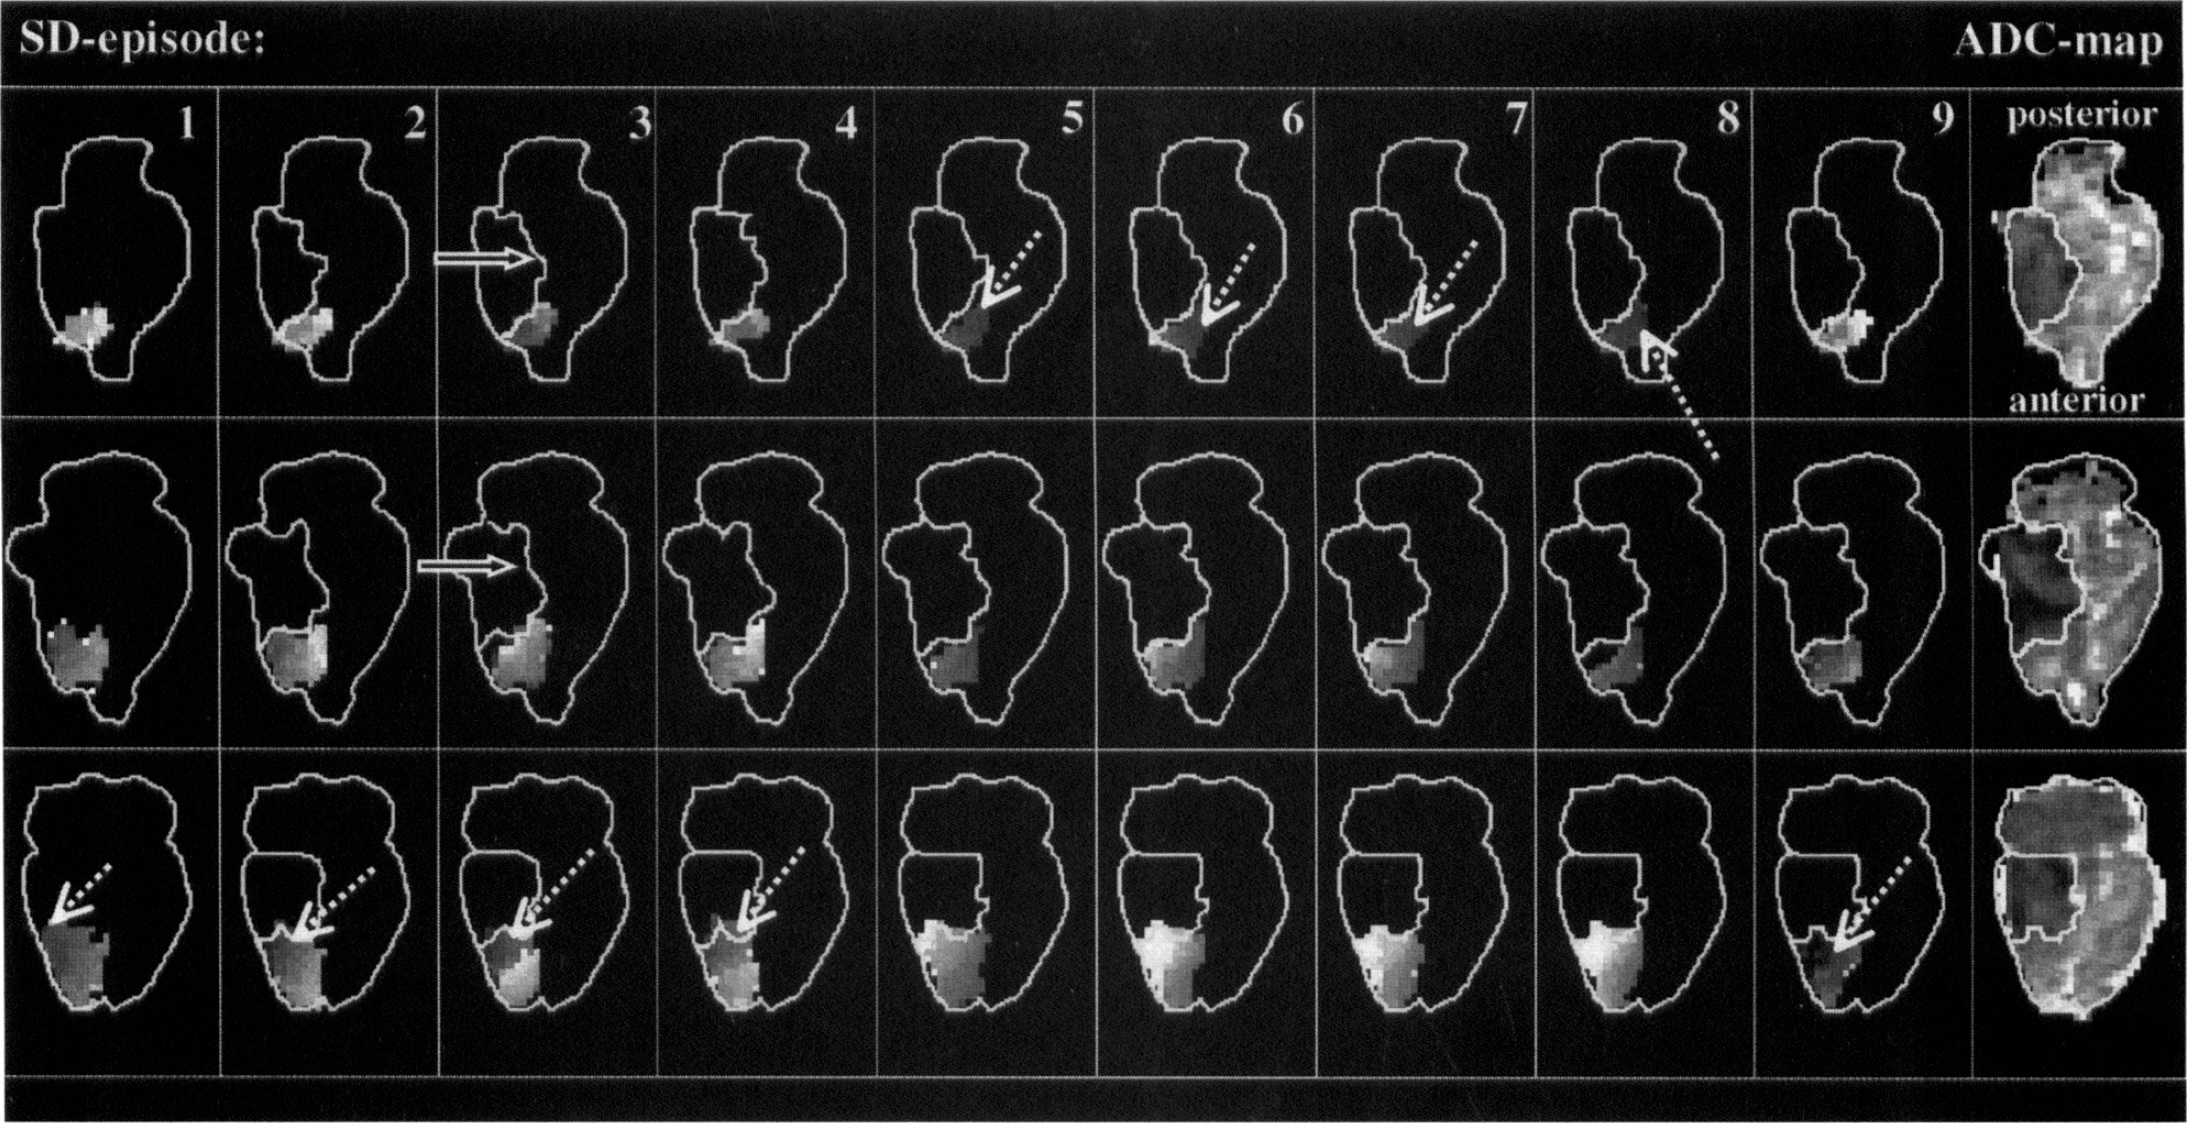
Maps of the times-to-peak apparent diffusion coefficient (ADC) declines (dark = early; bright = late, grayscale from 90 to 300 seconds) for all 9 spreading depression (SD) episodes and ADC maps of the final lesion after 3 hours in an animal with permanent ischemia. Origin sites of each SD wave (dotted arrows) and lesion volumes before each episode are delineated. Spreading depression waves originate from two different parts of the infarct (on the highest and lowest slices) and spread multidirectionally into the periinfarct surrounding. There is no spread of SDs into the ischemic core. The ischemic lesion mainly increased in areas not showing transient ADC changes (solid arrows).
Time-to-peak ADC decline maps for a representative animal with transient ischemia are depicted in Fig. 5 (same animal as in Fig. 2). A single origin of six SD waves can be seen. Although no detectable lesion exists after the fourth SD episode, subsequent SD waves did not propagate into the initial ischemic field.
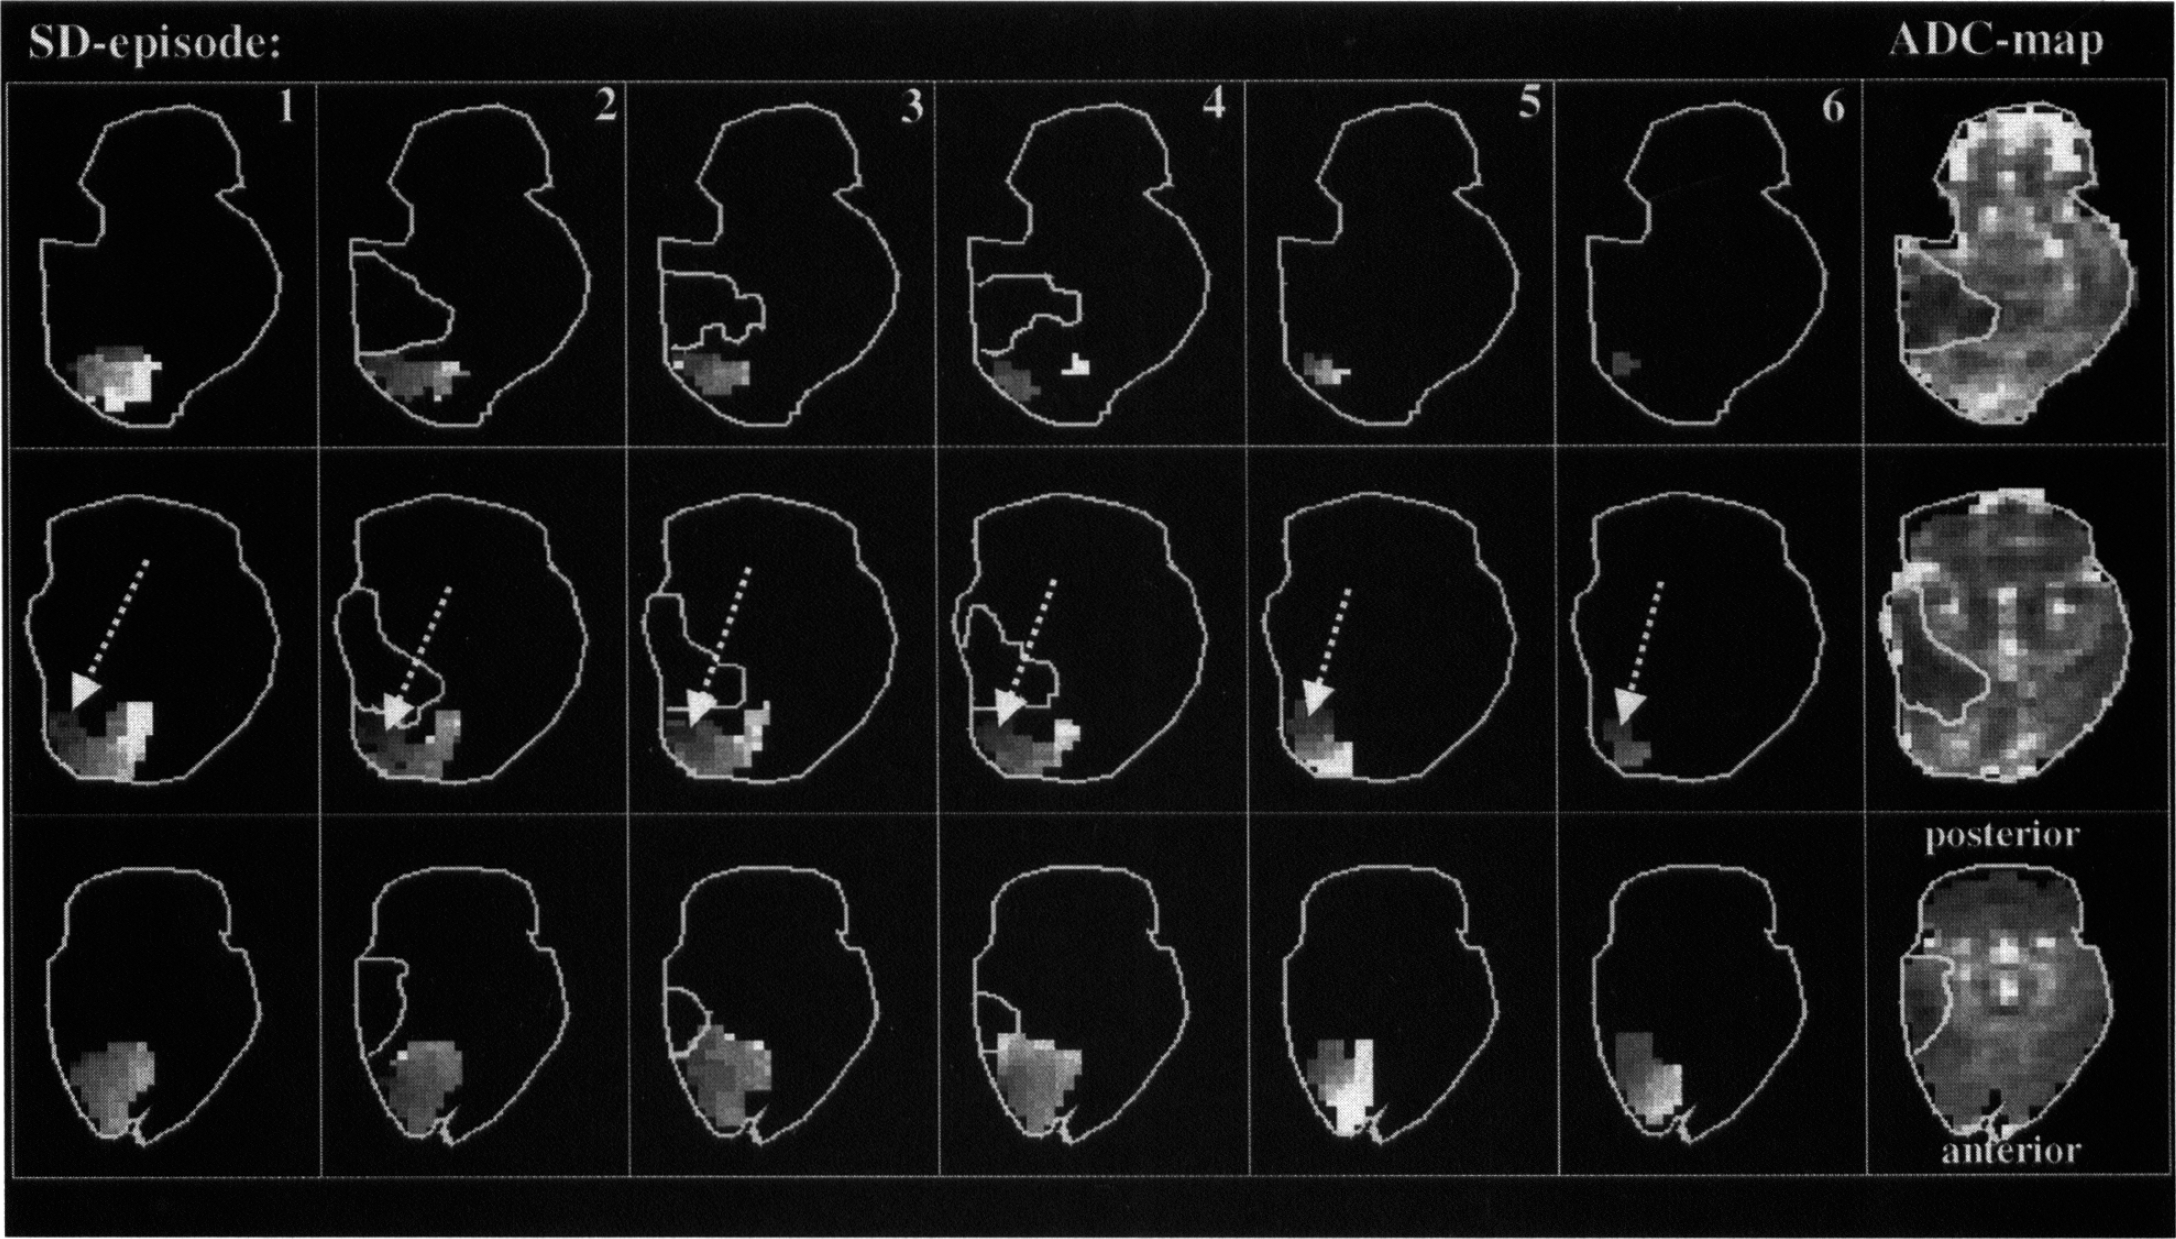
Maps of the times-to-peak apparent diffusion coefficient (ADC) declines (dark = early; bright = late, grayscale from 90 to 300 seconds) for all 6 spreading depression (SD) episodes and ADC maps of the maximal lesion in an animal with transient ischemia. One origin site for all SD waves (arrows) and lesion volumes before each episode are delineated. Note the lack of propagation of SD waves into the initial ischemic field.
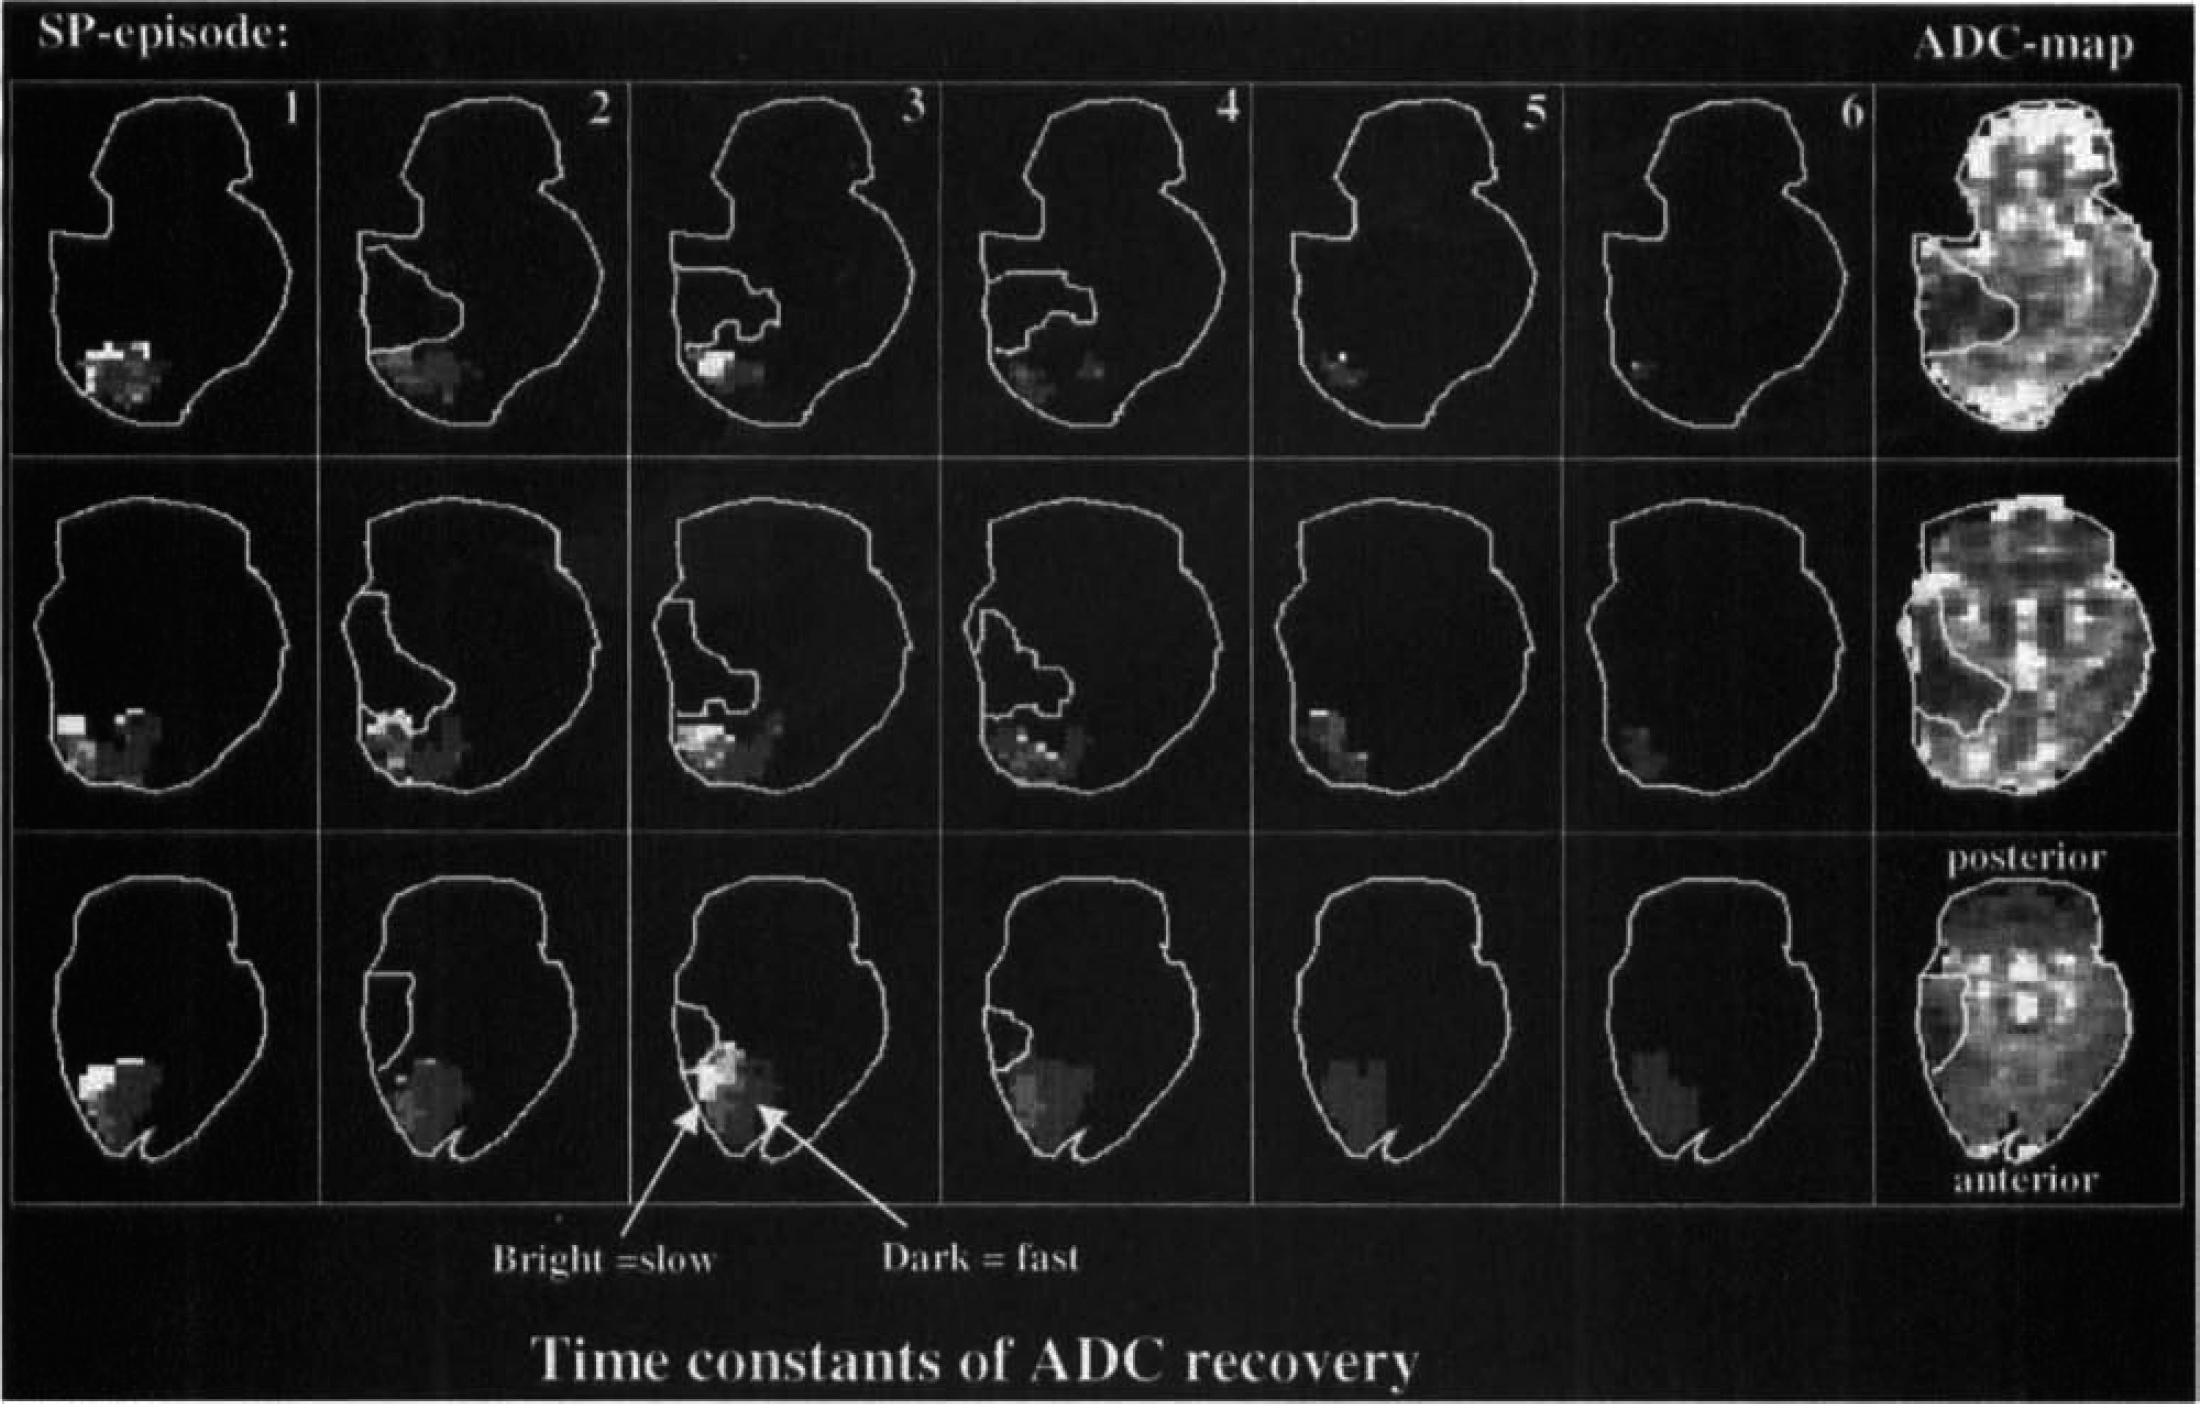
Against the background of recent observations showing increasing depolarization times after several SD episodes with eventual terminal depolarization (Dijkhuizen et al., 1999; Graf et al., 1995), the authors determined the ADC recovery times of each SD wave on a pixel-by-pixel basis. Because the recovery times of SD transients reflects the tissue perfusion deficit (Mies, 1997; Rother et al., 1996b) and restriction of energy availability will lengthen the recovery time, this analysis indirectly assesses the aggravating effect of SDs on the ischemic injury. Maps of the time constants of ADC recovery for each SD episode in an animal with a permanent or a transient lesion (for direct comparability the same animals as in Figs. 4 and 5) are shown in Figs. 6 and 7, respectively. In accordance with previous observations of prolonged SD episodes in regions with impaired tissue perfusion (Mies, 1997; Rother et al., 1996b), the recovery times were prolonged in areas close to the initial ischemic field (bright pixels on images) in both animals. However, increasing recovery times with each SD episode and a subsequent increase in lesion size cannot be seen (Fig. 6). In the animal with transient ischemia, recovery times reveal a more homogenous distribution after the lesion disappeared (see Fig. 7, 5th and 6th SD episode).
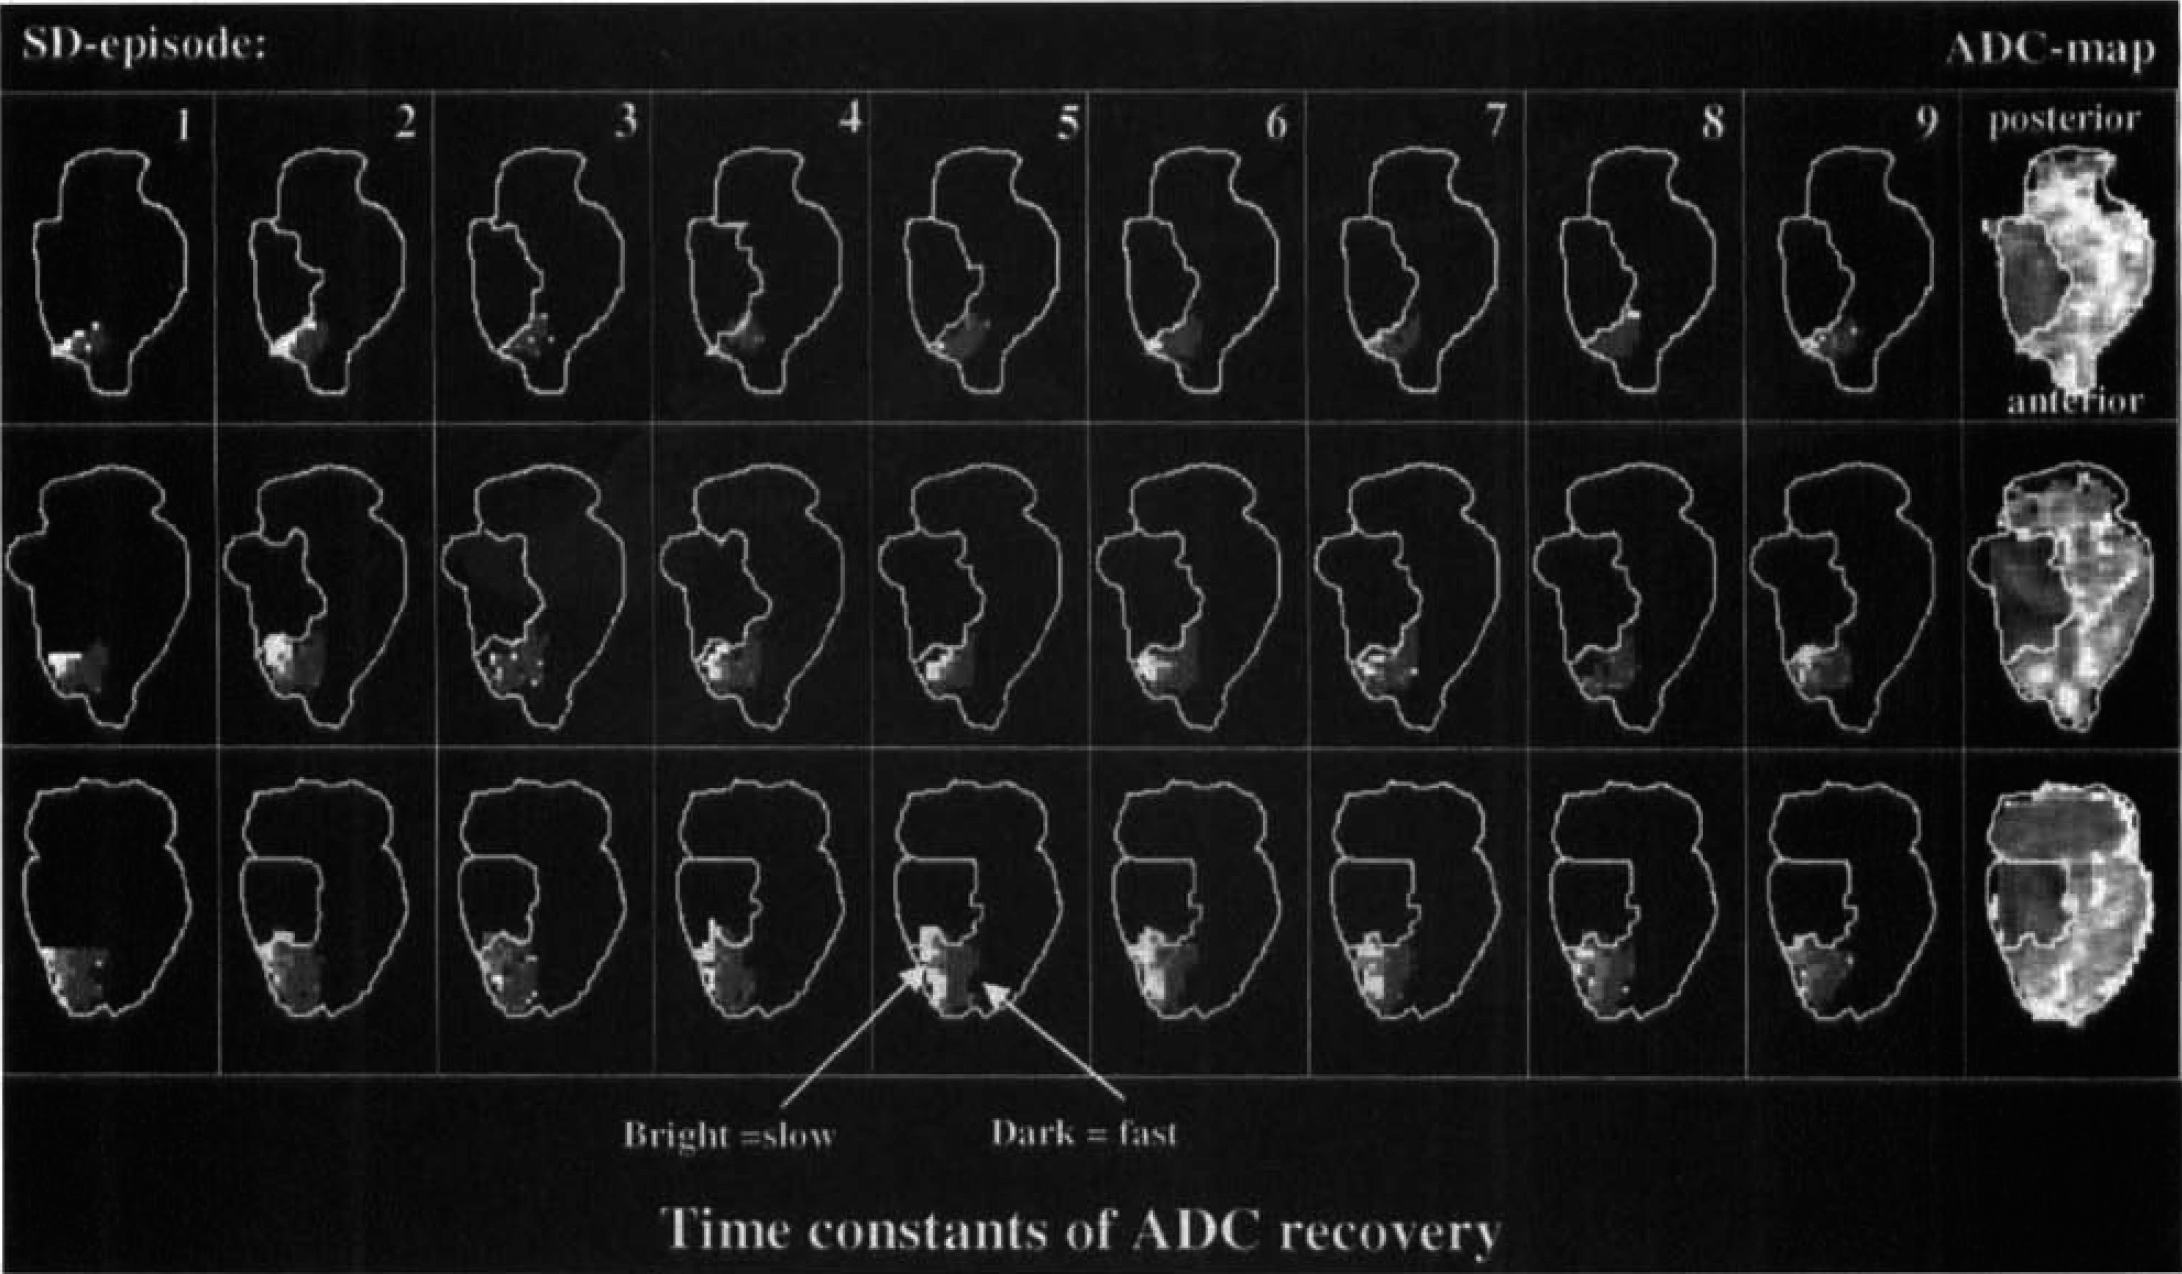
Maps of the time constants of apparent diffusion coefficient (ADC) recovery (dark = fast; bright = slow, grayscale from ~20 to 180 seconds) for all 9 SD episodes and ADC maps of the final lesion after 3 hours in an animal with permanent ischemia (same animal as in Fig. 4). Lesion volumes before each episode are delineated. Recovery times are prolonged in areas close to the ischemic core (bright pixels on images), however, increasing recovery times with each SD episode and a subsequent increase in lesion size cannot be seen.
Maps of the time constants of apparent diffusion coefficient (ADC) recovery (dark = fast; bright = slow, grayscale from −20 to 180 seconds) for all 9 SD episodes and ADC maps of the maximal lesion in an animal with transient ischemia (same animal as in Fig. 5). Lesion volumes before each episode are delineated. Recovery times are prolonged in areas close to the initial ischemic field (bright pixels on images). Recovery times reveal a more homogenous distribution after the lesion disappears (5th and 6th SD episode).
Region of interest analysis
To further quantify the durations of the ADC transients, an ROI analysis was performed to determine the total depolarization time (minutes) for each SD episode and animal individually (Fig. 8). According to Nedergaard and Hansen (1993), transient depolarizations in the periinfarct tissue can be divided into ischemic depolarizations (with depolarization times of 10 ± 5 minutes) and into spreading depression—like depolarizations (with depolarization times of 5 ± 3 minutes). Although these two categories of depolarizations were not differentiated in this analysis, the arrows in Fig. 8 indicated that some SD episodes had longer total depolarization times than others and were possibly analogous to ischemic depolarizations. These long SD episodes could be detected in all periinfarct ROIs and seemed to occur in a random fashion.
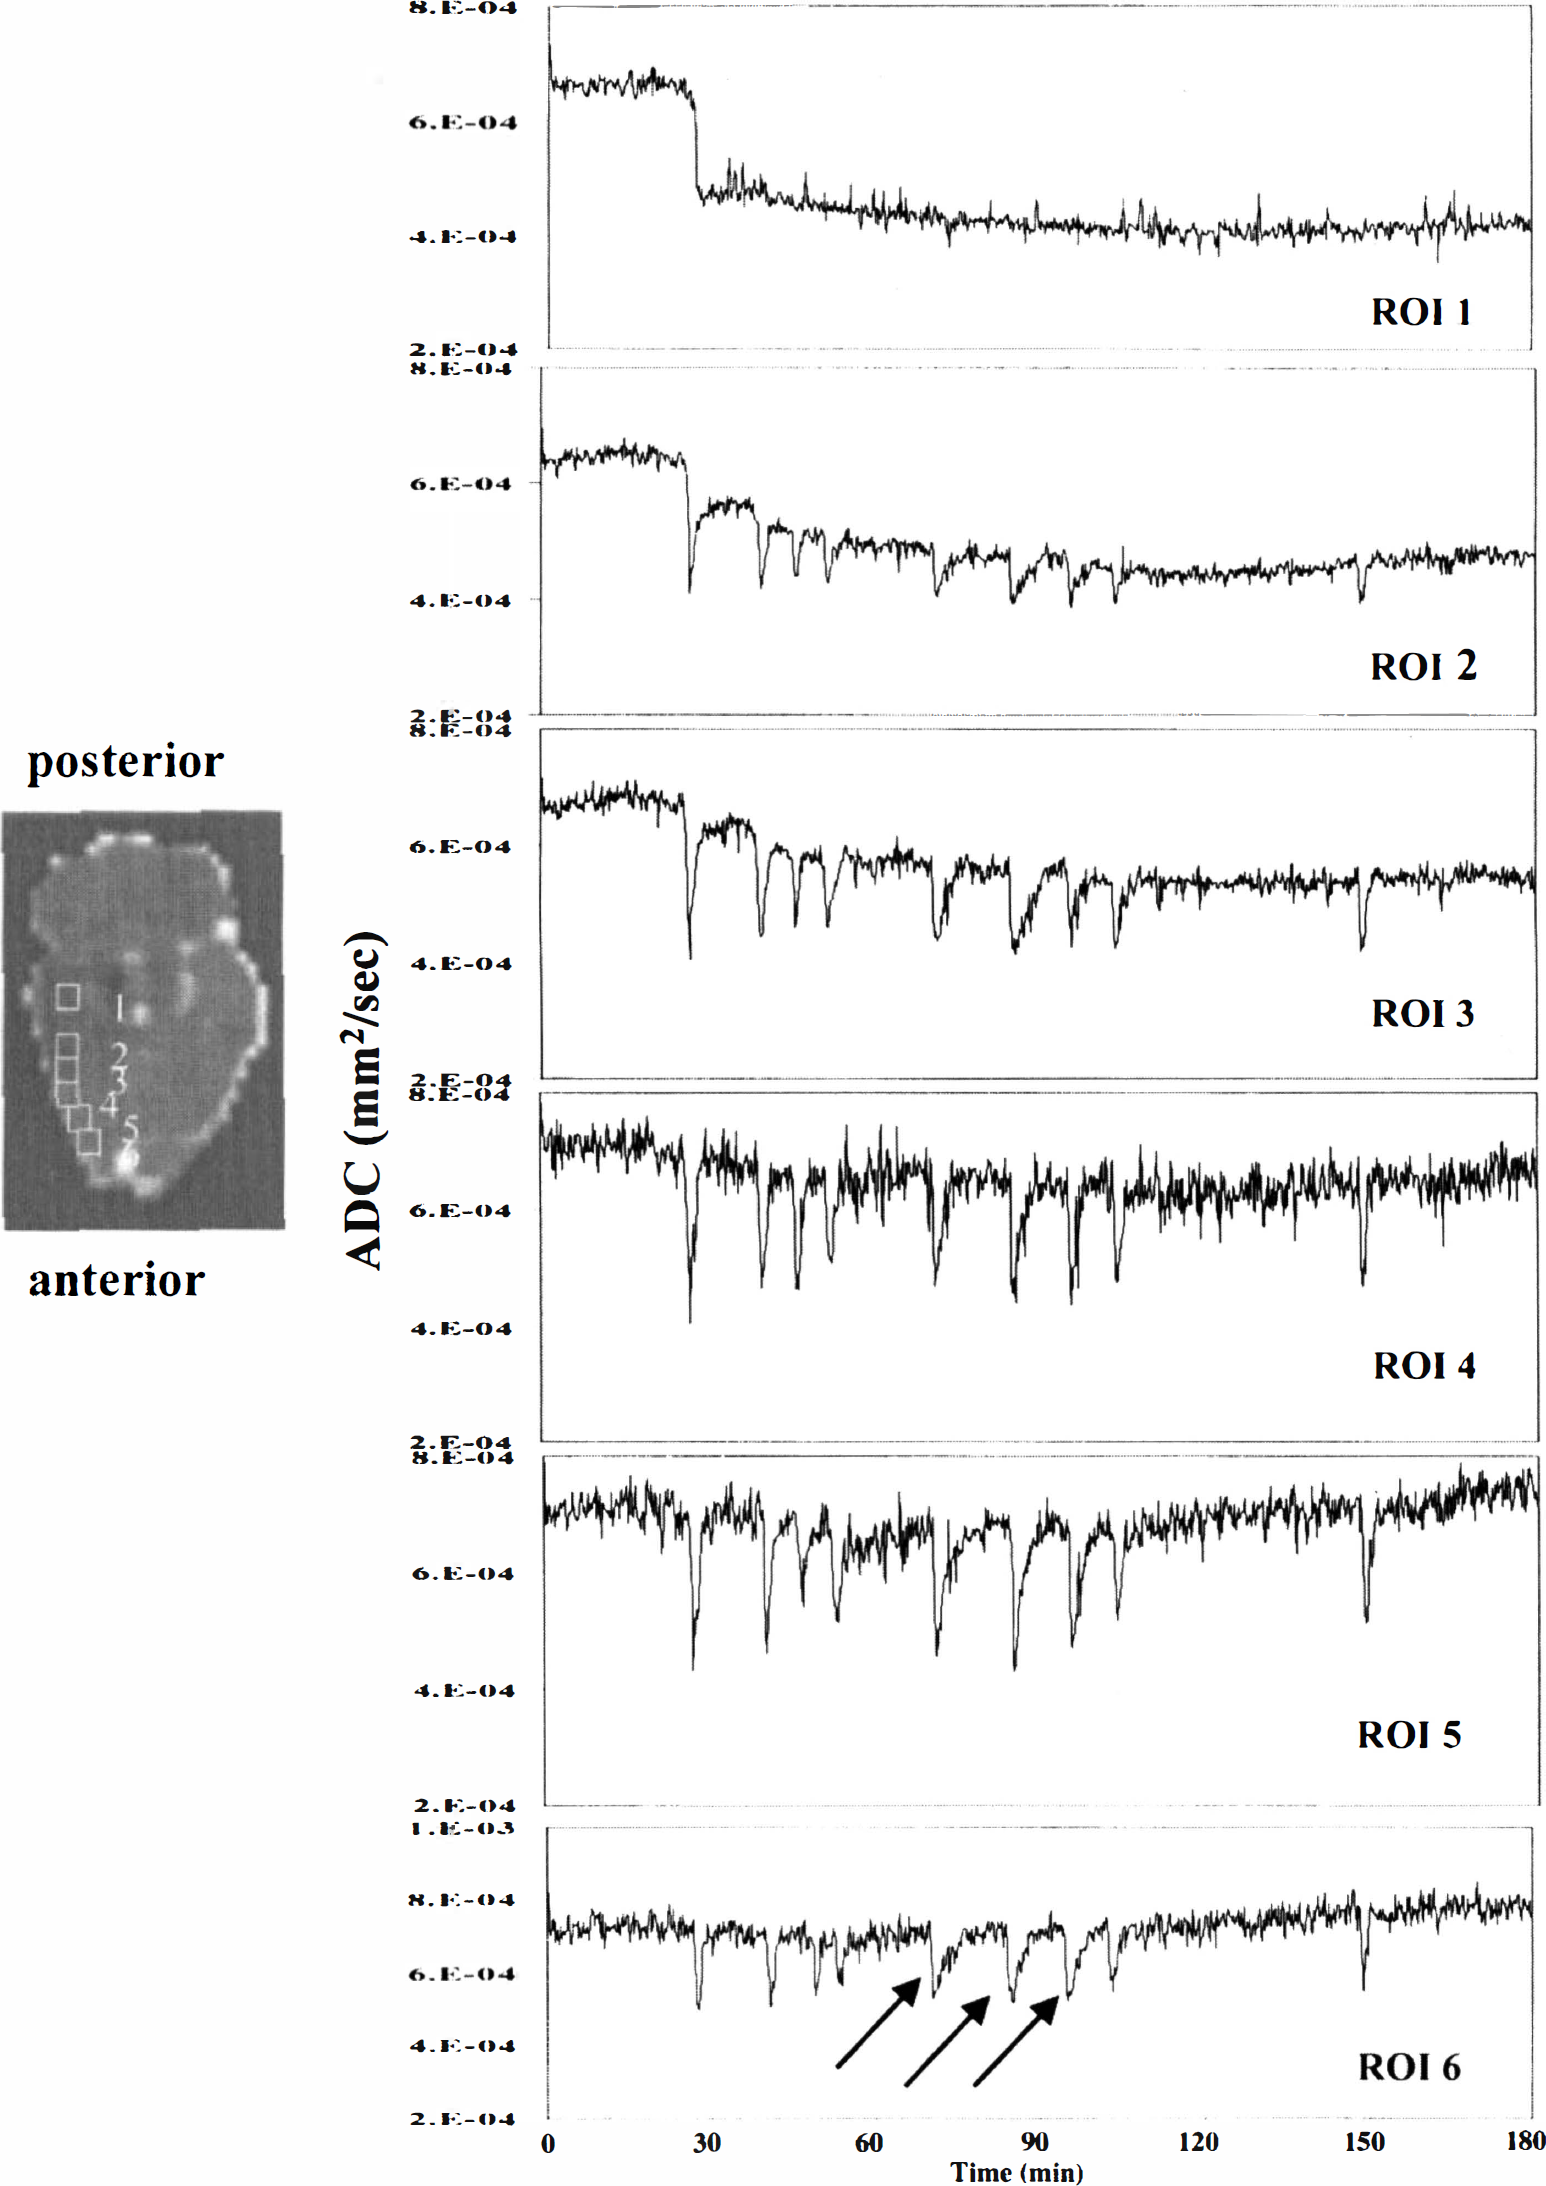
Regions of interest (ROIs) plots from a representative animal with a permanent lesion (same as in Fig. 2). Using the ischemic core after the initial spreading depression (SD) as a reference, six ROIs (2 × 2 pixels) were defined adjacent to each other on 1 slice.
In ROI 1 areas, which corresponded to the initial ischemic core, no SDs could be observed throughout the entire observation period. Adjacent to the ischemic core the ROIs had variable total depolarization times, varying from 1.0 to 8.2 minutes. For all animals, the total depolarization times were longer in ROI 2 (located adjacent to the ischemic core) than in nonischemic tissue (ROI 6). The depolarization times in ROIs 2 to 5 did not differ significantly between animals with permanent or transient lesions (P = 0.8). Average depolarization times for the first 4 SDs in all animals are summarized in Table 2. There was no trend towards increasing depolarization times with each SD episode in the ROI analysis, which is in agreement with the pixel-by-pixel maps of the recovery times.
Summary of total depolarization times for the first 4 SD episodes in all animals
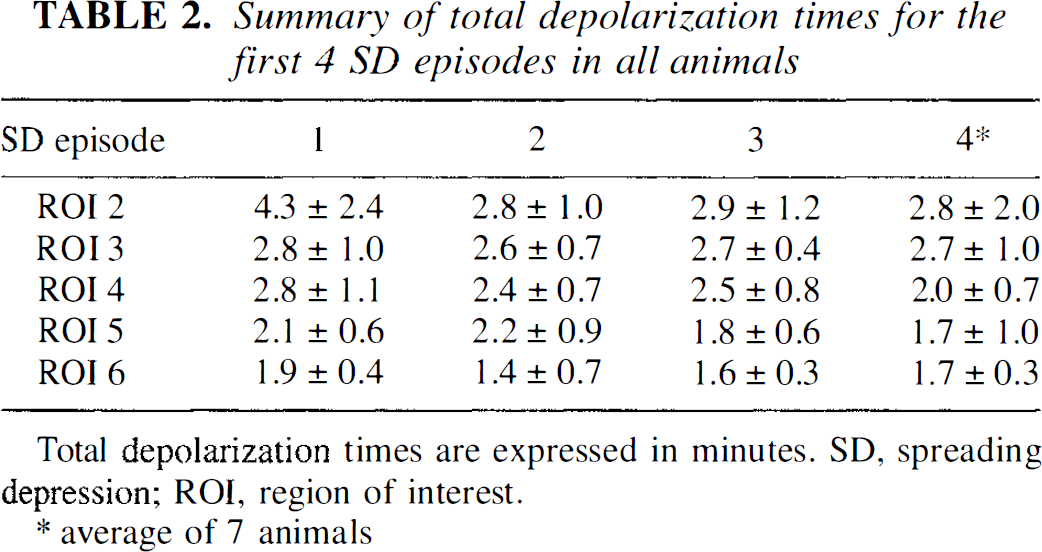
Total depolarization times are expressed in minutes. SD, spreading depression; ROI, region of interest.
average of 7 animals
Blood oxygen level-dependent data
A rapid signal drop of approximately 10% in the core of the infarct was observed in the GE images immediately upon embolization because of rapid blood deoxygenation upon CBF decrease. In most animals, however, subsequent GE images suffered from signal drift and magnetic susceptibility distortions over the 3-hour imaging period, which made precise evaluation of the BOLD effects impractical. Nevertheless, some qualitative observations could be made on the data. Most ADC transients in the periinfarct tissue close to the ischemic core were accompanied by a transient 5% decrease in the GE signal over approximately the same duration as the ADC change, although noise in the data precluded an exact measurement of the length of the BOLD-SD transient. However, in ROIs distant from the infarct core, a transient increase in GE signal was often observed accompanying the SD waves.
DISCUSSION
In the current study the authors used continuous high speed multislice diffusion MRI to simultaneously monitor the evolution of focal ischemic lesions and the occurrence of spontaneous SD waves in a thromboembolic stroke model. In addition, the in vivo contribution of SDs to the expansion of the ischemic lesion volume was assessed. Within minutes after injection of the autologous blood clots, variable ADC declines and regions of ischemia could be found in all animals, supporting the notion that DWI is highly sensitive to slowing water proton translations early in the ischemic episode (Moseley et al., 1990). In the current study, a threshold ADC value of 75% of control was used to delineate critically ischemic areas and to determine the lesion sizes on the ADC maps. This threshold was within the range used in previous studies (Beaulieu et al., 1998; Takano et al., 1996) and seemed appropriate in animals with permanent ischemia. A high correlation between the ADC-defined lesion volumes and histology after 24 hours has been reported (Takano et al., 1996). In contrast, recent evidence has accumulated suggesting that acute ADC reversal does not always predict tissue recovery from ischemic injury (Li et al., 1999; Zarow et al., 1995). In fact, there is no single threshold of early ADC reduction that is consistently associated with ischemic injury after temporary middle cerebral artery occlusion, indicating that DWI may not be useful in quantitatively predicting postreperfusion outcome based on only the magnitude of the ADC reduction (Mancuso et al., 1997). Using sequential DWI imaging, van Lookeren Campagne et al. (1999) and Zarow et al. (1995) could demonstrate the recurrence of ADC-defined lesion volumes during reperfusion after brief focal ischemia. Confirming these observations the authors found a secondary increase of the ischemic lesion in 1 animal monitored over a period of 6 hours, possibly corresponding to delayed ischemic damage. Consequently, the authors cannot comment on the ultimate ischemic lesion sizes in the animals with transient ischemia. Even though the authors monitored only 1 animal over a period of 6 hours, the advantages of high speed diffusion MR for studying the phenomenon of delayed ischemic injury in vivo is evident and should be exploited in future studies.
The information obtained from BOLD MRI regarding cerebral blood flow, volume, and oxygenation may be a valuable complement to the information available from DWI, and some interesting qualitative conclusions may be derived from the BOLD data. The drop in GE signal upon embolization was consistent with previous observations in this model (de Crespigny et al., 1993) and was primarily because of rapid blood deoxygenation. In intact rat brain, deliberately initiated SD episodes result in transient increases in the GE signal (Gardner-Medwin et al., 1994) because of transient CBF increases during repolarization. This effect was also observed in pixels far from the infarct core, as the SD waves spread into uninvolved cerebral tissue. Closer to the infarct, however, the authors observed negative BOLD transients during SD. This suggests that closer to the ischemic core, the microvasculature is already at maximum dilation and therefore unable to further increase CBF. Thus, SD waves in this periinfarct tissue cause a transient increase in deoxyhemoglobin concentration (causing a GE signal decrease) resulting from increased oxygen extraction during repolarization. However, even though the vasculature is unable to increase flow in response to the increased energy demand of repolarization, this energy demand was never sufficient to cause permanent depolarization over the time course of this study.
Besides mapping ischemic tissue changes, DWI is capable of detecting water shifts from extracellular to intracellular compartments that are associated with SDs, reflecting a shrinkage of the extracellular space because of disturbance of ion homeostasis. Although the authors did not perform concomitant electrophysiologic recordings in this study, a tight spatio-temporal relation between changes in the ADC and DC potential was established recently (de Crespigny et al., 1998; Takano et al., 1996), indicating that serial DWI can be used to detect SDs noninvasively.
In agreement with previous studies using different models of focal brain ischemia, the authors demonstrated that several episodes of transient ADC declines indicative of SD occur in the periinfarct zone within the first hours after thromboembolic stroke (Back et al., 1994; Dietrich et al., 1994; Gill et al., 1992; Hasegawa et al., 1995; Hossmann, 1996; Iijima et al., 1992). Similarly, a higher frequency of SDs within the first hours of ischemia has been reported (Dietrich et al., 1994; Dijkhuizen et al., 1999; Hossmann, 1996). A probable source of these periinfarct SDs is the infarct core from which potassium and glutamate are released into the extracellular space of the penumbral tissue at flow values less than 20 mL 100 g−1 min−1 (Astrup et al., 1977; Hansen and Nedergaard, 1988; Marrannes et al., 1988). Because cortical depolarization can only spread to tissue still able to cope with the increased metabolic requirements of repolarization, no SDs were detected in the ischemic core throughout the observation period. In addition, SD waves did not propagate into the initial ischemic core in those animals with reversed ADC reductions, possibly because of persistent functional tissue impairment. In the intact animal, SD waves are associated with an increased metabolic rate of glucose (Shinohara et al., 1979), which is coupled to a similar rise in blood flow (Kocher, 1990; Mayevsky and Weiss, 1991). In contrast, periinfarct depolarizations are not accompanied by brief phases of hyperperfusion and there is a paradoxical decrease in tissue oxygenation leading to repeated episodes of hypoxia during periinfarct DC shifts, which has been thought to contribute to the expansion of ischemic brain injury. Indeed, a significant relation between the number of SDs and the size of experimental stroke volumes has been reported in numerous studies (Back et al., 1996; Busch et al., 1996; Chen et al., 1993; Gill et al., 1992; Hossmann, 1996; Iijima et al., 1992; Mies et al., 1993; Takano et al., 1996). Although only a small number of animals with highly variable final DWI-defined lesions were studied, the authors found no correlation between the number of SDs and the initial and final DWI-defined lesion volumes for all animals. Although this finding could also be attributable to the uncertainty of the final infarct size in the animals with transient ischemia, similar results have been reported recently in studies using the intraluminal suture model, DC potential recordings, and histology after 24 hours (Back et al., 1996; Dijkhuizen et al., 1999). Together with these observations, the current study indicated that the mere finding of a positive correlation between the number of SDs and ischemic lesion volume does not provide rigorous evidence for a pathogenic role of SDs. Despite the fact that suppression of SDs with neuroprotective agents such as MK-801 or hypothermia and subsequent reduced infarct sizes has been demonstrated convincingly (Chen et al., 1993; Gill et al., 1992; Iijima et al., 1992; Mies et al., 1994; Tatlisumak et al., 1998), the therapeutic effects of these substances or interventions could theoretically be mediated by other protective mechanisms.
Besides solely monitoring the occurrence and frequency of periinfarct SD waves, DWI can also be useful to assess the in vivo contribution of SDs to the expansion of the ischemic lesion. Moreover, the origin and propagation of SD-coupled ADC changes can be evaluated on a pixel-by-pixel basis. The current results show that SD waves originate from different parts of critically ischemic regions and spread multidirectionally into the periinfarct surrounding. The multidirectional spread of SD waves limits their reliable detection with single or even multielectrode DC potential recordings, which are usually positioned on the skull or cortical surface. Consistent with previous studies, SD waves did not propagate into the contralateral hemisphere (Rother et al., 1996a,b).
Because the restoration of the changes in ion homeostasis after transient SDs is an energy requiring process (Kocher, 1990; Mayevsky and Weiss, 1991; Nedergaard and Astrup, 1986; Shinohara et al., 1979), it is likely that the duration of the SD-coupled ADC changes reflects the severity of the perfusion deficits (Mies, 1997; Rother et al., 1996b). This interpretation is in line with the observations of Rother et al. (1996b), who correlated the duration of the SD-coupled ADC changes in various ROIs with the corresponding CBF and observed an inverse relation. Although the authors did not measure perfusion in the current study, the recovery times or the total depolarization times of the SD episodes were prolonged in areas close to the ischemic core, which was consistent with the general concept of reduced perfusion and energy substrates in the periinfarct tissue. Thus, the application of continuous high speed DWI also has the potential to indirectly assess the functional state of the penumbra in vivo.
Recently, it has been suggested that the aggravating effect of SDs on the ischemic injury is reflected by increasing depolarization times with subsequent SD episodes, which may eventually become terminal depolarization (Hossmann, 1996). However, results obtained with DC potential recordings alone should be interpreted with great care because the in vivo evolution of ischemic lesions is not known. In fact, the three-dimensional analysis of the recovery times on a pixel-by-pixel basis did not show that repetitive spontaneous SDs in the periinfarct tissue eventually lead to permanent depolarization.
However, the in vivo contribution of SD waves has been the subject of two recent comprehensive examinations (Busch et al., 1996; Takano et al., 1996). Using DWI, Busch et al. (1996) and Takano et al. (1996) have shown that induction of SDs in the rat brain after focal ischemia promoted the expansion of the infarct in vivo. However, a direct comparison with the current results is hampered by the fact that externally evoked SDs in focal models of ischemia possibly constitute a more severe additional stress to the already ischemic tissue than internally evoked SDs and may distort the natural course of infarct evolution. Furthermore, differences in the models of middle cerebral artery occlusion have to be considered. In contrast to the intraluminal suture model used in the studies of Busch et al. (1996) and Takano et al. (1996), thromboembolic occlusion of the middle cerebral artery may be associated with a higher residual blood flow in the surroundings of the infarct. This could putatively improve the relation between energy supply and energy demands of the periinfarct tissue, lead to a faster recovery of the metabolic state after transient depolarizations, and account for the absent increase in lesion volume in one animal. Although it is also perceivable that the actual size of the tissue at risk might differ between these two stroke models, lesion growth mainly occurred in areas without transient ADC changes, which does not support the notion of a definite role of SD waves after thromboembolic stroke. Clarifying these controversies may be of utmost importance because many clinical trials with neuroprotective agents have been partially based on the relation between reducing SDs and infarct volume in animal models of ischemia (Gill et al., 1992; Iijima et al., 1992). In addition, this study hopefully will fuel the search for the occurrence and pathophysiologic role of SD episodes in humans. Rapid DWI has become readily available for the application in humans and opens a new field of noninvasive monitoring of physiologic processes.