
Abstract
Diffusion magnetic resonance imaging (MRI) provides a sensitive indicator of cerebral hypoxia. We investigated if apparent diffusion coefficient (ADC) and transverse relaxation (T2) predict symptoms of acute mountain sickness (AMS), or merely indicate the AMS phenotype irrespective of symptoms. Fourteen normal subjects were studied in two groups; unambiguous AMS and no-AMS at 3,800 m altitude (intermediate AMS scores were excluded). T2 relaxation was estimated from a T2 index of T2-weighted signal normalized by cerebrospinal fluid signal. Measurements were made in normoxia and repeated after 2 days sustained hypoxia (AMS group symptomatic and no-AMS group asymptomatic) and after 7 days hypoxia (both groups asymptomatic). Decreased ADC directly predicted AMS symptoms (
Keywords
INTRODUCTION
Acute exposure to hypoxia can induce a constellation of symptoms of acute mountain sickness (AMS), characterized by headache in addition to gastrointestinal and neurologic symptoms, sleep disturbance, and fatigue within 6 to 12 hours of rapid exposure to hypoxia at high altitude. 1 Despite being a common response to hypoxia, the pathophysiologic mechanisms of AMS remain poorly understood. Acute mountain sickness itself is usually benign and self-limiting; however, it shares many clinical characteristics with high-altitude cerebral edema (HACE) which when untreated is fatal. 2 Thus, the current consensus is that AMS and HACE may be part of the same spectrum of illness.
An overlap in pathophysiology of AMS and HACE is also supported by imaging data; in a study of HACE, Hackett and Roach
3
reported increased transverse relaxation (T2) of the magnetic resonance imaging (MRI) signal in seven of nine subjects, particularly in the central white matter of the corpus callosum. Matsuzawa
Several studies have also looked for ‘subclinical edema’ changes in uncomplicated AMS, looking at changes in T2 or the ADC—a physiologic parameter that characterizes the self-diffusion of water in tissue. Fischer
Despite this mixed picture, a pattern of alterations in cerebral parenchymal microarchitecture is emerging in response to hypoxia. What remains unclear is the natural history of any T2 or ADC changes beyond the acute period. Specifically, (1) whether the changes in cerebral physiology track with symptoms of AMS, or whether they are present in all AMS-susceptible individuals irrespective of symptoms and (2) how ADC and T2 changes vary across cerebral regions with different hypoxia sensitivities.
We hypothesized that alterations in ADC and T2 (if present) would track with symptoms of AMS and would abate as symptoms resolved over the course of acclimatization to altitude. To test this, we examined the time course of ADC and T2 changes during sustained hypoxia at altitude. Cerebral MRI measurements were made at sea level, and after 2 days at 3,800 m altitude (when symptoms of AMS, if present, were at a maximum), and again after 7 days at altitude (when all subjects were fully acclimatized and asymptomatic).
MATERIALS AND METHODS
SUBJECTS
In all, 18 healthy, nonsmoking, sea-level residents were recruited; 8 male (age 28 ± 9.3 years) and 10 female (age 30 ± 9.8 years). Ethical approval for these studies was granted by the Human Research Protection Program of the University of California San Diego. Participants were informed of the experimental procedures and possible risks involved in the study and written informed consent was obtained before participation.
Study Design
Diffusion-weighted MRI measurements were made in the cerebrum at sea level and from these we examined regional ADC of cerebral water, as well as signal changes on T2-weighted images. End-tidal CO2 tension (PETCO2), arterial oxygen saturation of hemoglobin (SaO2), and hematocrit were also measured. The measurements were repeated after 2 days and 7 days of sustained hypoxia at altitude. For hypoxic exposure, subjects resided at high altitude at the White Mountain Research Station (3,800 m altitude, PiO2 90 Torr). The diffusion and T2 changes were compared for AMS and no-AMS groups during normoxia and after the two durations of sustained hypoxia.
Hypoxic Exposure
Exposure to high altitude was rapid. Subjects were driven to the research station, with the majority of the ascent (600 to 3,800 m altitude) completed in ~2 hours. Subjects spent two or seven nights at altitude and then returned to San Diego for MRI. After allowing ~2 months for deacclimatization, subjects made a second 2- or 7-day trip. (The ordering of the 2-day or 7-day hypoxic exposures was random between subjects.) For each subject, the SaO2 achieved after 40 hours of hypoxic exposure at altitude (for 2-day trip) or after 160 hours at altitude (for 7-day trip) was maintained throughout the ~8 hour transportation and the MRI measurements. During transportation, this was accomplished via a venturi mask with variable %N2 in the inspiratory port (to maintain consistent SaO2 despite changing altitude and barometric pressure). Within the MRI scanner subjects breathed a premixed 90 Torr hypoxic mixture (12.5% O2, balance N2) via a close-fitting low-deadspace non-rebreathing mask (Hans Rudolph 7900/2600 Kansas City, MO, USA). SaO2 was intermittently monitored while resident at altitude and continuously monitored during transportation and MRI. Subjects remained hypoxic at the same SaO2 level experienced on their last day at altitude until all MRI measurements were completed.
Acute Mountain Sickness Groups
To maximize our ability to detect potential physiologic differences between subjects at altitude, the Lake Louise Score (LLS), an AMS self-report questionnaire, 8 was used to divide subjects into two distinct groups: Those with no symptoms of AMS (no-AMS group), and those with unambiguous AMS (AMS group). The Lake Louise AMS questionnaire is based on responses regarding five different symptoms—headache, gastrointestinal symptoms, fatigue, dizziness, and difficulty sleeping, each graded 0 to 3 in severity. Difficulty sleeping was not included as a criterion for AMS on the first night (to avoid confounds because of the rapid ascent 8 ), but was scored on subsequent days. Subjects with an LLS of ≤2, or with no headache, were considered as AMS nonsufferers (no-AMS group). Those with an LLS of ≥5 and a headache plus symptoms of nausea, fatigue, dizziness, or difficulty sleeping were considered as unambiguous AMS sufferers (AMS group). Subjects with an intermediate score (LLS 3 to 4) and a headache were grouped into a third ‘intermediate’ group, and not used when comparing AMS versus no-AMS. For correlation analysis between LLS and ADC (or T2,index), all subjects were included. Lake Louise scores were determined in each subject on both day 1 and day 2 (each immediately after a night at altitude, before any daily exercise). Beyond day 3 LLSs rapidly normalized with acclimatization and no longer indicated AMS susceptibility. The mean of the day 1 and day 2 scores was used to characterize subjects into AMS and no-AMS groups.
Physiologic Measurements
Arterial O2 saturation was measured and logged using a Nonin 3100 wrist pulse oximeter (at altitude and during transportation) and a Nonin 8600FO MRI-compatible pulse oximeter (Nonin Medical, Plymouth, MN, USA) (during MRI measurement) that was calibrated in each subject against an arterial blood sample. Inspired and expired partial pressures of O2 and CO2 were continuously monitored during MRI measurements using a Perkin-Elmer 1100 medical gas spectrometer (Perkin-Elmer Inc., Waltham, MA, USA). Hematocrit was determined from direct measurements of packed cell height in a capillary tube after centrifuging. Magnetic Resonance Imaging Measurements All MRI data were collected at 3 T on a General Electric scanner (GE Medical Systems, Milwaukee, WI, USA).
Diffusion-Weighted Images
Apparent diffusion coefficient maps and T2-weighted images were generated from diffusion-weighted images of the cerebrum (double spin-echo echo-planar imaging acquisition, echo time = 85 ms, repetition time = 7seconds,
3D T1-Weighted Anatomical Magnetic Resonance Imaging
A high-resolution FSPGR T1-weighted 3D-gradient echo image was also acquired to allow coregistration of the subjects' regions of interest (ROIs) data across the multiple imaging sessions (echo time = 4.2 ms, repetition time = 10.1 ms, TI = 450 ms (effective repetition time 460.1 ms), bandwidth 20.83 kHz, field of view 25 × 25 × 16 cm, matrix 256 × 256 × 128, ~1 × 1 × 1.3 mm resolution, 5.5 minutes).
Data Analysis
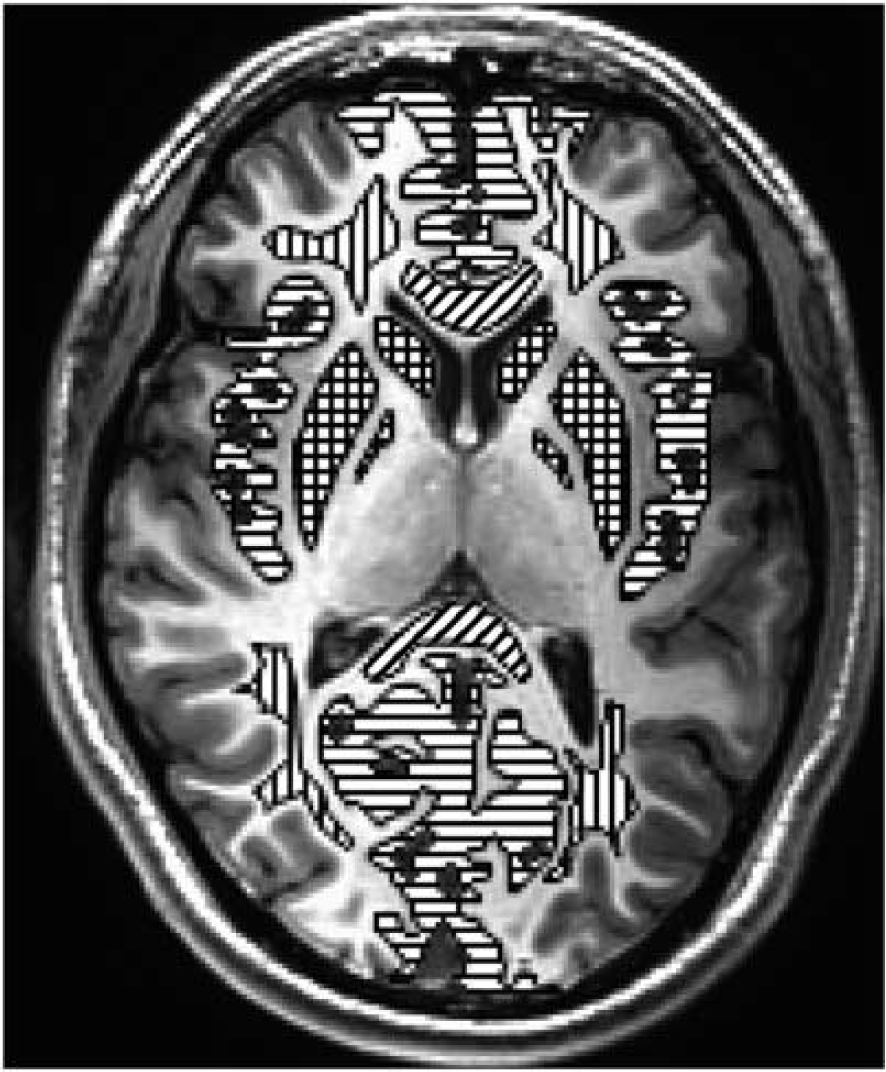
Location of regions of interest used for analysis. Green/horizontal lines = gray matter, blue/vertical lines = white matter, red/cross hatch lines = basal ganglia, and yellow/diagonal lines = corpus callosum (genu anterior and splenium posterior). Mean and standard deviation voxel counts for 18 subjects in the 5 primary regions of interest (Tables 2 and 3, Figures 5 and 6) were gray matter 12,822 ± 3,354, white matter 6,574 ± 70, basal ganglia 3,298 ± 733, splenium of corpus callosum 1,424 ± 602, and genu of corpus callosum 1,450 ± 558. Voxel counts for all regions combined (Figures 3 and 4) 31,275 ± 2,943. Voxel volume is 3.87 mm3. The color reproduction of this figure is available at the
To ensure that the same ROIs were used across the different imaging sessions, the high-resolution 3D anatomic MRI and the diffusion-weighted MRI were coregistered within each imaging session. The key ROIs were initially defined on the baseline (normoxia) high-resolution 3D T1-weighted anatomic MRI (Amira, Visage Imaging, San Diego, CA, USA). These anatomic MRI from each of the three measurement sessions (baseline normoxia, 2 days hypoxia, and 7 days hypoxia) were then coregistered, which allowed us to determine the rotation matrix for coregistering MRI scans between each imaging session. The ROIs were then rotated using this rotation matrix, and aligned to the diffusion-weighted MRI data for each session. This approach of rotating only the ROI, and not the images ensured that measurements were only made from raw MRI data (which had not been rotated or smoothed) thus removing potential bias across imaging sessions.

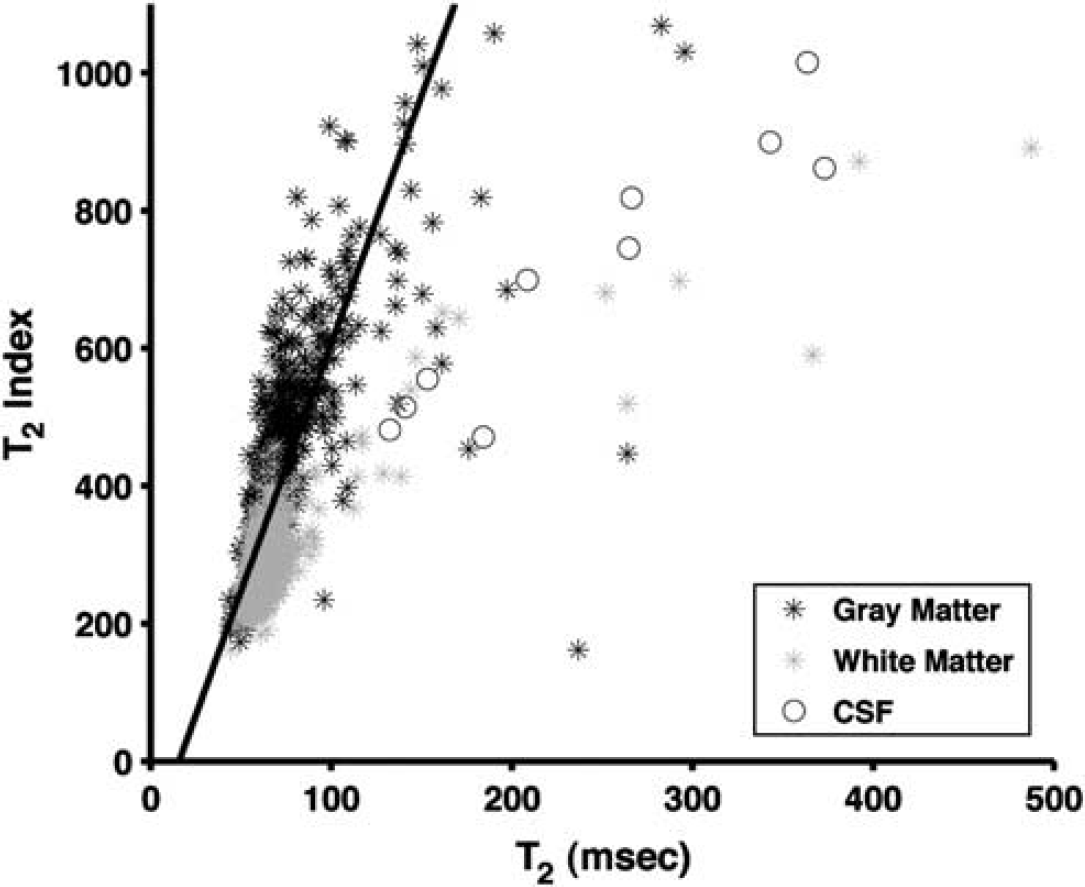
Scatter plot of T2,index versus T2 relaxation for one subject. Imaging sequence used spin-echo echo-planar imaging as described in text with
Apparent Diffusion Coefficient
Apparent diffusion coefficient was calculated per pixel from the log slope of the signal attenuation between
Correlation Analysis
We used the LLS, change in SaO2, change in hematocrit, and change in ETCO2 as parametric variables to address potential corollaries with the changes in ADC and T2 (between 2 days hypoxia and baseline normoxia).
Voxel-Based Analysis
The images were also analyzed using a voxel-based approach, to evaluate areas with signal differences related to AMS symptoms. For each subject in the AMS or no-AMS group, the ADC and T2,index images were transformed to Talairach space (AFNI software, NIMH, Bethesda, MD, USA), and voxels were down sampled to 4 mm3 isotropic and spatially smoothed (Gaussian filter, full width half max = 5 mm). For each subject, the images from day 7 (no AMS symptoms) were subtracted from the images for day 2 (maximal AMS Symptoms) to create a map of ADC (or T2,index changes). These difference images were then averaged for each group. Voxels with very large, unphysiologic, values (>100) were treated as misregistration errors and ignored. The averaged map for the no-AMS group was subtracted from averaged map for the AMS group. In this final map, the voxels were colored by pixel intensity and superimposed on a grayscale background image of the average ADC (or T2,index) grayscale image from all the subjects.
Statistical Analysis
Data were analyzed with repeated measures ANOVA of our primary outcome variables (ADC, T2,index), with two grouping variables (AMS and no-AMS) and three measurement levels (normoxia, 2 days hypoxia, and 7 days hypoxia) (StatView 5.0.1, SAS Institute, Cary, NC, USA). Data were expressed as mean ± s.d. Changes were significant at
RESULTS
Acute Mountain Sickness
To highlight any physiologic changes in ADC and T2,index that accompany the development and recovery of AMS symptoms, we only included subjects who were virtually asymptomatic (no-AMS group) or who developed unambiguous AMS (AMS group). Of the 18 subjects recruited into the study, 6 developed criteria for AMS (LLS ≥5 and headache; 1M, 5F). A further eight subjects met the criteria for no AMS (no-AMS) (LLS ≤2 or no headache; 5M, 3F). The remaining four subjects were characterized as intermediate, and were not included in further analysis.
All of the 14 subjects selected for analysis had measurements for the 3 repeated time points, with the exception of 2 missing data points; 2-day ADC and T2-weighted images corrupted in one subject (male, no-AMS group) and 7-day ADC and T2-weighted images corrupted in one subject (female, no-AMS group).
Hypoxia
After 2 days at 3,800 m altitude (PiO2 = 90 Torr), all subjects showed decreased arterial saturation (98.2 ± 0.8% to 83.3 ± 3.7%,
After 7 days at altitude, all subjects showed moderate increases in arterial saturation relative to their 2-day values (83.3 ± 3.7% to 87.1 ± 2.5%,
Physiologic changes during hypoxia
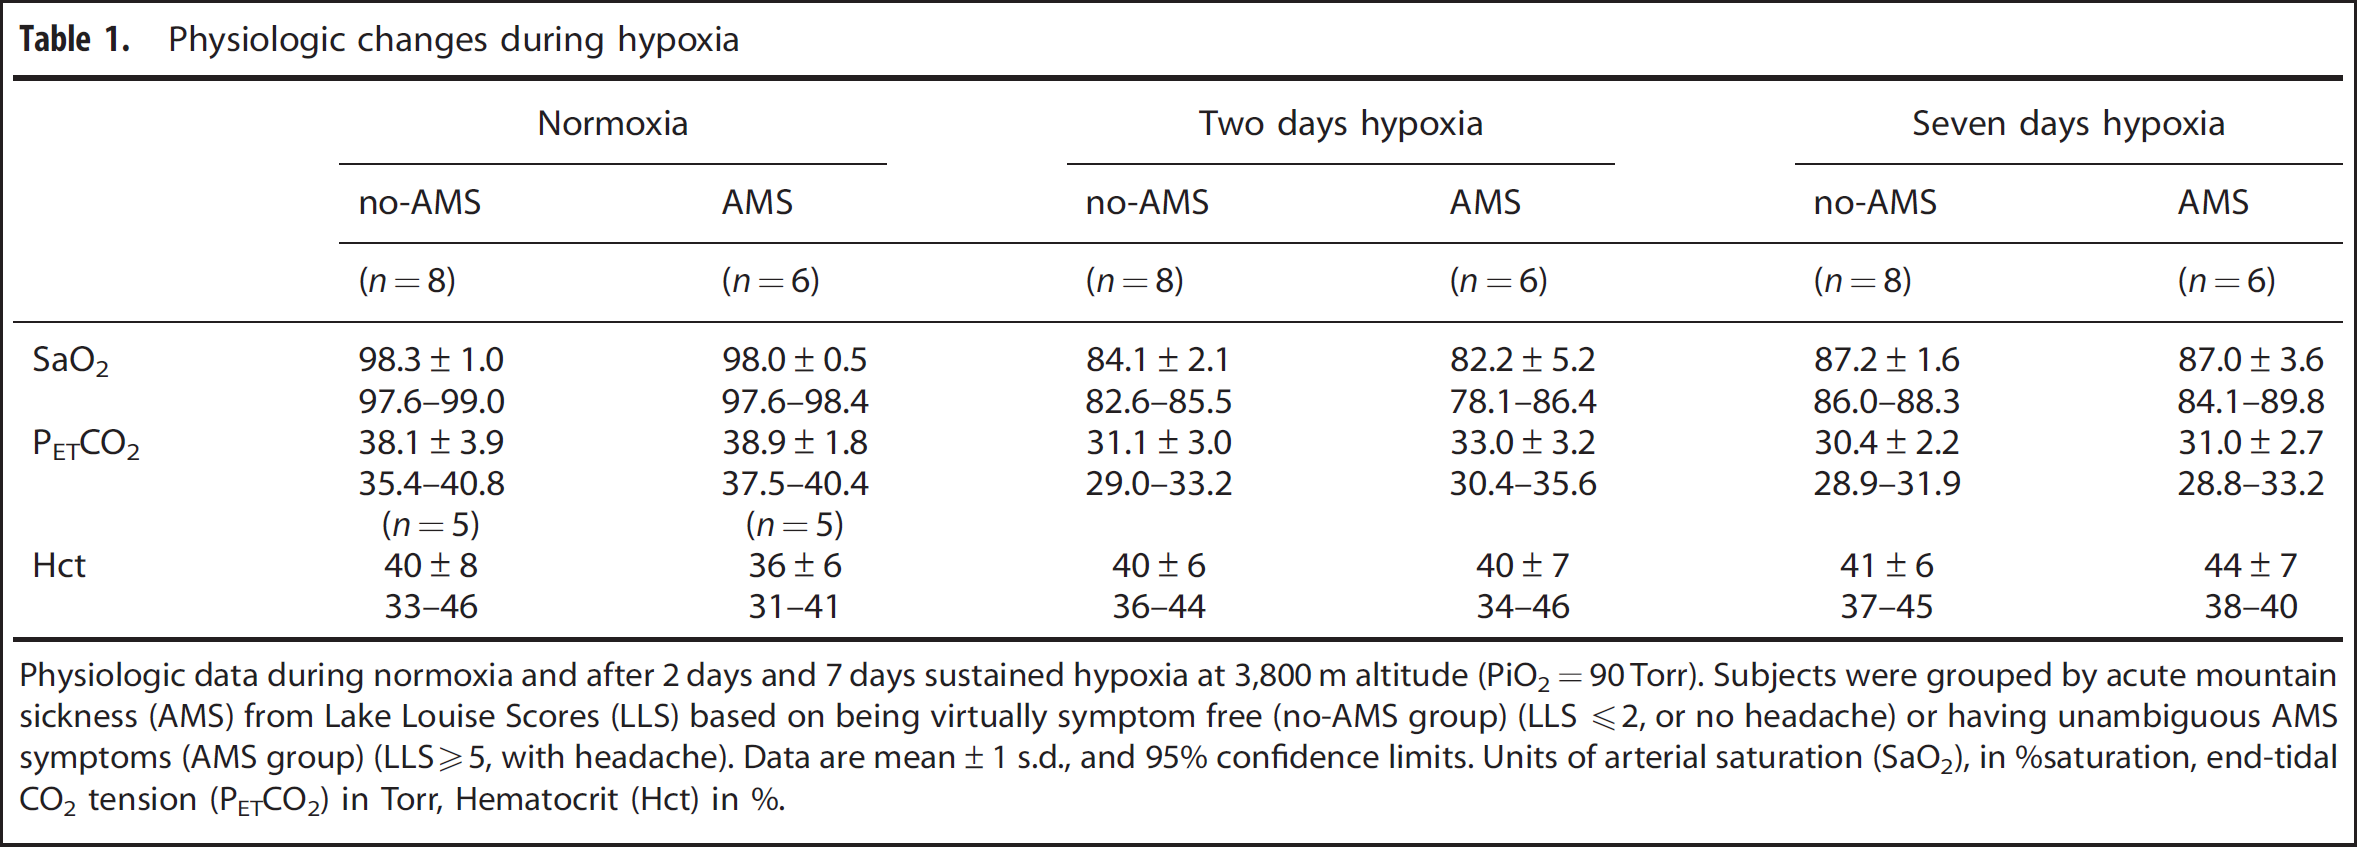
Physiologic data during normoxia and after 2 days and 7 days sustained hypoxia at 3,800 m altitude (PiO2=90 Torr). Subjects were grouped by acute mountain sickness (AMS) from Lake Louise Scores (LLS) based on being virtually symptom free (no-AMS group) (LLS 2, or no headache) or having unambiguous AMS symptoms (AMS group) (LLS5, with headache). Data are mean±1 s.d., and 95% confidence limits. Units of arterial saturation (SaO2), in %saturation, end-tidal CO2 tension (PETCO2) in Torr, Hematocrit (Hct) in %.
Apparent Diffusion Coefficient and T2,index
Comparing changes between 2-day hypoxia versus normoxia in all ROI grouped together (putamen, globus pallidus, caudate, gray matter, white matter, splenium of corpus callosum, and genu of corpus callosum), there was a decrease in ADC relative to normoxia in the AMS group (ΔADC = −13.3 ± 26.1 × 10⁻⁶ mm2/s), but an increase in ADC (ΔADC = +19.9 ± 29.2 × 10⁻⁶ mm2/s) in the no-AMS group (
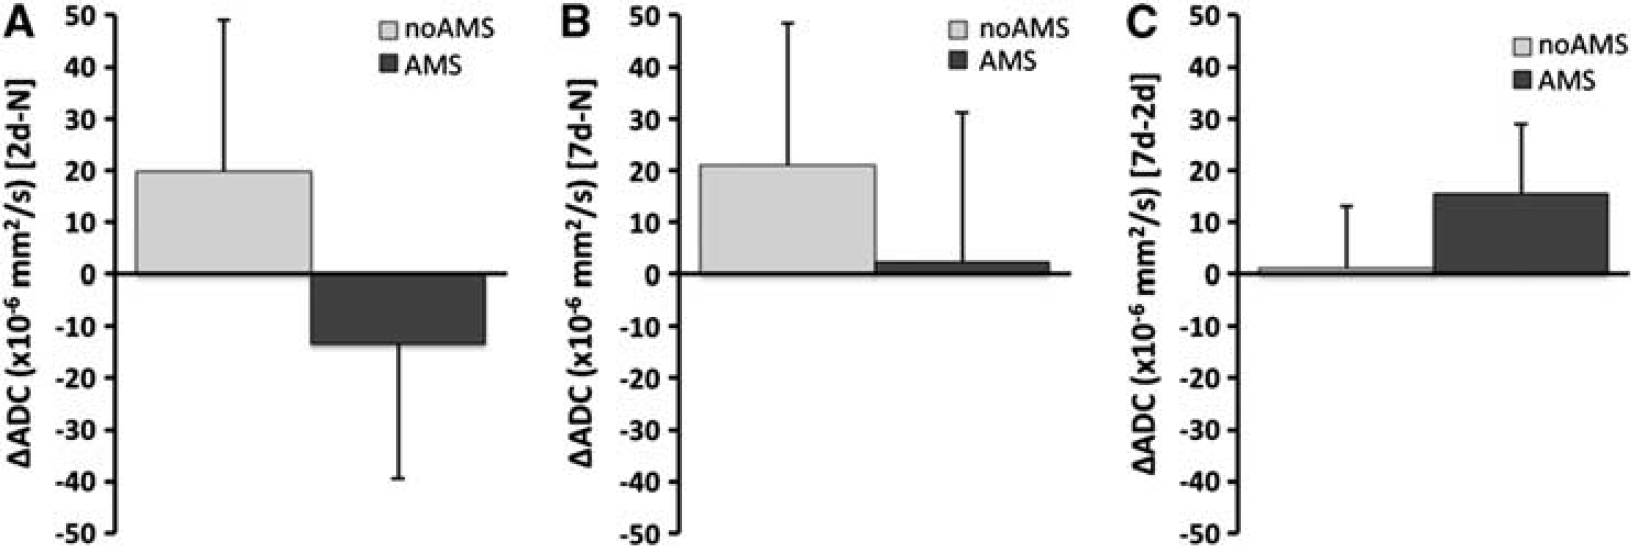
Changes in apparent diffusion coefficient (ADC) for acute mountain sickness (AMS) and no-AMS groups across all cerebral regions. (
For T2,index; after 2 days hypoxia, there was a decrease in T2,index relative to normoxia in the AMS group (ΔT2,index = −26.5 ± 26.5), but an increase in the no-AMS group (ΔT2,index = +12.3 ± 34.3) (
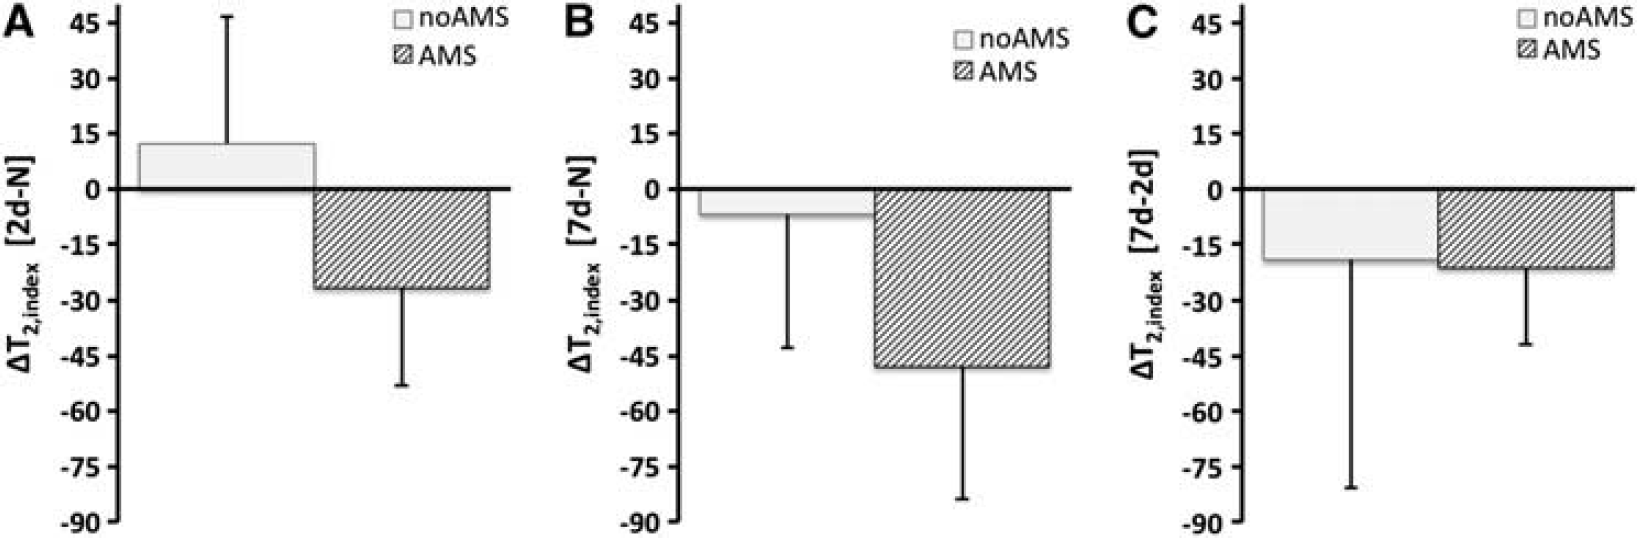
Changes in T2,index for acute mountain sickness (AMS) and no-AMS groups across all cerebral regions (
The changes in ADC and T2,index were further analyzed by brain region. The ADC changes for basal ganglia (putamen, caudate, and globus pallidus), gray matter, and white matter followed the same trend described above. The ADC changes in corpus callosum showed a different pattern in the AMS group. In the splenium, there was an increase in ADC after 2 days hypoxia (rather than the decreases seen in other regions). After 7 days, ADC had increased further. In the genu, there was a larger decrease in ADC after 2 days hypoxia. Unlike other cerebral regions, the decreased ADC in the genu persisted after 7 days hypoxia (
ADC changes during hypoxia
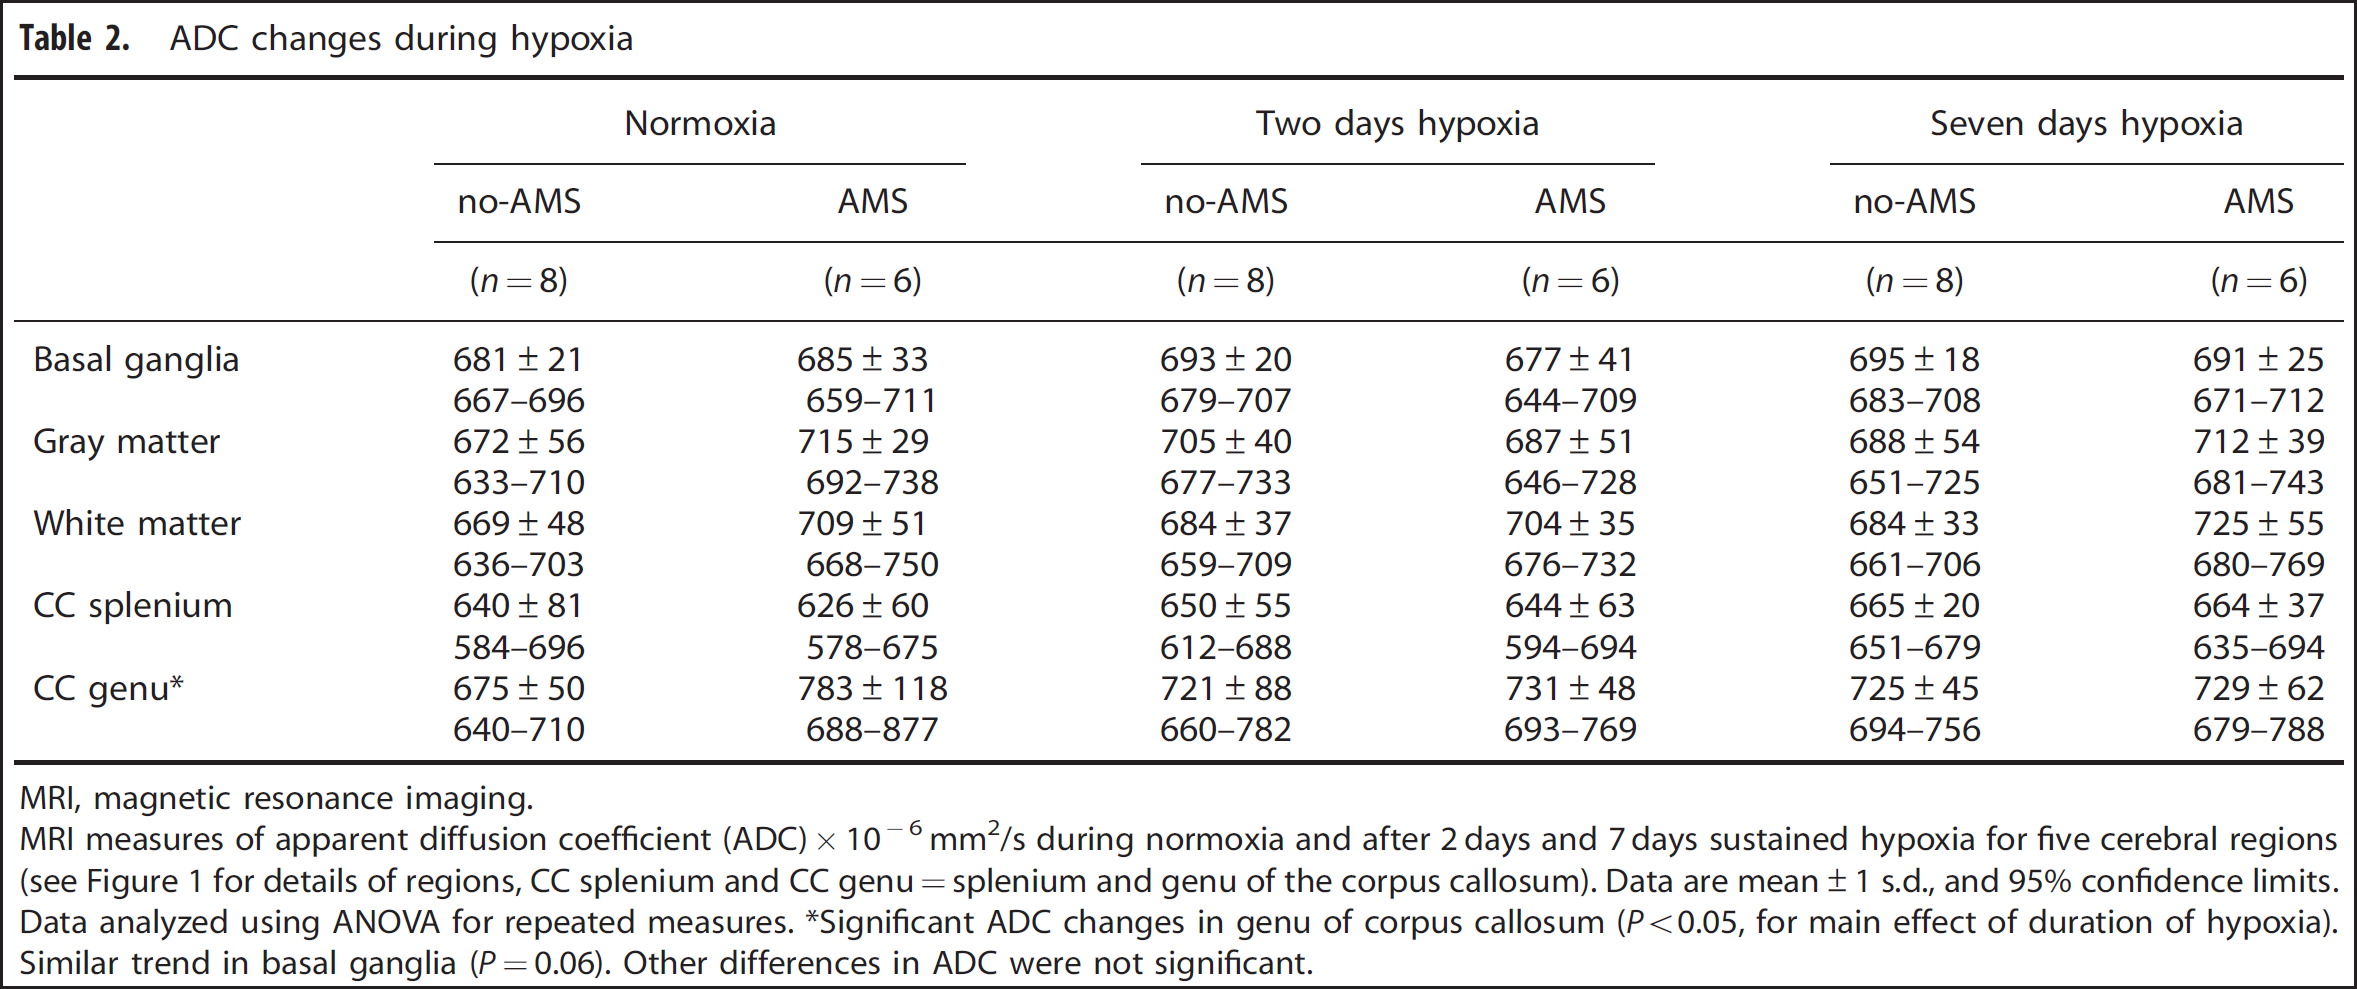
MRI, magnetic resonance imaging. MRI measures of apparent diffusion coefficient (ADC) × 10−6 mm2/s during normoxia and after 2 days and 7 days sustained hypoxia for five cerebral regions (see Figure 1 for details of regions, CC splenium and CC genu=splenium and genu of the corpus callosum). Data are mean±1 s.d., and 95% confidence limits. Data analyzed using ANOVA for repeated measures. ∗Significant ADC changes in genu of corpus callosum (
T2,index changes during hypoxia
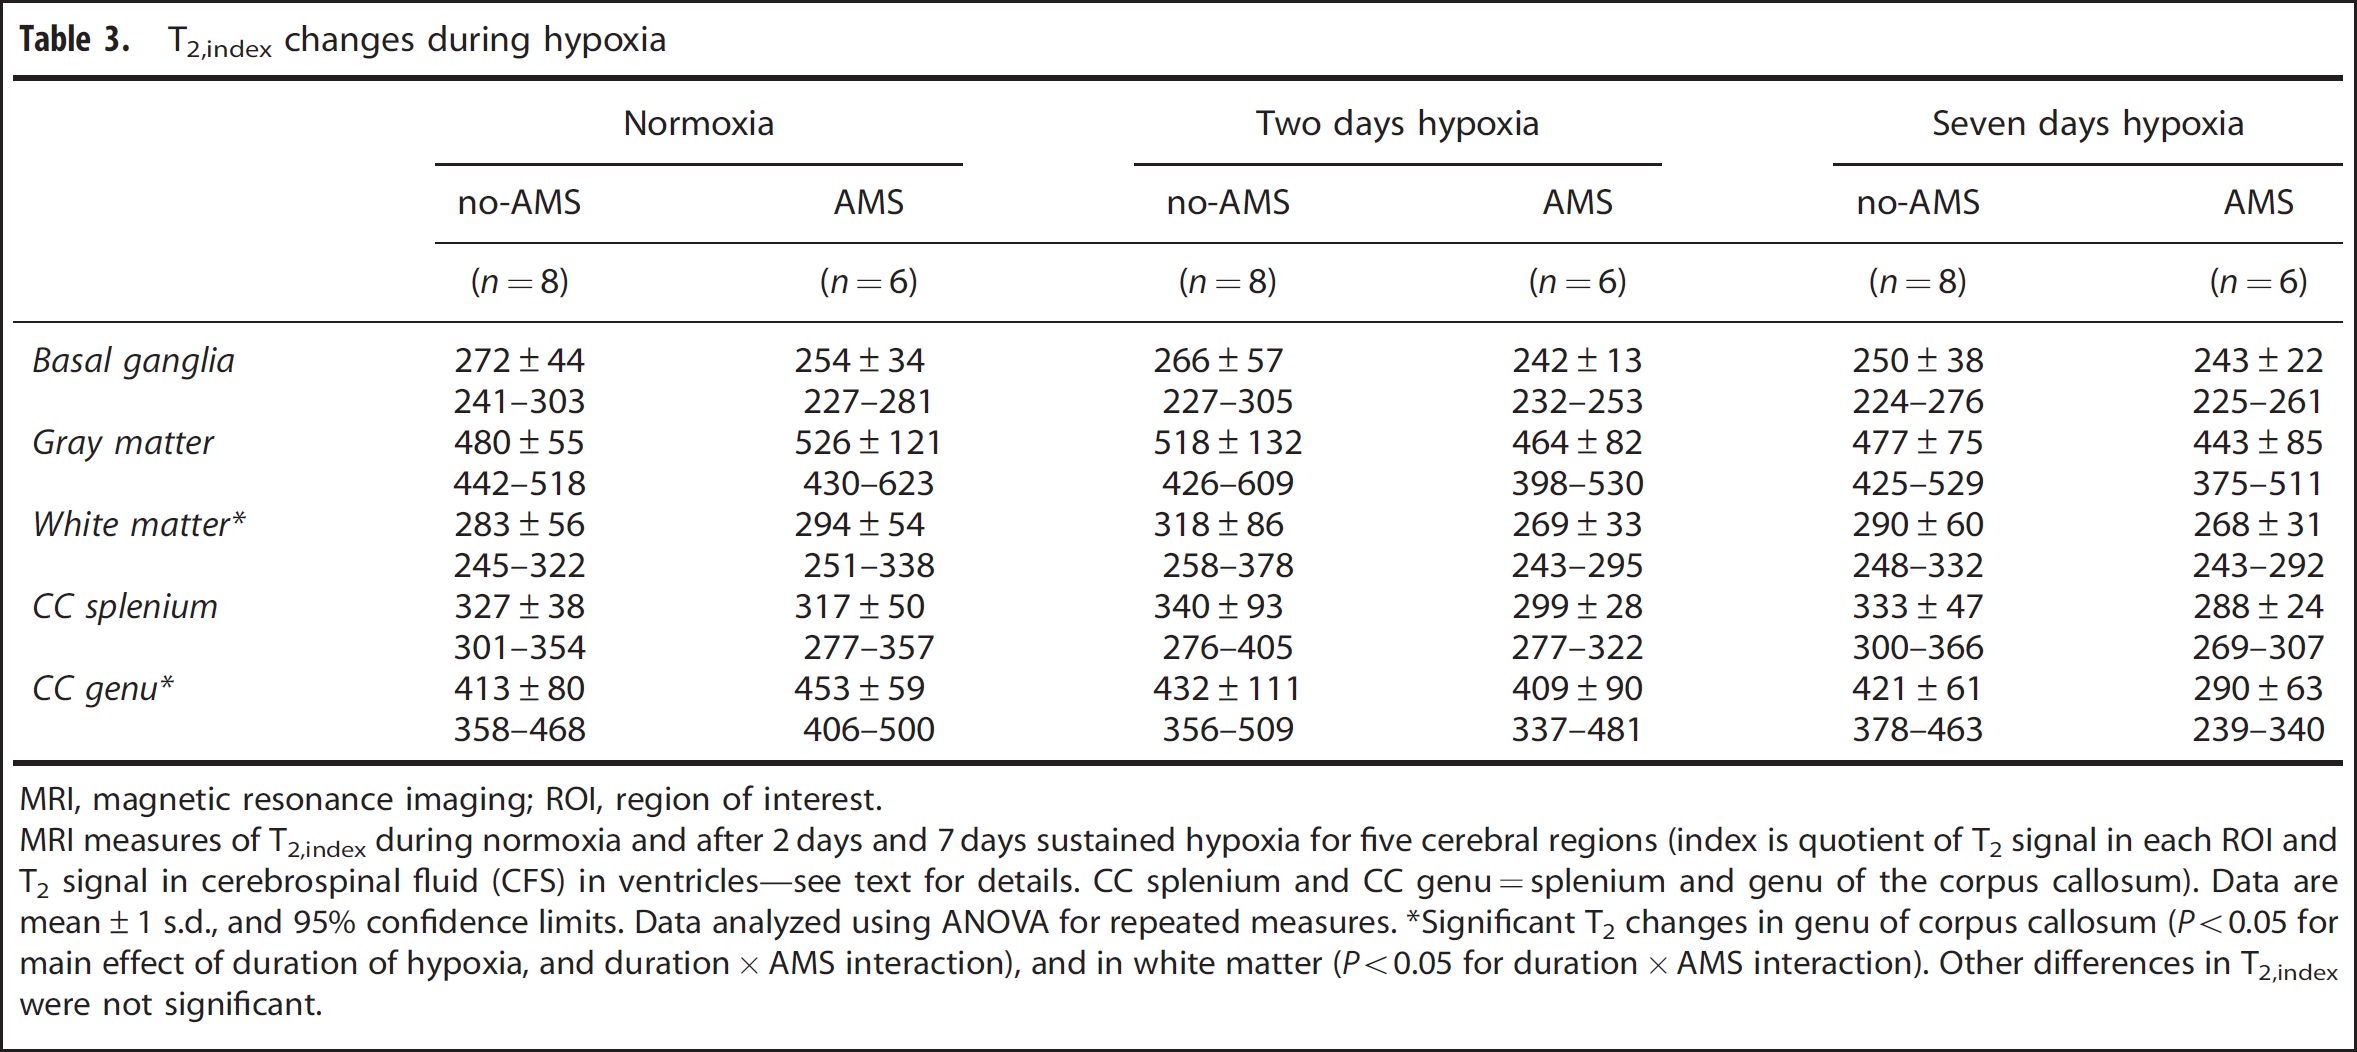
MRI, magnetic resonance imaging; ROI, region of interest.
MRI measures of T2,index during normoxia and after 2 days and 7 days sustained hypoxia for five cerebral regions (index is quotient of T2 signal in each ROI and T2 signal in cerebrospinal fluid (CFS) in ventricles—see text for details. CC splenium and CC genu=splenium and genu of the corpus callosum). Data are mean±1 s.d., and 95% confidence limits. Data analyzed using ANOVA for repeated measures. ∗Significant T2 changes in genu of corpus callosum (
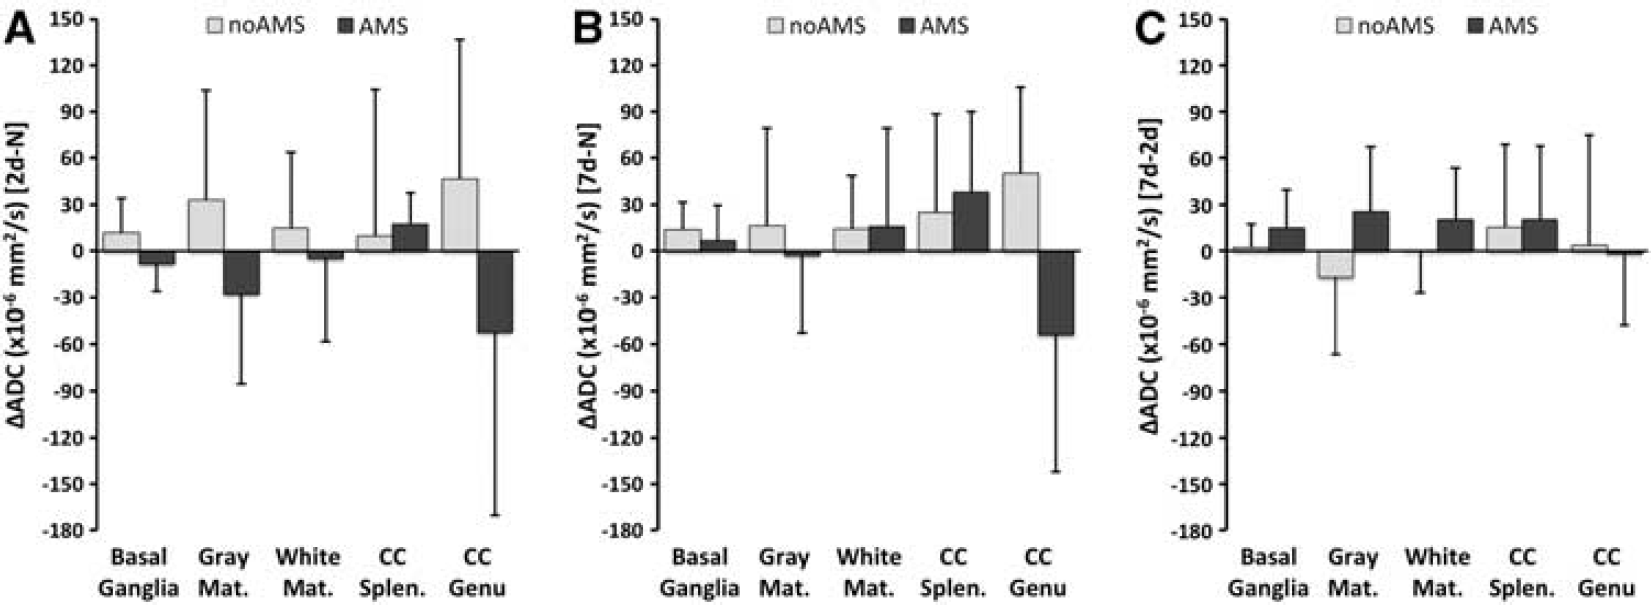
Changes in apparent diffusion coefficient (ADC) for acute mountain sickness (AMS) and no-AMS groups across different cerebral regions (basal ganglia, gray matter, white matter, splenium of corpus callosum, genu of corpus callosum—see text for details. Panels (
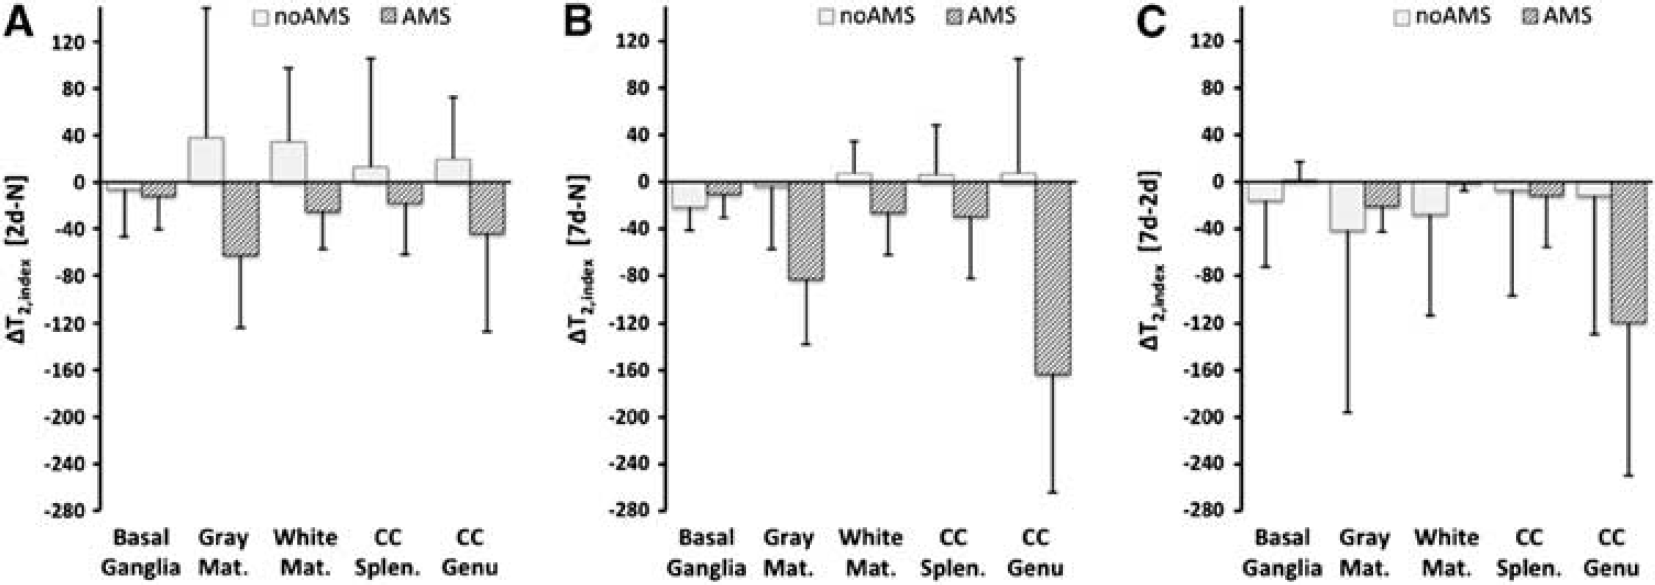
Changes in T2,index for acute mountain sickness (AMS) and no-AMS groups for different cerebral regions (regions are same as Figure 3. Panels (
Because of a technical failure with the Talairach transform with the T2,index images, only the ADC voxel-based maps are presented here. The spatial extent of the pattern of ADC change seen in Figure 3 is shown in maps in Figure 7. This showed a similar pattern of increased ADC with symptoms of AMS in regions of frontal, temporal, and parietal gray matter, and in basal ganglia. This pattern is also seen more diffusely in areas of white matter.
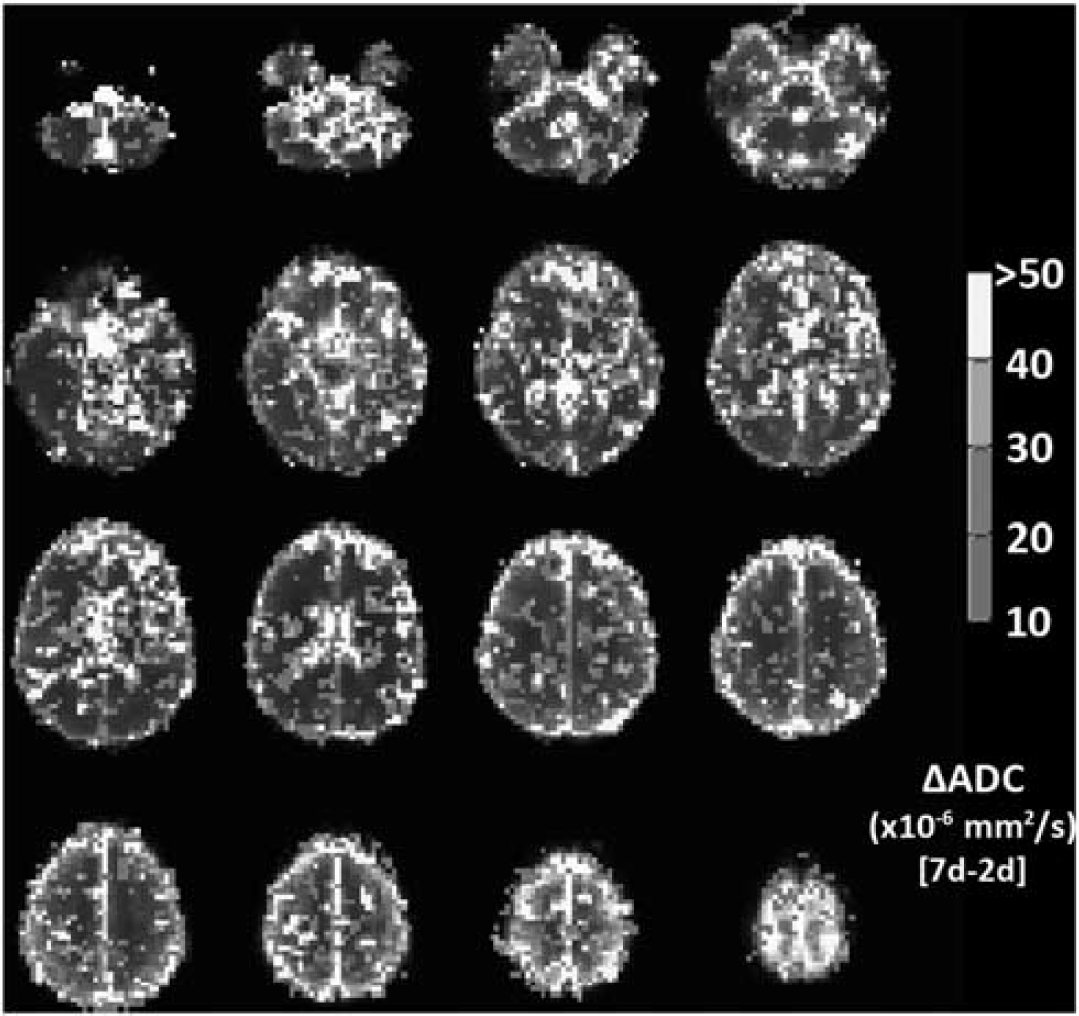
Voxel-wise changes in apparent diffusion coefficient (ADC), showing voxels with a signal change corresponding to symptoms of acute mountain sickness (AMS). Color scale indicates ADC change between symptomatic (AMS group) and asymptomatic (no-AMS group) evaluated as the difference between ADC at 2 days hypoxia (when AMS subjects are symptomatic, no-AMS subject are asymptomatic) and 7 days hypoxia (when all subject are asymptomatic). Voxels with ADC change <10 × 10−6 s/mm2 (i.e., insignificant difference between AMS and no-AMS group) or ADC change >100 × 10−6 s/mm2 (i.e., artifactually large changes, likely because of misregistration subtraction errors) are not colored. Map indicates that basal ganglia, frontal gray matter, and regions of parietal and temporal cortex, as well as scattered areas of white matter in centrum semiovale show ADC changes that increase with AMS symptoms. The color reproduction of this figure is available at the
When the ADC and T2 changes were analyzed for correlations with changes in other physiologic parameters during sustained hypoxia (Lake Louise AMS score, SaO2, hematocrit, and ETCO2), we observe a significant positive correlation between the change in Hct after 2 days hypoxia, and the T2,index changes in the basal ganglia (
DISCUSSION
The primary findings in the current study are different diffusion MRI characteristics in those subjects with symptoms of AMS and those without, with a direct correlation between ADC changes in the brain and symptoms of AMS. A decrease in ADC in gray matter, white matter, and basal ganglia is associated with symptoms of AMS at altitude. Conversely, an increase in ADC (either in subjects who are not susceptible to symptoms of AMS, or in susceptible subjects after subsequent acclimatization to altitude) is associated with an absence, or recovery from AMS symptoms. In addition, we observed an initial increase in T2,index in subjects without symptoms of AMS, but an initial decrease in T2,index in symptomatic subjects. After 7 days hypoxia, when all subjects were asymptomatic, T2,index was reduced below normoxia levels in everyone.
Edema or other increases in extracellular water are detectable on T2-weighted MRI as an increase in the MRI signal, because of the prolonged T2 relaxation time. Previous studies have used simple visual inspection to assess changes in T2-weighted signal,5,6 but this is both subjective and lacks precision. For this study, we quantified changes in extracellular water from changes in the MRI signal intensity on T2-weighted images. To remove biases from shifts in the global MRI signal by gain differences across different scan sessions, we normalized the tissue signal by the CSF signal in lateral ventricles (CSF signal is not expected to change in hypoxic conditions, and varies only with differences in amplifier gain during MRI acquisition). This quotient is robust across repeated scan sessions and allows a more precise quantitation of changes in T2-weighted signal than visual observation, or uncorrected signals, and the normalized index equates well with true T2 relaxation. One shortcoming of our use of T2-weighted images and T2 index rather than a multiecho T2 relaxation arose when we did voxel-based analysis. The T2-weighted images did not transform well into Talairach space. We suspect that this is related to B1 sensitivity in the images. This was not an issue with the ADC images, as any signal biases present on both
Prior studies in severe AMS3,9 have shown that the sickest patients may have increased T2, particularly in the splenium of the corpus callosum. Thus, our finding of a reduction in T2 signal specifically in subjects with symptoms of AMS was unexpected. The reduction in T2 signal would suggest a decrease in measurable extracellular water compared with normoxia conditions. In ischemia, the earliest T2 effect is a decrease in the relaxation time. Grohn 

Of the regions studied here, basal ganglia and gray matter are especially hypoxia sensitive, with white matter being more hypoxia resistant. 14 This regional hypoxia sensitivity did not predict the magnitude of the changes in ADC or T2 index. The ADC changes in the corpus callosum are however intriguing. The splenium has previously been observed to have a unique response to sustained hypoxia, and HACE has a predilection for this region. 3 In the present study, we noted that the ADC changes in the splenium and genu of the corpus callosum differed from the responses in other cerebral areas. In the genu, there is a larger decrease in ADC during acute hypoxia, than in other cerebral regions in symptomatic subjects. This exaggerated decrease in ADC was also described during acute studies. 7 After acclimatization the ADC remains low and there is no subsequent rise in ADC as symptoms abate. Conversely, the splenium does not show the usual pattern of decreased ADC and restricted diffusion in symptomatic subjects, but instead shows a pattern of increased ADC indicating less restriction to diffusion when symptoms are present. After 7 days hypoxia, when symptoms have resolved, ADC in the splenium remains elevated. This different pattern may represent a different mode of response in the splenium (increased rather than decreased ADC), or possibly a similar response to other regions, but at a faster timescale. Of note, the magnitude of the increase in ADC seen in the splenium between day-2 and day-7 in symptomatic subjects is similar to that seen in other regions, which would favor a typical response, but a very early decrease (before we made our 2-day measurements) and subsequent increase in ADC during sustained hypoxia. Our speculation of a typical, but faster response in the splenium is further supported by acute ADC measurements, 7 where earlier ADC measurements in symptomatic subjects (at 16 hours of hypoxia) did find small decreases in ADC. Previous reports of MRI in severe AMS and HACE describe a reversible vasogenic edema in the splenium.3,15 This correlates with our findings in the current study that during AMS symptoms, the only cerebral area with a vasogenic pattern of increased ADC is the splenium of the corpus callosum.
In the basal ganglia (but not other cerebral regions), the change in T2,index with 2 days sustained hypoxia was positively correlated with a change in hematocrit. The mechanisms underpinning this observation remain unclear. It does not relate to the usual intravascular relationship of shorter T2 times as Hct increases.
13
We speculate that there could be a local fluid shift between intracellular and extracellular compartments in the basal ganglia during hypoxia, with increased extracellular fluid tending to increase local T2. This observation warrants further investigation. The trend toward a negative correlation between AMS score and T2,index is also intriguing, with shorter T2,index times seen in those subjects with the most AMS symptoms. As discussed above, since nausea and poor appetite are significant symptoms of AMS, the AMS group as a whole would be expected to eat and drink less. Combined with low ambient humidity, a greater propensity to mild dehydration in the AMS group is very likely under these conditions. These observations become significant when the intermediate group is omitted (gray matter:
Despite being a common condition, the pathophysiologic mechanisms of AMS remain poorly understood. A leading hypothesis is that increased intracranial pressure because of brain swelling is the cause of the symptoms of AMS.
16
In this hypothesis, the variability between individuals is because of differences in the capacity of the CSF system to accommodate brain swelling, with a smaller capacity for changes in CSF volume producing a ‘stiffer’ less-compliant brain and a greater risk of increased intracranial pressure for the same level of brain swelling. The first step down the path to brain swelling is hypothesized to be increased cerebral blood flow and associated increased cerebral blood volume, which directly produces brain swelling—leading to increased capillary pressure and cerebral edema. We previously found that increased cerebral blood flow is a common outcome of ascent to high altitude,
17
as is cerebral swelling and reduced CSF volume,
18
but neither was associated with a greater propensity to develop AMS. An alternate hypothesis for brain swelling and symptoms of AMS may relate to compromised cerebral energy status. In early experiments with mitochondrial preparations, Wilson
Restricted diffusion in cerebral tissues with reduced ADC is an early change during cerebral ischemia, and precedes T2 increases by 6 to 48 hours.
23
The hypothesis that hyperacute decrease in ADC is associated with cytotoxic edema
24
has been supported by a number of studies, but the degree to which the ADC change involves intracellular or extracellular water remains controversial.25,26 Several studies indicate a link between altered ADC and cellular energy status; results from
31
P phosphorous spectroscopy studies link reduced ADC to a lowered phosphorylation potential.
27
In experimental models, there is a decrease in the energy-dependent Na+-K+ ATPase activity that maintains ionic gradients within minutes after the onset of ischemia.
28
Decreased diffusion may also be reproduced by intraparenchymal infusions of ouabain, an inhibitor of Na+-K+ ATPase, or by infusions of glutamate or
The exact biophysical mechanism linking cellular energy status with ADC remains uncertain. One possible mechanism to consider is intracellular streaming. Wheatley 33 argued that an intracellular circulatory system is necessary for metabolic function in most cells and that simple diffusion cannot provide adequate intracellular transport at the molecular level. This motion perfuses the interior of the cell by streaming of the fluid compartment of the cytoplasm and is energy dependent. During disruptions to cellular energy status this energy-dependent facilitated transport is lost, and ADC will be reduced as water motion changes from the high ADC of facilitated transport, to a lower value representing simple Brownian diffusion.
No direct assessment of causality was undertaken as part of this study; thus, the precise temporal relationship between AMS symptoms and ADC changes, and the mechanisms underpinning this relationship, still need to be established. However, we speculate that the changes in cellular microarchitecture that result in restricted diffusion are responsible for the development of AMS symptoms. Our findings of ADC changes that track symptoms of AMS support compromised cellular energy as the critical factor leading to AMS rather than a hyperdynamic circulation. We have previously observed increased CMRO2 during sustained hypoxia in the same subject population as the current study. 12 Thus, the difference between AMS-susceptible and AMS-resistant subjects may lie in the degree to which their cerebral phosphorylation potential is impacted by the hypoxia.
DISCLOSURE/CONFLICT OF INTEREST
The authors declare no conflict of interest.
Footnotes
ACKNOWLEDGEMENTS
The authors are grateful to Richard B Buxton for helpful discussions.