
Abstract
High-speed magnetic resonance imaging was used to perform simultaneous measurements of relative cerebral blood volume (rCBV) and water diffusion changes during spreading depression (SD) induced by cortical potassium chloride application. Rats were fitted epidurally with a rubber chamber. Potassium chloride was perfused through the chamber until SD was indicated by a negative direct current (DC) potential shift. Magnetic resonance imaging scans used echo planar diffusion and T2-weighted images. Iron dextran was injected as a blood pool contrast agent to make subsequent changes in T2 (or T2*) directly proportional to changes in CBV. Multislice maps of apparent diffusion coefficient (ADC) and rCBV were generated with 6- to 16-second time resolution, which revealed transient ADC and rCBV changes propagating over the cortex after potassium chloride application. Transient ADC declines appeared simultaneously with the DC shift, whereas rCBV increase followed with a delay of 16.4 ± 14.9 seconds. Prolonged rCBV decrease was observed after the initial increase during the SD in half of the animals. The delayed rCBV response after the ADC change supports the observation of increased energy demand because of repolarization. Simultaneous DC potential recording and ADC measurements in corresponding sites of the cortex indicate that transient ADC decreases during SD reflect water shifts associated with cell depolarization.
Keywords
Spreading depression (SD) has been studied extensively in animal models (do Carmo, 1992) and might be an important mechanism in several human diseases (Lauritzen, 1994). It is a pathophysiologic event that is characterized by a depression of EEG activity and a change of the direct current potential as an indicator of a short-lasting cell membrane depolarization (Leão, 1944b; Leão, 1945). Spreading depression can be induced by a variety of cortical stimuli, including potassium chloride or glutamate application, and electrical or mechanical stimulation; it also occurs secondary to ischemia (Bures et al., 1974; Nedergaard and Astrup, 1986; Strong et al., 1983). It is accompanied by severe changes in ion homeostasis and water shifts from the extracellular to intracellular space, as mirrored by changes of the electrical impedance and the direct current (DC) potential (Hansen and Olsen, 1980; Kraig and Nicholson, 1978). The area of depolarization spreads along cortical tissue like a wave, moving away from the initiation site toward the periphery and propagates with an estimated velocity of 3 mm/min (Leão, 1944b). Electrical measurements from the surface of the cortex show a negative deflection of the DC potential, lasting 1 to 2 minutes, combined with a suppression of the EEG. Under normoxic conditions, SD is not followed by permanent neuronal damage (Nedergaard and Hansen, 1988), and the depression of the neuronal activity is compensated by increased glucose metabolism and blood flow during the repolarization phase. The cell membrane repolarization requires an enormous metabolic effort and is compensated by increased glucose metabolism and increased blood flow (Kocher, 1990).
Changes of cerebral hemodynamics before, during, and after SD in rodents have been extensively studied. The initial report of Leão, describing a pial dilatation during SD (Leão, 1944a) has been corroborated by findings of a transient initial increase in CBF with different techniques including autoradiography, pial arteriolar diameter measurements, and laser Doppler flowmetry in anesthetized animals 5 (Hansen et al., 1980; Mies and Paschen, 1984; Lauritzen, 1987; Shibata et al., 1990; Mayevsky and Weiss, 1991; Piper et al., 1991). A prolonged period of hypoperfusion follows the initial hyperemia and lasts for more than 2 hours (Lauritzen, 1984; Duckrow, 1991). Constriction of the pial arterioles in the contralateral hemisphere was observed, which is difficult to explain (Shibata et al., 1990). Different levels of CBF increase during SD have been observed, depending on the resting CBF level and the spread of the hemodynamic change, and were explained as an effect of anesthesia (Lauritzen, 1987; Duckrow, 1991).
Although there is major agreement that a transient CBF increase occurs during cellular repolarization, which is followed by a period of prolonged hypoperfusion, data concerning the changes in cerebral hemodynamics before SD are varied. A vasoconstrictive phase before SD has been described (van Harreveld and Stamm, 1952; Hansen et al., 1980) but could not be affirmed in other studies monitoring pial artery diameters or perfusion rates (Leão, 1944a; Leão, 1945; Mies and Paschen, 1984).
New magnetic resonance (MR) imaging techniques have revived the interest in SD. The high temporal and spatial resolution of MR imaging is ideally suited to investigating the hemodynamic responses associated with SD. Different MR imaging approaches have been used to investigate specific aspects of the SD phenomenon. Gradient echo sequences are sensitive to changes in CBF and metabolism that occur during the SD wave propagation (Gardner-Medwin et al., 1994), whereas diffusion-weighted imaging is capable of detecting water shifts from extracellular to intracellular compartments that are associated with depolarization and give rise to dramatic cellular swelling, which is characteristic of SD (Latour et al., 1994; Röther et al., 1996a).
The temporal relation between the cell depolarization and the accompanying hemodynamic response is of interest to gain an understanding of putative pathophysiologic involvement of SD in conditions such as migraine. This is relevant, since ultrafast MR techniques (Cao et al., 1997) can be used to assess the role of SD in migrainiers because the progression of certain types of migraine closely mimics the characteristics of a SD phenomenon in the aura phase (Milner, 1958). Using a combination of high-speed MR imaging and DC recording, we demonstrated the spatial-temporal relation between changes in the apparent diffusion coefficient of water (ADC), relative cerebral blood volume (rCBV), and cell membrane polarization measured in the anesthetized rat brain after potassium chloride-induced cortical SD.
METHODS
Animal preparation
Male Sprague-Dawley rats (280 to 320 g, n = 13) were anesthetized with halothane (0.75% to 1.5%) through a passive flow face mask. Arterial and venous femoral catheters were inserted for contrast agent injection, blood pressure measurement, and sampling for arterial blood gas analysis. Physiologic parameters were kept within the normal range. Temperature was maintained at 37° ± 1°C using a warm air circulation system and measured using a rectal probe. A rubber chamber (3-mm diameter) with inlet and outlet lines was fitted epidurally after a parietal craniotomy. Potassium chloride (0.3 mmol/L) was perfused through the chamber for 2 to 3 minutes until SD was indicated by a negative DC potential shift, at which point the chamber was flushed through with a saline solution. The DC potentials were recorded from a chlorided 50-μm diameter silver electrode that was placed through a 1- to 2-mm burr hole 4 to 5 mm in front of the chamber.
Both DC potential and blood pressure were recorded continuously by a Macintosh computer fitted with a data acquisition card (Strawberry Tree, Sunnyvale, CA, U.S.A.). In addition, a spare digital line on the scanner, programmed to pulse at the start of each image set, was connected to the data-recording system to allow accurate temporal correlation of the MR imaging and DC potential measurements. A small water-filled tube was positioned adjacent to the DC electrode so that it would be visible in the MR images, to aid in positioning one of the imaging sections directly beneath the silver electrode.
Magnetic resonance measurements
The MR experiments were performed on a 2.0T GE CSI system (Bruker Instruments, Fremont, CA, U.S.A.) using a spin-echo echo planar imaging (EPI) technique (echo time [TE] 88 milliseconds, repetition time [TR] 2 seconds, field of view 40 mm, 2.3-mm slice thickness, 64 × 64 matrix, one or three axial or coronal slices, one average). For most studies, a homemade 5-cm internal diameter bird cage-type radiofrequency coil was placed over the head of the animal with sufficient room for DC electrodes, whereas for three animals, a 2.5-cm diameter surface coil was used instead. For the scans using the head coil, ADC was measured with a sequence of six diffusion-weighted EPI (weighting along the Z direction, b values 0 to 1300 s/mm2) (Röther et al., 1996a), followed by T2-weighted EPI at 40- and 60-millisecond echo time. In half of the animals, gradient echo EPI at 15- and 28-millisecond echo time were used, instead of spin echo, for enhanced T2* sensitivity. This set of eight images (for each slice) was repeated continuously for 16 minutes while one or two SD episodes were elicited. In the three scans using the surface coil, the improved signal-to-noise ratio allowed better spatial and temporal resolution to be achieved. For these animals, TR was 1.5 seconds, slice thickness was 1.7 mm; a repeated sequence of three diffusion weighted images (b values 0, 1300 s/mm2), and one gradient echo image (TE 28 milliseconds) were acquired to obtain a temporal resolution of 6 seconds per ADC or rCBV map.
To increase the sensitivity of the T2- or T2*-weighted images to perfusion changes, an iron-containing blood pool contrast agent (1 mL, intravenous, iron-hydrogenated dextran [Butler Co., Columbus, OH, U.S.A.], 100 mg/mL) was injected at the start of the experimental session, resulting in a ∼50% decrease in spin-echo EPI intensity for TE 60 milliseconds. An increase in blood volume increases the contrast agent concentration in the imaging slice and causes an increase in transverse relaxation rate, R2 (equals 1/T2, i.e., decrease in T2-weighted image intensity), whereas a decrease in blood volume decreases R2 (increased T2-weighted image intensity). Experimental and theoretical (Fisel et al., 1991) studies show that ΔR2 calculated from the spin-echo or gradient-echo EPI is directly proportional to the change in blood volume.
In addition, three of the animals received acetazolamide (Diamox, 100 mg/kg intravenously), and SD episodes were elicited before and after injection.
Data processing
The diffusion-weighted data were processed to generate serial ADC maps (Latour et al., 1994) with 6- or 16-second temporal resolution. The T2- and T2*-weighted data were processed to generate maps of the change in transverse relaxation rate, ΔR2 (Rosen et al., 1990), according to ΔR2 = −ln(St/S0)/TE, where St is the MR image intensity at some time “t” during the experiment, and S0 is the baseline intensity. If S0 is the precontrast intensity value, then the ΔR2 values can be normalized (Hamberg et al., 1996) to yield the change in relative cerebral blood volume (rCBV) in percent of the baseline(pre-SD) value. The rCBV values were not corrected for washout of the iron dextran contrast agent (Hamberg et al., 1996) because the washout rate was observed to be negligible during the course of the experiment (2 to 3 hours).
To determine the area of brain on each imaging slice that exhibited transient changes, the ADC or rCBV time course at each pixel position was displayed with the image analysis software (MRVision Co., Menlo Park, CA, U.S.A.) and the pixels exhibiting transients summed. For evaluation of the detailed time course, a series of square nonoverlapping 2 × 2 pixel regions of interest (ROI) were defined covering the region exhibiting both transient ADC and rCBV changes (an average of seven ROI per scan). One ROI in each slice set was chosen to be as close as possible to the DC recording electrode. The DC, ADC, and rCBV changes were plotted as a function of time, and mean and SD values were calculated for the maximal ADC and rCBV change, the time delay between maximal ADC, rCBV transients, and the total duration of these changes.
RESULTS
Physiologic parameters remained within the normal physiologic range throughout the experiments: MABP 91 ± 20 mm Hg, pH 7.4 ± 0.1, PaO2 178 ± 41 mm Hg, and Pco2 44 ± 9 mm Hg.
A total of 25 experiments were performed in 13 animals. Application of potassium chloride to the cortex provoked SD, which was observed on the serial MR images as a transient ADC decrease, propagating from the back of the brain toward the front (axial slices), and from the midline toward the base of the brain (coronal slices; Fig. 1A). The rCBV maps showed a transient increase in signal (Fig. 1B), indicating a transient blood volume increase, which also propagated over the cortex. The ROI measurements showed that transient ADC declines appeared simultaneously with the DC shift when the ADC was measured close to the electrode position (Fig. 2). The same pattern of close agreement between the occurrence of DC transients and the ADC changes, when measured as close as possible to the electrode position, was observed in all cases.
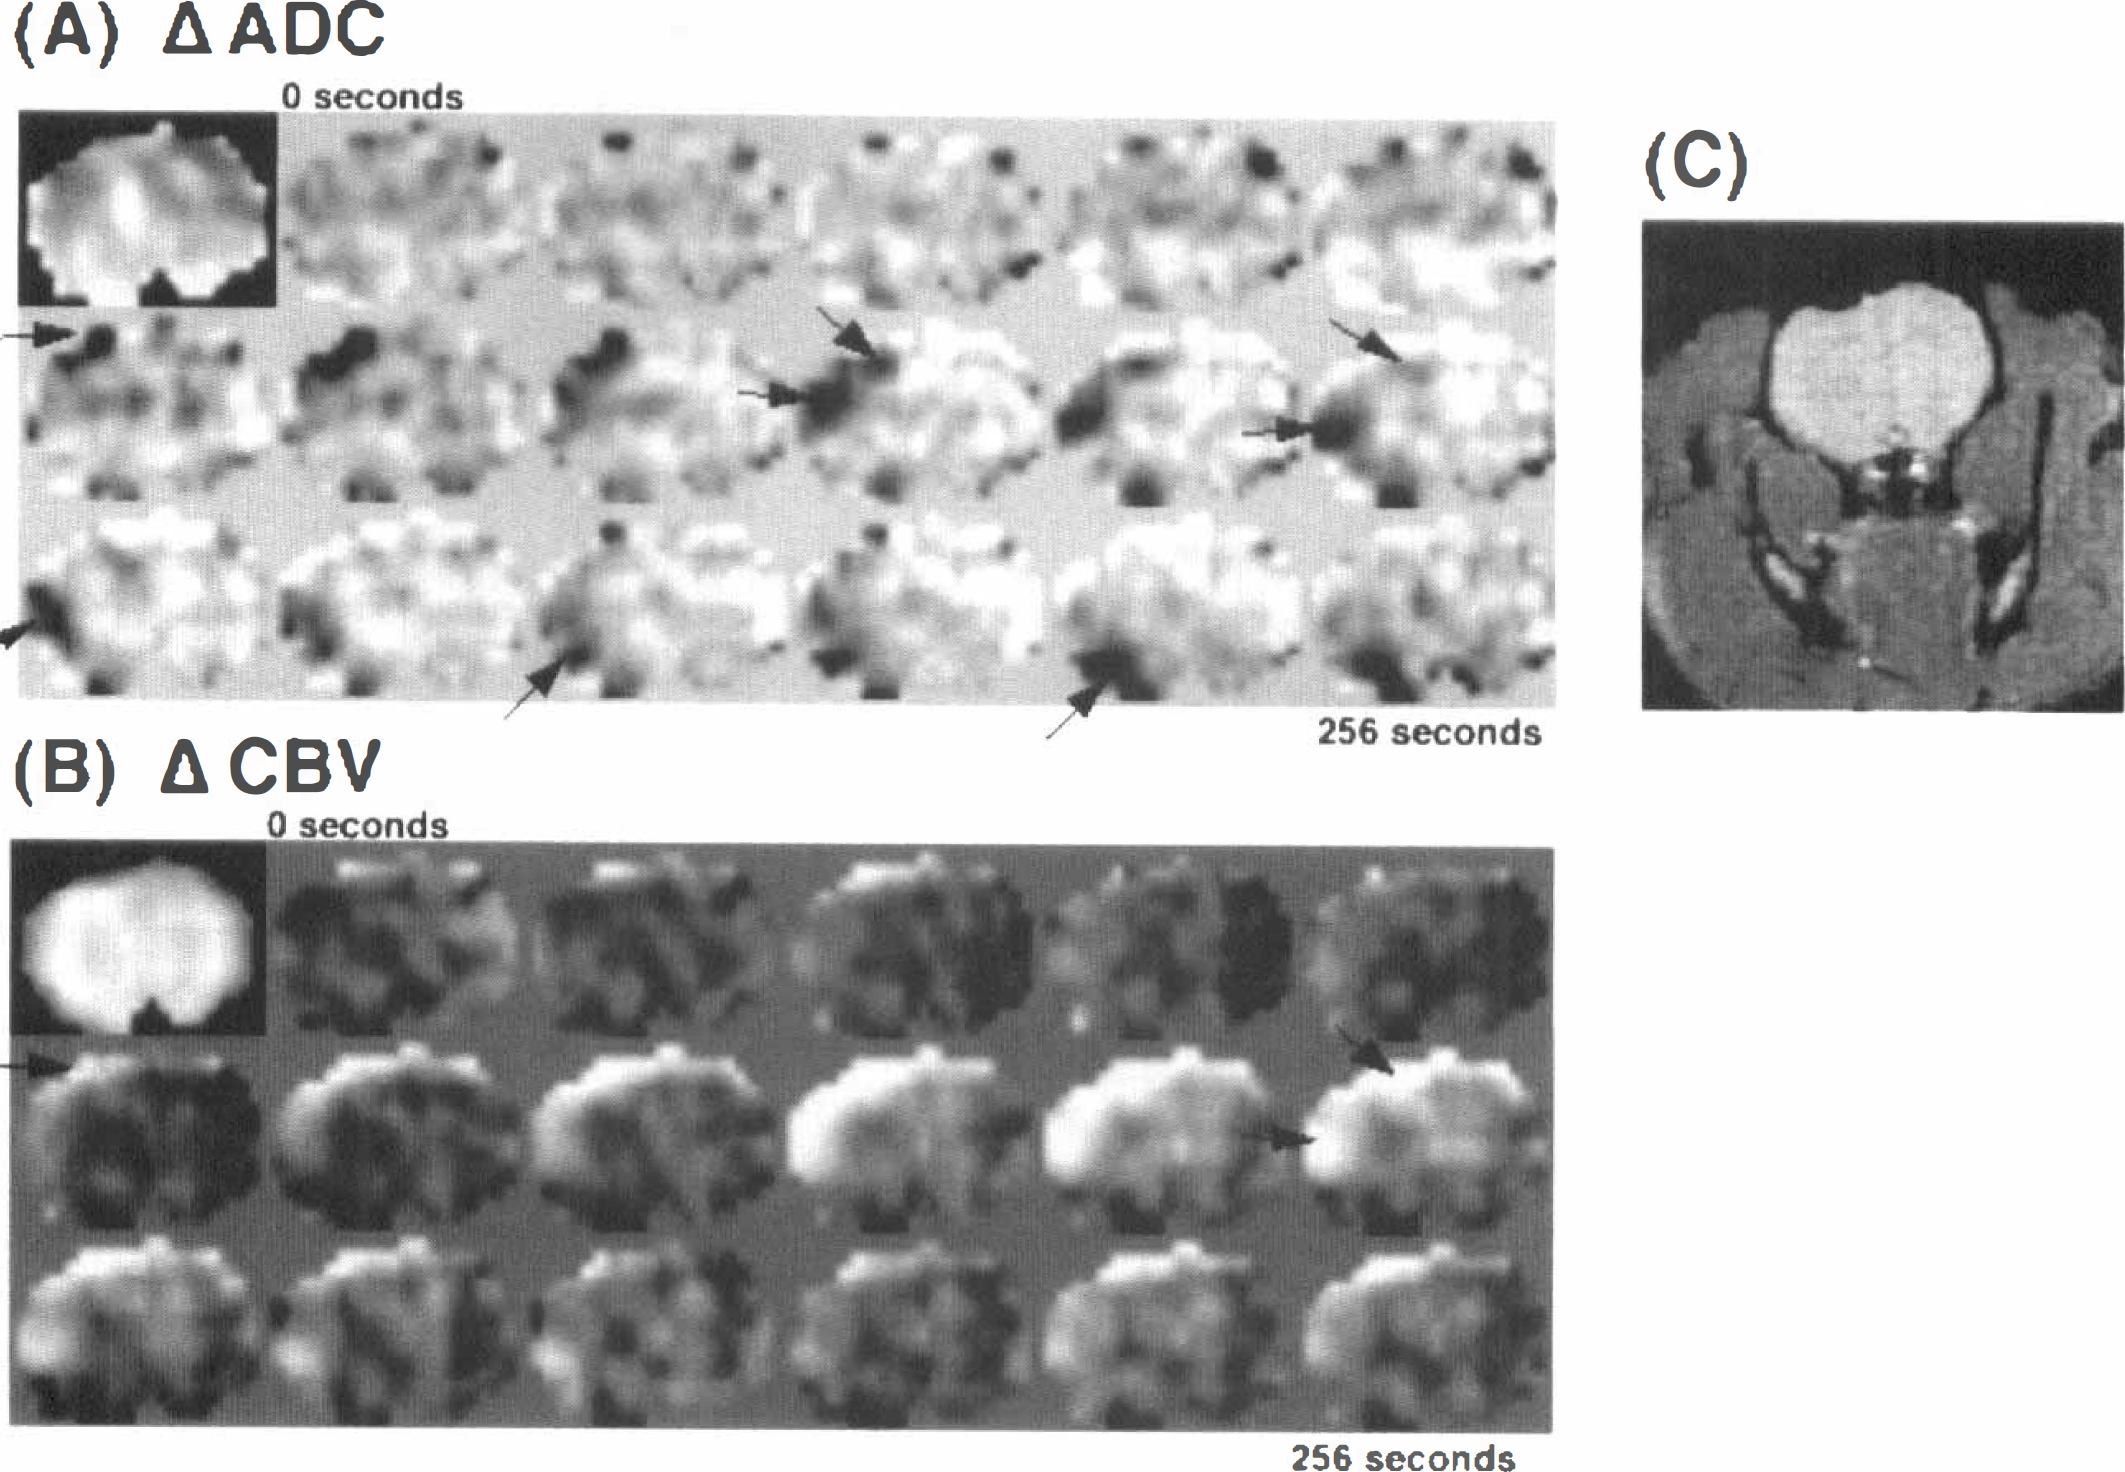
Serial apparent diffusion coefficient (ADC) difference images
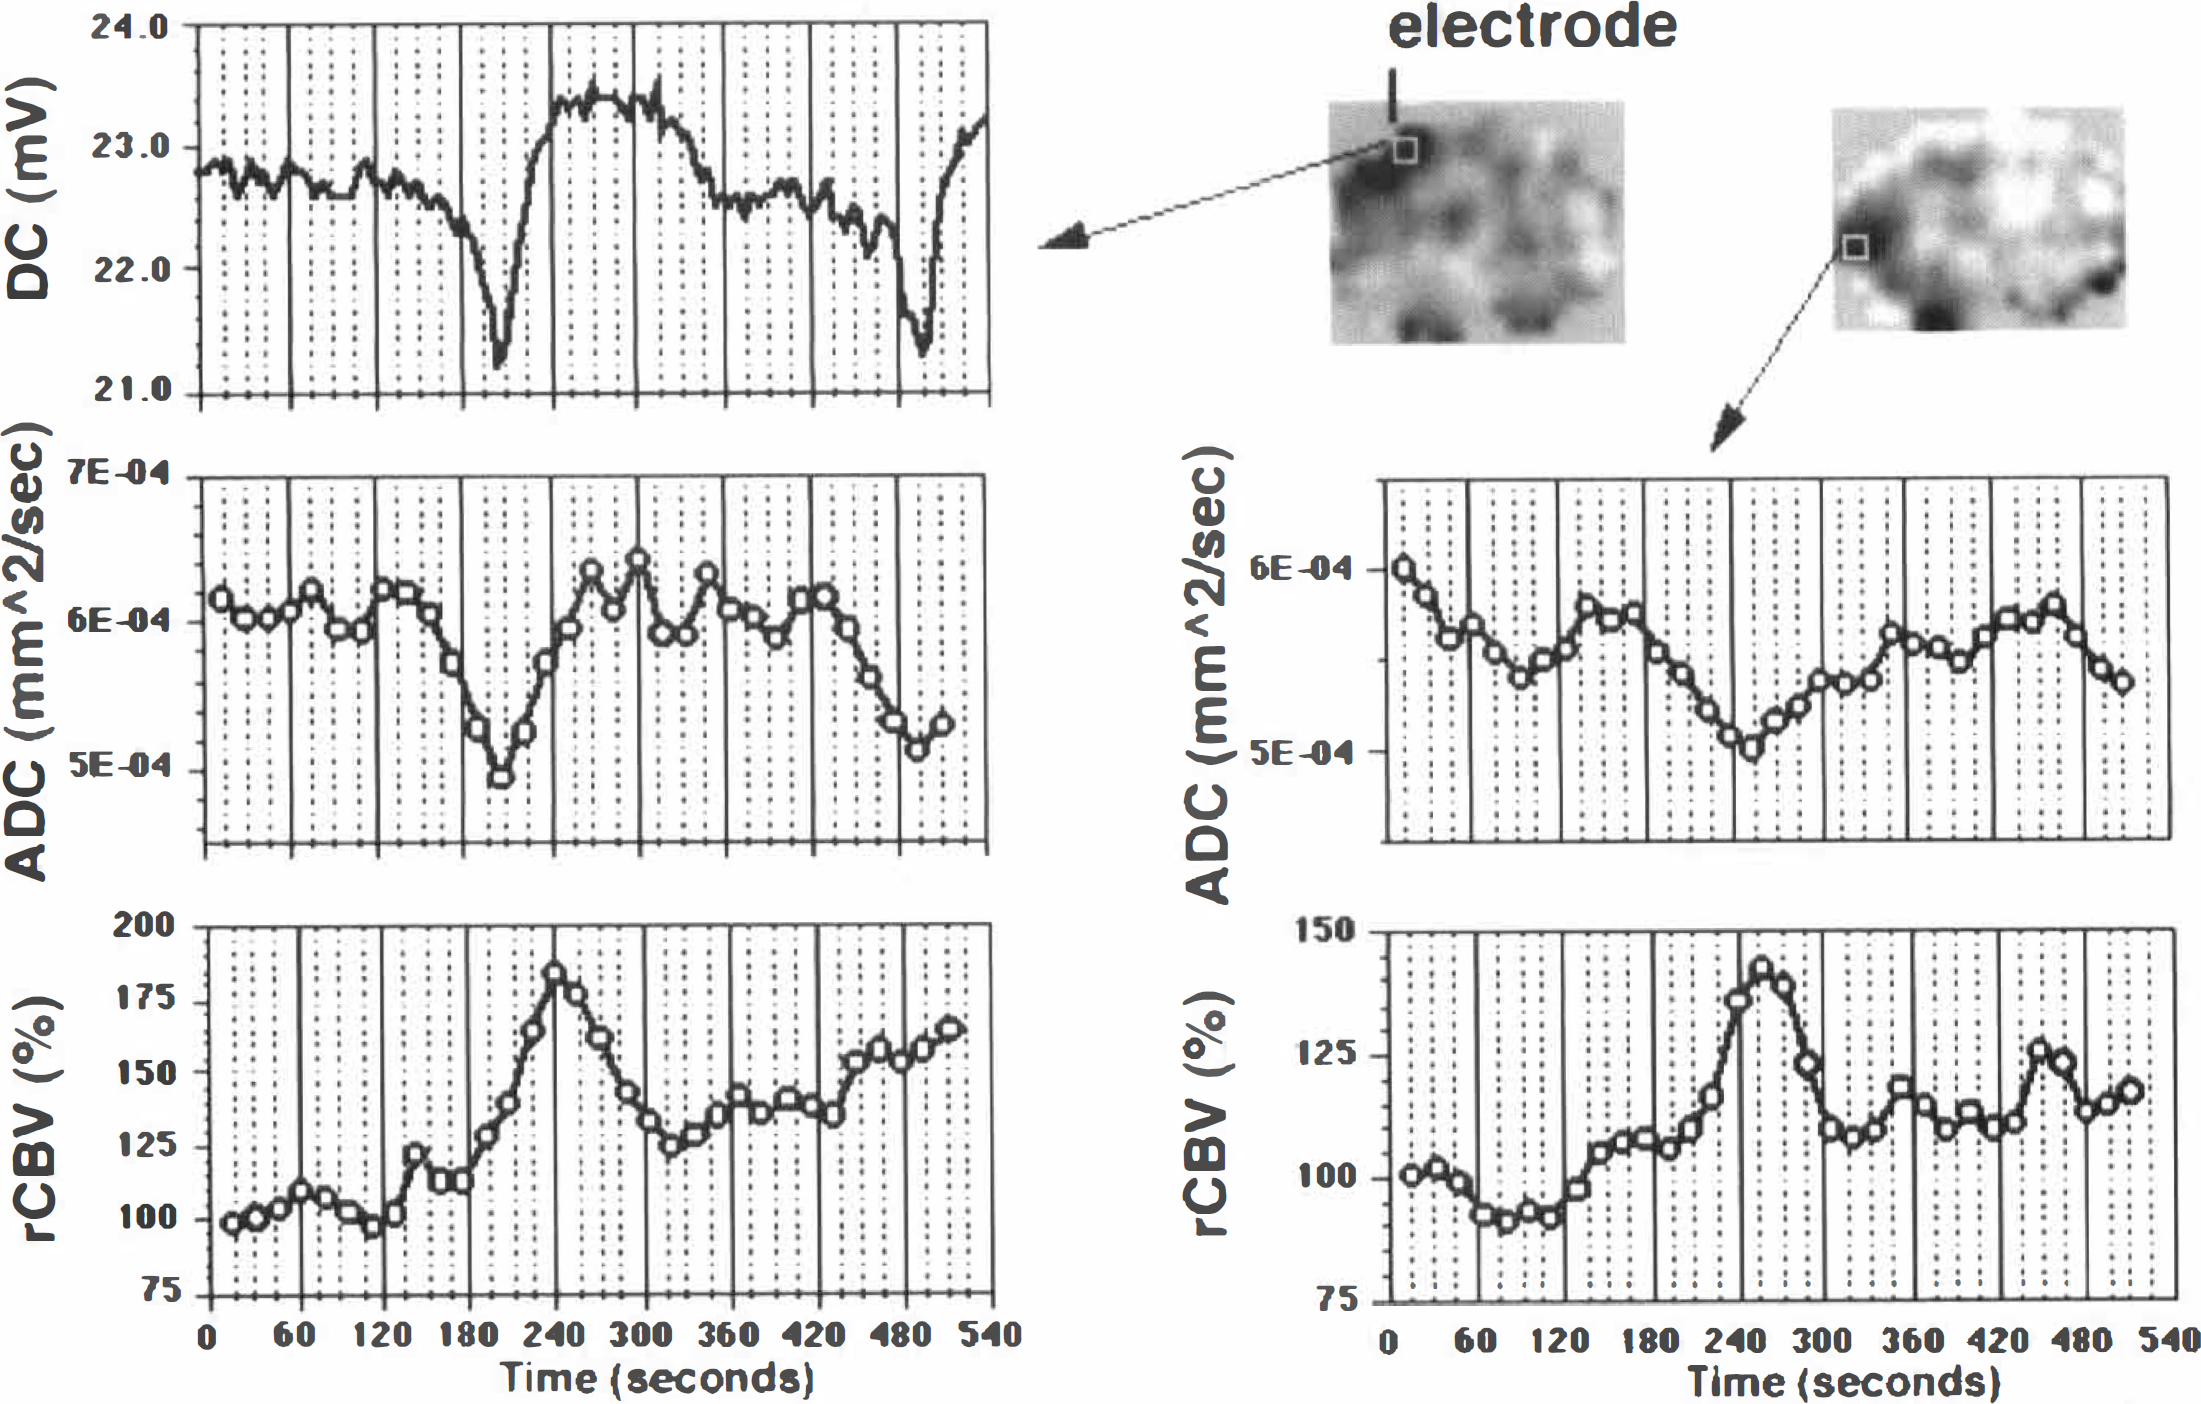
Plots of ADC and rCBV over time for two small cortical regions of interest (ROI) on the data shown in Fig. 1. One ROI was positioned beneath the direct current (DC) electrode, whereas the other was further down the cortex, as shown in inset ADC images. The ADC trace under the electrode shows a good temporal correspondence with the DC curve. The rCBV response has a similar time course but is delayed by 30 seconds relative to the ADC or DC. In the second ROI, the peak ADC response occurs 45 seconds after that in the upper ROI, reflecting the transit time of the SD wave. Again, the rCBV response is similar, but now it is almost coincident with the ADC change. A second SD transient also is observed starting to propagate at the end of the ADC trace in the upper ROI.
The rCBV transients followed the ADC transients (Fig. 2) with a temporal delay of 16.4 ± 14.9 seconds (maximum 56 seconds, minimum −32 seconds) (see legend to Fig. 2). This value is averaged over all scans on all animals: the value for the higher time resolution scans (with the surface coil) was 17.3 ± 12.2 seconds, and 15.9± 16.0 seconds for the slower (head coil) scans (not significantly different for P = 0.05). Because of the similarity of the data from the higher and lower time resolution scans, all of the ROI data were pooled and analyzed together. Fig. 3 shows the distribution of the time delay between the peak rCBV and peak ADC changes during SD for all of the ROI measured. Some uncertainty in the time lag arises because of the finite sampling rate (12 or 6 seconds) and because of the averaging of four pixels into a ROI measurement (which tends to broaden the measured transient profile). However, these effects are unlikely to explain the width of the distribution of the rCBV-ADC peak values, which therefore likely reflects a real variability in the time lag of the rCBV transient relative to the ADC transient, including a significant number of negative delays (i.e., rCBV leads ADC change). Whereas the ADC changes propagated in a predictable fashion from animal to animal(i.e., outward from the initiation site), the propagation of rCBV transients was less straightforward. The relative timing of the ADC and rCBV transients is illustrated for one animal in Fig. 4, which compares ADC and rCBV plots at different positions for one animal during two sequential cortical SD episodes. In general, the peak rCBV change lagged slightly behind the peak ADC change; however, ROI 1 in Fig. 4 shows an example of a region where the rCBV transient appears to precede the ADC change.
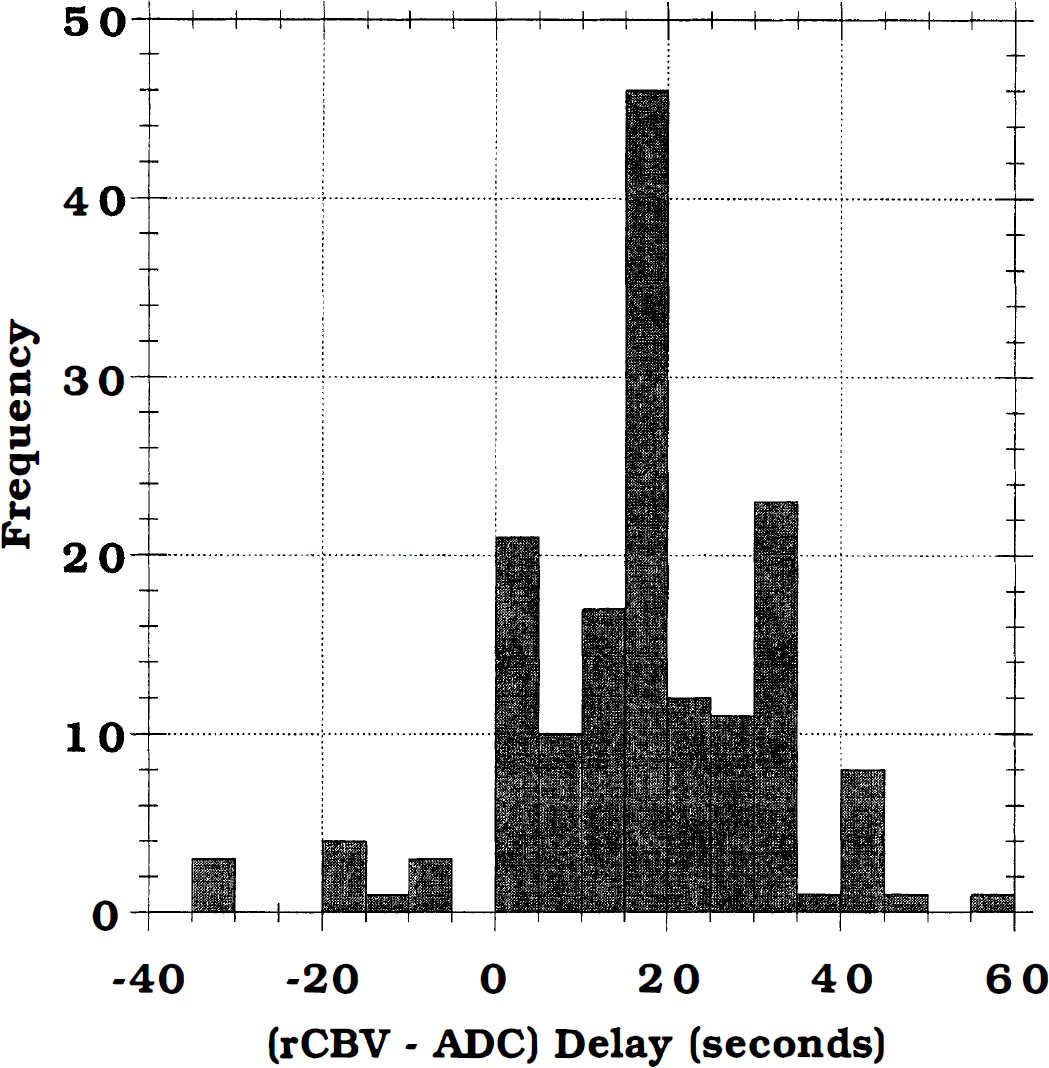
Histogram of the delay time of the peak rCBV transient behind the peak ADC transient(i.e., Tpeak ΔCBV − Tpeak ΔADC) for all of the ROI measured (both axial and coronal planes). The average delay was about 16 seconds, although in 21 regions measured the peak of the ADC and rCBV transients occurred simultaneously, and in 11 ROI the peak rCBV transient occurred before the peak ADC transient.
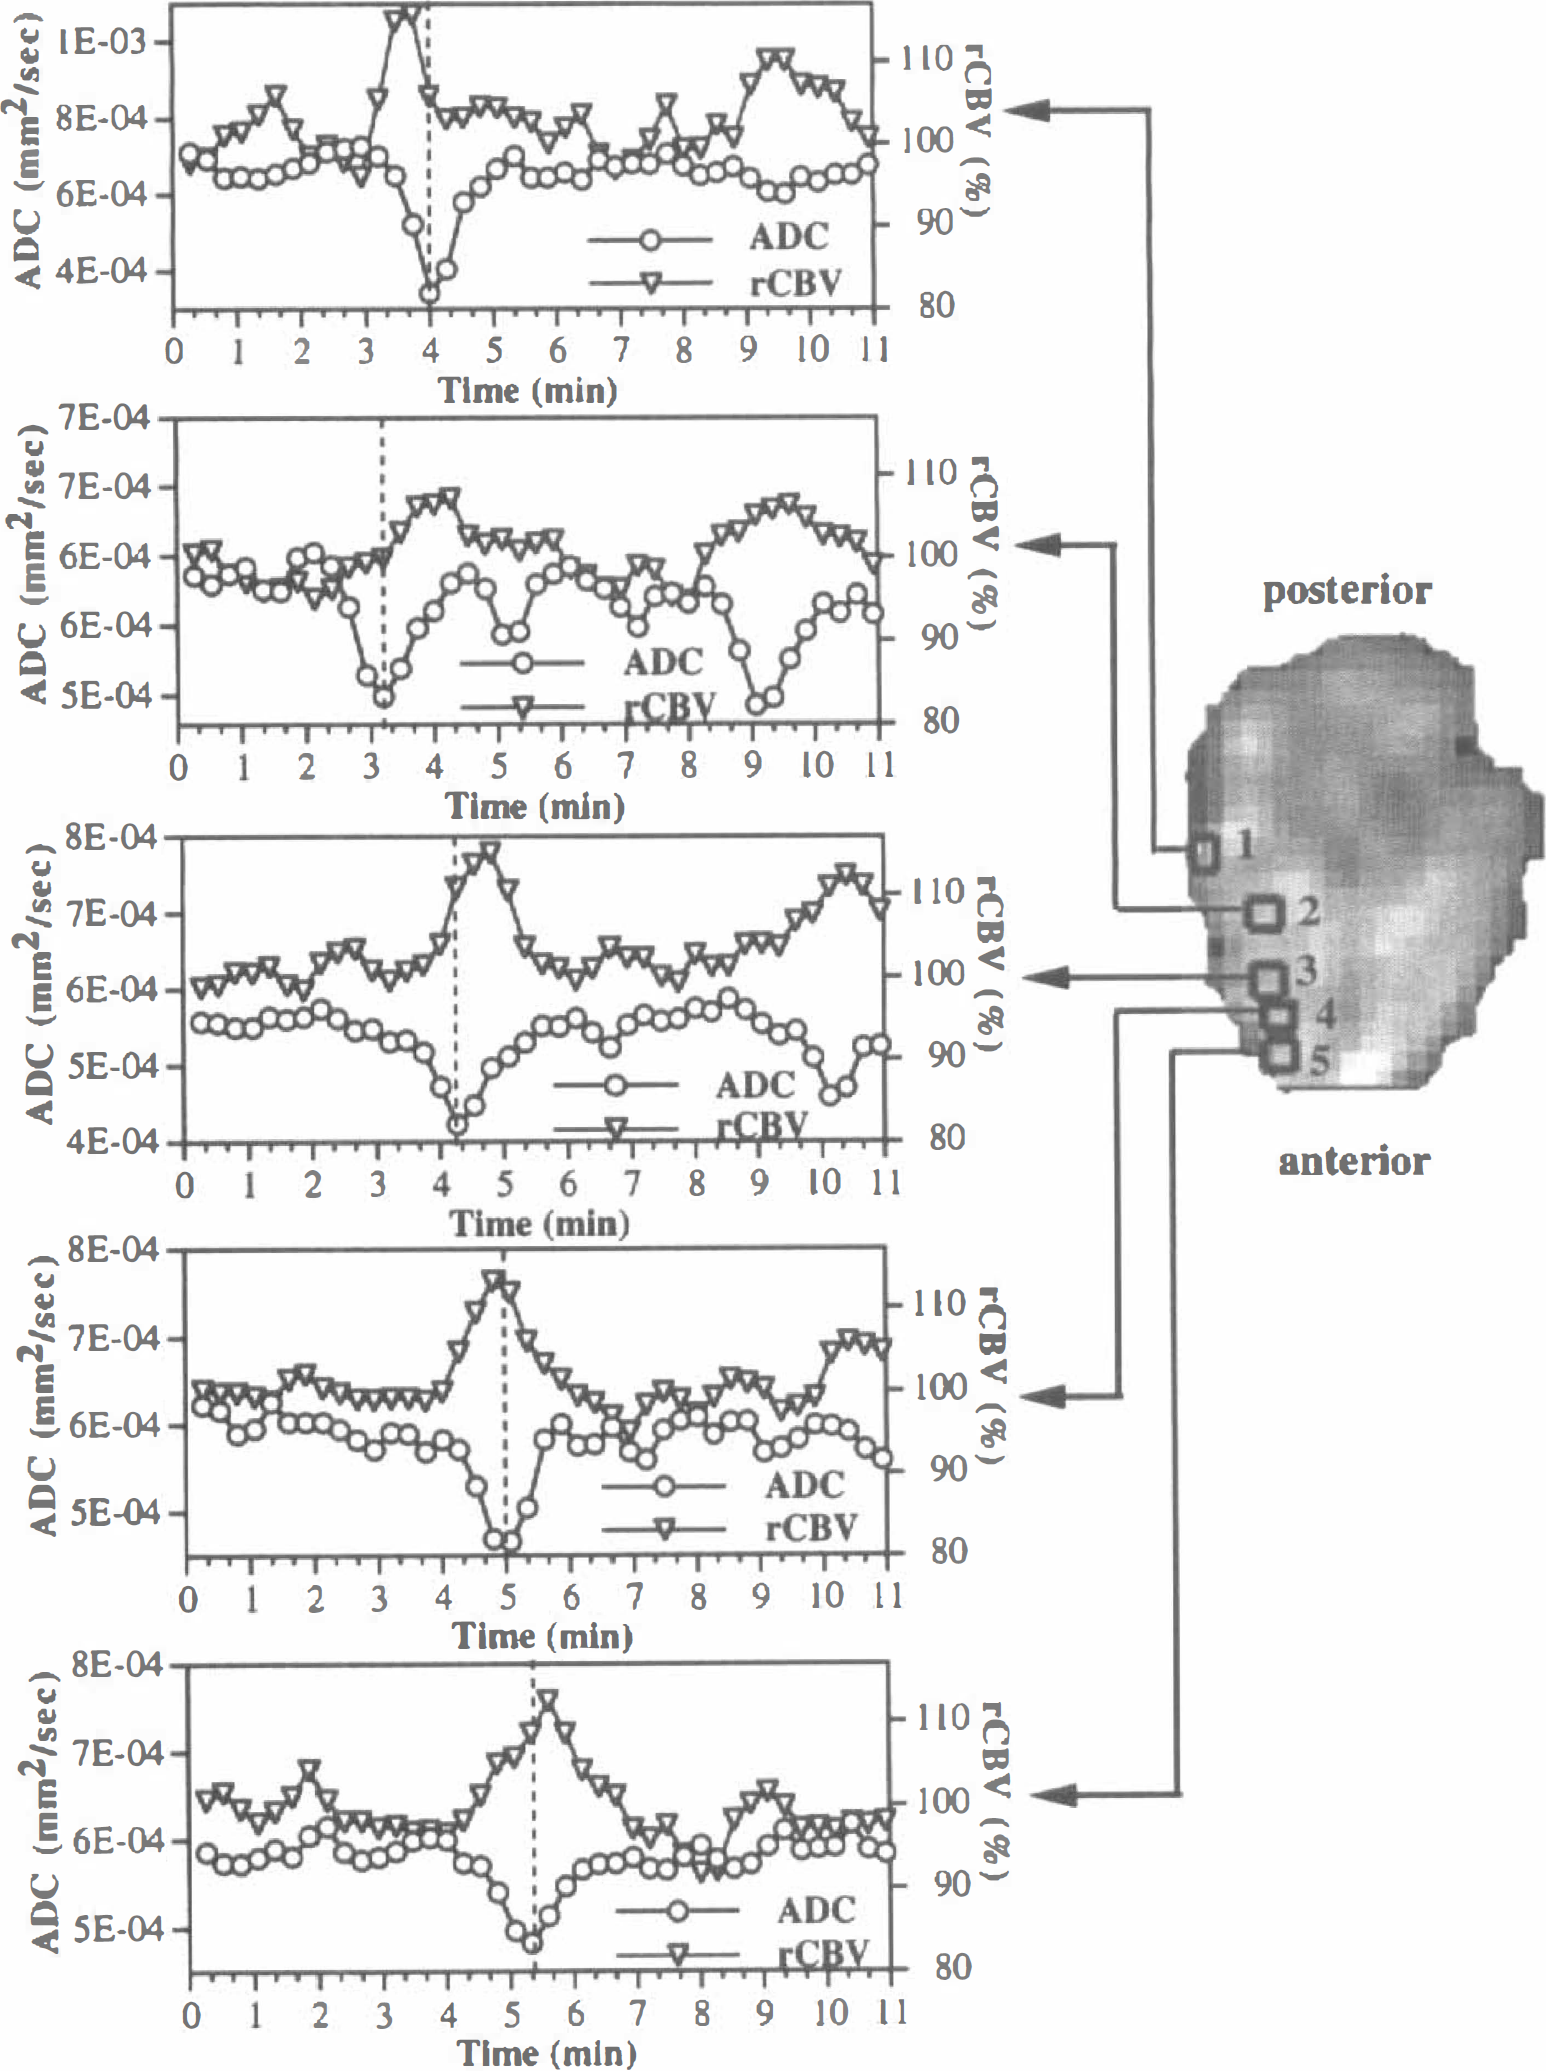
Plots for ADC and rCBV at various locations in the brain during two sequential episodes of SD. The insert axial ADC image shows the locations of the ROI: region 2 was approximately beneath the SD initiation site. The wave of decreased ADC propagated both anterially and posterially along the cortex from the initiation site. The dashed vertical lines in each plot indicate the peak of the first ADC transient and are intended to aid in comparison of the relative timing of the ADC and rCBV transients. While the rCBV transient generally lagged the ADC change slightly; ROI 1 shows an example of the reverse, where the rCBV change leads the ADC change.
Transient ADC and rCBV changes were limited to the cortex. The area exhibiting rCBV changes was 22± 9 mm2, whereas the area of the transient ADC decrease was 27 ± 13 mm2. During a transient, the ADC decreased to 82% ± 6% of baseline(compared with about 50% in ischemia). The transient rCBV increase was 28% ± 12% above baseline. The duration of the propagating ADC decrease was 68 ± 25 seconds, whereas the duration of the transient rCBV increase was 84 ± 50 seconds.
A post-SD rCBV decrease to 74.6% ± 6.3% of baseline (indicating a hypoperfusion phase) was observed in seven scans (in 7 of 13 animals) after the initial transient rCBV increase during the SD. This decreased rCBV phase continued at least until the end of the scan (∼12 minutes) and perhaps longer. In cases of multiple SD in the same scan, the rCBV transient of the second SD was superimposed on the decreased rCBV level after the first SD. Fig. 5 shows an example of two SD episodes in the same animal, 6 minutes apart. In these axial sections, the serial ADC maps show the first SD wave propagating radially outward and forward along the cortex from the potassium chloride chamber (Fig. 5Ai). However, a second SD (Fig. 5Aii) propagates over a slightly smaller area and mainly in an anterior direction. The rCBV response is shown in Fig. 5B. During the first SD, a transient rCBV increase can be seen as the bright area traveling forward along the cortex (Fig. 5Bi). This is immediately followed by a period of decreased rCBV apparent as the dark region covering much of the ipsilateral hemisphere. This hemispheric decreased rCBV persists up to the second SD episode (Fig. 5Bii) when another transient rCBV increase propagates down the cortex. After the second SD, the rCBV level again returns toward the decreased (i.e., hypoperfused) level, as can be seen the ROI plot in Fig. 5D.
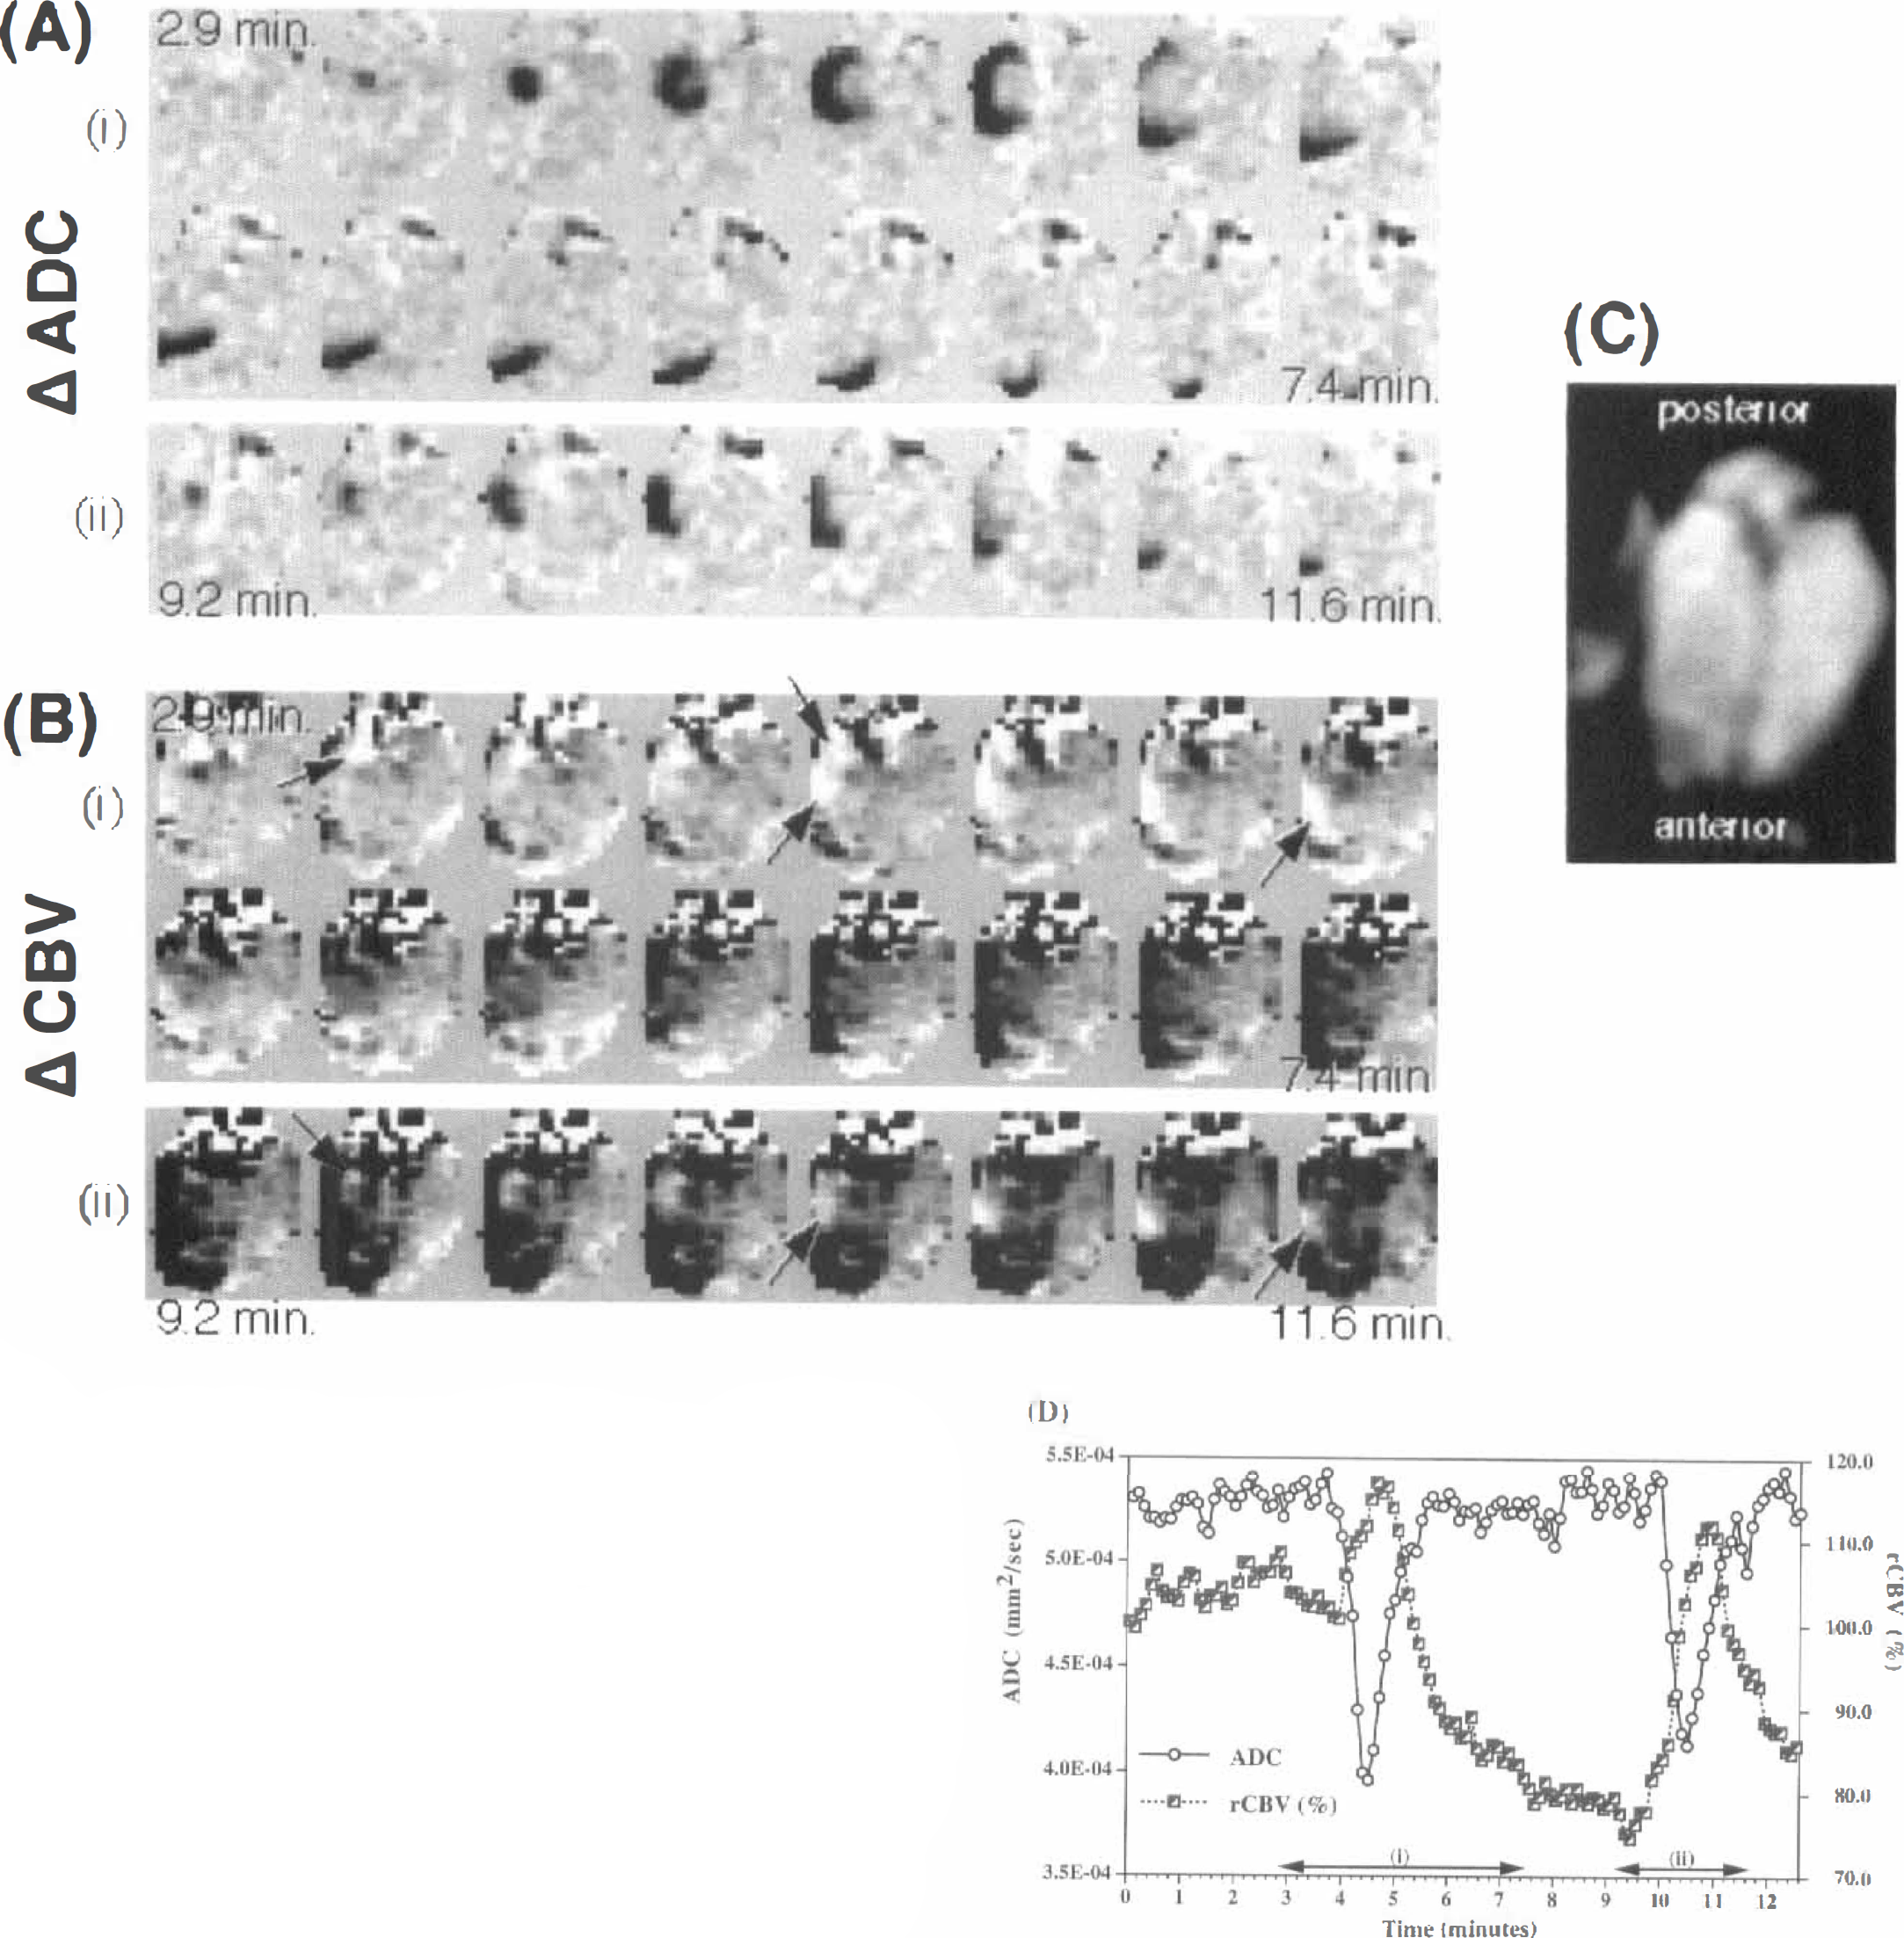
Serial ADC and rCBV data from an animal showing a prolonged post-SD hypoperfusion. Images were acquired in the axial plane using the surface coil: alternate images in the series are shown, 12 seconds between images. Time runs from top left to bottom right in each panel.
Fig. 6 shows plots of ADC and rCBV for SD episodes before and after acetazolamide injection. A large cortical ROI was measured in each hemisphere. Before acetazolamide injection, the ADC and rCBV transients previously described were observed only in the ipsilateral ROI (Fig. 6A). On injection of acetazolamide, rCBV immediately began to increase in both ROI (Fig. 4C and D), indicating global blood volume increase, which plateaus after about 4 minutes. Over the 3 animals, rCBV increased to 35 ± 7% above baseline on the ipsilateral hemisphere and 37 ± 12% above baseline on the contralateral side. The rate of increase was observed to be faster in the contralateral hemisphere. A SD initiated after acetazolamide injection caused a transient ADC decline (Fig. 6C), but the accompanying rCBV increase was not observed. Instead, there was a decrease in rCBV after the transient ADC in this example. This pattern was observed in two of three animals, whereas in the third animal a transient rCBV increase was seen superimposed on the slower global rCBV increase caused by the acetazolamide.
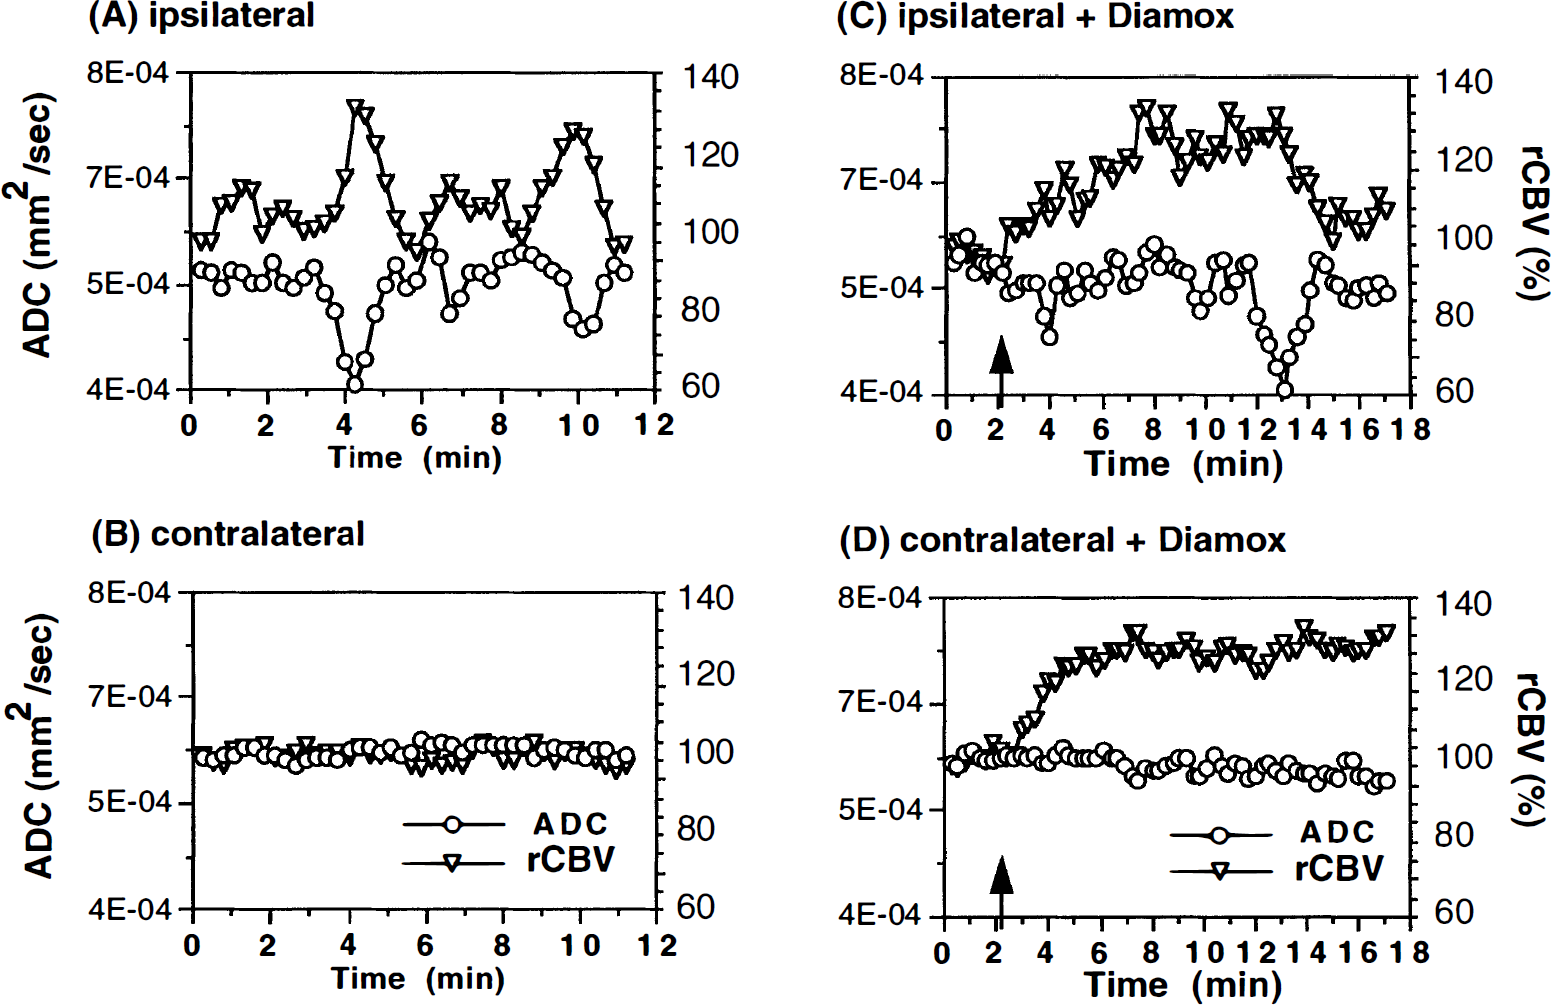
Plots of ADC and rCBV in ipsilateral and contralateral cortical ROI during KCl-induced SD before
Conclusions
This combination of high-speed diffusion and CBV-weighted MR imaging allows visualization(and quantification) of two relevant hemodynamic- and metabolic-related indices of brain function simultaneously, and as such represents a unique tool for studying dynamic cerebral events noninvasively.
The correlation between the DC potential recording and ADC measurements in corresponding cortical sites corroborates the notion that transient ADC decreases during SD reflect water shifts associated with cell depolarization.
Transient regional hyperperfusion follows ADC decreases with a temporal delay of about 16 seconds, thus supporting the observation of increased energy demand from repolarization.
The immediate post-SD hyperperfusion phase can be suppressed by acetazolamide-induced vasodilation, whereas the reactive and longer lasting hypoperfusion is not influenced.
DISCUSSION
Coincidence of transient apparent diffusion coefficient decrease and direct current potential shift
Diffusion-weighted imaging is highly sensitive to slowing water proton translations early in the ischemic episode (within minutes) (Moseley et al., 1990; Davis et al., 1994). In experimental cat and rat ischemia models, the MR imaging measured the ADC of brain water decreases by 30% to 60% (Moseley et al., 1990; van Bruggen et al., 1992). Recent findings suggest that the significant apparent diffusion slowing (ADC decreases) in stroke is predominantly the result of cellular swelling and reflects a shift of relatively faster translating extracellular water protons into a more hindered intracellular environment. It has been shown that when the Na+/K+ pump is disabled by intraparenchymal ouabain, the ADC decreases (Benveniste et al., 1992), supporting a link between altered ion homeostasis and alteration in ADC. Of interest is the relation between membrane polarization and diffusion as measured by the ADC. Failure of the transmembrane ion pumps and subsequent loss in cell membrane potential is immediately followed by a disruption of the ion homeostasis. The resulting ionic imbalance causes an osmotically driven flow of water into the cells, and it is thought that the subsequent cell swelling with restricted extracellular or intracellular diffusion and increased extracellular tortuosity reduces the ADC as detected by MR imaging. Similar mechanisms are suspected to be the basis of ADC decreases during SD (Latour et al., 1994); however, the experimental proof of the temporal coincidence of ADC decreases and membrane potential changes was still missing. Our experiments were therefore designed to allow for a close temporal correlation between ADC and DC potential measurements by the evaluation of cortical voxels that were located exactly beneath the epidural DC electrode site. This approach corroborated the view that ADC changes during SD mirror the cellular depolarization and repolarization and that ADC decreases are linked to the known temporary shrinkage of the extracellular space to about 50% during SD (Hansen and Olsen, 1980). In addition, this finding is in line with earlier studies in this laboratory of transient, propagating ADC decreases in the ischemic border zone that correspond to periinfarct depolarizations. The duration of the transient ADC decreases reflects the severity of the perfusion deficit in the penumbral tissue and indicates that the cellular repolarization, as represented by the ADC recovery, is a function of energy availability (Röther et al., 1996b).
Magnetic resonance imaging of cerebral blood volume changes
In principle, blood flow changes during SD are reflected by dynamic T2-weighted image intensity changes as a result of local changes in blood oxygenation(the BOLD effect). However, this is a small effect (Gardner-Medwin et al., 1994), which is even smaller when using spin-echo rather than gradient echo imaging. An alternative is the use of iron oxide-containing intravascular MR contrast agents. A variety of microparticulate iron oxide and other iron-containing agents have been developed that shorten MR relaxation times by 10% to 50% and remain in the blood pool for long periods (hours to days). After agent injection, changes in blood volume result in changes in local intravascular iron concentration, which changes the T2 and T2* relaxation rate. Recent theoretical and experimental work has shown that the dependence of MR relaxation rate, R2, on agent concentration and blood volume is approximately linear (Fisel et al., 1991; Weisskoff et al., 1994). Intravascular iron agents have found application in enhancement of the cerebral microvasculature (Hamberg et al., 1996). Because of the long washout time, blood concentration of the agent is essentially constant over the imaging period. Any change in blood volume, caused by some vascular perturbation, can easily be detected as a signal change in a T2- or T2*-weighted image. This approach has been used to detect blood volume changes in a variety of situations, including apnea (Berry et al., 1996) and stroke (Hamberg et al., 1996).
Hyperperfusion with repolarization after spreading depression
Previous studies of hemodynamic changes during SD were handicapped by the lack of a technique that allows for a “point-to-point” comparative measurement of electrical and hemodynamic parameters: vascular changes during SD were either examined by correlating dilated pial vessels to electrical signs of SD (Leão, 1944a), in different animal preparations (van Harreveld and Stamm, 1952), from neighboring DC and laser Doppler flowmetry probes (Piper et al., 1991; Kocher, 1990), or with other techniques that accomplish high spatial but insufficient temporal resolution for a close match of the hemodynamic coupling during SD (Csiba et al., 1985; Mies and Paschen, 1984; Lauritzen, 1984; Lauritzen, 1987). Our approach combines high-speed diffusion and CBV-weighted MR imaging, thus enabling the evaluation of simultaneously acquired hemodynamic and metabolic related indices of SD.
Transient regional hyperperfusion follows the ADC decrease with a temporal delay of about 16 seconds, which means that rCBV increases at the stage of cellular repolarization. Repolarization after SD is an energy-consuming process, and an increase in rCBV, as shown in our experiments, seems to be a logical consequence of elevated ATP requirements. This finding is in line with reports on increased CBF and oxygen consumption during SD as well as pial arteriolar dilatation occurring ≈ 1 minute after DC shifts (Mayevsky and Weiss, 1991; Busija and Meng, 1993).
Oligemia after the hyperemic phase was observed in only about 50% of the animals. Previous studies report the consistent detection of hypoperfusion, whereas the early hyperperfusion was inconsistent (Lauritzen, 1987). A possible explanation lies in the time between subsequent SD initiations (which was not held constant in these studies), since a rest period may be needed for the autoregulatory response to return to normal after each episode.
Variability in relative cerebral blood volume versus apparent diffusion coefficient time lag and activation area
The propagation of SD is supposed to occur as a result of increased K+ in the extracellular space produced as a result of cell depolarization, which in turn triggers the depolarization of neighboring cells. This self-perpetuating sequence of events spatially propagates the wave of depolarization until some barrier (e.g., end of the cortex) is encountered. The exact mechanism of the hemodynamic coupling during SD, however, is still a matter of discussion. There is general agreement on a hemodynamic uncoupling of CBF and SD, since the vasodilation occurs when the electrical signs of neuronal activity wane (Leão, 1944a). A potassium-mediated CBF/CBV increase during SD is unlikely, since it is known that the hemodynamic coupling after neuronal activation occurs within a couple of hundred milliseconds (Ngai et al., 1995). Nitric oxide, a potent vasodilator that couples CBF to neuronal activation (Dirnagl et al., 1993), has been discussed as a potential mediator of the CBF response during SD (Fabricius et al., 1995), but the findings are not consistent (Wolf et al., 1996; Zhang et al., 1994). Therefore, we suggest that the most likely explanation is a metabolically induced CBF increase. Several studies support this view, showing increased oxygen consumption (Mayevsky and Weiss, 1991) and decreased pH and glucose content (Csiba et al., 1985) in parallel with the CBF increase. Although this might explain the average time lag of the blood volume response behind the membrane depolarization phase of SD, it cannot easily explain the variability in this time lag or the detection of negative delays. A possible explanation for this might be to invoke a role for the underlying vascular and microvascular structure. If a significant proportion of the detected volume change arises from venules, draining blood from possibly more distant tissue regions, then the temporal profile of rCBV changes in a particular imaging pixel also may be dependent on flow or volume changes occurring in neighboring pixels. This would make the measured rCBV transients measured in each imaging pixel dependent on the pseudorandom spatial arrangement of the microvasculature in the vicinity, which may vary from pixel to pixel. In particular, a negative delay might arise from a region containing a vein draining blood from other volumes of tissue through which the SD wave has already passed, before the wave has reached the region containing the vein.
Effect of acetazolamide injection
Acetazolamide is a potent vasodilation agent that is used for testing vascular autoregulation response clinically. The fact that large rCBV increases were observed globally after acetazolamide injection, whereas no corresponding significant ADC changes were seen, is consistent with the idea that the measured rCBV value, derived from the postcontrast ΔR2 values, does represent blood volume change and that this parameter is independent of the diffusion coefficient. In addition, after acetazolamide injection and concomitant rCBV increase, no further rCBV transient increases are observed with SD (in two of three animals), whereas the ADC transients are detected as before. This supports the assumption that the ADC and rCBV values derived from the combined MR imaging acquisition protocol are indeed independent within the error limits of this study. Since the arteries and arterioles are maximally dilated by the acetazolamide, subsequent SD episodes cannot induce further rCBV increases, as observed in two of three cases. However, the decreased rCBV, post-SD hypoperfusion phase still is possible and may even be enhanced.
We have shown that MR imaging has the potential to monitor rapidly occurring changes in cell membrane polarization by means of the ADC parameter and that rCBV changes can be measured simultaneously using an intravascular MR contrast agent. The advantage of MR imaging is its ability to make measurements of these two quantities simultaneously, noninvasively, and over cross-sectional slices through the rat brain with good temporal resolution. These applied MR techniques are readily available for the application in humans and open a new field of noninvasive monitoring of physiologic processes.
Footnotes
Acknowledgements
The authors thank Dr. Helen D'Arceuil for critically reading the manuscript.