
Abstract
A method for dynamic, high-resolution cerebral blood flow (CBF) imaging is presented in this article. By illuminating the cortex with laser light and imaging the resulting speckle pattern, relative CBF images with tens of microns spatial and millisecond temporal resolution are obtained. The regional CBF changes measured with the speckle technique are validated through direct comparison with conventional laser-Doppler measurements. Using this method, dynamic images of the relative CBF changes during focal cerebral ischemia and cortical spreading depression were obtained along with electrophysiologic recordings. Upon middle cerebral artery (MCA) occlusion, the speckle technique yielded high-resolution images of the residual CBF gradient encompassing the ischemic core, penumbra, oligemic, and normally perfused tissues over a 6 × 4 mm cortical area. Successive speckle images demonstrated a further decrease in residual CBF indicating an expansion of the ischemic zone with finely delineated borders. Dynamic CBF images during cortical spreading depression revealed a 2 to 3 mm area of increased CBF (160% to 250%) that propagated with a velocity of 2 to 3 mm/min. This technique is easy to implement and can be used to monitor the spatial and temporal evolution of CBF changes with high resolution in studies of cerebral pathophysiology.
Keywords
Monitoring the spatio-temporal characteristics of cerebral blood flow (CBF) is crucial for studying the normal and pathophysiologic conditions of brain metabolism. Conventional methods such as laser-Doppler flowmetry provide information about CBF from a limited number of isolated points in the brain (approximately 1 mm3) (Dirnagl et al., 1989). Scanning laser-Doppler can be used to obtain spatially resolved relative CBF images by moving a beam across the field of interest (Lauritzen and Fabricius, 1995; Ances et al., 1999), but the temporal and spatial resolution of this technique is limited by the need to mechanically scan the probe or the beam. Although autoradiographic methods provide three-dimensional spatial information, they contain no information about the temporal evolution of CBF changes (Sakurada et al., 1978). Methods based on magnetic resonance imaging (Calamante et al., 1999) and positron emission tomography (Heiss et al., 1994) provide spatial maps of CBF but are limited in their temporal and spatial resolution. Therefore, a simple method that provides real-time spatially resolved CBF images would aid in experimental studies of functional cerebral activation and cerebral pathophysiology.
Laser speckle is a random interference pattern produced by the coherent addition of scattered laser light with slightly different path lengths. When an area illuminated by laser light is imaged onto a camera, a granular or speckle pattern is produced. If the scattering particles are in motion, a time-varying speckle pattern is generated at each pixel in the image. The temporal and spatial intensity variations of this pattern contain information about the motion of the scattering particles and quantitative flow information can be obtained by measuring either the temporal intensity fluctuations of the speckles, as in laser-Doppler flowmetry (Stern, 1975), or the spatial characteristics of the intensity fluctuations (Fercher and Briers, 1981). Using the latter approach, two-dimensional maps of CBF can be obtained with very high spatial and temporal resolution by imaging the speckle pattern onto a CCD camera and quantifying the spatial blurring of the speckle pattern that results from blood flow.
In areas of increased blood flow, the intensity fluctuations of the speckle pattern are more rapid, and when integrated over the CCD camera exposure time (typically 10 to 50 milliseconds), the speckle pattern becomes blurred in these areas. By acquiring an image of the speckle pattern and quantifying the blurring of the speckles in the image by measuring the spatial intensity variations in the speckle pattern, spatial maps of relative blood flow can be obtained (Briers and Webster, 1996). The speckle technique has been used to image blood flow in the retina (Yaoeda et al., 2000) and skin (Ruth, 1994). In this article, the speckle imaging method is applied to CBF imaging during pathophysiologic events such as focal ischemia and cortical spreading depression (CSD). The authors conclude that speckle imaging can be used for accurate, high-resolution imaging of CBF, is very simple to implement, and requires only a standard CCD camera and laser.
MATERIALS AND METHODS
Animal preparation
Male Wistar rats (n = 36) weighing 250 to 310 g, obtained from Charles River Breeders, were used for the experiments. All experimental procedures were conducted according to protocols approved by Animal Care Committee. Rats were anesthetized with urethane (1.2 g/kg, intraperitoneally) and maintained unresponsive to tail pinch by supplements of one fifth of the initial dose. Body temperature was kept constant at 36.9°C ± 0.1°C with a homeothermic blanket (Harvard Apparatus, Holliston, MA, U.S.A.) during experiments. The left femoral artery was cannulated for continuous blood pressure monitoring and to obtain arterial pH. PaCO2, and PaO2 samples. In experiments designed to increase the CBF during the hypercarbia, femoral vein was also cannulated and animals were paralyzed with pancronium. Animals were ventilated and breathed room air supplemented with oxygen. For each cycle from normocarbia to hypercarbia and back, blood gases were sampled at the baseline state and at the hypercarbic plateau approximately 15 minutes after the addition of 5% CO2 to the room air. Laser-Doppler flowmetry (Perimed, PF2B, Stockholm, Sweden) was used to determine regional CBF changes in the cortex for validation of the speckle instrument. The laser-Doppler probe was positioned directly on the dura away from the pial vessels and within the field of view of the CCD camera. Data were stored on a computer and analyzed using MacLab data acquisition and analysis system (AD Instruments, Mountain View, CA, U.S.A.). In all animals, the physiologic parameters were kept within normal ranges throughout the experiments.
Surgical procedure
The distal occlusion of the right middle cerebral artery (MCA) was performed as described previously (Bolay and Dalkara, 1998). Briefly after a midline incision, the right common carotid artery was loosely tied by a 0-0 silk suture. Each rat then was placed in a stereotaxic frame and a craniotomy was made over the right sensorimotor cortex (1 to 6 mm lateral and 1 to 7 mm posterior to the bregma). For MCA occlusion, temporalis muscle was incised and retracted to expose the squamous bone and a craniotomy was made at the juncture of zygoma and squamous bones. The dura overlying the MCA was opened with a fine curved needle to allow clipping. After occluding the common carotid artery by snare ligature, a metal clip was placed across the MCA just above the inferior cortical vein. For spreading depression experiments, a small burr hole opened posterior to the sensorimotor craniotomy (8 mm posterior and 7 mm lateral to the bregma) and the dura was opened by a fine curved needle to apply KCl.
Electrophysiologic recordings
Single-barreled glass microelectrodes (tip resistance 1 to 2 MΩ) were filled with 150 mmol/L NaCl, connected to Ag/AgCl wire and inserted 900 μm deep into the parietal cortex for recording of electrocorticogram and the cortical steady potential (DC) (Axoprobe-1A; Axon Instruments, CA, U.S.A.). An Ag/AgCl reference electrode was placed subcutaneously in the neck. Cortical spreading depression was elicited by topical application of 1 mol/L KCl on the cortex, and the cortical surface was washed with saline between each application. Cortical potentials were continuously recorded using MacLab data acquisition and analysis system (AD Instruments).
Speckle imaging instrument
The instrument developed for the laser speckle measurements is illustrated in Fig. 1. A diode laser (Sharp LTO25MD; λ = 780 nm, 30 mW; Thorlabs, Newton, NJ, U.S.A.) beam was coupled into a 600-μm diameter silica optical fiber (Thorlabs FT600-EMT) and a collimating lens (f = 8 mm, C240-TM; Thorlabs) was connected to the distal end of the fiber. The lens and fiber were positioned approximately 10 cm above the area of interest and the lens was adjusted to provide even illumination of an 8-mm diameter area on the surface of the exposed cortex. The coherence length of the laser was approximately 1 cm. The illuminated area was imaged onto a CCD camera (Cohu 4910; Scion, San Diego, CA, U.S.A.) with 640 × 480 pixels yielding an image of a 2 to 7 mm in area, depending on the magnification. Images were acquired through a framegrabber (LG-3; Scion, Frederick, MD, U.S.A.) and conversion of the raw speckle images to blood flow maps was controlled by custom written software that computed the speckle contrast and correlation time values at each pixel using Eqs. 1 and 3 (see below).
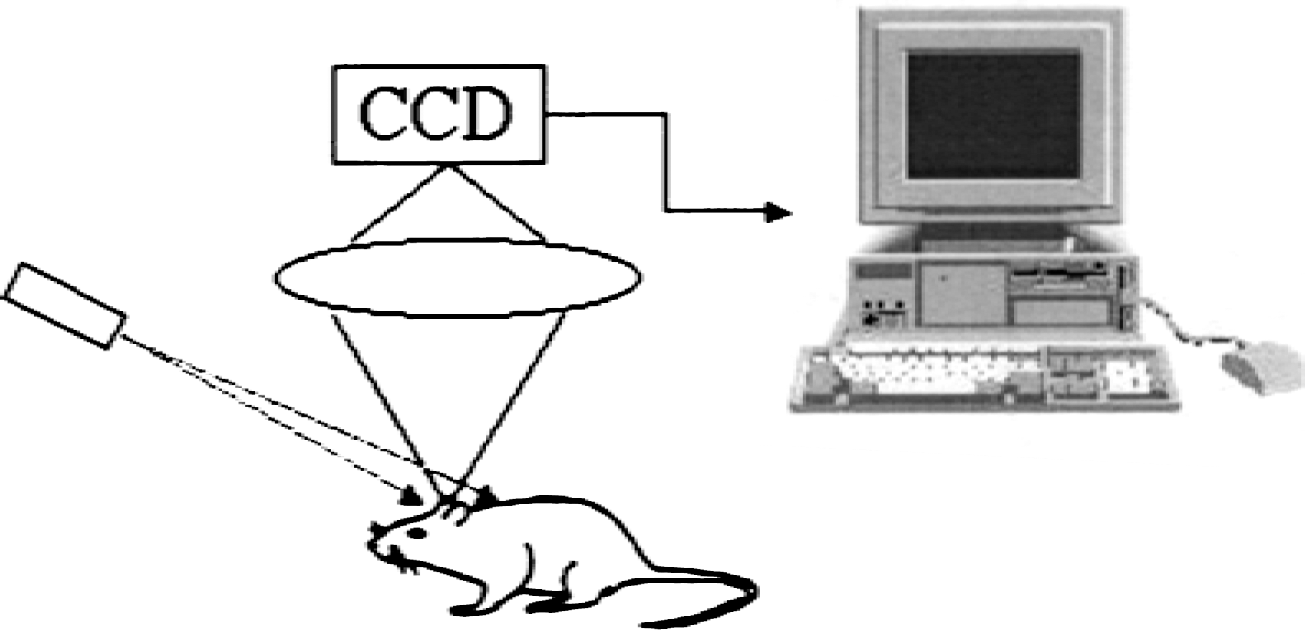
Schematic illustration of setup for speckle imaging of cerebral blood flow (CBF). A laser diode (λ = 780 nm, 10 mW) beam is expanded to illuminate a 6 × 6 mm area of cortex, which is imaged onto the CCD camera. The computer acquires raw speckle images and computes relative CBF maps.
Speckle image analysis
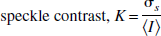
To quantify the blurring of the speckles, the local speckle contrast, defined as the ratio of the standard deviation to the mean intensity in a small region of the image, is computed (Briers and Webster, 1996),
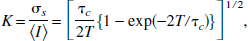
The size of the region over which the speckle contrast is computed must be large enough to contain a sufficient number of pixels to ensure accurate determination of σs and <I>, yet not so large that significant spatial resolution is lost. In practice, a 5 × 5 or 7 × 7 region of pixels is used. The speckle contrast has values between 0 and 1. A speckle contrast of 1 indicates that there is no blurring of the speckle pattern and, therefore, no motion, whereas a speckle contrast of 0 means that the scatterers are moving fast enough to average out all of the speckles. The speckle contrast is a function of the exposure time, T, of the camera and is related to the autocovariance of the intensity fluctuations in a single speckle, Ct(τ), by (Goodman, 1965)
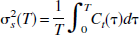
The autocovariance is defined as
where T is the exposure time of the CCD. As in laser-Doppler measurements, it is theoretically possible to relate the correlation times, τc, to the absolute velocities of the red blood cells, but it is difficult to do in practice because the number of moving particles that the light interacts with and their orientations are unknown (Bonner and Nossal, 1981). However, relative spatial and temporal measures of velocity can be easily obtained from the ratios of the correlation times.
Speckle image acquisition
The CCD camera was positioned such that the laser-Doppler probe was within the field of view of the CCD camera so that blood flow measurements of the same area of cortex could be compared. Laser-Doppler readings were compared with speckle images under conditions of increased (hypercarbia or spreading depression) and decreased (ischemia) CBF in separate animals for validation. To avoid crosstalk between the two laser measurements, speckle imaging and laser Doppler readings were obtained sequentially. Because the laser-Doppler device measures the blood flow changes in a small region, whereas the speckle imaging provides a two-dimensional blood flow map, only the values in the area of the cortex probed by the laser-Doppler device were considered in the speckle measurements, which was assumed to be 1 mm2. The speckle contrast, defined by Eq. 1, was computed using 5 × 5 areas of pixels and the correlation time, τc, was computed using Eq. 3. To ensure proper sampling of the speckle pattern, the size of a single speckle should be approximately equal to the size of a single pixel in the image, which is equal to the width of the diffraction-limited spot size and is given by 2.44λf/#, where λ is the wavelength and f/# is the f number of the system. In the authors' instrument, the pixel size is 10 μm, and with a magnification of unity the required f/# is approximately 6 at a wavelength of 780 nm. The velocity (in arbitrary units) was computed from the inverse of the correlation time (u ∝ 1/τc), and the relative CBF was computed by taking the ratio of the correlation time image at any time point and a baseline image. The exposure time, T, for each image was 15 milliseconds, and typically a sequence of 5 to 10 images was acquired at 30 Hz (150 to 300 milliseconds total acquisition time), and the computed blood flow maps for the images were averaged to improve statistics. The intrinsic noise level in the CCD was found to be less than 1% of typical signal levels and therefore was not subtracted from the images.
RESULTS
Examples of raw speckle images and the corresponding speckle contrast images computed with Eq. 1 directly from the raw images are illustrated in Fig. 2 under conditions of normal (top row) and elevated (bottom row) cortical blood flow. Speckles are clearly visible in the raw image and some blurring of the speckles can be seen upon close inspection, corresponding to areas of increased flow. These areas are clearly evident in the speckle contrast images in which low speckle contrast values (dark areas) indicate increased flow such as pial vessels and the microvascular bed. Speckle contrast images also illustrate a wide variation in CBF within the area of cortex imaged. Comparison of the speckle contrast images under normal and increased blood flow reveals that the speckle contrast values are lower (darker areas) across the entire cortical region under increased blood flow. Although slight differences in the speckle visibility can be seen in the raw images, the speckle contrast images reveal significant differences.
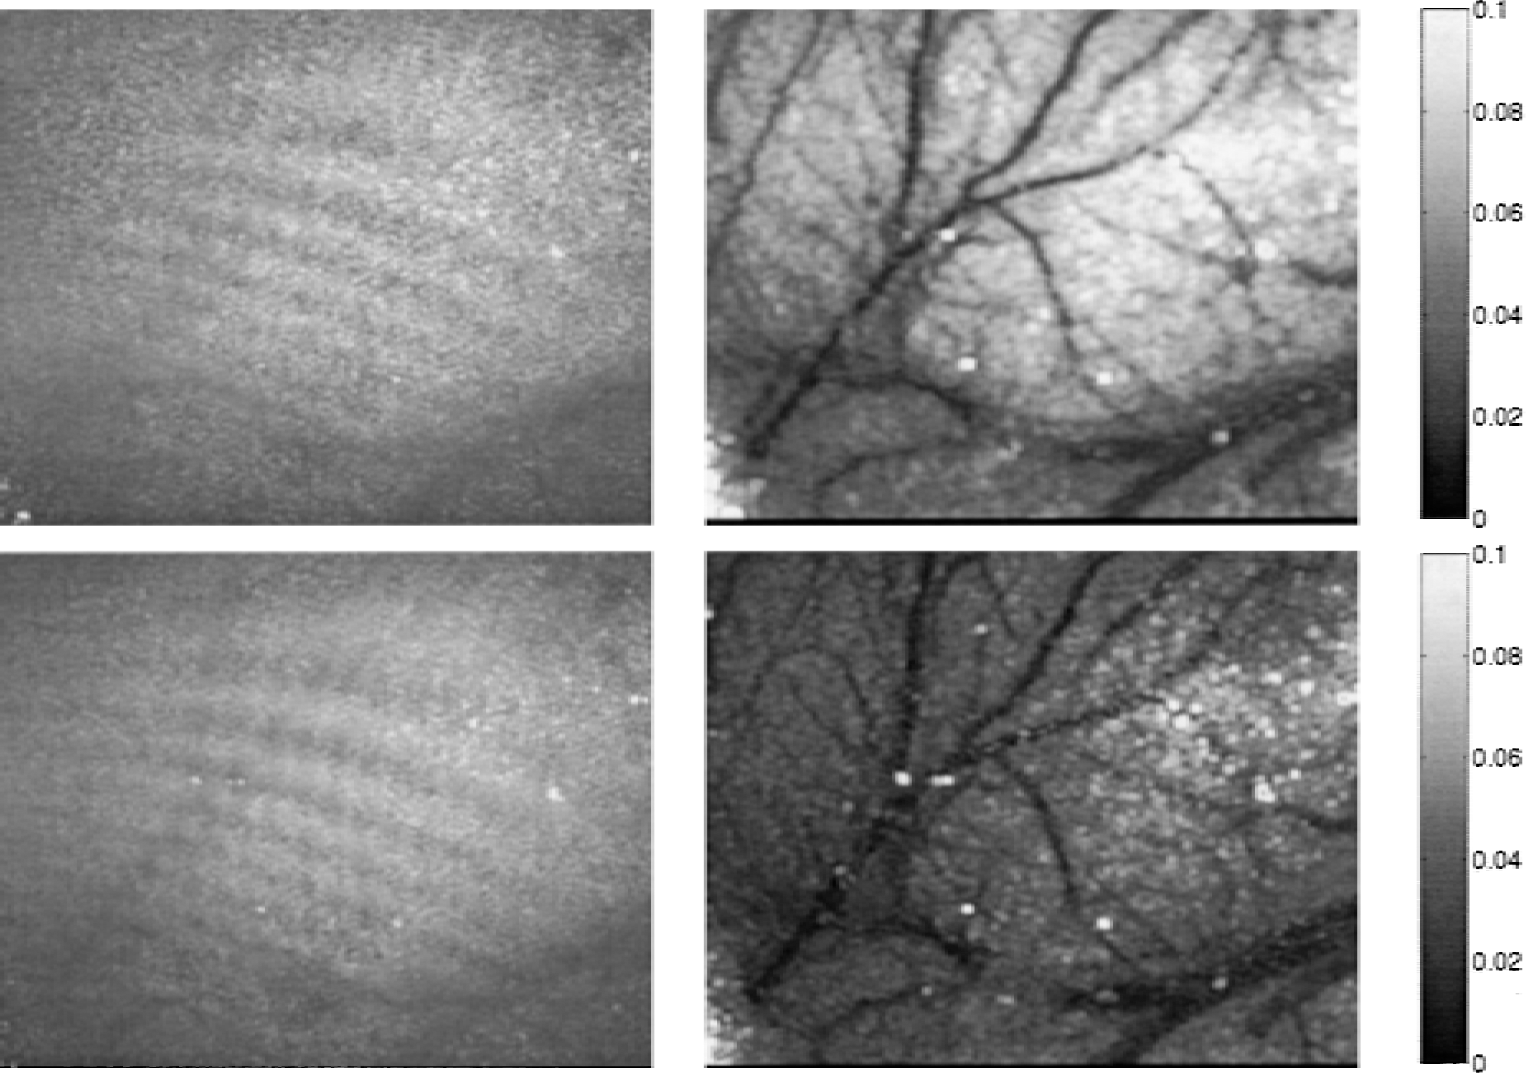
Raw speckle images (left column) and the corresponding speckle contrast images (right column) computed directly from the raw speckle images using Eq. 1 with 5 × 5 areas of pixels. The top row shows typical images under normal blood flow and the bottom row corresponds to increased blood flow conditions. Low speckle contrast values (dark areas in right column) correspond to increased speckle blurring of the raw speckle images (left column) indicating increased blood flow. Darker areas in the speckle contrast in bottom right image indicate increased cerebral blood flow in the microvasculature compared with normal conditions (top right). Each image shows a 5 × 4 mm area of cortical surface.
Relative CBF maps were obtained by comparing the speckle contrast images acquired at different time points (Eq. 3). Regional cerebral blood flow (rCBF) changes measured by speckle imaging were compared with the value obtained by laser-Doppler flowmetry within the region of the laser-Doppler probe and the results are plotted in Fig. 3 under conditions of increased (hypercarbia or spreading depression) and decreased (ischemia) rCBF in separate animals. Relative CBF measurements obtained by each method showed high correlation (R2 = 0.98) over a wide range of relative CBF values (0% to 250% of baseline, Fig. 3). The symbols in Fig. 3 represent measurements from different animals and the solid line is a least-squares fit to the data.
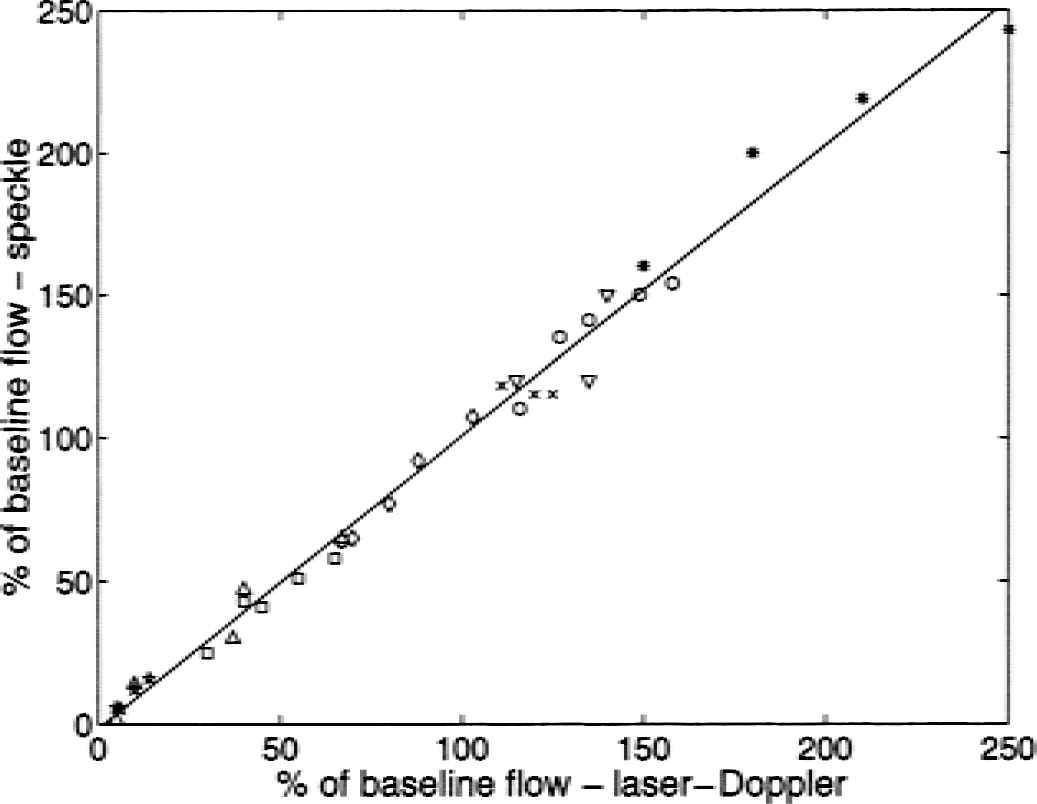
Regional CBF changes (percentage of baseline) obtained with speckle imaging adjacent to the laser-Doppler probe show high correlation (R2 = 0.98) with laser-Doppler measurements of the same area under conditions of increased and decreased rCBF in separate animals. Symbols represent different animals and the solid line is a least squares fit.
The speckle technique was applied to different cerebral pathophysiologic events, such as CSD and focal cerebral ischemia, to image the increased or decreased CBF values (Figs. 4 and 5, respectively). Speckle images of CBF changes accompanying CSD are acquired at 5-second intervals (data shown at 10-second intervals in Fig. 4) after KCl application, and the image before CSD elicitation was used as a baseline. After CSD elicitation, the relative CBF began to rise in the area closest to the location of the KCl (upper left portion of the image, Fig. 4) and propagated across the field imaged. Comparison of the DC potential and the rCBF changes in the area surrounding the electrode showed that the CBF increase reached its maximum value after the return of the DC potential to baseline value (Graph, Fig. 4). The spatial extent of the blood flow increase was found to vary between 2 and 3 mm with finely delineated borders and the magnitude of the increase, (measured with laser-Doppler and speckle imaging in parallel experiments), ranged between 160% and 250% of baseline (n = 8). A decrease in CBF (60% to 80% of baseline) was observed after the initial increase in CBF (data not shown). Based on the images, the CBF increase was found to propagate across the cortex with a velocity of 2.5 mm/min (Fig. 4). The velocity of hyperemia associated with spreading depression ranged between 2 and 4 mm/min in all applications (n = 8).
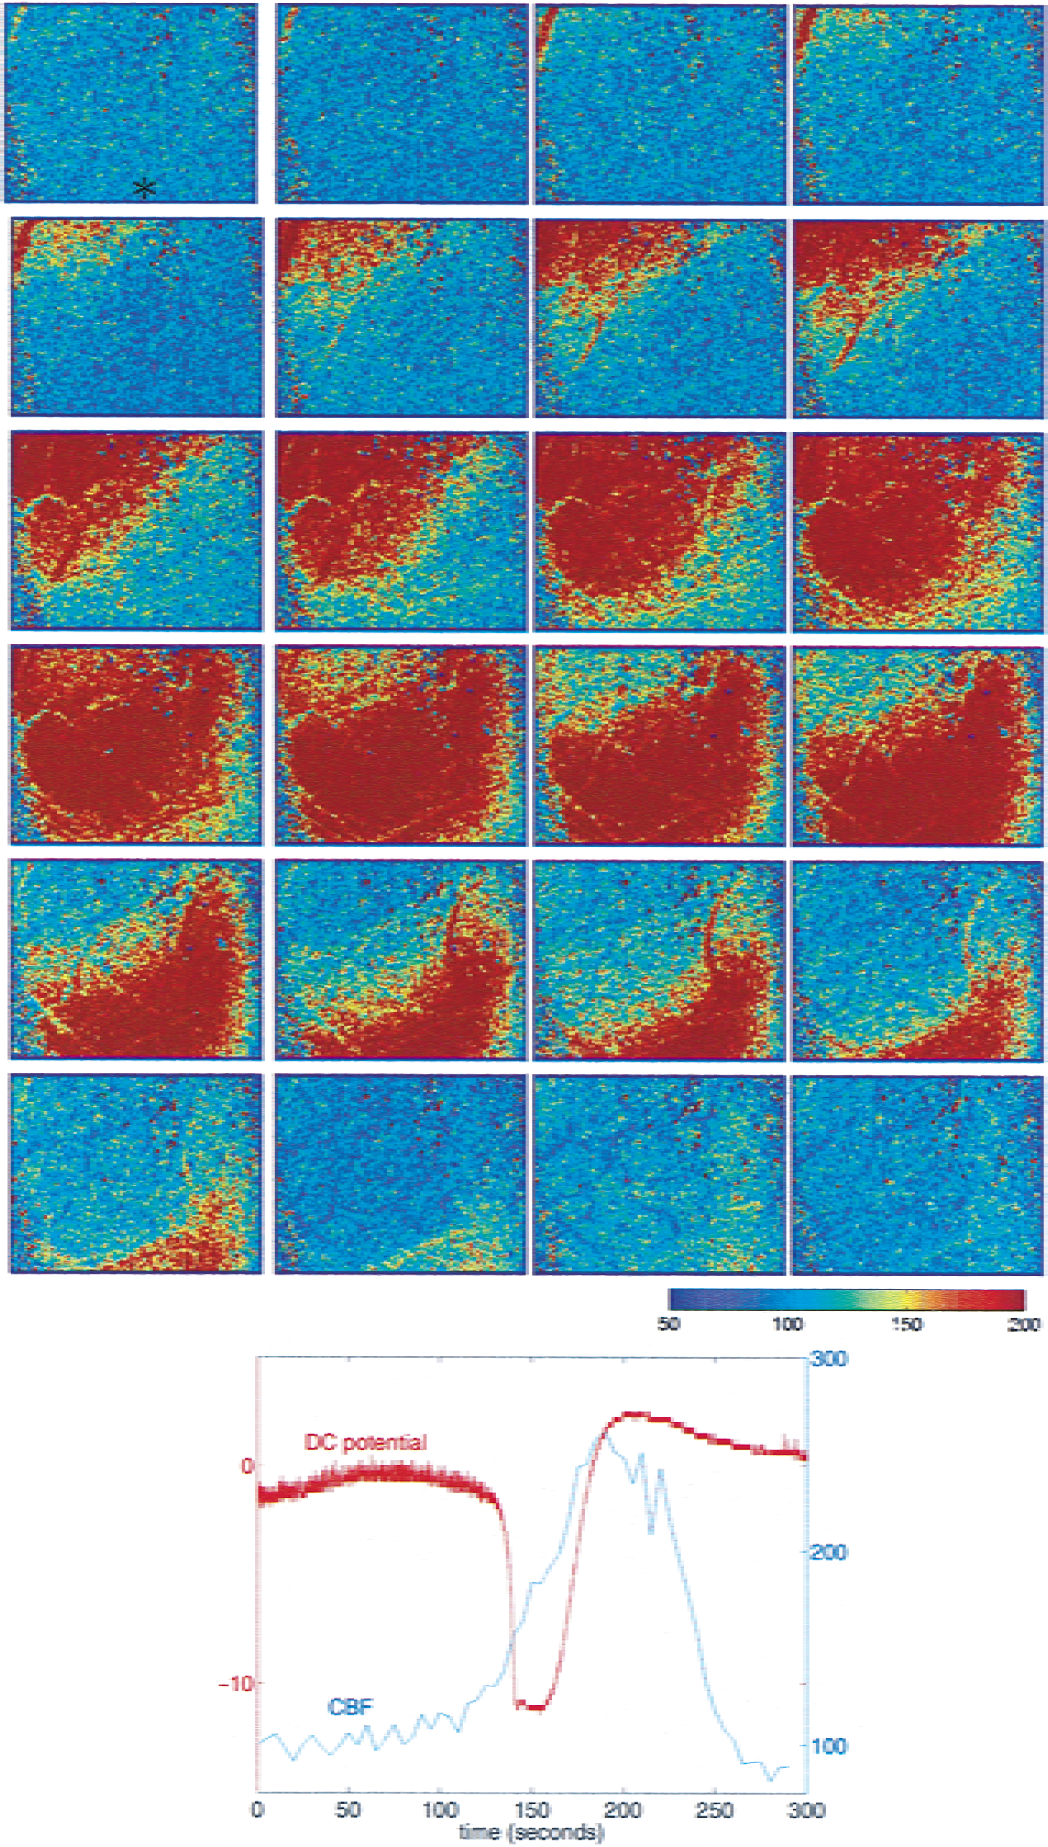
Spatio-temporal evolution of blood flow changes in the cerebral cortex (6 × 4mm) in response to cortical spreading depression (CSD) measured by speckle imaging. Images are shown at 10-second intervals after KCl application (in a second craniotomy located outside the upper left corner of the image). Approximately 60 seconds after CSD induction, the relative cerebral blood flow (CBF) begins to rise in the area closest to the KCl application. A 2 to 3 mm area of increased CBF propagates across the cortex with a velocity of 2.5 mm/min. Graph shows the DC potential change and the regional CBF changes measured by speckle imaging in the vicinity of the recording microelectrode (position indicated by an asterisk in first image) during CSD.
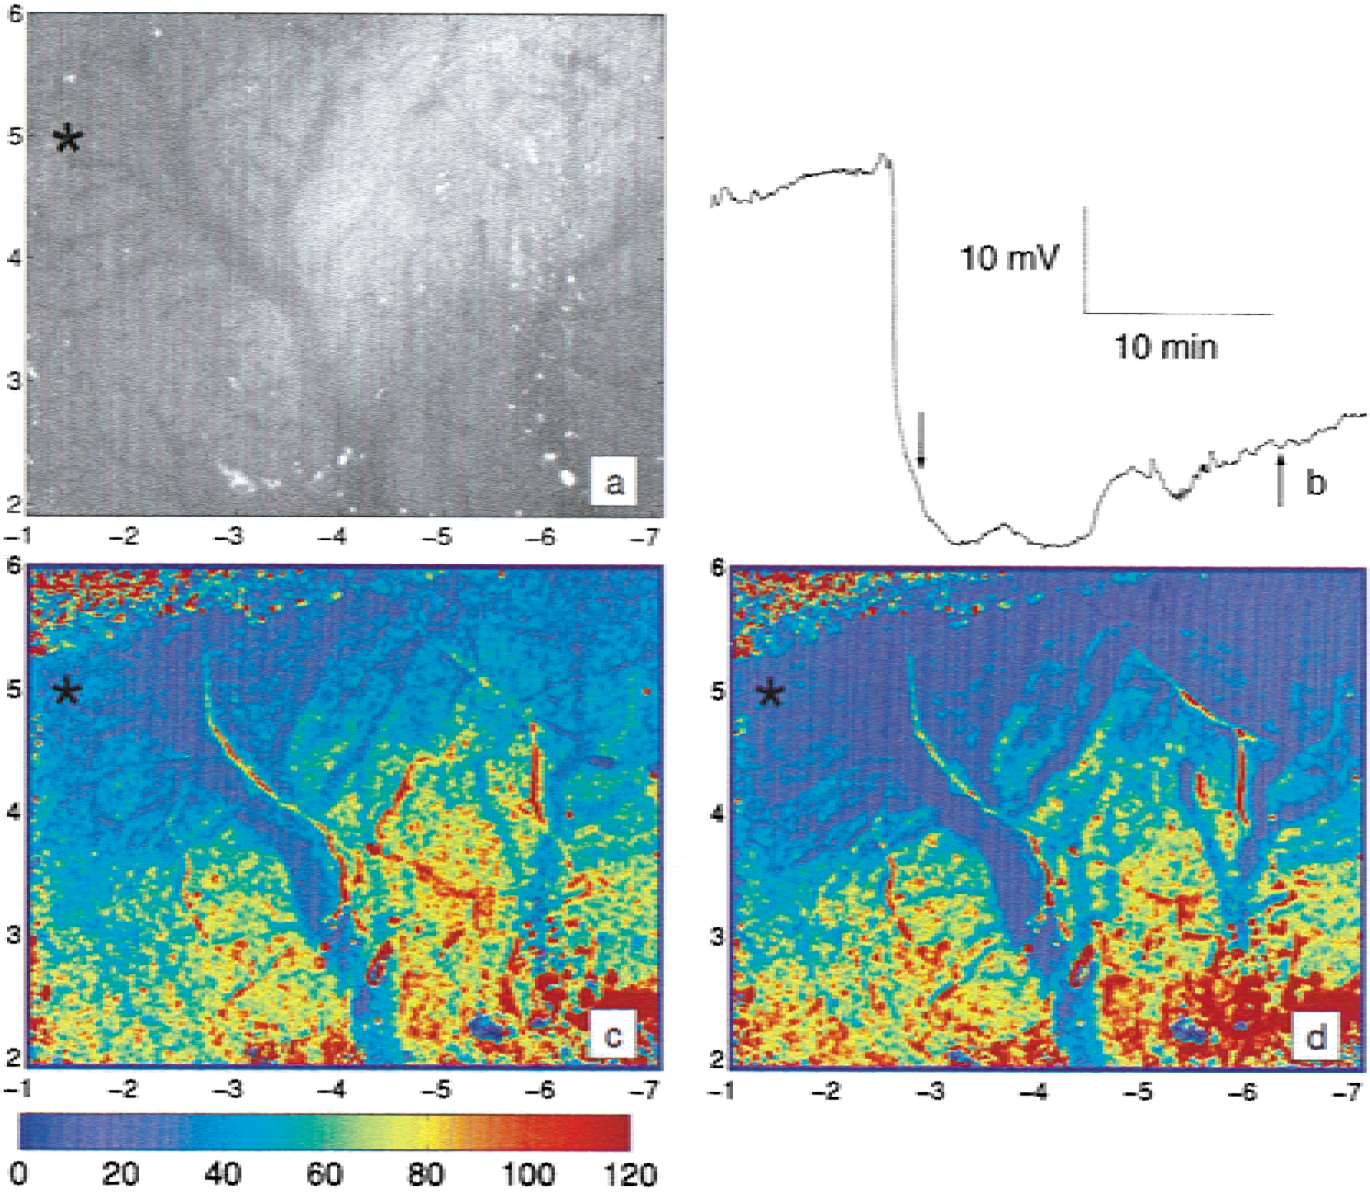
Speckle imaging of cerebral blood flow (CBF) changes after focal cerebral ischemia.
The speckle technique also permitted imaging of the spatial and temporal extent of CBF decreases in focal ischemia as illustrated in Fig. 5, which shows the relative CBF changes at two time points after MCA occlusion. Speckle images of relative CBF in the 6 × 4 mm cortical area revealed finely delineated gradient of residual CBF ranging from less than 10% of preischemic values in the ischemic core up to normal values in the anterior cerebral artery territory (Fig. 5B and 5C). Successive speckle images demonstrated the expansion of ischemic zone and further decrease in the residual CBF with time as well as CBF increase in the surrounding normally perfused area, possibly indicating compensation by collateral blood flow (Fig. 5C). Suppression of electrocorticogram and anoxic depolarization were also consistent with residual CBF values less than 20% imaged by speckle technique within the area of recording microelectrode (Astrup et al., 1981; Heiss and Rosner, 1983; Hossmann, 1994).
DISCUSSION
Speckle imaging: practical considerations
The speckle imaging method presented in the current article provides an attractive alternative to other methods because of its ability to accurately image the cortical blood flow response over an area ranging from a few millimeters to a centimeter over time scales of milliseconds to hours. Through comparison of single speckle images, each of which is obtained in 10 to 30 milliseconds, dynamic two-dimensional maps of relative CBF changes associated with cerebral pathophysiologic events were obtained. The method uses an analysis of the spatial intensity fluctuations of the speckle pattern produced with laser illumination (Fig. 2) to quantify the level of speckle blurring and therefore, blood flow. The underlying physics of the speckle technique is identical to that of laser-Doppler flowmetry, although the measurement differs (Briers, 1996). The speckle contrast is a measure of the intensity fluctuations rather than the average intensity, as illustrated in Fig. 2, where the speckle contrast in unaffected by the existence of some interference fringes in the raw image. Therefore, the speckle contrast is unaffected by small changes in the average optical properties, such as absorption because of changes in hemoglobin, that result in variations in the average intensity. Instead, the speckle contrast is sensitive to speckle fluctuations arising from scattering from moving particles. The authors found that the magnitude of the speckle intensity fluctuations between pixels is as much as 40%, depending on the exposure time and blood flow level, which is significantly greater than the average intensity changes encountered in intrinsic optical imaging. Because the speckle intensity fluctuations are so large, incoherent illumination (nonlaser sources) is almost always used in intrinsic optical imaging studies.
Typically, the spatial resolution of a speckle image is approximately 10 to 25 μm, depending on the numerical aperture of the imaging system, and the field of view of the image can vary between 1 and 20 mm. Notably, the speckle technique does not provide any depth specificity. The wavelength of the laser light, the tissue optical properties, and the source-detector geometry determine the penetration depth of the light. Monte Carlo simulations of laser-Doppler flowmetry revealed that the penetration depth is between 500 μm and 1 mm (Jakobsson and Nilsson, 1993) and the authors' simulations indicate that the penetration depth of the speckle images is comparable to that of laser-Doppler flowmetry (data not shown). Although the illumination geometry of speckle imaging is different than that of laser-Doppler flowmetry, the penetration depth of the detected light is similar in both cases. Whereas each pixel does detect a small amount of light that entered the tissue at a point laterally displaced from the pixel location and therefore has probed deeper into the tissue, the majority (>95%) of the detected light at each pixel in the speckle images enters the tissue at a point colocalized with the pixel. Under these conditions, the illumination and detection geometry of the speckle imaging is similar to laser-Doppler flowmetry in which the source and detection fibers are separated by only a few hundred microns; therefore, the penetration depths (500 μm to 1 mm) are comparable.
The temporal resolution of the technique is defined by the exposure time of the CCD camera, which is typically 10 to 50 milliseconds. Averaging successive frames to improve the signal-to-noise ratio will reduce the temporal resolution slightly. The authors found that the image-to-image variation in the computed correlation time images is 5% to 30%, and averaging of 10 to 30 frames (approximately 1 second of data) reduces the uncertainty to less than 5%. Use of a camera with a higher dynamic range would allow more accurate determination of the speckle contrast and therefore, improve the signal-to-noise ratio eliminating the need for frame averaging. Therefore, application of the speckle imaging technique provides high resolution maps of the spatial and temporal evolution of cerebral blood flow changes.
Application to cerebral blood flow imaging: cortical spreading depression and ischemic penumbra
Because cerebral blood flow is tightly coupled to the underlying neuronal response, it is crucial to monitor the spatial and temporal extent of CBF changes in studies of functional activation (Malonek et al., 1997) and pathophysiologic conditions accompanied by uncoupling, such as focal cerebral ischemia (Astrup et al., 1981; Hossmann, 1994) and CSD (Leao, 1944; Lauritzen, 1987).
Cortical spreading depression represents a stereotypical response of the cerebral cortex, characterized by slowly spreading (2 to 5 mm/min) depolarization of both neurons and astrocytes leading to marked changes in extracellular ion concentration that is accompanied by an increase in blood flow during the normalization of these ionic changes. Cortical spreading depressions are thought to play an important role in the pathophysiology of various neuronal disorders such as migraine (Lauritzen, 1985), head trauma, and focal cerebral ischemia (Witte et al., 2000; Back et al., 1996; Mies et al., 1993). Speckle images of the CBF dynamics during cortical spreading depression show a relatively homogeneous 2 to 3 mm propagating area of increased cerebral blood flow. One of the advantages of this technique over other methods, such as laser-Doppler imaging (Lauritzen and Fabricius, 1995), is that it provides sufficient spatial resolution to differentiate the contributions of the microvasculature and pial vessels.
As seen in Fig. 5, speckle imaging provides a powerful new technique for monitoring CBF changes during the course of focal cerebral ischemia. The evolution of the ischemic penumbra into infarction is of particular interest and is highly dependent on the dynamic changes in residual CBF (Heiss, 1992; Hossmann, 1994; Witte, 2000). To understand the mechanisms involved in this process and to develop better treatment strategies, monitoring residual CBF with high resolution within an area encompassing the ischemic core, ischemic penumbra, oligemic, and normal tissue is essential. Speckle imaging (Fig. 5) demonstrates the residual CBF gradient from ischemic core to normal tissue accurately (compatible with laser-Doppler imaging (Fig. 2) and electrophysiologic recordings (Fig. 5)). Although magnetic resonance (Quast et al., 1993; Heiss, 2000), positron emission tomography (Frykholm et al., 2000), and autoradiographic (Ginsberg et al., 1999) studies have imaged the ischemic penumbra, the images in Fig. 5 suggest that the speckle technique is capable of producing high-resolution spatio-temporal in vivo maps showing the evolution of CBF changes and expansion of ischemic zone during focal ischemia within individual animal.
In addition to the applications presented in the current article, dynamic speckle imaging of CBF can be combined with conventional intrinsic optical signal and fluorescence imaging to provide images of hemodynamic (CBF, oxy-, and deoxy-hemoglobin) and metabolic (NADH) response to functional activation. Numerous groups are already using intrinsic optical recordings of brain activity to image changes in oxy- and deoxy-hemoglobin (Grinvald et al., 1986; Masino et al., 1993). Using the method presented in the current article, blood flow images can also be obtained using the existing intrinsic optical imaging systems simply by adding a laser to coherently illuminate the tissue and analyzing the speckle pattern.
Conclusions
Laser speckle imaging provides high resolution images of the spatio-temporal dynamics of CBF. The technique is easy to implement and requires only standard hardware components. The speckle method allows the spatial and temporal characteristics of the CBF response to be imaged in studies of functional activation, cerebral pathophysiology, and therapeutic effects of drugs. In the future, this technique could be used for intraoperative monitoring of the spatial characteristics of CBF.