
Abstract
Rapid sampling microdialysis (rsMD) directed towards the cerebral cortex has allowed identification of a combined time-series signature for glucose and lactate that characterizes peri-infarct depolarization in experimental focal ischaemia, but no comparable data exist for ‘classical’ cortical spreading depression (CSD) associated with hyperaemia in the normally perfused brain. Here, we examined the rsMD responses of dialysate glucose and lactate to five hyperaemic spreading depressions induced with intracortical microinjections, typically of 1 mol/L KCl, in open-skull preparations in five cats under chloralose anaesthesia. Depolarization was verified with microelectrodes, and laser speckle flowmetry was used to examine propagation of the events and perfusion responses near the MD probe. Ten minutes after depolarization, dialysate glucose fell and lactate rose by 28% and 58% respectively. There was no recovery of dialysate glucose 30 mins after depolarization. Mean baseline indicative cerebral blood flow was 25.5 ± 4.1 mL/100 g/min and mean maximum hyperaemic increase was by 29.6 ± 6 mL/100 g/min; hyperaemia remained present 30 mins after CSD. As CSD events are repetitive, frequent, and often clustered temporally in human acute brain injury, these results indicate a high risk of depletion of extracellular glucose in association with depolarization events of a pattern previously thought to be largely benign.
Keywords
Introduction
It has become clear that depolarization events occur spontaneously and propagate in the injured human cerebral cortex. They have been detected as a component of the pathophysiology in victims of traumatic brain injury (Strong et al 2002) and of aneurysmal subarachnoid haemorrhage with delayed ischaemic stroke after aneurysmal subar-achnoid haemorrhage (Dreier et al 2006), and in patients with malignant hemisphere stroke (Dohmen et al 2008). Clinical monitoring of electrocorticography (ECoG) over extended periods with appropriate frequency filtering in these patients has indicated that it is possible to categorize the periods of ECoG suppression associated with depolarization events as of either short (< 10 mins) or long duration (Fabricius et al 2006), and that the events are often repetitive, occurring in (temporal) clusters (Dreier et al 2006). This dual classification of depolarization events has had a counterpart in a very large body of experimental work.
Leão first described cortical spreading depression (CSD) as a spreading wave of ECoG amplitude suppression (Leao, 1944b) closely accompanied by hyperaemia (Leao, 1944a). Leao also showed a change in cortical direct current (DC) potential, evidence of depolarization (Leao, 1947), now known to represent a mass neuronal and astrocytic depolarization.
In animal experiments CSD does not usually occur spontaneously. In most studies CSD events have therefore been induced experimentally, and the report that there is no resulting neuronal loss (Nedergaard and Hansen, 1988) has been widely accepted and cited. Cortical spreading depression has been suggested (Lauritzen, 1994), and substantially verified (Hadjikhani et al 2001) as the basis of migraine with aura.
In contrast, peri-infarct depolarizations (PIDs) occur spontaneously in experimental focal cerebral ischaemia (Hossmann, 1996). Repeated PIDs have been shown in experiments not simply to mark the expansion of an area of damage (Mies et al 1993), but to promote it (Busch et al 1996; Dijkhuizen et al 1999). Under pathologic conditions, spreading depolarizations can be associated with inverse coupling between cortical depolarization and regional cerebral blood flow, resulting in spreading microvascular spasm, spreading ischaemia and cortical necrosis (Dreier et al 2000). Inverse coupling was also recently shown for PIDs following experimental middle cerebral artery occlusion using laser speckle imaging in both the rodent (Shin et al 2006) and gyrencephalic (Strong et al 2007) brains, and may contribute to the pathogenicity of PIDs.
Here, we use the term ‘spreading depolarization’ as a general, nonspecific term, ‘CSD’ to denote a spreading depolarization associated with a substantial primary hyperaemic response in the cerebral microcirculation, and ‘PID’ to denote a spontaneous depolarization event spreading in the penumbra in experimental focal cerebral ischaemia or associated with prolonged ECoG amplitude suppression in the injured human brain.
Following a spreading depolarization event there is increased glucose utilization, which has been observed in both CSD (Shinohara et al 1979) and PID (Nedergaard and Astrup, 1986). In the case of PID, any associated reduction in perfusion must necessarily compromise glucose availability. Thus local perfusion may be insufficient to replenish the glucose and glycogen pools before a subsequent event.
Microdialysis measurements indicate the extra-cellular availability of a neurochemical to both the dialysis probe and to the local cells (Parkin et al 2003). To compare with the currently available experimental rapid sampling data on cortical micro-dialysate glucose and lactate transients associated with PIDs (Hopwood et al 2005), there is little data of similar time resolution for CSD. Using funnel freezing, Mies and Paschen showed a reduction in brain glucose, still present when sampling ceased 160 secs after induction of CSD, and despite hyperaemia (Mies and Paschen, 1984). Work with glucose oxidase electrodes recorded a biphasic extracellular glucose transient (decrease then overshoot) that returned to baseline within some 7 mins (Silver and Erecinska, 1994). Specifically, we wanted (1) to identify a glucose and lactate signature characteristic of hyperaemic CSD in the gyrencephalic brain that might be applied in the interpretation of clinical rapid-sampling microdialysis data and (2) to determine the duration of any changes in tissue glucose. If a sustained decrease were to be shown, this would suggest that not only PID, but also recurrent CSD, even if accompanied by hyperaemia, might pose a threat to tissue viability in patients with brain injury, and, perhaps less clearly, in those with migraine. The issue has become especially relevant to management of patients with acute brain injury (known often to experience repeated depolarization events) because of the widespread adoption in intensive care units of tight glycaemic control, in which plasma glucose is deliberately reduced with insulin to the range 4 to 6.5 mmol/L (72 to 117 mg%; Van den Berghe et al 2001).
Here, we used rapid sampling microdialysis in five nonrecovery experiments in cats to examine the concentrations and time courses of cortical glucose and lactate that characterize experimentally induced CSD. Occurrence of CSD was verified from the typical transient negativity in DC potential, and laser speckle imaging was used to confirm hyperaemia. We found for single CSD events that despite sustained hyperaemia there was an equally sustained depletion of brain glucose.
Materials and methods
Surgical Procedure
This study was approved by the local Animal Care Committee and Regierungspräsident of Köln and is in compliance with the German Laws for Animal Protection.
General anaesthesia was induced with ketamine hydrochloride (25 mg/kg, i.m.) in five adult female cats in the weight range 2.6 to 5.0 kg. The left femoral vein and artery were cannulated to administer drugs and to measure arterial pressure and arterial blood gases. The animals were tracheotomized and immobilized with pancuronium bromide (0.2 mg/kg, i.v.). Artificial ventilation was started and anaesthesia was changed to halothane (0.6% to 1.2%) in a 70% nitrous oxide/30% oxygen gas mixture. Ringer's solution containing gallamine triethiodide (5 mg/kg/h) was infused intravenously (3 mL/h) for immobilization throughout the experiment. Artificial ventilation was controlled, keeping arterial pressure and blood gases within normal physiologic range. Core body temperature was maintained at 37°C using a heating blanket feedback servocontrolled by a rectal temperature probe.
For an experimental ischaemia protocol that followed the present one, the right middle cerebral artery was exposed transorbitally in all experiments. A device for remote occlusion was implanted at the proximal portion of the middle cerebral artery between the right optic nerve and the middle cerebral artery bifurcation. The scalp and calvarium were removed and the dura was opened over the right cerebral hemisphere so as to expose the majority of the ectosylvian, together with the suprasylvian and marginal gyri. After completion of the surgical preparation, a bolus of α-chloralose (60 mg/kg/15 min, i.v.) was administrated, halothane was switched off, and artificial ventilation was maintained with 70% nitrous oxide/30% oxygen, and pCO2 at 29 to 31 mmHg. Continuous α-chloralose infusion (5 mg/kg/h) was started after the bolus administration.
Direct Current (and K+) Microelectrodes
Twin-barrel K+ selective microelectrodes were used: in these particular studies, intracortical DC potential was recorded from the reference barrel, referenced in turn against a sintered silver/silver chloride electrode in the cervical subcutaneous tissues. They were prepared and tested as described previously from double-barrelled theta-glass capillaries (Fa. H. Kugelstatter, Garching, Germany; Dreier et al 2002). Up to three electrodes were inserted into the suprasylvian and marginal gyri, with one located within 1 mm of the microdialysis probe. Observation of a typical transient DC negativity was used as a criterion of CSD occurrence. The K+ data generated were used in an unrelated, technical evaluation study conducted in each experiment after completion of this protocol.
Rapid Sampling Microdialysis
A microdialysis probe with 2 mm membrane (MAB 6.14.2, Microbiotech, SE) was inserted into the suprasylvian gyrus. It was perfused with filtered artificial CSF (containing: NaCl 146mmol/L, KCl 2.7 mmol/L, MgCl2 1.0 mmol/L, CaCl2 1.2 mmol/L) at 1 μL/min. a continuous dialysate stream was delivered via a short low-volume tube (dead volume 2 μL) into the online analyser, which was based on novel micro reactors for glucose and lactate. This gave peaks for glucose and lactate every minute. Details of the system are given elsewhere (Jones et al 2002). Following very careful probe placement rapid sampling microdialysis (rsMD) was used to monitor microdialysis glucose and lactate levels in real time. The 1-min sampling intervals allowed us to monitor the establishment of stable baseline values. Typically this took 10 mins, however in line with standard microdialysis practice we allowed at least 1 h to allow resealing of the blood brain barrier before starting CSD inductions. In addition, we used speckle imaging before and after probe placement to ensure that any disturbances to basal flow values had stabilized.
Laser Speckle Imaging
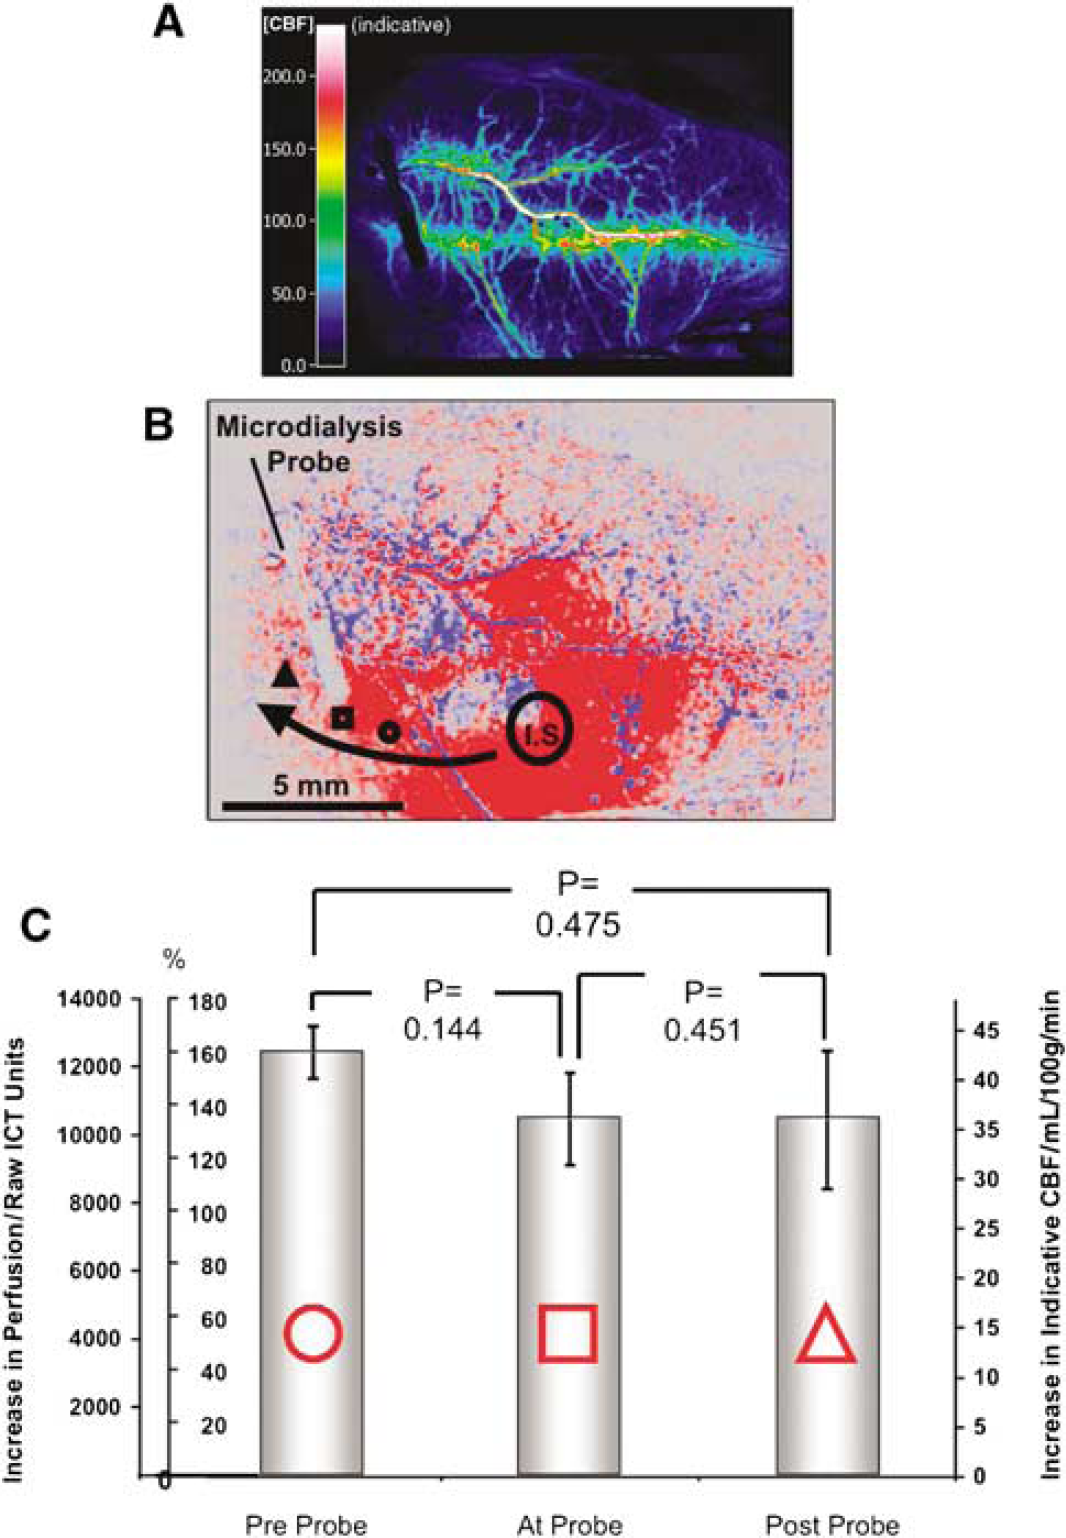
The laser speckle imaging method was implemented in this experimental system precisely as described recently (Strong et al 2007; reproduced in part with permission). As laser speckle contrast is inversely proportional to perfusion, inversion of the speckle contrast image provides an image of inverse correlation time (ICT); we have shown that this grey level is a linear function of perfusion as measured by a classical dye elution method, at least between ischaemic and normal levels of perfusion (Strong et al 2006). Image magnification was calibrated with a 5 mm target placed in the image field. To examine changes in perfusion in association with propagating CSD events, or the effects of KCl microinjection, appropriately located small (typically 0.25 to 0.4 mm2) regions of interest were drawn, and ICT time series data extracted from series of images. Average image sampling interval was 11 secs. To provide an approximation to absolute perfusion levels, we derived an indicative value of perfusion, expressed in absolute units from the equation: CBF (mL/100 g/min) = (ICT—650)/273. Thus here we report perfusion values primarily in raw values of ICT, and also in units of mL/100 g/min. A typical baseline perfusion image is illustrated in Figure 1 (upper panel).
(
Induction of Cortical Spreading Depression
KCl (1 mol/L; 2 μL) was injected by micropipette into the cortex of the suprasylvian or marginal gyrus to induce spreading depression.
Criteria for Inclusion of an Event in the Analysis
The criteria for including individual events were as follows:
A hyperaemia in response to the injection propagating at a rate appropriate for CSD (2 to 5 mm/min). The rate was measured by comparison of nearest time point of first onset of hyperaemia in two regions of interest of known spatial separation in the speckle images. Transient DC negativity in the range 10 to 30 mV. Basal glucose levels of 200 to 500 μmol/L, lactate of 25 to 100 μmol/L.
Experiments that did not fulfil the base line criteria were excluded. Cortical spreading depressions that did not fulfil at least criterion (a) or (b) were excluded.
Statistics
All calculated values are displayed as the mean ± s.e.m. To test the significance of changes in glucose and lactate after each CSD, the area over/under baseline of glucose or lactate was integrated arithmetically over 30 mins, and averaged for each of the five experiments. The five resulting values for either metabolite were tested for significance against a (net) value of zero change using a one-group Student's t-test.
Results
Basal microdialysate levels of glucose and lactate were 222.8 ± 57.4 μmol/L (n = 5) and 49 ± 6.8 μmol/L (n = 5), respectively. In the absence of stimulation these levels remained stable.
CSD was initiated by K+ microinjection. In a recording area 4.4 to 5.9 mm away from the injection site, this gave a hyperaemic wave propagating at 3.9 ± 0.3 mm/min and, with corresponding delay after injection, a DC shift of 10 to 24 mV. Figure 2 shows the metabolic responses to a single induced CSD in terms of raw dialysate glucose and lactate, time aligned with the perfusion response to the CSD represented by the cerebral blood flow (CBF) transient.
The CBF response was measured as ICT (perfusion units) and expressed also as indicative CBF (mL/100g/min). In this example, CBF increased by approximately 60 mL/100g/min. It can be seen that the metabolic signature of the spreading depression is a fall in glucose of around 50 μmol/L and rise in lactate of around 30 μmol/L.
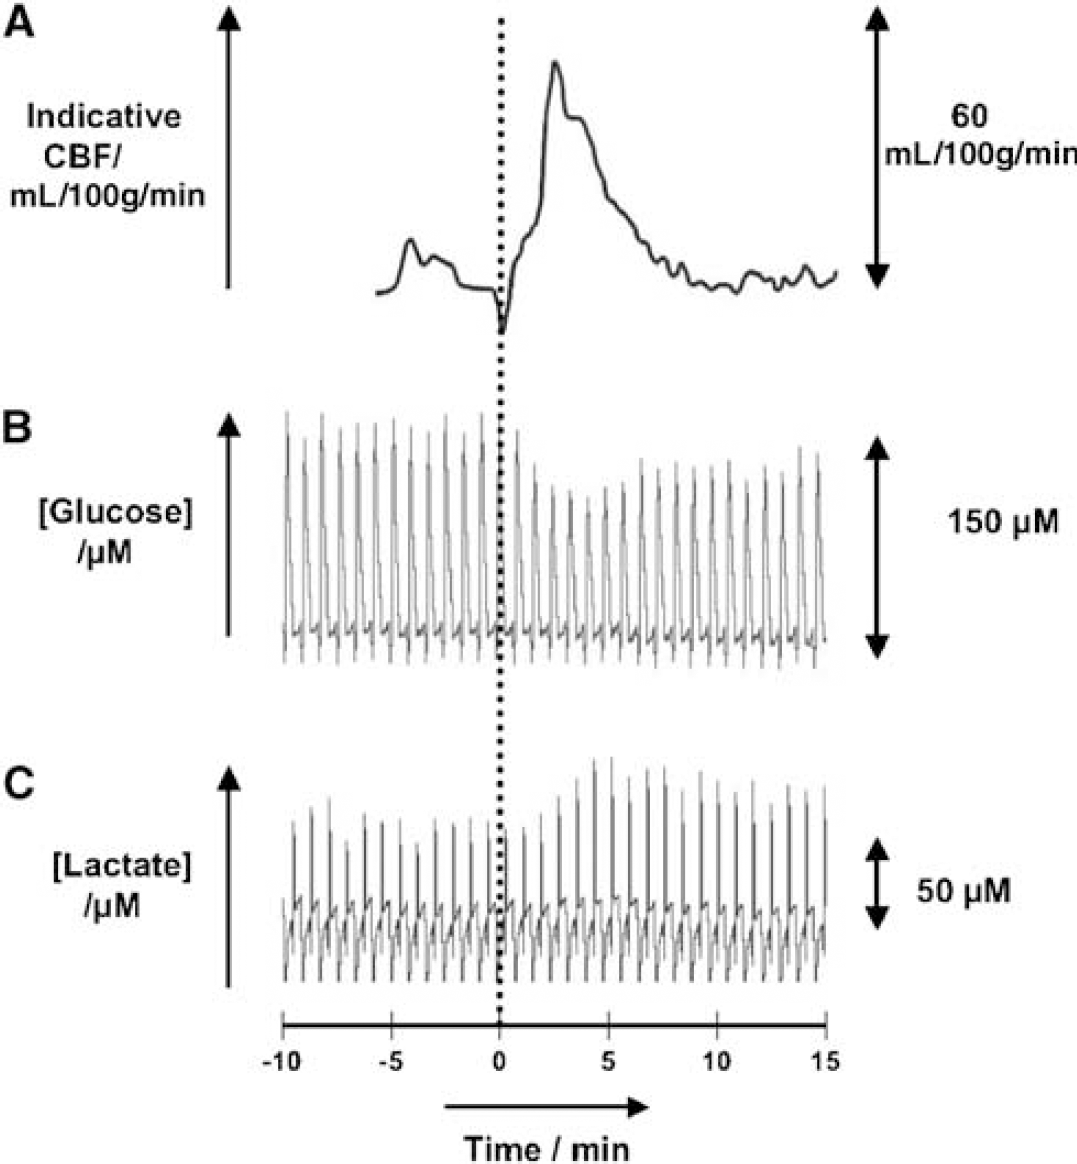
Multimodal signals for a single CSD: three time aligned raw traces characterizing a single CSD. From top: (
A transient fall in glucose and a rise in lactate occurred in all cases of CSD whose propagation was seen from imaging to involve the dialysis probe (Figure 3). The glucose and lactate levels in general did not return to baseline within the 30 mins time period, thus the initial transient changes are prolonged. Indeed for the glucose fall, no trace showed significant recovery within the observation period. This is illustrated in Figure 4, where the responses are averaged over consecutive 5-min periods immediately following the CSD. It is seen that the maximum amplitude of the transient is reached after 10 mins with a change compared with pre-CSD levels of −62.9 ±10.3 μmol/L (n = 5) for glucose, and + 28.4 ± 4.2 μmol/L (n = 5) for lactate, respectively, representing a 28% depression of glucose and a 58% lactate augmentation. There was no significant recovery of dialysate glucose within the 30-min observation period.
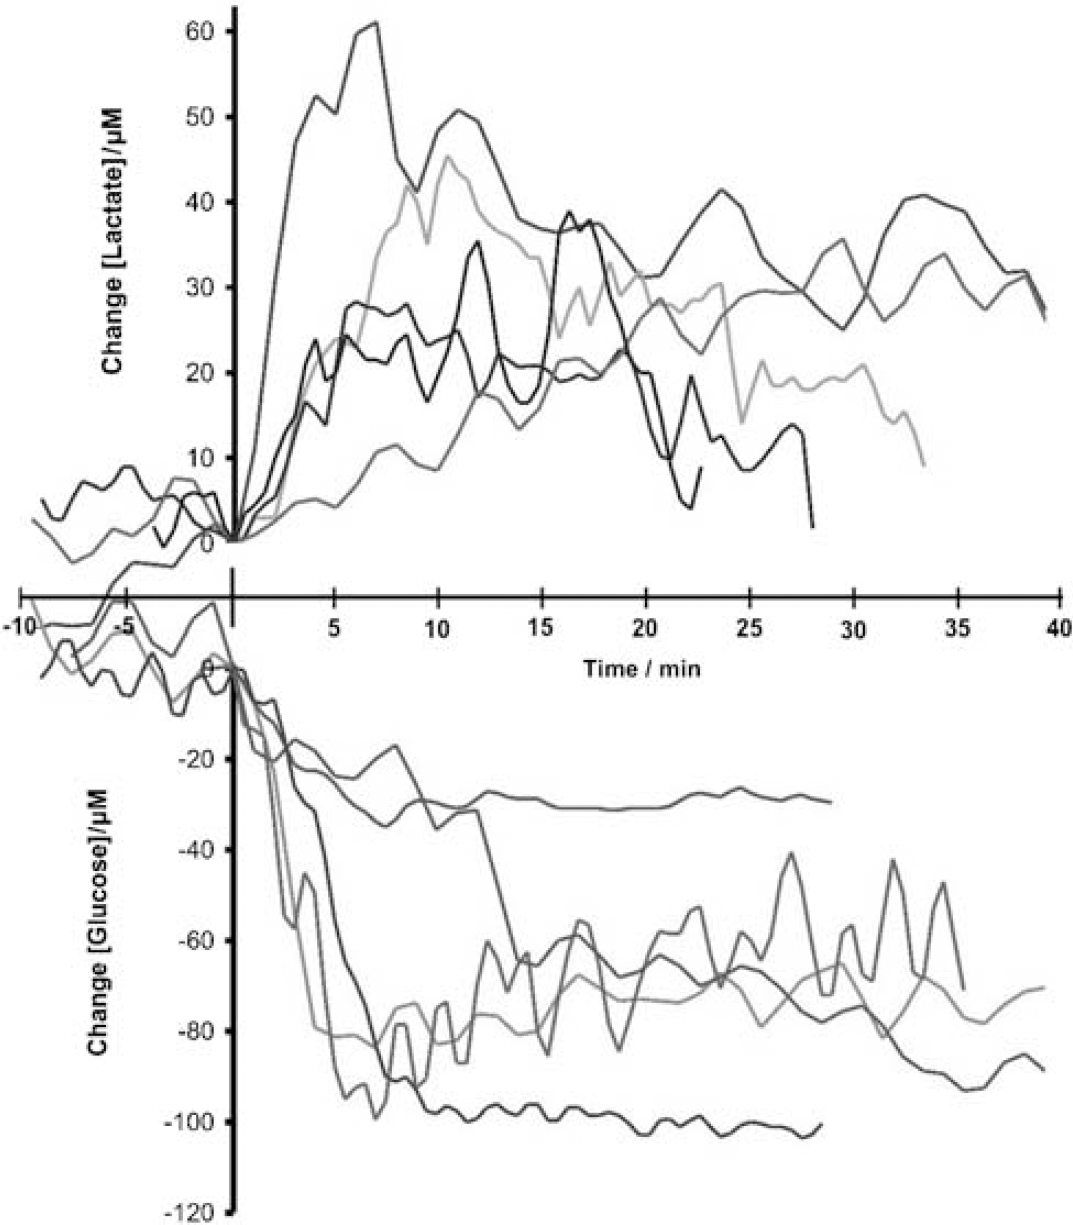
Composite figure of glucose and lactate responses to CSD (n = 5). The values are displayed as a difference in concentration from baseline. Time alignment is by CSD arrival at the probe, defined by perfusion responses. Baseline concentration is defined as the value just before CSD reaches the probe. Raw values were filtered with a 3-point moving average filter. (Colour version available as Supplementary Material).
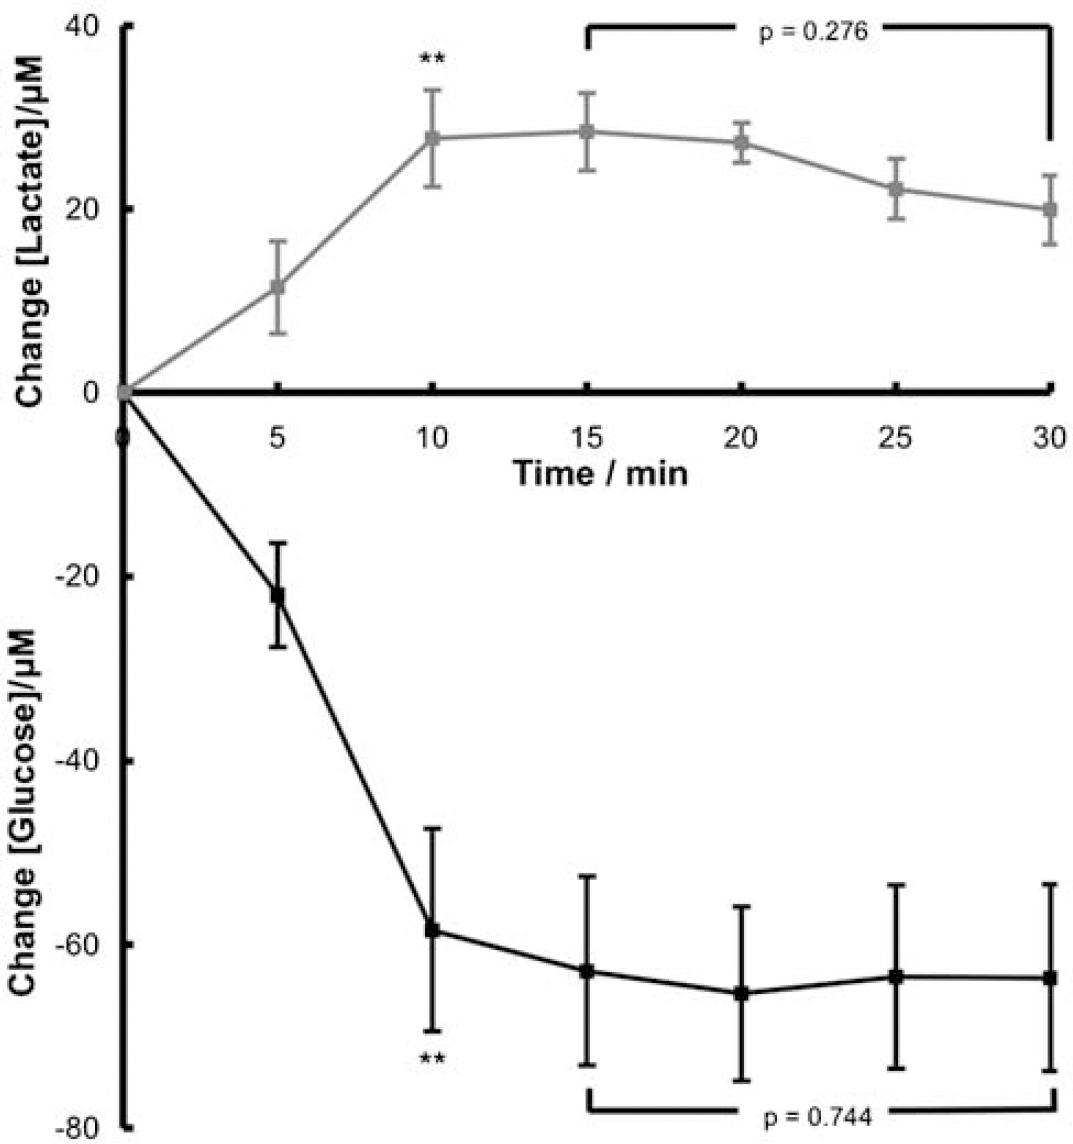
Average changes in glucose and lactate levels over 30 mins following a CSD. Values are an average of all responses in 5-min bins up to 30mins after a CSD (n = 5) displayed as a difference from baseline. Asterisks indicate statistical significance compared with pre-CSD values, (** for glucose (P = 0.0061, n = 5) and lactate (P = 0.0063, n = 5)). The square bracket indicates a paired Student's t-test comparison between the 15 mins value and the 30-min value.
The CBF responses to the CSD show reproducibility (individual data not shown) in that there is a transient increase within 5 mins: hyperaemia is still present after 30 mins. Again, averaging the values over 5 mins periods illustrates this finding (Figure 5). The maximum CBF level increase is reached within 5 mins at 29.6 ± 6 mL/100g/min (n = 5). The mean recovery time course recorded, if assumed to be linear, would suggest recovery to baseline at 92.2 mins.
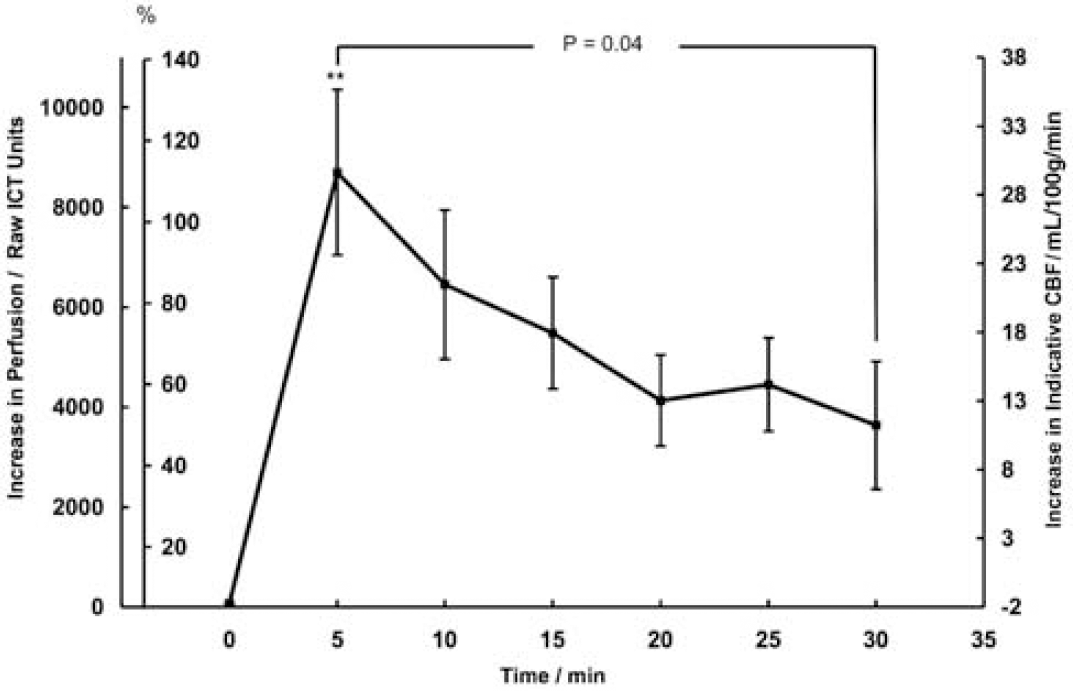
Duration of increase in perfusion/indicative CBF over 30 mins following a CSD. Values are an average of all responses in 5 mins bins up to 30 mins after a CSD (n = 5) displayed as a difference from baseline. The increase in perfusion above pre-CSD baseline is displayed in raw ICT units and percent increase in perfusion on the left-hand axes, and as the increase in indicative CBF on the right-hand axis. Error bars are standard errors of the mean. Overall, the hyperaemia was significant (Figure 6). After 30 mins, the residual hyperaemia was not significant (P =0.095), but was significant at 25 mins (P = 0.014) (to test additional, earlier time points was not statistically valid). Thus post-CSD hyperaemia remained significant for 25 mins after CSD, whereas dialysate glucose remained low over 30 mins.
A comparison of the transient changes in glucose, lactate, and indicative blood flow was made by integrating the area under curves for the individual traces for the 30 mins after the arrival of the CSD (Figure 6). This confirms a highly significant reduction in glucose as well as increases in lactate and perfusion. Plasma glucose was monitored throughout the experiments. Plasma glucose was 11.43 ± 2.00 mmol/L (mean ± s.e.m.) before first cortical K+ injection, and fell to 9.91 ± 1.42 mmol/L (87%) 27 mins (mean: range 21 to 59) after this KCl injection; it is therefore unlikely that any fall in plasma glucose contributed to progressive falls in brain tissue glucose that were observed.
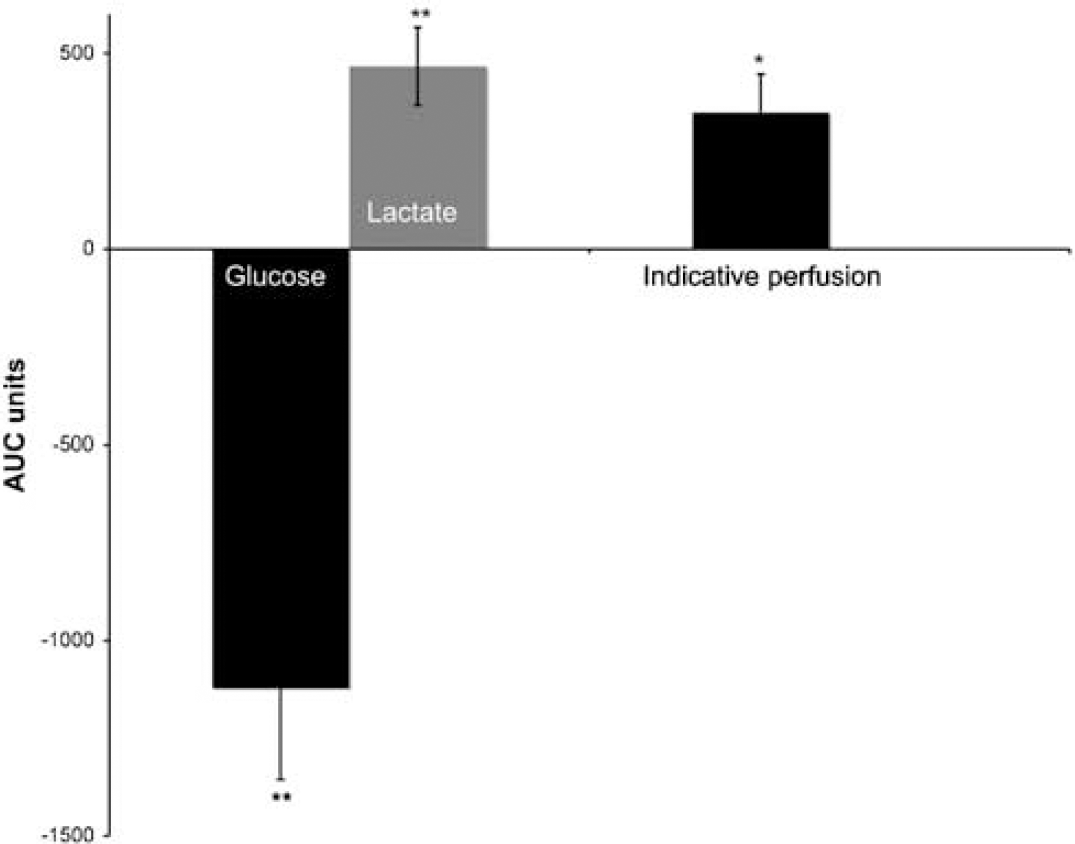
Area under the curve (AUC) (analysis for glucose, lactate and indicative flow). AUC values were calculated from each raw data trace as the sum of (difference from base-line × intersample interval). Bars represent the mean ± s.e.m. (n = 5) of the areas under the trace of transient response to CSD integrated over 30 mins. Asterisks indicate statistical significance compared with area of zero (Flow *P = 0.041, n = 5. Glucose **P = 0.0088, n = 5, lactate **P = 0.0073, n = 5).
To examine the possibility that the presence of the microdialysis probe might influence the propagation of the CSD wave or its properties, we compared the peak of the CBF response to the CSD at locations in the path of the CSD wave: before the probe, at the probe, and beyond it. Figure 1 (lower panel) displays a histogram that compares the averaged maximum ICT, percentage, and indicative CBF increases in these three regions as illustrated on the raw laser speckle image (Figure 1, upper panel). After injection, it can be seen that the hyperaemia is not significantly different in the three locations. Before reaching the probe, the maximum CBF increase is 42.8 ± 2.7 mL/100 g/min, whereas at and beyond the probe these values are 36.1 ± 4.7 and 36.0 ± 6.7 mL/100 g/min, respectively. Paired t-tests confirm that these values are not significantly different from each other, indicating that the microdialysis probe does not interfere with the CSD as judged by its associated haemodynamic response.
Discussion
The experimental evidence that spontaneous depolarization events in the ischaemic brain (PIDs) contribute to the enlargement of an infarct has been reviewed above, and rsMD has characterized a dynamic metabolic signature of a transient lactate increase, with more sustained reduction in tissue glucose, that typifies these events (Hopwood et al 2005). Application of the same technology in the study of patients receiving neurocritical care following severe head injury has revealed important patterns of dynamic changes in glucose and lactate, and an apparently linear relationship between number of depolarizations and progressive reduction in brain dialysate glucose (Parkin et al 2005). In several cases metabolite levels did not recover to baseline values within 15 to 25 mins (Feuerstein et al 2007).
As depolarization events often recur within a comparable time period or soon afterwards, both in patients and in experimental models, the time course of metabolite recovery to baseline following a depolarization might affect tolerance of subsequent depolarizations and through this, evolution of traumatic and ischaemic lesions. The potential consequence, namely progressive, stepwise decline in tissue glucose, is illustrated in Figure 7. In the case of experimental models, there is new evidence from serial laser speckle flowmetry suggesting that a single depolarization event can propagate for multiple cycles around the periphery of a small cortical lesion (Supplementary video material), giving rise to observation of recurrent, periodic events at a given locus near the edge of the lesion. The possibility arises that similar behaviour might explain periodicity of depolarizations in the injured human brain (Dohmen et al 2008).
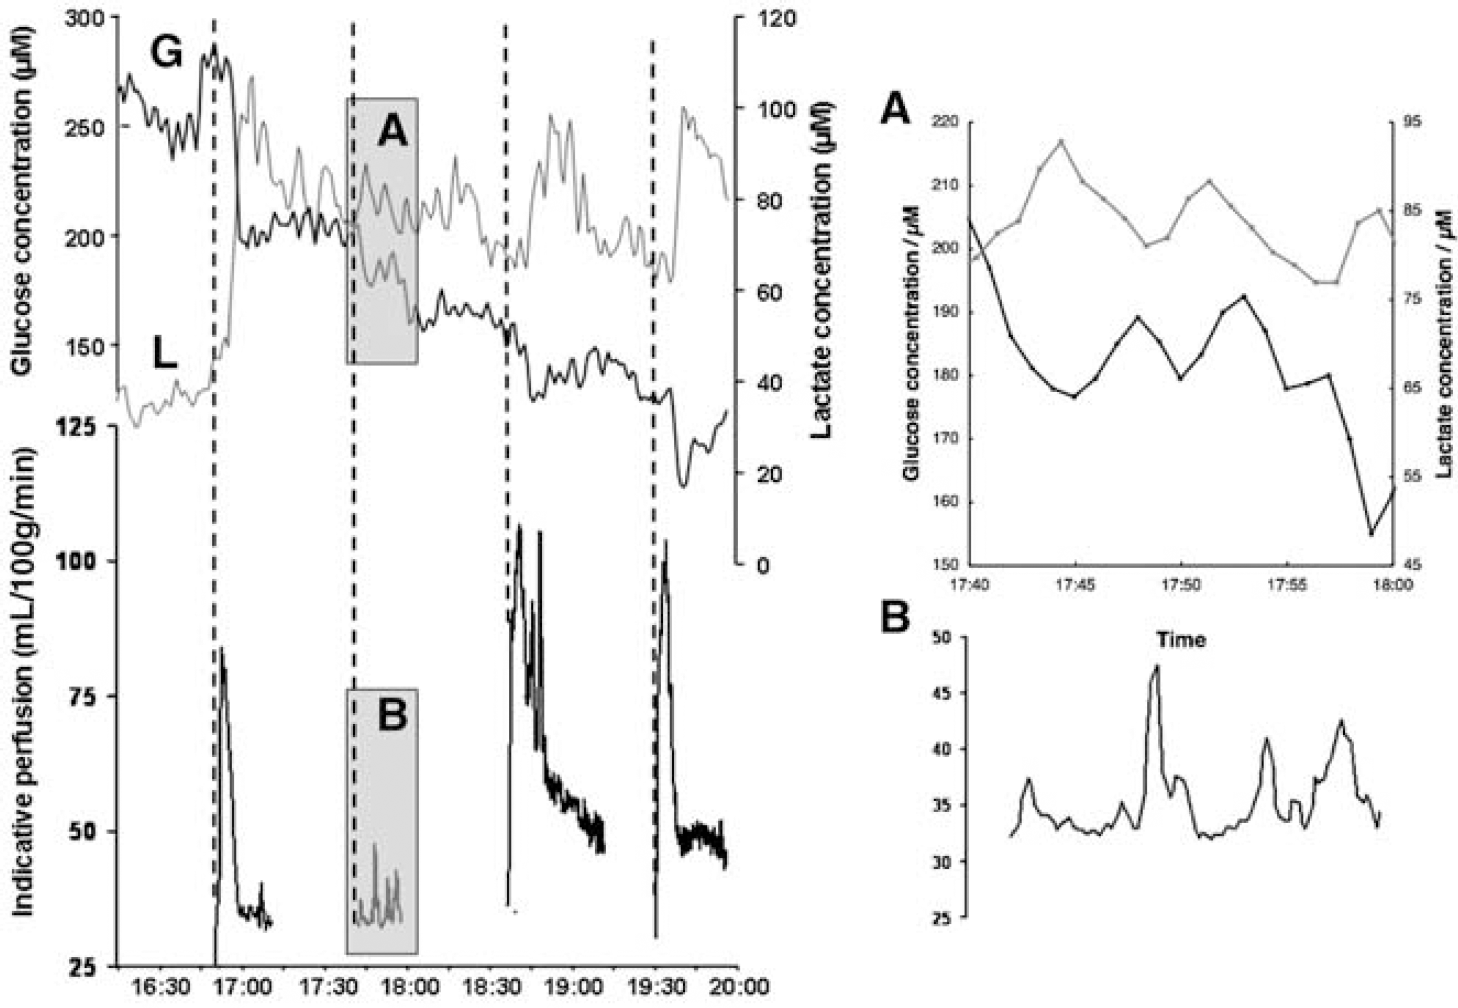
Stepwise falls in brain tissue glucose associated with cortical spreading depressions. Comparison of time course of microdialysate glucose (G) and lactate (L) with indicative perfusion at the site of the microdialysis probe in one experiment (a single region of interest of approximately 2-mm diameter was drawn immediately adjacent to the probe tip). Vertical dotted lines indicate times of cortical intraparenchymal microinjection of 1 mol/L KCl. The hyperaemic responses to injections 1, 3, and 4 are shown, but that following the second is not shown, to clarify the four secondary hyperaemic events (shaded panel
This has important implications: studies comparing patient outcome with brain microdialysate glucose levels have suggested that periods of low/zero glucose level are linked to poor outcome (Vespa et al 2003). Although it is not known whether the periods of low glucose levels in these patients were linked to individual PID/CSD events, it seems likely that recurring depolarization events in an injured brain that lead to decreasing glucose levels (Hopwood et al 2005) may compromise clinical outcome. The high probability of glucose depletion causing PIDs, and the basis for this, were described by Nedergaard and Astrup (1986); CSD (with a presumed normal hyperaemic response) is facilitated by intravenous insulin (Bures and Buresova, 1960) and, in support of the dependence of ion homoeostasis on substrate availability, hypoglycaemia brings forward the time point of terminal depolarization following cardiac arrest (Hansen, 1978). Thus a potential vicious circle can be envisaged in which glucose depletion and recurrent depolarizations interact reciprocally in ischaemic or injured cerebral grey matter until terminal depolarization supervenes.
Recent clinical studies monitoring the ECoG in patients with traumatic or ischaemic brain injury indicate two patterns of spreading depolarization. One is associated with transient ECoG amplitude suppression resembling Leão's CSD, and the other with sustained ECoG suppression. This latter type is believed to represent the clinical analogue of PID (Fabricius et al 2006). In the light of these findings, reliable application of rsMD could be a part of neurocritical care research and practice by serving to detect and, as we proposed, discriminate different metabolic signatures for both patterns of spreading depolarization. This study has sought to define for the first time with good temporal resolution a metabolic signature of hyperaemic spreading depression as exemplified by Leão's CSD. The findings were unexpected in two respects, and contribute importantly to a new body of evidence which suggests that CSD (hyperaemic pattern) needs to be regarded as potentially harmful to the injured human brain, albeit probably less so than PID.
We identified a metabolic signature associated with the CSD, comprising of a fall of 62.9 ± 10.3 μmol/L (n = 5) in dialysate glucose and rise of 28.4 ± 4.2 μmol/L (n = 5) in lactate at 10 mins after depolarization. It is possible to compare these levels with previous studies of spontaneous PIDs after middle cerebral artery occlusion, recording a fall of 9 ± 9.7 μmol/L in dialysate glucose and a rise in lactate of 43.6 μmol/L (Hopwood et al 2005; Figure 5). This comparison raises a question of interest. Specifically, 10 mins after onset of a PID (Figure 5; Hopwood et al 2005), dialysate glucose has fallen by some 7.5 μmol/L (mean, with great variability), in the presence of penumbral perfusion levels and a mean plasma glucose in the region of 6 mmol/L. Here (Figure 4), dialysate glucose 10 mins after induction of CSD fell by some 60 μmol/L, despite hyperaemia and a higher plasma glucose (~ 11 mmol/L). However, the comparison is of only very limited value. This is because the 2005 data derive from not just the first, but from all PIDs in each cat, whereas only the first CSD is considered in this paper. As an example of the effect of the aggregate analysis, the cat whose data are shown in Figure 6 of the 2005 paper had a low preclip dialysate glucose and each PID was therefore necessarily associated with only a small further reduction in dialysate glucose. This ‘small reduction’ effect was multiplied by the large number of PIDs analysed in the series as a whole, and by the overall trend for each subsequent preevent dialysate glucose to be less than the previous one.
The marked fall in brain glucose has important implications for policies for the management of plasma glucose in patients with acute brain injury, at least 50% of whom (undergoing craniotomy) experience depolarizations, which are often recurrent (Strong et al 2002, Dohmen et al 2008). Benefit has been claimed for the use of tight plasma glycaemic control with insulin to the range 4 to 6.5 mmol/L (72 to 117 mg%; Van den Berghe et al 2001), considerably less than the preinjection plasma glucose in these experiments. The data presented here suggest a substantial risk of progressive depletion of brain glucose with recurrent depolarizations (especially in a patient managed with tight glycaemic control), and indicate that it is not necessary for a depolarization to be associated with vasoconstriction, as in a PID (Shin et al 2006; Strong et al 2007), for it to pose a threat to the brain glucose pool.
The dialysate glucose levels displayed no recovery within a 30-min time period. The increased CBF response also was persistent within a 30-min time period (significant for 25 mins; Figures 5 and 6), and predicted to fall to baseline within some 93 mins. Our results are unexpected in indicating that (1) despite a much longer sustained hyperaemia (with the measure of perfusion used here) than previously described (Lauritzen et al 1982), there is, nevertheless, (2) depletion of brain dialysate glucose that is also remarkably sustained. Earlier, Takeda et al (1993) using a freeze trapping technique in rats in vivo described depletion of tissue glucose and production of lactate with recurrent depolarizations. Under physiologic conditions there is little previous evidence for transient falls in dialysate glucose when cerebral vasoregulation is normal. In fact, in a wide range of stimuli in the freely moving rat, for example, grooming (Fellows et al 1993), tail pinch (Fray et al 1996), and mild hypoxia (Jones et al 2000), there is no reduction in dialysate glucose.
Both the unexpected findings in these experiments require discussion: (a) persisting hyperaemia after CSD, and despite this, (b) persisting depletion of the brain dialysate glucose.
Sustained Hyperaemia
Studies of CSD and perfusion by Lauritzen et al (1982), found that the initial hyperaemic response to the CSD was followed by a persistent oligemia or hypoperfusion lasting over 60 mins (Figures 5 and 6). They used autoradiography to examine the CBF responses to a CSD throughout the depth of the cortex. From their autoradiograms, it was clear that there was indeed persistent hypoperfusion extending throughout the depth of the cortex, and lasting for at least 60 mins. In contrast, measurement of CBF with laser speckle imaging is weighted towards the superficial cortical layers: its maximum penetration depth is typically 500 to 1000 μm at 785 nm (Dunn et al 2001). Thus perfusion as measured by laser speckle imaging does not fully represent perfusion in the deeper cortex (i.e., around the microdialysis probe). Were cortical perfusion to be homogeneous through all layers, sampling depth would not present a problem. However, Fabricius et al (1997) have found evidence of laminar inhomogeneities in the vascular response to CSD, and Chuquet et al (2007) now report constriction of penetrating cortical arteries in response to CSD induced in rats in vivo. In contrast, the response of their pial vessels was biphasic—transient hypoperfusion followed by more sustained hyperaemia. Thus a disparity between post-CSD perfusion values measured with different methods is not unexpected. Species difference may also explain the apparent discrepancy, with sustained hyperaemia following CSD a feature of the cat brain (Wahl et al 1987).
Sustained Depletion of Brain Glucose
Reduction in dialysate glucose is in agreement with earlier results describing depletion of both tissue glucose and glycogen with CSD (Krivanek, 1958; Figure 4). Glycopenia that continues for some 30 mins after CSD clearly derives from reduced delivery (despite hyperaemia) or increased utilization, or a combination of both. The microdialysis membrane used here was 2 mm in length, almost all of which is within the cortex or immediately subcortical white matter, so that it samples, overall, from a wider range of tissue depths than does the laser speckle imaging technique. For the reasons given above, reduced delivery cannot be excluded, because the volume sampled by microdialysis may not be congruent with that imaged for perfusion with the speckle method, and areas of reduced perfusion may coexist with hyperaemia nearby.
Increased utilization of glucose is demonstrable, but heterogeneous, in rats subjected to a single episode of CSD (Shinohara et al 1979). In the period 5 to 30 mins after CSD, energy consumption by ion pumps can be excluded as a sink because the cells are not depolarized but hyperpolarized at this stage. Another pathway for utilization of glucose is the replenishment of astrocytic glycogen. Thus Hertz reasons that under conditions of acute energy demand, in his case during the repolarization phase after CSD, glycogenolysis offers a higher anaerobic yield of ATP than fresh glucose utilization (Hertz et al 2007); glycogen resynthesis is therefore likely to be required between ~ 5 and 30 mins after CSD. In this situation, the destination of the increased glucose utilization (in excess of delivery) would be dual: initially some of it would appear in the ECF as lactate but subsequently, as lactate recovers, the dominant mechanism would become replenishment of astrocytic glycogen.
These findings suggest that where depolarization events recur (now a common observation in patients monitored appropriately (Dreier et al 2006)), progressive decline in brain glucose may occur, even with apparently hyperaemic depolarizations in which recovery of DC potential is normal. Depletion of brain glucose in proportion to number of depolarizations in patients with traumatic brain injury has been described (Parkin et al 2005), and the new findings suggest that a depolarization of CSD pattern (hyperaemic response) is capable of causing this, in addition to PIDs. The findings also suggest that CSDs associated with hyperaemia may have adverse effects on tissue although they do not induce sustained, classical histopathologic damage by themselves (Nedergaard and Hansen, 1988). Furthermore, major advances in technology (dual photon imaging in mice) have now enabled Takano and colleagues to show evidence of hypoxia in vivo in the cortical microenvironment for up to 6 mins following a single CSD, together with abnormalities of dendrites on immunocytochemistry, despite evidence of hyperaemia (Takano et al 2007). As our results derive from the cat brain, resembling more closely the human than does the rodent brain, in respect of gyrencephaly and glia/neuron ratio (Tower and Young, 1973), they have particular potential relevance to clinical practice.
Conclusion
The primary finding of this paper is that brain dialysate glucose levels fall and remain decreased for 30 mins after a single CSD episode. This suggests that, particularly where understanding of acute brain injury and its treatment (especially when plasma glucose is manipulated downwards with insulin) in humans is concerned, ‘classical,‘ hyperaemic CSD must now be regarded as carrying some risk of a pathogenic effect, although probably less than that of ischaemic peri-infarct depolarizations. Thus all depolarization events may lie in a single, broad continuum in respect of their potential to increase neuronal loss. Given the increasing frequency with which these events are being detected in the human brain, these results emphasize the importance of adequate glucose availability in the management of brain injury, and raise again the questions of whether depolarizations are indeed independently associated with adverse outcome, and if so, whether treatment to abrogate spontaneous depolarization should be considered when such activity is present.
Footnotes
Acknowledgements
The authors thank Mesbah Alam, Doris Lattacz and Gerhard Rosner for expert technical assistance.
EPSRC (UK): DTA award to MGB; DFG (Germany): DR 323/2-2 to JPD; JPD and RG are members of the German Stroke Competence Network; RB and AJS are supported in part by HeadFirst.
All the authors declare that they have no conflicts of interest.
References
Supplementary Material
Please find the following supplemental material available below.
For Open Access articles published under a Creative Commons License, all supplemental material carries the same license as the article it is associated with.
For non-Open Access articles published, all supplemental material carries a non-exclusive license, and permission requests for re-use of supplemental material or any part of supplemental material shall be sent directly to the copyright owner as specified in the copyright notice associated with the article.