
Abstract
Laser speckle imaging of the exposed cerebral cortex allows detailed examination of the time course and topography of perfusion under different experimental conditions. Here we examine the quantitative capacity of the method and its sensitivity for the detection of peri-infarct depolarisations (PIDs). In four cats anaesthetised with chloralose, the right hemisphere was exposed and the right middle cerebral artery was occluded. The brain was illuminated with a laser diode, the speckle pattern was imaged, and images of inverse speckle correlation time (ICT) were derived from the calculated speckle contrast images. We examined the relationship of ICT with perfusion, as imaged quantitively using umbelliferone clearance (CBFumb). Values of ICT and CBFumb were compared and regression parameters were calculated for each experiment. In eight cats, cortical surface direct current (DC) potential was monitored at two locations and detection of PIDs by DC potential and ICT change was compared. ICT- and CBFumb-derived values of perfusion were closely correlated, with a high degree of significance (P < 0.0001). Overall, monitoring of DC potential detected 90% of PIDs, whereas ICT detected 56%. We conclude that (1) laser speckle imaging provides an index of perfusion that has a linear relationship with the clearance rate of umbelliferone within the range of levels of perfusion examined; (2) this relationship is relatively stable between experiments; and (3) the method's ability to detect blood flow changes associated with PIDs likely depends on the noise level of the speckle measurements.
Keywords
Introduction
There is persuasive experimental evidence that the extent of an ischaemic cerebral cortical infarct is related to the number of spontaneous periinfarct depolarisations (PIDs) (Mies et al, 1993), and that infarct size is the dependent variable in this relationship (Takano et al, 1996; Busch et al, 1996; Back et al, 1996). Analysis of any changes in perfusion of the cortex that might accompany a PID has been severely limited by the lack of a quantitative method that has sufficient spatial and temporal sampling power to allow detection and analysis of any changes that occur. Since occurrence of a PID and its arrival at a given cortical locus are unpredictable, continuous imaging over a protracted period is also required. Laser speckle flowmetry, as implemented by Dunn et al (2001), allows sequential imaging of perfusion of the exposed cerebral cortex.
In these experiments, in cats undergoing occlusion of the middle cerebral artery, we therefore evaluated the quantitative capacity of laser speckle imaging by comparing it with values for cortical perfusion obtained in the steady state in the same region of cortex using umbelliferone clearance (CBFumb) (Kirkpatrick et al, 1994) as a reference method.
In separate studies with the same experimental system, we used surface direct current (DC) electrodes as a reference method for assessment of the sensitivity of laser speckle imaging as a means of detecting PIDs.
We report that laser speckle perfusion imaging does indeed provide a quantitative measure of perfusion at remarkably high frequency (13 secs in our system). The method therefore provides a valuable new tool with which to probe factors that degrade or improve perfusion in the marginally ischaemic cerebral cortex—‘at risk’ tissue. The technology has yielded striking data on the occurrence, behaviour and significance of propagating reductions in perfusion linked to depolarisation events in the gyrencephalic brain, which will require a separate report. Some of the present data on stability of laser speckle perfusion imaging and its relationship with CBFumb as a reference method has been published in abstract form (Strong et al, 2003).
Materials and methods
Anaesthesia and Surgical Preparation
In fully licensed experiments, anaesthesia was induced with metetomidine 0.1 mg/kg and 4% halothane in 12 adult male cats in the weight range 3.3 to 6.5 kg. Femoral arterial and venous catheters were inserted for serial measurement of arterial pressure and blood gases, and for administration of drugs, respectively. The trachea was intubated and artificial ventilation was established and maintained, with a target value of arterial pCO2 of 30 mm Hg. When arterial pressure had stabilised, α-chloralose 60 mg/kg was infused intravenously over 5 mins, and inspired halothane concentration was reduced to the range 0% to 0.5%. The right middle cerebral artery was exposed transorbitally in all experiments and later occluded with a miniature Scoville clip. The scalp and calvarium were removed and the dura opened over the right cerebral hemisphere so as to expose the majority of the ectosylvian (EG), suprasylvian (SG) and marginal (MG) gyri, and a pool was established and filled with mineral oil; a water-heated coil was inserted into the pool and the pool temperature was monitored and maintained at 37°C ± 0.5°C.
In four experiments, the lingual artery was cannulated retrogradely for intermittent delivery of 0.5 to 1.0 ml boluses of 0.125% umbelliferone for measurement of cerebral blood flow (Kirkpatrick et al, 1994).
For recording of cortical DC potential in eight separate experiments, a reference electrode of sintered silver/silver chloride (diameter 1 cm) was placed subcutaneously in the interscapular region, and the wound closed. Ball electrodes of chlorided silver 2 to 3 mm in diameter were suspended via a coiled spring lead and placed on the suprasylvian and/or marginal gyri. Signals were fed to ML165 high-impedance amplifiers (ADInstruments, New South Wales, Australia), and logged using Chart software (V5.0.1, ADInstruments).
Image Acquisition and Postprocessing (1): Laser Speckle
The cortex was illuminated from a laser diode (Sanyo DL7140-201, 785 nm, 70 mW) via a diverging lens at a distance of 12 to 20 cm from the cortex. Scattered light was imaged at or near the narrowest available aperture setting (nominal f22) with a Peltier-cooled CCD camera (CT150A, CTec Photonics, Modesto, CA, USA), and images were digitised with a Scion LG-3 card (Scion Corporation, Frederick, MD, USA). The pixel matrix was 768 (width) × 512 (height), and the image field was typically 22.2 × 15 mm, giving a pixel area of approximately 29 × 29 μm. Software was custom-written (AKD) to allow derivation of an image of the inverse of the calculated laser speckle contrast and speckle correlation times (ICT) as described elsewhere (Dunn et al, 2001; Ayata et al, 2004a), and implemented on a 1.2 GHz Pentium-4 or 2.4 GHz Xeon CPU. Since speckle correlation time is inversely proportional to perfusion (Briers, 2001), this approach enabled grey level images representing perfusion to be stored at intervals of approximately 22 (1.2 GHz CPU) and later of 13 (2.4 GHz) secs. We note that these intervals were limited only by the time needed to calculate the speckle contrast, and significantly higher temporal resolution (> 10 Hz) can be achieved by deferring processing of images until the end of the experiment (Dunn et al, 2003). Treatment of the laser speckle contrast value for purposes of comparison with CBFumb as a reference method is described below.
Image Acquisition and Postprocessing (2): Umbelliferone Clearance
The CBFumb method (Kirkpatrick et al, 1994) was used as a reference standard for evaluation of ICT as a measure of perfusion. First pass extraction of this dye into the cortical parenchyma after an intra-arterial bolus is sufficient to allow subsequent imaging of its elution from the cortical parenchyma (after clearance from the capillary circulation). Illumination of the cortex was at 340 nm (isosbestic with respect to pH), and emitted light was filtered, passing between 445 and 465 nm. Before and after middle cerebral artery occlusion (MCAO), and thereafter at intervals of 45 to 60 mins, sequences of images of the elution were acquired at 15-secs intervals and digitised. Umbelliferone measurements were interleaved with speckle image acquisition in each animal through computer-controlled changing of the illumination system.
A sequence of mean grey levels was extracted for each ROI (drawn as described below) and the initial slope equation (Pasztor et al, 1973) was solved for perfusion in ml/100 g/min by regression analysis (‘Impresso’ software, Foster-Findlay Associates, Newcastle-upon-Tyne, UK). The majority of values for r2 was above 0.93, and increased further with removal of 1 to 2 points (usually the initial value(s) in which dye had not cleared the vascular compartment). Any ROI in which the value of r2 was less than 0.90 (before editing) was rejected for the clearance in question. As a consequence, relatively few comparisons of the umbelliferone and speckle methods could be made at low levels of perfusion since failure of umbelliferone to load in the core territory resulted in negligible increase in fluorescence above baseline and hence no clearance.
Comparison of Inverse Speckle Correlation Time with Umbelliferone Clearance
In total, 13 to 15 ROIs covering the entire exposed cortex but omitting major vessels were drawn and used for both measures of perfusion—CBFumb (absolute units of ml/100 g/mins) and CBFICT. A value of inverse speckle correlation time (ICT) was calculated for each ROI from the mean of two images either immediately before or after the CBFumb, whichever was closer in time: the interval was generally of the order of 2 mins. Linear regression analysis was then carried out separately for each experiment, treating ICT as the dependent variable and CBFumb as the independent or reference variable: Prism software (Version 4.0, GraphPad Software Inc., San Diego, USA) was used. Each pair of ROI values in each clearance was treated as a separate observation, baseline and ischaemic values all being included in a single regression analysis for the experiment concerned.
A consequence of the method of calculation of ICT is that a zero value of ICT would not necessarily correspond to zero perfusion. To provide guidance on what value of ICT might properly represent zero cortical perfusion in an individual experiment, a measure of ICT after permanent circulatory arrest at the end of the experiment is needed. Since other aspects of the licensed scientific protocol in the present study precluded this mode of termination of these experiments, ICT at zero flow was measured in four separate experiments in which the surgical preparation, anaesthesia and speckle imaging settings were identical with those used here, and in which termination by lethal injection was required. The grand mean value for ICT at zero arterial pressure in these experiments was 649.7 (range 532 to 784), and a value of 650 was therefore applied as the fixed y-intercept of the ICT/CBFumb regression in each ICT/CBFumb experiment.
Detection of PeriInfarct Depolarisations from Propagating Changes in ICT
In a postprocessing procedure, the entire sequence of images was replayed rapidly (∼12 frames per second) in computer random access memory. Changes in ICT that were seen to propagate coherently across one or more gyri were noted and their time of occurrence was recorded. In early studies propagation rate was measured from image times and dimensional calibration of the images, and found to lie in the range 2 to 4 mm/min, fully compatible with the rate of propagation typical of cortical spreading depression (CSD) (Leão, 1944b). Periinfarct depolarisations were subsequently identified as such entirely from the rapid sequence review procedure. The time when a propagating change in ICT was seen to arrive in the vicinity of the DC electrode on the SG or MG was recorded from the image sequences, and independently from the DC recording (computer clocks were synchronised to ± 2 secs before each experiment).
Results
Stability of Inverse Laser Speckle Correlation Time as a Measure of Perfusion
Under stable, resting haemodynamic conditions, values of ICT were highly reproducible, with standard error for a given region of interest typically 1.6% of the mean (sequence of 10 values over a period of 130 secs).
Values after Middle Cerebral Artery Occlusion
One example of the changes in ICT that occurred in response to MCAO is shown in Figure 1 (Expt. #2); it shows an abrupt decrease in perfusion in all three gyri imaged, maximal in the core territory (ectosylvian gyrus: EG), and less marked in the suprasylvian (SG) and marginal gyri (MG). In the 3 to 4 h after MCAO, we observed substantial numbers of spontaneous, transient reductions in ICT that originated on SG or MG and propagated either centrifugally from the MCA input or along the length of a gyrus. Time course of recovery varied, and in several instances the reduction in perfusion appeared irreversible. The time course was sometimes biphasic when images were analysed as a grey level sequence in restricted regions of interest. The detailed characteristics of these events and their significance are beyond the scope of the present paper.
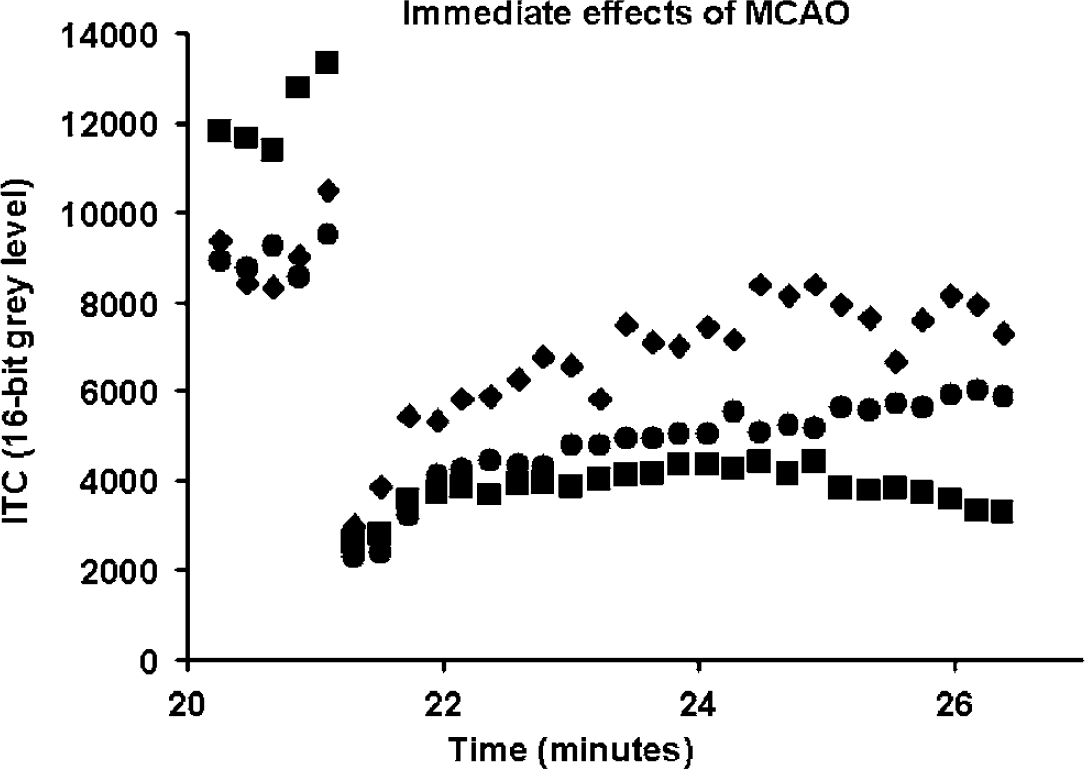
Illustration (Experiment 2) of time course of perfusion (as indicated by inverse laser speckle correlation time, ICT, a 16-bit grey level value) in typical regions of interest on penumbral (marginal—⧫) and core-destined (ectosylvian—▪ and suprasylvian— •) gyri, immediately after middle cerebral artery occlusion. Time scale is from an arbitrary reference point prior to occlusion at ‘21’ mins. The value of ICT corresponding to zero perfusion is 650 (please see text). Partial recovery of perfusion is seen on all three gyri, indicating the rapid, but incomplete development of collateral circulation.
Comparison of Laser Speckle Perfusion Image Data with Umbelliferone Clearance as Reference Standard
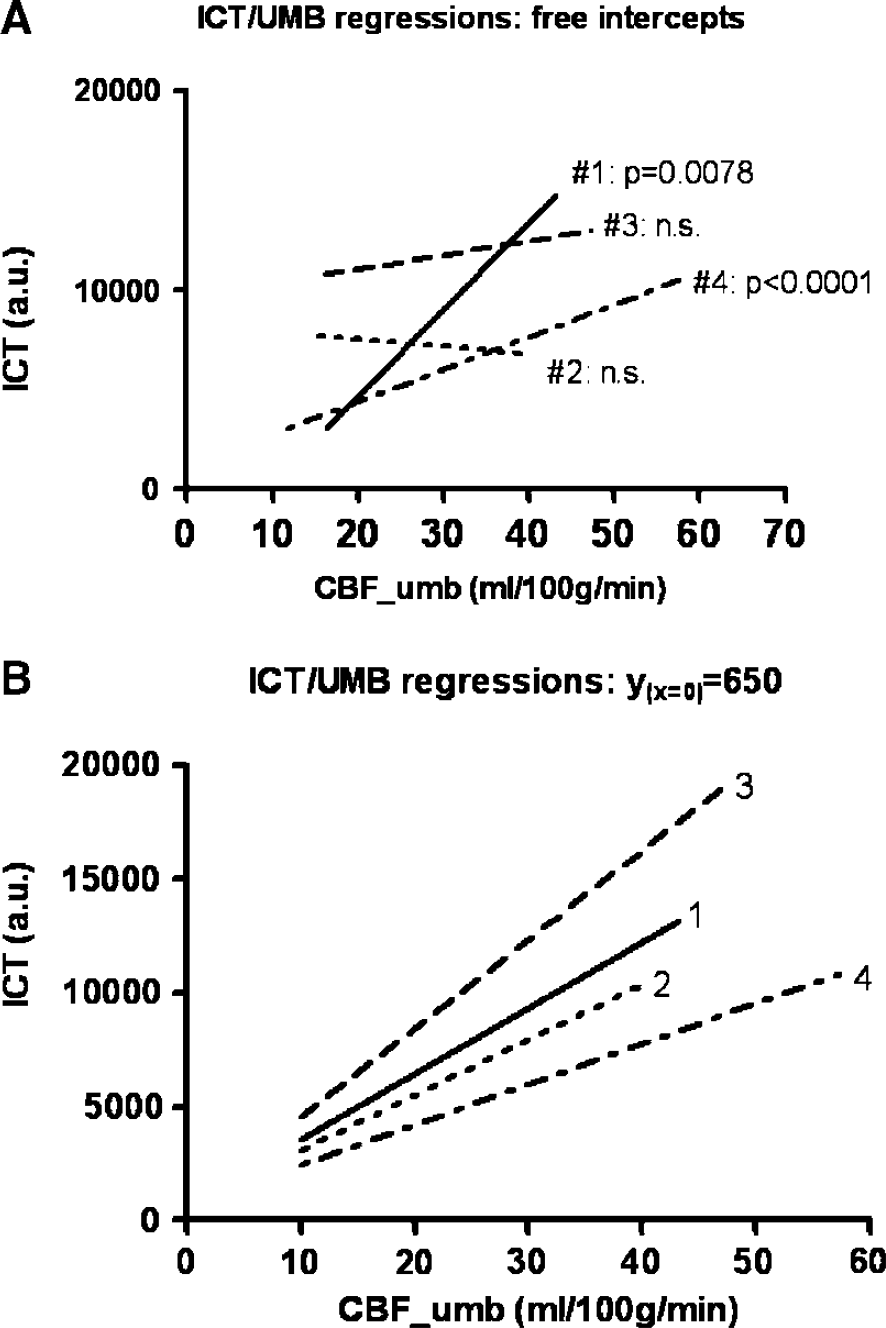
In four experiments, we compared CBFICT as ordinate with CBFumb as abscissa (reference method). Since clearance methods depend on the maintenance of stable perfusion for the duration of the clearance, the CBFumb method is vulnerable to the occurrence of CSD or PID and the potential associated perfusion changes during a clearance. Such events are easily detectable from a transient change in clearance rate. None were seen during CBFumb in any of the present experiments. Linear regression analysis was carried out both without and with a specified intercept in each experiment; visual inspection of the regression graphics did not suggest that a nonlinear regression model would merit specific examination. Using a ‘free’ intercept, significant correlations were seen in two experiments (P = 0.0078, < 0.0001), and slope in the four experiments ranged from —37.2 to 436.8. However, when an ICT intercept of 650 (CBFumb = 0.0) was specified before calculating the regression parameters (see Materials and methods), the relationship became highly significant in all four experiments (P < 0.0001). In addition, the slope of the relationship became relatively constant (range 178.1 to 389.9, mean 275.2). Individual data points for a single experiment are illustrated in Figure 2: the regression line in the figure is based on the use of the ICT intercept (x = 0) of 650 (slope = 243.3 ± 27.5 (95% CI)). Figure 3A shows the regression lines and parameters calculated for the four experiments with a ‘free’ or ‘floating’ intercept. Figure 3B shows the effect of imposing a fixed ICT intercept (x = 0) of 650 on the four regressions.
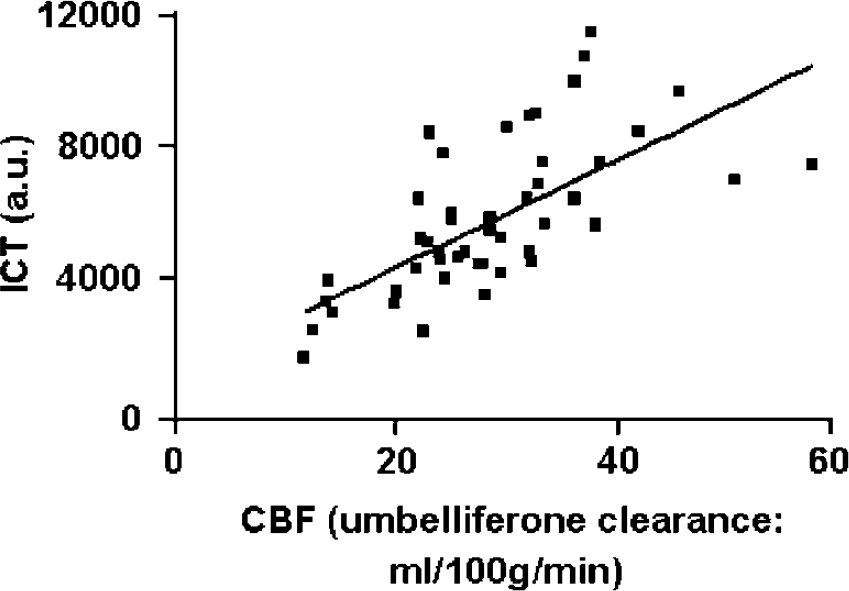
Relationship of inverse laser speckle correlation time (ICT, y) with perfusion as calculated by umbelliferone clearance (x) in one experiment (#2). Data points are derived from multiple regions of interest in the exposed cortex, both before and after occlusion of the middle cerebral artery. The slope of linear regression was 243.3% ± 95% CI (P < 0.0001) when ICT intercept for x = 0 was set at 650 (see Materials and methods, and Figures 3A and 3B).
(
Sensitivity of PeriInfarct Depolarisation (PID) Detection with Laser Speckle Imaging
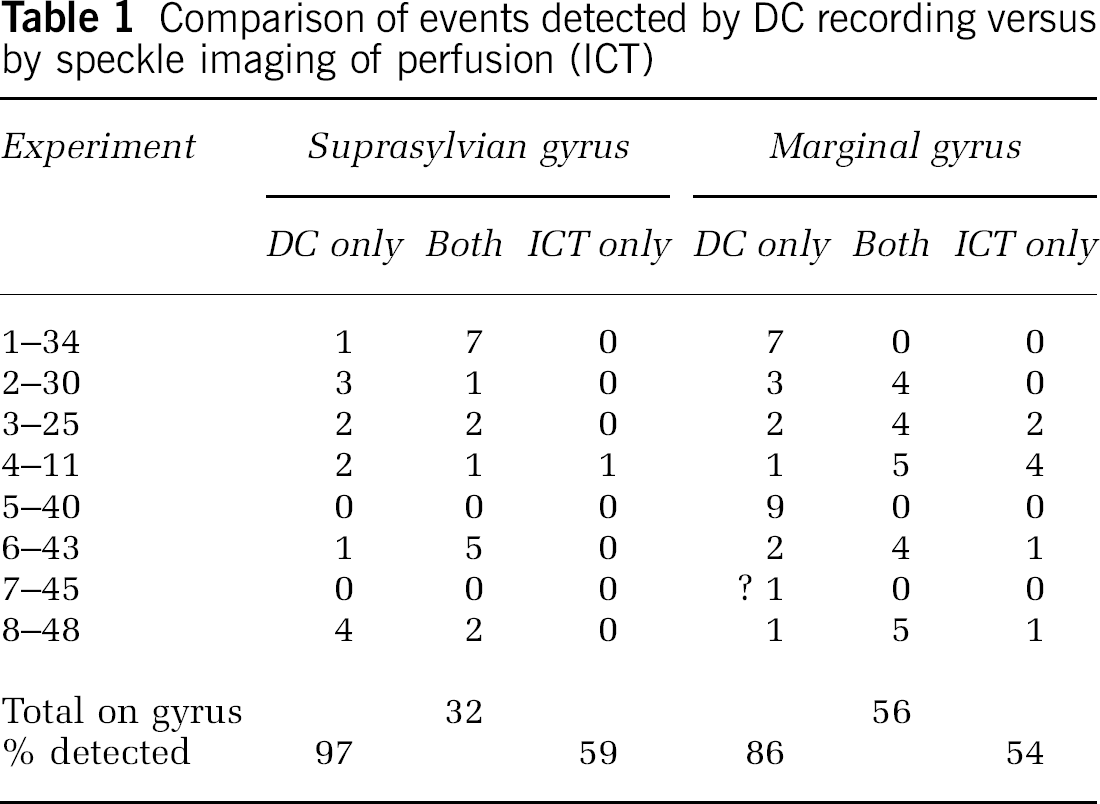
The majority of PIDs observed with laser speckle imaging could be readily tracked and were seen to propagate over the majority of either SG or MG, or both. They could often—but by no means invariably—be seen to invade the cortex in the immediate region of the DC potential recording electrode on the relevant gyrus. Since one DC electrode was located on the SG and one on MG, changes occurring on the two gyri were counted as separate events (for the purposes of this study of sensitivity of the ICT method only). The results of comparison of the occurrence of PIDs as detected either by DC electrode or by change in ICT (either polarity) are listed in Table 1. Although many events were detected by both methods, a further group was detected only by DC electrodes. On the marginal gyrus, a small number of events were seen only on speckle imaging (not recorded at the electrode). However, in these cases there was no evidence from the image sequence that the event had spread to the actual vicinity of the electrode. A total of 32 events (detected by one or other or by both methods) was recorded on SG, and 56 on MG. Monitoring of DC potential detected 90% of all events (SG and MG data combined), whereas ICT detected 56%.
Comparison of events detected by DC recording versus by speckle imaging of perfusion (ICT)
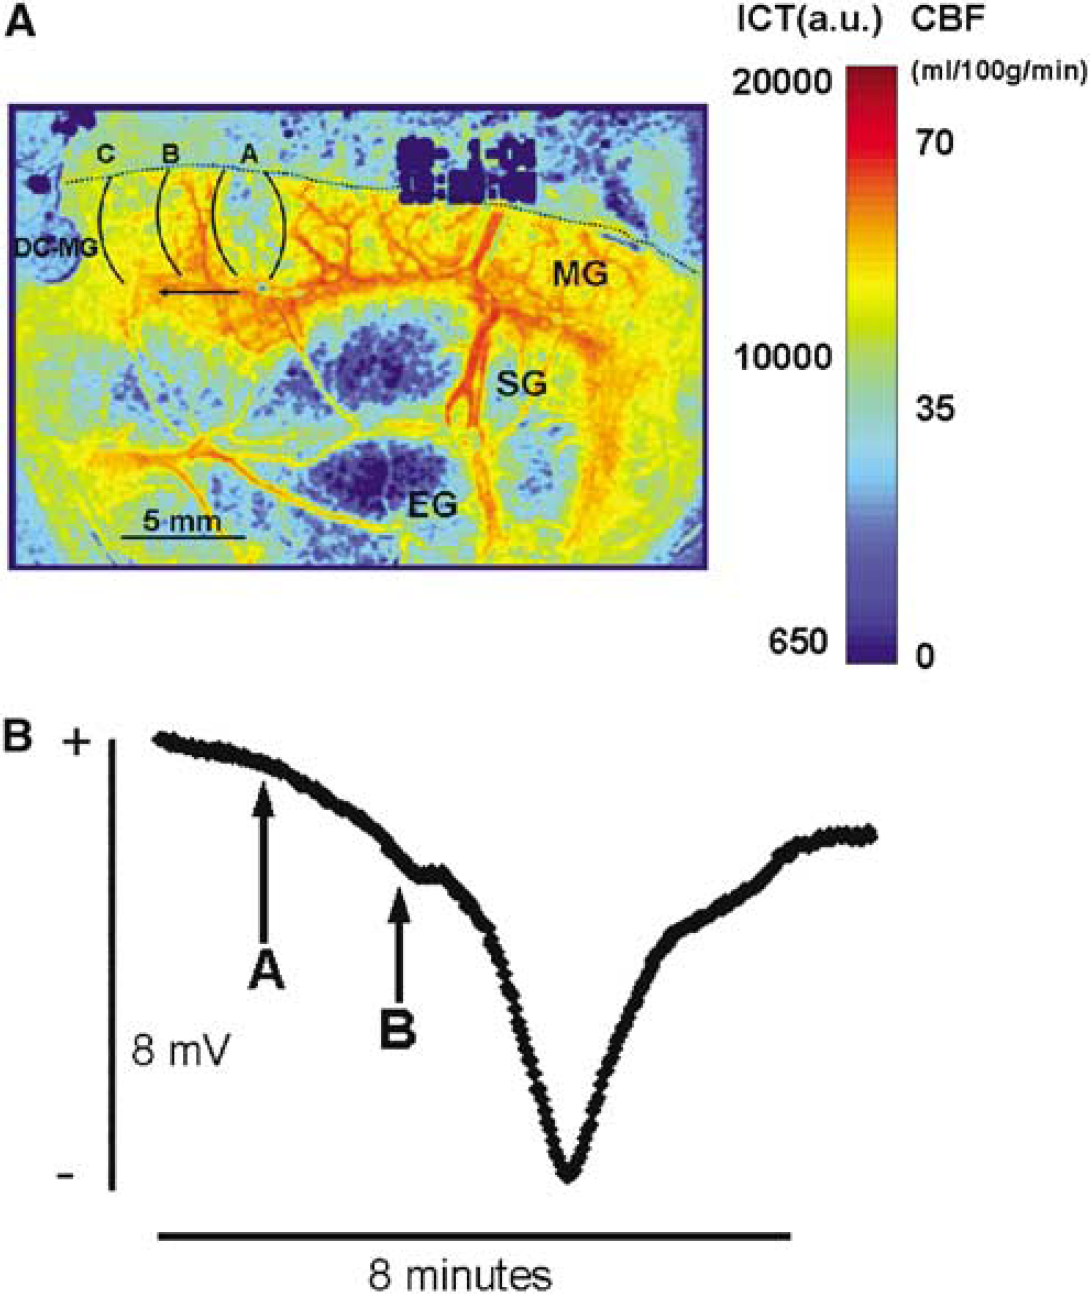
As illustrated in Figures 4A and 4B, there was invariably a delay of approximately 30 to 90 secs between onset of DC depolarisation and commencement of a decrease in perfusion. Caution is required in the interpretation of this information, for reasons given in the discussion below.
(
Discussion
Rationale for Use of the Laser Speckle Method in Stroke Models: Goals of Experiments
Since spontaneous, transient increases in extracellular potassium ion concentration occurring in the cerebral cortex lying within the ischaemic penumbra were first described after MCAO in baboons (Branston et al, 1977) and in cats (Strong et al, 1983), their properties and effects have been elucidated in work by several research groups. Their capacity to propagate widely in the cortex has been inferred from the use of multiple electrodes (Nedergaard and Hansen, 1993), and confirmed by imaging the propagation across the cortex of an increase in endogenous cortical fluorescence at 450 nm, when excitation at 370 nm is used: the rate of propagation of the events was shown with imaging to resemble that of CSD of Leão (Leão, 1944b; Strong et al, 1996). This, together with regular detection of transient (a) negativity of the cortical surface DC potential and (b) increase in extracellular potassium ion concentration, also features of CSD, led to the designation of such events as PIDs (Hossmann, 1996) when observed in the ischaemic penumbra. A first—and critical—difference between CSD and PID events is that whereas CSD is accompanied by marked, but transient hyperaemia (Leão, 1944a; Lauritzen et al, 1982), perfusion (as measured by laser Doppler probe) may fall transiently in association with a PID (Back et al, 1994). Secondly, CSD is not associated with histologic evidence of cytotoxicity (Nedergaard and Hansen, 1988), whereas there is a clear, direct relationship of infarct size with number of PIDs during a period of ischaemia (Mies et al, 1993), and infarct size is the dependent variable (Takano et al, 1996; Busch et al, 1996; Back et al, 1996).
A group of findings suggests that residual vasoreactivity in the penumbra is an important determinant of outcome in this cortical territory. First, work by Astrup and Nedergaard suggested that the frequency of PIDs in the rat MCAO preparation is a function of plasma glucose, reflecting increased anaerobic glycolysis and critical dependence of the cortical glucose pool on availability of glucose through residual perfusion (once the astrocytic glycogen pool has been cleared) (Nedergaard and Astrup, 1986). More recently, a direct dependence of PID frequency on plasma glucose level in the clinically relevant range of 4 to 6 mmol/L has been shown in cats (MCAO) (Strong et al, 2000; Hopwood et al, 2005), and direct monitoring of free cortical glucose with rapid-sampling microdialysis in the cat MCAO preparation shows transient reductions in the penumbra, linked to PIDs (Hopwood et al, 2005). Unidirectional glucose transport has a linear relationship with perfusion (Betz et al, 1973). Thus, in focal ischaemia, any change in perfusion in response to a PID is a determinant of residual glucose availability and hence of continued neuronal and glial polarisation and viability.
Thus, there has been a need for a measure of perfusion of the cerebral cortex that has sufficient temporal resolution to probe vasoreactivity, together with adequate spatial resolution and a sampling area that includes core, penumbral and normally perfused vascular territories. In addition, because PIDs occur spontaneously and unpredicatably, the rate of image acquisition must be sufficient to detect and track any PIDs, whenever they may occur during a period of ischaemia. Laser speckle contrast imaging, or ‘laser speckle flowmetry’, in the implementation described by Dunn et al (2001), meets these needs, and has been applied for studies of activation (Durduran et al, 2004), and of vascular responses to CSD in the mouse and rat (Ayata et al, 2004a, b). Thus, the principal task in this technical evaluation study was to compare perfusion, as imaged with laser speckle flowmetry, with perfusion data from CBFumb as a reference method. This task was accomplished in the first four experiments, with the conclusion that a linear relationship of CBFICT with CBFumb is demonstrable and is relatively consistent between experiments, if a specific value of CBFICT is set corresponding to zero perfusion. In addition, these experiments showed that CBFICT is highly reproducible in an individual experiment (in the absence of depolarisation events or changes in perfusion pressure). A second set of experiments (n = 8) assessed the ability of the speckle method to detect PIDs.
Adaptation of the Laser Speckle Imaging Method to the Gyrencephalic Brain
No fundamental problems were encountered in applying, in an open-skull preparation in the cat, the method of imaging of perfusion at the brain surface originally developed by Dunn et al (2001) for the rat brain. An obvious requirement is that no relative movement of camera or preparation should occur during an experiment, although currently available registration algorithms could correct for this type of movement if required. The excellent reproducibility of serial measures of ICT in the great majority of experiments indicates that any such movement caused only minimal degradation. However, we did on occasion observe significant phasic, global alterations in CBF at intervals of some 12 to 15 mins, which bore no apparent relationship with, for example, arterial blood pressure. Areas of the image field outside the area of exposed cortex were often affected, and since the method is known to be vulnerable to movement artefact, we currently attribute the changes to unidentified sources of low-amplitude vibration in the experimental environment affecting the surface of the paraffin pool. Convection currents in the paraffin pool after refilling with oil of a slightly different temperature might also contribute. Aliasing resulting from interaction between sampling frequency and brain movement resulting from cardiorespiratory pulsation is another possible cause.
Umbelliferone Clearance as Reference Method
A reference method that estimates perfusion in the same sample of cortical surface as the test method, and under a range of levels of perfusion that includes normal as well as ischaemic values, was required. Umbelliferone clearance is well suited for this purpose, being a surface imaging method that has been shown to yield appropriate values of perfusion with minimal errors, and in which ROIs that are equally applicable to both test and reference methods can be selected. Since CBFumb requires a steady state and can only be used at intervals of perhaps not less than 30 mins, it is not appropriate for a study of the dynamics of perfusion in the penumbra, in which PIDs may occur unpredictably and in which the (possibly brief) perfusion transient cannot be examined with a steady-state method. Laser speckle contrast imaging was examined as a possible means of addressing these needs. When CBFumb was imaged in these experiments with the same camera as was required for laser speckle imaging, we obtained mono-exponential clearances of high quality in respect to stable clearance rate and high values of r2, with only the occasional need to ignore an isolated outlying datapoint in a clearance plot (usually where dye delivery was suboptimal in ischaemic areas or dye was still present in the capillary circulation) to attain r2 values between 0.97 and 1.00. Thus, CBFumb proved to be an appropriate reference method for the purposes of this study.
Relationship of Laser Speckle Data with Umbelliferone Clearance
In these experiments we found a relatively consistent linear relationship with CBFumb, as illustrated by Figure 3B and this reached high levels of significance in all experiments when an appropriate constraint on the regression calculation was imposed. The need for this arose from the relatively narrow range of perfusion values available for study in two (numbers 2 and 3) of the four experiments. An inevitable consequence of this relatively narrow range is that either no correlation is shown, as in these experiments, or, if it is, there is a wide error in estimating the parameters of the relationship. A value of ICT representing zero perfusion was therefore obtained as described in the Materials and methods. When this value was applied to the regression in each of the four current experiments, the correlation of the two variables became highly significant. Given the wide numerical range of possible values for ICT that are inherent in the calculation, the values for slope that resulted can be considered very comparable in the four experiments. The y-intercepts obtained from ‘free-intercept’ regression in two of the experiments (−4114 and 1136) are compatible with our use of 650 as a ‘true’ zero perfusion value for ICT. In no experiment did visual inspection of the scatter plot suggest that the relationship was nonlinear. Differences in the cortical depth of origin of the different light wavelengths of fluorescence (< 500 μm) (Jobsis et al, 1972) and near infrared (650 to 900 μm) (Dunn et al, 2001) used for CBFumb and laser speckle, respectively, may also account for some of the variability of regression parameters between experiments.
Nevertheless, ad hoc trial conversions of preocclusion and ischaemic values of ICT obtained in other recent experiments to absolute perfusion values, using the mean slope (275) and zero-perfusion ICT intercept (650) from the four experiments reported here, yielded values of perfusion that accorded closely with values obtained with hydrogen clearance in this model of stroke (Strong et al, 1983). However, the present data suggest that despite a clear relationship of the two variables, errors on conversion of a single value of ICT to an absolute value for perfusion would still be too wide to allow direct, accurate cross-conversion of ICT values to CBF in specific regions of interest. The data do however justify the conclusion that ICT is a valid index of perfusion over the range tested. They also allow a pragmatic interpretation of ICT values in terms of absolute perfusion units: this in turn offers an indication of the potential significance of a given ICT image in relation to published values of absolute perfusion associated with, for example, loss of electrophysiologic function or viability (Branston et al, 1977; Strong et al, 1983; Tyson et al, 1984).
Despite this positive assessment of our results, there are clear constraints on the use to be made of them. Our data apply only to a specific set of imaging and processing settings, and to a particular species, surgical preparation and imaging geometry. Thus, the regression equation derived here cannot be widely generalised. Nevertheless, the results show that if a laboratory adopting the speckle method undertakes calibration against CBFumb, ideally at the beginning and end of each experiment, the value of the speckle data obtained will be greatly enhanced.
Sensitivity of Laser Speckle Imaging for Detection of Depolarisation Events: Comparison with Monitoring of Direct Current Potential
Detection of a transient negativity of some 15 mV in the cortical surface DC potential is widely regarded as the reference method for detection of a propagating depolarisation event—CSD or PID. Here, transient changes in ICT value that propagated across or along gyri with velocities in the range appropriate for CSD or PIDs (∼2 to 4 mm/min) were readily detected from major changes in ICT during an experiment, but most readily from later visual review of an entire experiment in ‘fast-forward’ mode (time compression of ∼100:1). The detection rate with ICT as a percentage of total events was relatively poor (56%). There is at least an a priori possibility of unchanged perfusion in response to a depolarisation, if opposing factors determining the response are evenly balanced. Also, the data in the current study were obtained at intervals of approximately 13 secs, which resulted in a noise level of approximately 8%. This noise level can be significantly reduced through faster image acquisition and increased averaging of speckle contrast images. Thus, for studies in which a measure of PID frequency is needed, sufficient frequency of sampling and averaging of speckle contrast images may be necessary to detect all of the PIDs. However, Table 1 also indicates events seen with laser speckle imaging that did not propagate to the site of the DC electrode. Thus, an ideal arrangement is to use both methods when comprehensive detection of PIDs is needed.
Although we consistently observed delays between the onset of transient negativity at a DC electrode and a change in ICT in the adjacent cortex, only limited weight should be assigned to the approximate delay of 30 to 90 secs that we observed. Our use of surface silver ball electrodes (to avoid induction of spurious depolarisation events by pial perforation with a microelectrode) introduces errors in registration of timing of the DC transient. The data are reported only to provide qualitative support for the important findings of Dreier et al (2000), who cited the delay they observed as evidence that the vascular event is secondary to the depolarisation rather than the cause of it.
Conclusions
We conclude that generation of laser speckle contrast images of the exposed brain yields images that provide quantitative information on perfusion; this can be applied in studies of dynamic changes in perfusion in ischaemic boundary zones and, for example, gives a valuable indication of the potential impact of a given decrease in perfusion on cortical function and viability.
Footnotes
References
Supplementary Material
Please find the following supplemental material available below.
For Open Access articles published under a Creative Commons License, all supplemental material carries the same license as the article it is associated with.
For non-Open Access articles published, all supplemental material carries a non-exclusive license, and permission requests for re-use of supplemental material or any part of supplemental material shall be sent directly to the copyright owner as specified in the copyright notice associated with the article.